Embed Size (px)
Citation preview

Assessing Elderly Welfare and Pension Performance with Survey Data
March 10, 2014 Pensions Core Course This presentation builds on the work of colleagues in HDN and PREM

Session objectives
• Objective: learn how survey data can be used to improve evidence-based pension policy
– Why: Surveys provide different and often more rich data compared to administrative data
• Secondary objective: Solve elderly poverty and income smoothing in your country (today)!
2

Outline
• (1) Overview of survey data & social protection concepts • Why use survey data for pensions
– Application to elderly and pensions – Pensions framework applied to survey data – Understanding survey data strengths and weaknesses
• (2) Application: Survey data for elderly welfare and pensions analysis – Environment - Living arrangements, Poverty – Performance - Coverage, Adequacy, Poverty impact, Program
overlap
• (3) Ongoing Country Collaboration
3

(1) SP Context & Concepts Applied to Household Surveys

SPL over the life cycle
5
(1) Concepts

Classification of programs
6
• Social assistance (Social Safety Nets) SA
• Labor Market Programs (active and passive) LM
• Social Insurance SI
(1) Concepts

Types of Social Protection Programs Category I Category II Type of program
Old age pension
Old age civil servant pension
Veteran's old age pension
Early retirement pension
Survivors pension
Survivors civil servant pension
Occupational injury benefits/ pension
Paid sick leave
Disability Disability pension
Unemployment compensation
Severance pay
Early retirement for labor market reasons
Labor market training
Youth measures
Subsided employment
Employment measures for disabled
Employment service and administration
Low income/ Last-resort program
Non-contributory/ Social pension
Family allowances*
Disability benefits
Housing allowances
Food stamps/ Vouchers
Conditional cash transfers Conditional cash transfers
Food rations
Supplementary feeding
School feeding
Energency food distribution
Fee waivers, education
Scholarships
Fee waivers, health
Food price subsidies
Public distribution systems
Energy and utility subsidiesPublic works Public works
In-kind food transfers
Fee waivers and scholarships
General subsidies
Social safety net programs
Labor market programs Unemployment
Active labor market programs
Cash or near-cash transfers
Pensions and other social
insurance
Old age
Survivors
Occupational injury/sickness
benefits
7
(1) Concepts

Pension Assessment – i) Data, ii) Indicators and iii) Tools
Information/ Data
Elderly
incomes,
vulnerability &
poverty
Initial conditions
Mandatory &
voluntary
pension
systems &
social security
schemes
Tools
Country HH survey data ADEPT-SP x/country data
Environment – UN Population Projections Country admin data Financial market data Macro & fiscal data (country/IMF) System design – Admin data/country laws WB database comparators Performance – Admin data/country laws WB database comparators HH survey data
Administrative data from social welfare schemes, housing, health provision.
HH survey data.
Additional
state support
Indicators
Environment Demographic Economic Financial Informal Support ADEPT-SP
Apex PROST ASPIRE & ext.
x-country data
Design Structure of pension system Qualifying conditions Parameters
Performance Coverage Adequacy Financial sustainability
(1) Concepts

What is survey data?
• Examples: HBS, LSMS, DHS, Census
• Organization: Household or individual level
• Timing: Generally collected ever 2-3 years, more frequent than census (~ 10 years)
• Information: Core demographics (eg age and gender), expenditure/ income, employment status, public and private transfers, etc
9
(1) Concepts (i) Data

Example household survey
10
(1) Concepts (i) Data

11
(1) Concepts (i) Data
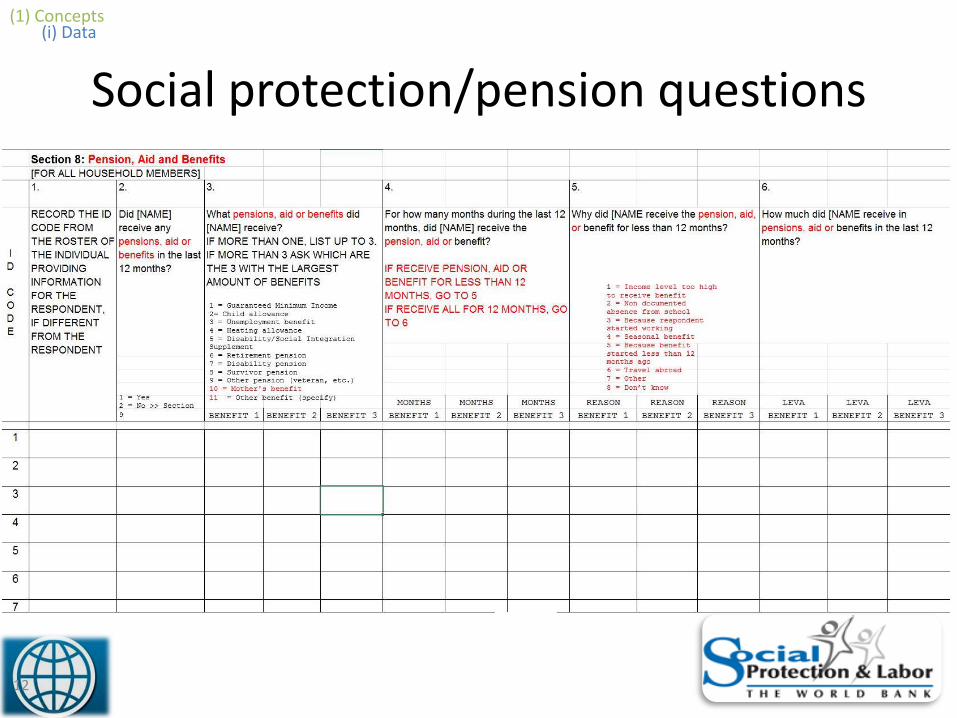
Social protection/pension questions
12
(1) Concepts (i) Data

Individual Input File
13
Household
Identification
Individual
IdentificationSTRATA PSU
Urban location =1;
Rural location=2
Household
expansion
factor
Household
Size
Adult
equivalent
scale
Head of the
household
Age of the
household
member
Total
household
income
Poverty
line
Amount
received
from old
age
pensions
Participation in
scholarship
programs
Amount received
by the household
from
Oportunidades
Amount
received by the
household from
Pro-Campo
id_hh id_ind strata psu urban hhweight hhsize adul_eq head age hh_income pob_ing apos becas_ toport tprocam
20060150282 1 1 2 2 305 3 2 1 18 2459.34 938.61 0 180.49
20060150282 2 1 2 2 305 3 2 0 18 2459.34 938.61 0 180.49
20060150282 3 1 2 2 305 3 2 0 1 2459.34 938.61 0 180.49
20060150280 1 1 2 2 305 7 6 1 56 9094.69 938.61 0 334.24
20060150280 2 1 2 2 305 7 6 0 53 9094.69 938.61 0 334.24
20060150280 3 1 2 2 305 7 6 0 29 9094.69 938.61 0 334.24
20060150280 4 1 2 2 305 7 6 0 26 9094.69 938.61 0 334.24
20060150280 5 1 2 2 305 7 6 0 15 9094.69 938.61 0 334.24
20060150280 6 1 2 2 305 7 6 0 13 9094.69 938.61 0 334.24
20060150280 7 1 2 2 305 7 6 0 7 9094.69 938.61 1 334.24
20060150030 1 1 1 1 777 4 3 1 77 18183.37 938.61 1403.81 0
20060150030 2 1 1 1 777 4 3 0 51 18183.37 938.61 0
20060150030 3 1 1 1 777 4 3 0 43 18183.37 938.61 0
20060150030 4 1 1 1 777 4 3 0 9 18183.37 938.61 0
20060150040 1 1 1 1 777 1 1 1 92 4458.78 938.61 1604.35 0
20060150050 1 1 1 1 777 2 2 1 83 6397.05 938.61 1640.45 0
20060150050 2 1 1 1 777 2 2 0 39 6397.05 938.61 0
20060150060 1 1 1 1 859 5 2 1 41 12988.27 938.61 0
20060150060 2 1 1 1 859 5 2 0 32 12988.27 938.61 0
20060150060 3 1 1 1 859 5 2 0 11 12988.27 938.61 0
20060140410 1 1 7 1 638 10 6 1 56 10730.62 938.61 0 514.18
20060140410 2 1 7 1 638 10 6 0 58 10730.62 938.61 0 514.18
20060140410 3 1 7 1 638 10 6 0 86 10730.62 938.61 1411.48 0 514.18
20060140410 4 1 7 1 638 10 6 0 30 10730.62 938.61 0 514.18
20060140410 5 1 7 1 638 10 6 0 29 10730.62 938.61 0 514.18
20060140410 6 1 7 1 638 10 6 0 10 10730.62 938.61 0 514.18
20060140410 7 1 7 1 638 10 6 0 9 10730.62 938.61 0 514.18
20060140410 8 1 7 1 638 10 6 0 4 10730.62 938.61 0 514.18
(1) Concepts (i) Data

Household Input File
14
Household
Identification
Individual
IdentificationSTRATA PSU
Urban location
=1; Rural
location=2
Household
expansion
factor
Household
Size
Adult
equivalent
scale
Head of the
household
Age of the
household
member
Total
household
income
Poverty
line
Amount
received
from old
age
pensions
Participation in
scholarship
programs
Amount received
by the household
from
Oportunidades
Amount
received by the
household from
Pro-Campo
id_hh id_ind strata psu urban hhweight hhsize adul_eq head age hh_income pob_ing apos becas_ toport tprocam
20060150282 1 1 2 2 305 3 2 1 18 2459.34 938.61 0 180.49
20060150280 1 1 2 2 305 7 6 1 56 9094.69 938.61 1 334.24
20060150030 1 1 1 1 777 4 3 1 77 18183.37 938.61 1403.81 0
20060150040 1 1 1 1 777 1 1 1 92 4458.78 938.61 1604.35 0
20060150050 1 1 1 1 777 2 2 1 83 6397.05 938.61 1640.45 0
20060150060 1 1 1 1 859 5 2 1 41 12988.27 938.61 0
20060140410 1 1 7 1 638 10 6 1 56 10730.62 938.61 1411.48 0 514.18
(1) Concepts (i) Data

Administrative vs Household Data
Administrative data
• - Limited population coverage - only ‘covered’ included
• + Comprehensive data on contributors, beneficiaries
• + Cumulative (over life cycle)
• - Narrow variables (eg age, gender, contribution)
Household data • + Entire population
represented
• -/+ Generally lack data on contributors, though extensive info on recipients (and non-recipients)
• - Static (singe year, usually not
panel, though can use 2+) • + Much more comprehensive
(demographic, poverty, public & private transfers)
15
(1) Concepts (i) Data

Household data – all schemes
Age
Gender
Contributions
Withdrawals
Occupation
Rural/ Urban
Widower
Disabled
Total Income
Other public transfers
Etc
Administrative data scheme 1
Age
Gender
Contributions
Withdrawals
Administrative data scheme 2
Age
Gender
Contributions
Withdrawals
Administrative data scheme 2
Age
Gender
Contributions
Withdrawals
Administrative data scheme 3
Age
Gender
Contributions
Withdrawals
Comparison of Household and Administrative Data
(1) Concepts (i) Data

Why use survey data for elderly poverty and pension assessment?
• Environment – 1) Understand who is rich and poor by key characteristics ( eg gender, pension receipt), 2) living arrangements, 3) employment status
• Design – N/A • Performance – coverage, poverty impact,
adequacy, targeting, etc • Cross-tabulate by key characteristics, eg geography, gender,
age, income
• More breadth of information on individuals and households
17
(i) Data (1) Concepts

How poverty is commonly measured
• Individuals or households are ranked by income or consumption
• The measure of income or consumption is referred to as the ‘welfare aggregate’
• Poverty lines are then set either on a relative or absolute basis, often based on an extreme and basic standard of living
• Those with income or consumption (welfare aggregate) below a given poverty line are considered poor
18 Based on DEC presentation
(ii) Indicators (1) Concepts

Poverty measures • Poverty headcount (FGT0) - % of individuals or households with welfare
below the poverty line
• Poverty gap (FGT1) - mean shortfall of poor from the poverty line, expressed as a percentage of the poverty line
• Poverty severity (FGT2) – average of squared poverty gap ratio
19
Distance squared
% Below line Avg distance below line
(ii) Indicators (1) Concepts
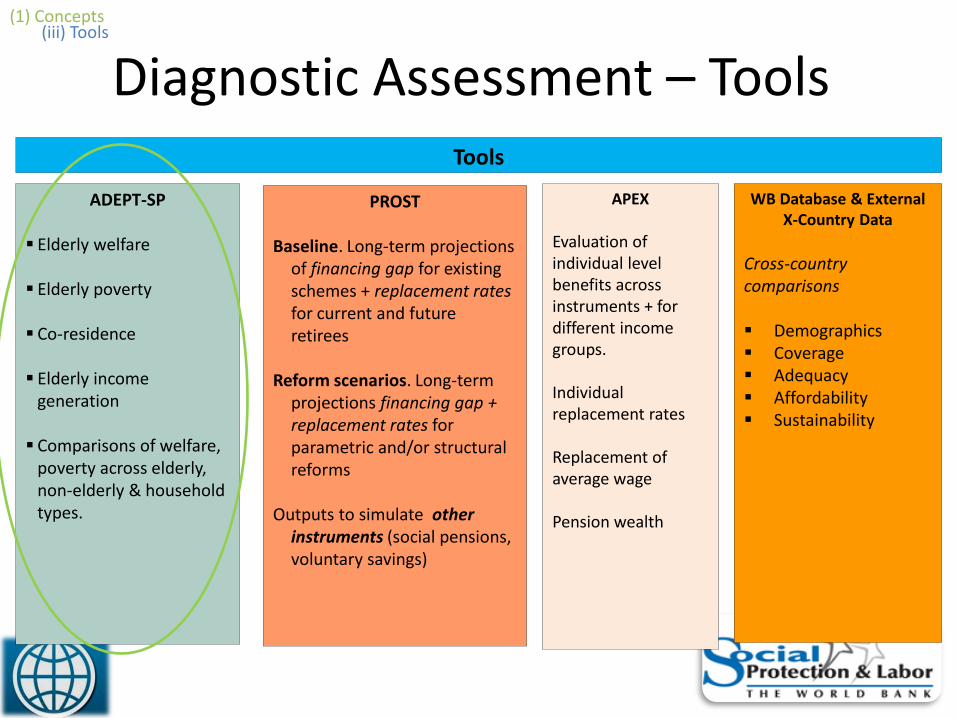
Diagnostic Assessment – Tools
Tools
APEX Evaluation of individual level benefits across instruments + for different income groups. Individual replacement rates Replacement of average wage Pension wealth
ADEPT-SP Elderly welfare Elderly poverty
Co-residence Elderly income
generation
Comparisons of welfare, poverty across elderly, non-elderly & household types.
PROST Baseline. Long-term projections
of financing gap for existing schemes + replacement rates for current and future retirees
Reform scenarios. Long-term
projections financing gap + replacement rates for parametric and/or structural reforms
Outputs to simulate other
instruments (social pensions, voluntary savings)
WB Database & External X-Country Data
Cross-country comparisons Demographics Coverage Adequacy Affordability Sustainability
(1) Concepts (iii) Tools

(2) Surveys specifically for Elderly Welfare and Pension Analysis

Why use survey data for elderly poverty and pensions?
• Ability to answer new and different policy questions – (i) Environment – poverty, distribution of
income/consumption, living arrangements, key demographics
– Design – N/A – (ii) Performance – coverage (receipt), poverty impact,
adequacy, targeting, etc • Cross-tabulate by key characteristics, eg geography, gender,
age, income
• More breadth of information on individuals and households
22
(2) Applications: Surveys for Elderly Welfare & Pensions

Some practical uses of survey data
• Understand characteristics of elderly and non-elderly population (e.g demographics, living arrangements and welfare)
• Produce evidence- based findings on pension and other programs, such as coverage, adequacy, poverty impact, etc
• Provide snapshot of income by sources (public, private) for different age groups
23
(2) Applications: Surveys for Elderly Welfare & Pensions

Pensions Survey Work
• East Asia and the Pacific (EAP) – 7 countries, Eastern Europe and Central Asia (ECA)– 20 countries, Latin America and Caribbean (LAC) – 20 countries, Middle East and Northern Africa (MNA) – 5 countries, South Asia (SAR) – 7 countries. The surveys vary in size from approximately 15,000 in Albania to 600,000 individuals in India.
24
(2) Applications: Surveys for Elderly Welfare & Pensions

Living Arrangements
• What – the structure of households by age, gender, size
• Main indicator – Co-residence rate (elderly living with non-elderly)
• Why – proxy for informal support by non-elderly, ‘voluntary pillar’ of family support can complement formal pension systems
25
(2) Applications: Surveys for Elderly Welfare & Pensions (i) Environment

Co-residence
• Correlates of co-residence in existing studies - lower welfare, living in urban areas, widowers, higher country level GDP per capita)
• Initial findings
– Co-residence more likely for: urban, not receiving a pension, not receiving remittances, lower welfare deciles, lower income countries
– Wide variation between, and within some regions (eg ECA)
26
(2) Applications: Surveys for Elderly Welfare & Pensions (i) Environment

Co-residence rate, by region
27
0.00% 10.00% 20.00% 30.00% 40.00% 50.00% 60.00% 70.00% 80.00% 90.00% 100.00%
AFR-MUS
AFR-NGA
AFR-RWA
EAP-MNG
EAP-VNM
EAP-TMP
EAP-LAO
ECA-HUN
ECA-BLR
ECA-HRV
ECA-POL
ECA-BGR
ECA-MNE
ECA-KRZ
ECA-GEO
ECA-ARM
ECA-TJK
LAC-URY
LAC-BRA
LAC-CRI
LAC-PAN
LAC-MEX
LAC-PER
LAC-COL
LAC-SLV
LAC-HND
LAC-NIC
MNA-WBG
MNA-MAR
MNA-DJI
SAR-IND
SAR-NPL
SAR-MDV
SAR-AFG
Average
(2) Applications: Surveys for Elderly Welfare & Pensions (i) Environment

GNI per capita and co-residence rate
28
R² = 0.509
-
2,000.00
4,000.00
6,000.00
8,000.00
10,000.00
12,000.00
14,000.00
16,000.00
18,000.00
0.4 0.5 0.6 0.7 0.8 0.9 1
(2) Applications: Surveys for Elderly Welfare & Pensions (i) Environment

0.0% 10.0% 20.0% 30.0% 40.0% 50.0% 60.0% 70.0% 80.0% 90.0% 100.0%
Total
Urban
Rural
Male
Female
60-74
75+
Bottom Quintile
Top Quintile
Pension Receipt
No Pension Receipt
Remittance Receipt
No Remittance Receipt
Employed
Not Employed
Coresidence rate by key characteristics- country level
29
(2) Applications: Surveys for Elderly Welfare & Pensions (i) Environment

Poverty of elderly
• Are elderly household more poor then non-elderly households?
• Are elderly individuals more poor then non-elderly?
• Preliminary findings (point estimates robust, though less for s.e.)
– By household type ( any elderly, only elderly, some elderly, no elderly)
– By individual – youth, working age, elderly
30
(2) Applications: Surveys for Elderly Welfare & Pensions (i) Environment

Welfare distribution by age group – individual level
31
0.2
.4.6
.8
Den
sity
8 10 12 14Log of percapita welfare
Youth Working Age
Elderly
Poverty line
(2) Applications: Surveys for Elderly Welfare & Pensions (i) Environment

Poverty rate by age and gender
32
(2) Applications: Surveys for Elderly Welfare & Pensions (i) Environment

Poverty Headcount by Household Type
33
0%
5%
10%
15%
20%
25%
30%
Average 1)Elderly:
lone
2)Elderly:
2+
5) Elderlywith
WorkingAge
7) Elderlywith
WorkingAge and
Youth
6) Elderlywith
Youth
3)Workingage only
8)Working
ageand/orYouth
HH OnlyElderly
HH SomeElderly
HH NoElderly
(2) Applications: Surveys for Elderly Welfare & Pensions (i) Environment

Coverage Area of residence Region Ethnicity
Total Urban Rural Sofia city Sofia
region Haskovo Bulgaria Turks Roma
Direct and indirect beneficiaries All social protection 70.5 66.1 80.3 55.6 66.2 71.1 69.0 75.6 81.2
All social insurance 54.5 52.3 65.3 47.5 55.9 49.0 56.7 54.2 38.5
Old age pension 46.5 44.0 58.4 40.9 50.4 42.9 50.3 43.0 21.1
Disability pension/allowance
16.2 16.3 17.0 15.7 13.8 12.2 15.5 18.7 20.9
Survivorship pension 8.5 7.9 10.9 5.9 8.1 4.3 8.9 9.3 5.6
All labor market programs 2.2 2.0 2.8 0.9 1.0 3.6 2.4 3.4 0.0
Unemployment benefit 2.2 2.0 2.8 0.9 1.0 3.6 2.4 3.4 0.0
All social assistance 27.5 23.1 30.4 12.4 20.8 37.0 20.9 41.8 68.5
Social assistance 0.7 0.7 0.9 0.3 0.9 0.3 0.6 0.6 1.9
Child allowance, up to 2 yo 5.9 4.5 4.7 3.5 6.0 7.7 4.0 10.1 18.1
Other family allowances 0.8 0.7 0.6 0.6 0.0 0.0 0.8 0.8 1.2
Monthly child allowance 20.7 17.2 21.8 7.0 13.8 31.5 15.4 33.8 50.4
Heating allowance 4.2 2.6 7.3 1.5 3.1 3.0 1.8 7.7 21.8
Guaranteed minimum income
3.8 2.6 5.1 0.9 3.9 3.2 0.6 4.5 32.8
Other sa benefits 1.8 1.7 2.2 0.5 2.3 1.5 1.7 3.0 1.3
All remittances 4.3 4.0 4.5 2.5 2.5 7.5 3.5 8.4 7.4
Remittances 4.3 4.0 4.5 2.5 2.5 7.5 3.5 8.4 7.4
34
(2) Applications: Surveys for Elderly Welfare & Pensions (ii) Performance

Adequacy Poverty Status
Total XP MP NP
All social protection 29.5 69.7 67.6 27.4
All social insurance 33.8 71.9 72.5 31.7
Old age pension 34.0 71.4 72.0 32.0
Disability pension/allowance 12.9 33.9 26.2 12.0
Survivorship pension 5.9 14.2 14.6 5.4
All labor market programs 8.2 84.5 29.9 7.7
Unemployment benefit 8.2 84.5 29.9 7.7
All social assistance 7.8 33.0 21.0 6.5
Social assistance 14.0 15.8 21.2 12.6
Child allowance, up to 2 yo 13.6 30.9 29.0 12.5
Other family allowances 11.7 5.0 57.5 11.4
Monthly child allowance 3.0 12.2 8.2 2.6
Heating allowance 5.5 8.2 8.3 4.1
Guaranteed minimum income 14.5 27.9 20.5 9.8
Other sa benefits 6.2 45.4 5.4 6.1
All remittances 51.5 58.8 45.6 51.6
Remittances 51.5 58.8 45.6 51.6
35
(2) Applications: Surveys for Elderly Welfare & Pensions (ii) Performance

Simulated poverty impact (% poor)
36
With pensions income No pension income Individual level
Population 0.5077 0.5878
Youth (0-14) 0.6196 0.6651
Working Age (15-60) 0.4718 0.5248
Elderly (60+) 0.3502 0.7611
Elderly (60-74) 0.3562 0.7380
Elderly (75+) 0.3331 0.8279
Non-Elderly (0-59) 0.5218 0.5723 Household level
Elderly-only households 0.0410 0.8512
Some elderly households 0.4817 0.7283
Non-Elderly Households 0.4325 0.4550
Total 0.4197 0.5321
(2) Applications: Surveys for Elderly Welfare & Pensions (ii) Performance

(3) Ongoing Work

Pipeline work
• Using survey data for 70+ countries for country pension work
• Regional and cross-regional comparison
– Poverty by age – are the elderly really the most poor?
– Living arrangements/ informal support
– Coverage
– Adequacy
– Income sources over life cycle
– More to come…
38
(3) Ongoing country collaboration (i) Research

ADePT Training
• Regional and country workshops on survey analysis
• Topics include pensions, social safety nets, labor market, and poverty analysis
• There will be a hands-on computer training later today for those interested.
39
(3) Ongoing country collaboration (ii) Training

Thank you!
40
• If your country is interested in survey training on Pensions, Social Safety Nets, Poverty, and/or Labor (1/2 day to 3 day courses): – Please contact Mr. Ruslan Yemtsov, [email protected]
Mr. Robert Palacions [email protected] or Mr. Brooks Evans [email protected]