Embed Size (px)
Citation preview

Package ‘survey’August 29, 2013
Title analysis of complex survey samples
Description Summary statistics, two-sample tests, generalised linearmodels, cumulative link models, Cox models, loglinear models,and general maximum pseudo-likelihood estimation for multistagestratified, cluster-sampled, unequally weighted survey samples.Variances by Taylor series linearisation or replicate weights.Post-stratification, calibration, and raking. Two-phasesubsampling designs. Graphics. Predictive margins by directstandardization. PPS sampling without replacement. Principal components, factor analysis.
Version 3.29-5
Author Thomas Lumley
Maintainer Thomas Lumley <[email protected]>
License GPL-2 | GPL-3
Depends R (>= 2.10.0)
Suggests foreign, survival, MASS, splines, KernSmooth, hexbin,mitools, lat-tice, RSQLite, RODBC, quantreg, Matrix, parallel,CompQuadForm
Enhances odfWeave.survey
URL http://faculty.washington.edu/tlumley/survey/
NeedsCompilation no
Repository CRAN
Date/Publication 2013-06-12 17:40:08
R topics documented:anova.svyglm . . . . . . . . . . . . . . . . . . . . . . . . . . . . . . . . . . . . . . . . 3api . . . . . . . . . . . . . . . . . . . . . . . . . . . . . . . . . . . . . . . . . . . . . . 4as.fpc . . . . . . . . . . . . . . . . . . . . . . . . . . . . . . . . . . . . . . . . . . . . 7
1

2 R topics documented:
as.svrepdesign . . . . . . . . . . . . . . . . . . . . . . . . . . . . . . . . . . . . . . . . 8as.svydesign2 . . . . . . . . . . . . . . . . . . . . . . . . . . . . . . . . . . . . . . . . 10barplot.svystat . . . . . . . . . . . . . . . . . . . . . . . . . . . . . . . . . . . . . . . . 11bootweights . . . . . . . . . . . . . . . . . . . . . . . . . . . . . . . . . . . . . . . . . 12brrweights . . . . . . . . . . . . . . . . . . . . . . . . . . . . . . . . . . . . . . . . . . 13calibrate . . . . . . . . . . . . . . . . . . . . . . . . . . . . . . . . . . . . . . . . . . . 16compressWeights . . . . . . . . . . . . . . . . . . . . . . . . . . . . . . . . . . . . . . 21confint.svyglm . . . . . . . . . . . . . . . . . . . . . . . . . . . . . . . . . . . . . . . 22crowd . . . . . . . . . . . . . . . . . . . . . . . . . . . . . . . . . . . . . . . . . . . . 23dimnames.DBIsvydesign . . . . . . . . . . . . . . . . . . . . . . . . . . . . . . . . . . 24election . . . . . . . . . . . . . . . . . . . . . . . . . . . . . . . . . . . . . . . . . . . 25estweights . . . . . . . . . . . . . . . . . . . . . . . . . . . . . . . . . . . . . . . . . . 26fpc . . . . . . . . . . . . . . . . . . . . . . . . . . . . . . . . . . . . . . . . . . . . . . 28ftable.svystat . . . . . . . . . . . . . . . . . . . . . . . . . . . . . . . . . . . . . . . . 29hadamard . . . . . . . . . . . . . . . . . . . . . . . . . . . . . . . . . . . . . . . . . . 31hospital . . . . . . . . . . . . . . . . . . . . . . . . . . . . . . . . . . . . . . . . . . . 32HR . . . . . . . . . . . . . . . . . . . . . . . . . . . . . . . . . . . . . . . . . . . . . . 33make.calfun . . . . . . . . . . . . . . . . . . . . . . . . . . . . . . . . . . . . . . . . . 34marginpred . . . . . . . . . . . . . . . . . . . . . . . . . . . . . . . . . . . . . . . . . 35mu284 . . . . . . . . . . . . . . . . . . . . . . . . . . . . . . . . . . . . . . . . . . . . 36nhanes . . . . . . . . . . . . . . . . . . . . . . . . . . . . . . . . . . . . . . . . . . . . 37nonresponse . . . . . . . . . . . . . . . . . . . . . . . . . . . . . . . . . . . . . . . . . 38open.DBIsvydesign . . . . . . . . . . . . . . . . . . . . . . . . . . . . . . . . . . . . . 40paley . . . . . . . . . . . . . . . . . . . . . . . . . . . . . . . . . . . . . . . . . . . . . 41pchisqsum . . . . . . . . . . . . . . . . . . . . . . . . . . . . . . . . . . . . . . . . . . 42postStratify . . . . . . . . . . . . . . . . . . . . . . . . . . . . . . . . . . . . . . . . . 44rake . . . . . . . . . . . . . . . . . . . . . . . . . . . . . . . . . . . . . . . . . . . . . 46regTermTest . . . . . . . . . . . . . . . . . . . . . . . . . . . . . . . . . . . . . . . . . 48scd . . . . . . . . . . . . . . . . . . . . . . . . . . . . . . . . . . . . . . . . . . . . . . 49SE . . . . . . . . . . . . . . . . . . . . . . . . . . . . . . . . . . . . . . . . . . . . . . 51stratsample . . . . . . . . . . . . . . . . . . . . . . . . . . . . . . . . . . . . . . . . . 51subset.survey.design . . . . . . . . . . . . . . . . . . . . . . . . . . . . . . . . . . . . . 52surveyoptions . . . . . . . . . . . . . . . . . . . . . . . . . . . . . . . . . . . . . . . . 53surveysummary . . . . . . . . . . . . . . . . . . . . . . . . . . . . . . . . . . . . . . . 54svrepdesign . . . . . . . . . . . . . . . . . . . . . . . . . . . . . . . . . . . . . . . . . 58svrVar . . . . . . . . . . . . . . . . . . . . . . . . . . . . . . . . . . . . . . . . . . . . 61svy.varcoef . . . . . . . . . . . . . . . . . . . . . . . . . . . . . . . . . . . . . . . . . 62svyby . . . . . . . . . . . . . . . . . . . . . . . . . . . . . . . . . . . . . . . . . . . . 62svycdf . . . . . . . . . . . . . . . . . . . . . . . . . . . . . . . . . . . . . . . . . . . . 65svyciprop . . . . . . . . . . . . . . . . . . . . . . . . . . . . . . . . . . . . . . . . . . 66svycontrast . . . . . . . . . . . . . . . . . . . . . . . . . . . . . . . . . . . . . . . . . 68svycoplot . . . . . . . . . . . . . . . . . . . . . . . . . . . . . . . . . . . . . . . . . . 69svycoxph . . . . . . . . . . . . . . . . . . . . . . . . . . . . . . . . . . . . . . . . . . 71svyCprod . . . . . . . . . . . . . . . . . . . . . . . . . . . . . . . . . . . . . . . . . . 73svydesign . . . . . . . . . . . . . . . . . . . . . . . . . . . . . . . . . . . . . . . . . . 75svyfactanal . . . . . . . . . . . . . . . . . . . . . . . . . . . . . . . . . . . . . . . . . 78svyglm . . . . . . . . . . . . . . . . . . . . . . . . . . . . . . . . . . . . . . . . . . . . 79svyhist . . . . . . . . . . . . . . . . . . . . . . . . . . . . . . . . . . . . . . . . . . . . 82

anova.svyglm 3
svykappa . . . . . . . . . . . . . . . . . . . . . . . . . . . . . . . . . . . . . . . . . . 83svykm . . . . . . . . . . . . . . . . . . . . . . . . . . . . . . . . . . . . . . . . . . . . 84svyloglin . . . . . . . . . . . . . . . . . . . . . . . . . . . . . . . . . . . . . . . . . . 86svylogrank . . . . . . . . . . . . . . . . . . . . . . . . . . . . . . . . . . . . . . . . . . 88svymle . . . . . . . . . . . . . . . . . . . . . . . . . . . . . . . . . . . . . . . . . . . . 89svyolr . . . . . . . . . . . . . . . . . . . . . . . . . . . . . . . . . . . . . . . . . . . . 92svyplot . . . . . . . . . . . . . . . . . . . . . . . . . . . . . . . . . . . . . . . . . . . . 93svyprcomp . . . . . . . . . . . . . . . . . . . . . . . . . . . . . . . . . . . . . . . . . . 95svyquantile . . . . . . . . . . . . . . . . . . . . . . . . . . . . . . . . . . . . . . . . . 96svyranktest . . . . . . . . . . . . . . . . . . . . . . . . . . . . . . . . . . . . . . . . . 99svyratio . . . . . . . . . . . . . . . . . . . . . . . . . . . . . . . . . . . . . . . . . . . 100svyrecvar . . . . . . . . . . . . . . . . . . . . . . . . . . . . . . . . . . . . . . . . . . 103svysmooth . . . . . . . . . . . . . . . . . . . . . . . . . . . . . . . . . . . . . . . . . . 105svystandardize . . . . . . . . . . . . . . . . . . . . . . . . . . . . . . . . . . . . . . . . 107svytable . . . . . . . . . . . . . . . . . . . . . . . . . . . . . . . . . . . . . . . . . . . 108svyttest . . . . . . . . . . . . . . . . . . . . . . . . . . . . . . . . . . . . . . . . . . . 111trimWeights . . . . . . . . . . . . . . . . . . . . . . . . . . . . . . . . . . . . . . . . . 112twophase . . . . . . . . . . . . . . . . . . . . . . . . . . . . . . . . . . . . . . . . . . 113update.survey.design . . . . . . . . . . . . . . . . . . . . . . . . . . . . . . . . . . . . 116weights.survey.design . . . . . . . . . . . . . . . . . . . . . . . . . . . . . . . . . . . . 117with.svyimputationList . . . . . . . . . . . . . . . . . . . . . . . . . . . . . . . . . . . 118withReplicates . . . . . . . . . . . . . . . . . . . . . . . . . . . . . . . . . . . . . . . . 119
Index 122
anova.svyglm Model comparison for glms.
Description
A method for the anova function, for use on svyglm objects. With a single model argument itproduces a sequential anova table, with two arguments it compares the two models.
Usage
## S3 method for class ’svyglm’anova(object, object2 = NULL, test = c("F", "Chisq"), method = c("LRT", "Wald"), tolerance = 1e-05, ..., force = FALSE)
Arguments
object A svyglm object.
object2 Optionally, another svyglm object.
test Use (linear combination of) F or chi-squared distributions for p-values. F isusually preferable.
method Use weighted deviance difference (LRT) or Wald tests to compare models
tolerance For models that are not symbolically nested, the tolerance for deciding that aterm is common to the models.

4 api
... For future expansionforce Force the tests to be done by explicit projection even if the models are symboli-
cally nested (for debugging)
Details
The reference distribution for the LRT depends on the misspecification effects for the parameters be-ing tested (Rao and Scott, 1984). If the models are symbolically nested, so that the relevant parame-ters can be identified just by manipulating the model formulas, anova is equivalent to regTermTest.If the models are nested but not symbolically nested, more computation using the design matricesis needed to determine the projection matrix on to the parameters being tested. Typical examplesof models that are nested but not symbolically nested are linear and spline models for a continuouscovariate or linear and saturated models for a factor.
The saddlepoint approximation is used for the LRT with numerator df greater than 1.
Value
Object of class seqanova.svyglm if one model is given, otherwise of class regTermTest or regTermTestLRT
References
Rao, JNK, Scott, AJ (1984) "On Chi-squared Tests For Multiway Contingency Tables with Propor-tions Estimated From Survey Data" Annals of Statistics 12:46-60.
See Also
regTermTest, pchisqsum
Examples
data(api)dclus2<-svydesign(id=~dnum+snum, weights=~pw, data=apiclus2)
model1<-svyglm(I(sch.wide=="Yes")~ell+meals+mobility+as.numeric(stype), design=dclus2, family=quasibinomial())model2<-svyglm(I(sch.wide=="Yes")~ell+meals+mobility+stype, design=dclus2, family=quasibinomial())
anova(model2)anova(model1, model2)
anova(model1, model2, method="Wald")
api Student performance in California schools
Description
The Academic Performance Index is computed for all California schools based on standardisedtesting of students. The data sets contain information for all schools with at least 100 students andfor various probability samples of the data.

api 5
Usage
data(api)
Format
The full population data in apipop are a data frame with 6194 observations on the following 37variables.
cds Unique identifier
stype Elementary/Middle/High School
name School name (15 characters)
sname School name (40 characters)
snum School number
dname District name
dnum District number
cname County name
cnum County number
flag reason for missing data
pcttest percentage of students tested
api00 API in 2000
api99 API in 1999
target target for change in API
growth Change in API
sch.wide Met school-wide growth target?
comp.imp Met Comparable Improvement target
both Met both targets
awards Eligible for awards program
meals Percentage of students eligible for subsidized meals
ell ‘English Language Learners’ (percent)
yr.rnd Year-round school
mobility percentage of students for whom this is the first year at the school
acs.k3 average class size years K-3
acs.46 average class size years 4-6
acs.core Number of core academic courses
pct.resp percent where parental education level is known
not.hsg percent parents not high-school graduates
hsg percent parents who are high-school graduates
some.col percent parents with some college
col.grad percent parents with college degree
6 api
grad.sch percent parents with postgraduate education
avg.ed average parental education level
full percent fully qualified teachers
emer percent teachers with emergency qualifications
enroll number of students enrolled
api.stu number of students tested.
The other data sets contain additional variables pw for sampling weights and fpc to compute finitepopulation corrections to variance.
Details
apipop is the entire population, apisrs is a simple random sample, apiclus1 is a cluster sampleof school districts, apistrat is a sample stratified by stype, and apiclus2 is a two-stage clustersample of schools within districts. The sampling weights in apiclus1 are incorrect (the weightshould be 757/15) but are as obtained from UCLA.
Source
Data were obtained from the survey sampling help pages of UCLA Academic Technology Services,at http://www.ats.ucla.edu/stat/stata/Library/svy_survey.htm.
References
The API program and original data files are at http://api.cde.ca.gov/
Examples
library(survey)data(api)mean(apipop$api00)sum(apipop$enroll, na.rm=TRUE)
#stratified sampledstrat<-svydesign(id=~1,strata=~stype, weights=~pw, data=apistrat, fpc=~fpc)summary(dstrat)svymean(~api00, dstrat)svytotal(~enroll, dstrat, na.rm=TRUE)
# one-stage cluster sampledclus1<-svydesign(id=~dnum, weights=~pw, data=apiclus1, fpc=~fpc)summary(dclus1)svymean(~api00, dclus1)svytotal(~enroll, dclus1, na.rm=TRUE)
# two-stage cluster sampledclus2<-svydesign(id=~dnum+snum, fpc=~fpc1+fpc2, data=apiclus2)summary(dclus2)svymean(~api00, dclus2)svytotal(~enroll, dclus2, na.rm=TRUE)

as.fpc 7
# two-stage ‘with replacement’dclus2wr<-svydesign(id=~dnum+snum, weights=~pw, data=apiclus2)summary(dclus2wr)svymean(~api00, dclus2wr)svytotal(~enroll, dclus2wr, na.rm=TRUE)
# convert to replicate weightsrclus1<-as.svrepdesign(dclus1)summary(rclus1)svymean(~api00, rclus1)svytotal(~enroll, rclus1, na.rm=TRUE)
# post-stratify on school typepop.types<-xtabs(~stype, data=apipop)
rclus1p<-postStratify(rclus1, ~stype, pop.types)dclus1p<-postStratify(dclus1, ~stype, pop.types)summary(dclus1p)summary(rclus1p)
svymean(~api00, dclus1p)svytotal(~enroll, dclus1p, na.rm=TRUE)
svymean(~api00, rclus1p)svytotal(~enroll, rclus1p, na.rm=TRUE)
as.fpc Package sample and population size data
Description
This function creates an object to store the number of clusters sampled within each stratum (at eachstage of multistage sampling) and the number of clusters available in the population. It is called bysvydesign, not directly by the user.
Usage
as.fpc(df, strata, ids,pps=FALSE)
Arguments
df A data frame or matrix with population size information
strata A data frame giving strata at each stage
ids A data frame giving cluster ids at each stage
pps if TRUE, fpc information may vary within a stratum and must be specified as aproportion rather than a population sizes

8 as.svrepdesign
Details
The population size information may be specified as the number of clusters in the population or asthe proportion of clusters sampled.
Value
An object of class survey_fpc
See Also
svydesign,svyrecvar
as.svrepdesign Convert a survey design to use replicate weights
Description
Creates a replicate-weights survey design object from a traditional strata/cluster survey design ob-ject. JK1 and JKn are jackknife methods, BRR is Balanced Repeated Replicates and Fay is Fay’smodification of this, bootstrap is Canty and Davison’s bootstrap, subbootstrap is Rao and Wu’s(n− 1) bootstrap, and mrbbootstrap is Preston’s multistage rescaled bootstrap.
Usage
as.svrepdesign(design, type=c("auto", "JK1", "JKn", "BRR", "bootstrap","subbootstrap","mrbbootstrap","Fay"),fay.rho = 0, fpc=NULL,fpctype=NULL,..., compress=TRUE, mse=getOption("survey.replicates.mse"))
Arguments
design Object of class survey.design
type Type of replicate weights. "auto" uses JKn for stratified, JK1 for unstratifieddesigns
fay.rho Tuning parameter for Fay’s variance methodfpc,fpctype,...
Passed to jk1weights, jknweights, brrweights, bootweights, subbootweights,or mrbweights.
compress Use a compressed representation of the replicate weights matrix.
mse if TRUE, compute variances from sums of squares around the point estimate,rather than the mean of the replicates
Value
Object of class svyrep.design.
as.svrepdesign 9
References
Canty AJ, Davison AC. (1999) Resampling-based variance estimation for labour force surveys. TheStatistician 48:379-391
Judkins, D. (1990), "Fay’s Method for Variance Estimation," Journal of Official Statistics, 6, 223-239.
Preston J. (2009) Rescaled bootstrap for stratified multistage sampling. Survey Methodology 35(2)227-234
Rao JNK, Wu CFJ. Bootstrap inference for sample surveys. Proc Section on Survey ResearchMethodology. 1993 (866–871)
See Also
brrweights, svydesign, svrepdesign, bootweights, subbootweights, mrbweights
Examples
data(scd)scddes<-svydesign(data=scd, prob=~1, id=~ambulance, strata=~ESA,nest=TRUE, fpc=rep(5,6))scdnofpc<-svydesign(data=scd, prob=~1, id=~ambulance, strata=~ESA,nest=TRUE)
# convert to BRR replicate weightsscd2brr <- as.svrepdesign(scdnofpc, type="BRR")scd2fay <- as.svrepdesign(scdnofpc, type="Fay",fay.rho=0.3)# convert to JKn weightsscd2jkn <- as.svrepdesign(scdnofpc, type="JKn")
# convert to JKn weights with finite population correctionscd2jknf <- as.svrepdesign(scddes, type="JKn")
## with user-supplied hadamard matrixscd2brr1 <- as.svrepdesign(scdnofpc, type="BRR", hadamard.matrix=paley(11))
svyratio(~alive, ~arrests, design=scd2brr)svyratio(~alive, ~arrests, design=scd2brr1)svyratio(~alive, ~arrests, design=scd2fay)svyratio(~alive, ~arrests, design=scd2jkn)svyratio(~alive, ~arrests, design=scd2jknf)
data(api)## one-stage cluster sampledclus1<-svydesign(id=~dnum, weights=~pw, data=apiclus1, fpc=~fpc)## convert to JK1 jackkniferclus1<-as.svrepdesign(dclus1)## convert to bootstrapbclus1<-as.svrepdesign(dclus1,type="bootstrap", replicates=100)
svymean(~api00, dclus1)svytotal(~enroll, dclus1)

10 as.svydesign2
svymean(~api00, rclus1)svytotal(~enroll, rclus1)
svymean(~api00, bclus1)svytotal(~enroll, bclus1)
dclus2<-svydesign(id = ~dnum + snum, fpc = ~fpc1 + fpc2, data = apiclus2)mrbclus2<-as.svrepdesign(dclus2, type="mrb",replicates=100)svytotal(~api00+stype, dclus2)svytotal(~api00+stype, mrbclus2)
as.svydesign2 Update to the new survey design format
Description
The structure of survey design objects changed in version 2.9, to allow standard errors based onmultistage sampling. as.svydesign converts an object to the new structure and .svycheck warnsif an object does not have the new structure.
You can set options(survey.want.obsolete=TRUE) to suppress the warnings produced by .svycheckand options(survey.ultimate.cluster=TRUE) to always compute variances based on just thefirst stage of sampling.
Usage
as.svydesign2(object).svycheck(object)
Arguments
object produced by svydesign
Value
Object of class survey.design2
See Also
svydesign, svyrecvar

barplot.svystat 11
barplot.svystat Barplots and Dotplots
Description
Draws a barplot or dotplot based on results from a survey analysis. The default barplot methodalready works for results from svytable.
Usage
## S3 method for class ’svystat’barplot(height, ...)## S3 method for class ’svrepstat’barplot(height, ...)## S3 method for class ’svyby’barplot(height,beside=TRUE, ...)
## S3 method for class ’svystat’dotchart(x,...,pch=19)## S3 method for class ’svrepstat’dotchart(x,...,pch=19)## S3 method for class ’svyby’dotchart(x,...,pch=19)
Arguments
height,x Analysis result
beside Grouped, rather than stacked, bars
... Arguments to barplot or dotchart
pch Overrides the default in dotchart.default
Examples
data(api)dclus1<-svydesign(id=~dnum, weights=~pw, data=apiclus1, fpc=~fpc)
a<-svymean(~stype, dclus1)barplot(a)barplot(a, names.arg=c("Elementary","High","Middle"), col="purple", main="Proportions of school level")
b<-svyby(~enroll+api.stu, ~stype, dclus1, svymean)barplot(b,beside=TRUE,legend=TRUE)dotchart(b)

12 bootweights
bootweights Compute survey bootstrap weights
Description
Bootstrap weights for infinite populations (’with replacement’ sampling) are created by samplingwith replacement from the PSUs in each stratum. subbootweights() samples n-1 PSUs from then available (Rao and Wu), bootweights samples n (Canty and Davison).
For multistage designs or those with large sampling fractions, mrbweights implements Preston’smultistage rescaled bootstrap. The multistage rescaled bootstrap is still useful for single-stage de-signs with small sampling fractions, where it reduces to a half-sample replicate method.
Usage
bootweights(strata, psu, replicates = 50, fpc = NULL,fpctype = c("population", "fraction", "correction"),compress = TRUE)
subbootweights(strata, psu, replicates = 50, compress = TRUE)mrbweights(clusters, stratas, fpcs, replicates=50,
multicore=getOption("survey.multicore"))
Arguments
strata Identifier for sampling strata (top level only)
stratas data frame of strata for all stages of sampling
psu Identifier for primary sampling units
clusters data frame of identifiers for sampling units at each stage
replicates Number of bootstrap replicates
fpc Finite population correction (top level only)
fpctype Is fpc the population size, sampling fraction, or 1-sampling fraction?
fpcs survey_fpc object with population and sample size at each stage
compress Should the replicate weights be compressed?
multicore Use the multicore package to generate the replicates in parallel
Value
A set of replicate weights
warning
With multicore=TRUE the resampling procedure does not use the current random seed, so theresults cannot be exactly reproduced even by using set.seed()

brrweights 13
Note
These bootstraps are strictly appropriate only when the first stage of sampling is a simple or stratifiedrandom sample of PSUs with or without replacement, and not (eg) for PPS sampling. The functionswill not enforce simple random sampling, so they can be used (approximately) for data that have hadnon-response corrections and other weight adjustments. It is preferable to apply these adjustmentsafter creating the bootstrap replicate weights, but that may not be possible with public-use data.
References
Canty AJ, Davison AC. (1999) Resampling-based variance estimation for labour force surveys. TheStatistician 48:379-391
Judkins, D. (1990), "Fay’s Method for Variance Estimation" Journal of Official Statistics, 6, 223-239.
Preston J. (2009) Rescaled bootstrap for stratified multistage sampling. Survey Methodology 35(2)227-234
Rao JNK, Wu CFJ. Bootstrap inference for sample surveys. Proc Section on Survey ResearchMethodology. 1993 (866–871)
See Also
as.svrepdesign
brrweights Compute replicate weights
Description
Compute replicate weights from a survey design. These functions are usually called from as.svrepdesignrather than directly by the user.
Usage
brrweights(strata, psu, match = NULL,small = c("fail","split","merge"),large = c("split", "merge", "fail"),fay.rho=0, only.weights=FALSE,compress=TRUE, hadamard.matrix=NULL)
jk1weights(psu,fpc=NULL,fpctype=c("population","fraction","correction"),compress=TRUE)
jknweights(strata,psu, fpc=NULL,fpctype=c("population","fraction","correction"),compress=TRUE,lonely.psu=getOption("survey.lonely.psu"))
14 brrweights
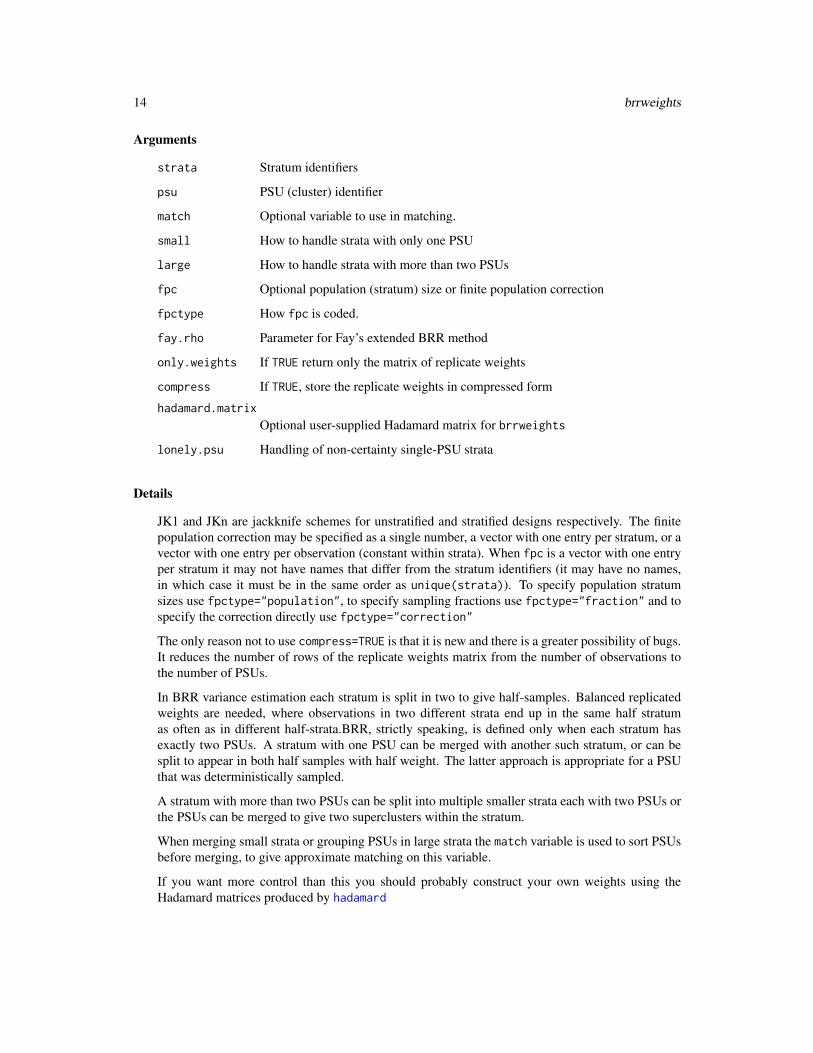
Arguments
strata Stratum identifiers
psu PSU (cluster) identifier
match Optional variable to use in matching.
small How to handle strata with only one PSU
large How to handle strata with more than two PSUs
fpc Optional population (stratum) size or finite population correction
fpctype How fpc is coded.
fay.rho Parameter for Fay’s extended BRR method
only.weights If TRUE return only the matrix of replicate weights
compress If TRUE, store the replicate weights in compressed form
hadamard.matrix
Optional user-supplied Hadamard matrix for brrweights
lonely.psu Handling of non-certainty single-PSU strata
Details
JK1 and JKn are jackknife schemes for unstratified and stratified designs respectively. The finitepopulation correction may be specified as a single number, a vector with one entry per stratum, or avector with one entry per observation (constant within strata). When fpc is a vector with one entryper stratum it may not have names that differ from the stratum identifiers (it may have no names,in which case it must be in the same order as unique(strata)). To specify population stratumsizes use fpctype="population", to specify sampling fractions use fpctype="fraction" and tospecify the correction directly use fpctype="correction"
The only reason not to use compress=TRUE is that it is new and there is a greater possibility of bugs.It reduces the number of rows of the replicate weights matrix from the number of observations tothe number of PSUs.
In BRR variance estimation each stratum is split in two to give half-samples. Balanced replicatedweights are needed, where observations in two different strata end up in the same half stratumas often as in different half-strata.BRR, strictly speaking, is defined only when each stratum hasexactly two PSUs. A stratum with one PSU can be merged with another such stratum, or can besplit to appear in both half samples with half weight. The latter approach is appropriate for a PSUthat was deterministically sampled.
A stratum with more than two PSUs can be split into multiple smaller strata each with two PSUs orthe PSUs can be merged to give two superclusters within the stratum.
When merging small strata or grouping PSUs in large strata the match variable is used to sort PSUsbefore merging, to give approximate matching on this variable.
If you want more control than this you should probably construct your own weights using theHadamard matrices produced by hadamard
brrweights 15
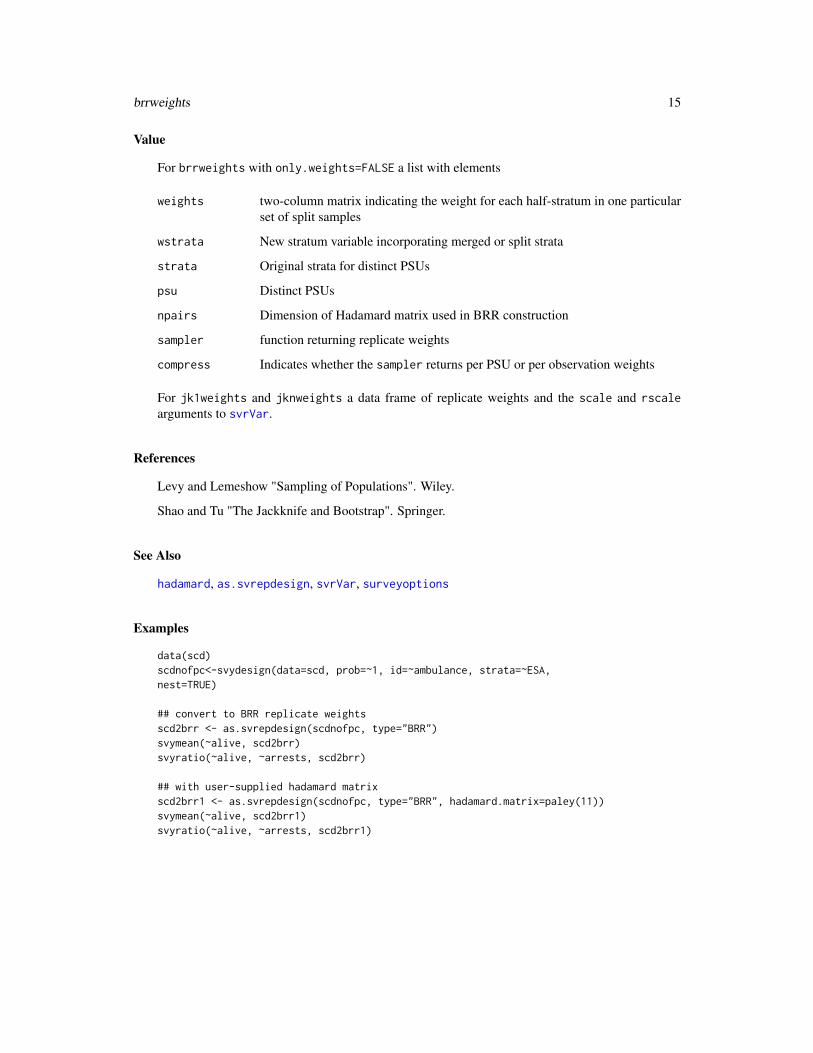
Value
For brrweights with only.weights=FALSE a list with elements
weights two-column matrix indicating the weight for each half-stratum in one particularset of split samples
wstrata New stratum variable incorporating merged or split strata
strata Original strata for distinct PSUs
psu Distinct PSUs
npairs Dimension of Hadamard matrix used in BRR construction
sampler function returning replicate weights
compress Indicates whether the sampler returns per PSU or per observation weights
For jk1weights and jknweights a data frame of replicate weights and the scale and rscalearguments to svrVar.
References
Levy and Lemeshow "Sampling of Populations". Wiley.
Shao and Tu "The Jackknife and Bootstrap". Springer.
See Also
hadamard, as.svrepdesign, svrVar, surveyoptions
Examples
data(scd)scdnofpc<-svydesign(data=scd, prob=~1, id=~ambulance, strata=~ESA,nest=TRUE)
## convert to BRR replicate weightsscd2brr <- as.svrepdesign(scdnofpc, type="BRR")svymean(~alive, scd2brr)svyratio(~alive, ~arrests, scd2brr)
## with user-supplied hadamard matrixscd2brr1 <- as.svrepdesign(scdnofpc, type="BRR", hadamard.matrix=paley(11))svymean(~alive, scd2brr1)svyratio(~alive, ~arrests, scd2brr1)

16 calibrate
calibrate Calibration (GREG) estimators
Description
Calibration, generalized raking, or GREG estimators generalise post-stratification and raking bycalibrating a sample to the marginal totals of variables in a linear regression model. This functionreweights the survey design and adds additional information that is used by svyrecvar to reducethe estimated standard errors.
Usage
calibrate(design,...)## S3 method for class ’survey.design2’calibrate(design, formula, population,
aggregate.stage=NULL, stage=0, variance=NULL,bounds=c(-Inf,Inf), calfun=c("linear","raking","logit"),maxit=50,epsilon=1e-7,verbose=FALSE,force=FALSE,trim=NULL,...)
## S3 method for class ’svyrep.design’calibrate(design, formula, population,compress=NA,
aggregate.index=NULL, variance=NULL, bounds=c(-Inf,Inf),calfun=c("linear","raking","logit"),maxit=50, epsilon=1e-7, verbose=FALSE,force=FALSE,trim=NULL, ...)
## S3 method for class ’twophase’calibrate(design, phase=2,formula, population,
calfun=c("linear","raking","logit","rrz"),...)grake(mm,ww,calfun,eta=rep(0,NCOL(mm)),bounds,population,epsilon, verbose,maxit)
Arguments
design survey design object
formula model formula for calibration model, or list of formulas for each margin
population Vectors of population column totals for the model matrix in the calibrationmodel, or list of such vectors for each cluster, or list of tables for each margin.Required except for two-phase designs
compress compress the resulting replicate weights if TRUE or if NA and weights were pre-viously compressed
stage See Details below
variance Coefficients for variance in calibration model (see Details below)aggregate.stage
An integer. If not NULL, make calibration weights constant within sampling unitsat this stage.
aggregate.index
A vector or one-sided formula. If not NULL, make calibration weights constantwithin levels of this variable

calibrate 17
bounds Bounds for the calibration weights, optional except for calfun="logit"
trim Weights outside this range will be trimmed to these bounds.
... options for other methods
calfun Calibration function: see below
maxit Number of iterations
epsilon tolerance in matching population total. Either a single number or a vector of thesame length as population
verbose print lots of uninteresting information
force Return an answer even if the specified accuracy was not achieved
phase Phase of a two-phase design to calibrate (only phase=2 currently implemented.)
mm model matrix
ww vector of weights
eta starting values for iteration
Details
The formula argument specifies a model matrix, and the population argument is the populationcolumn sums of this matrix.
For the important special case where the calibration totals are (possibly overlapping) marginal tablesof factor variables, as in classical raking, the formula and population arguments may be lists inthe same format as the input to rake.
If the population argument has a names attribute it will be checked against the names producedby model.matrix(formula) and reordered if necessary. This protects against situations where the(locale-dependent) ordering of factor levels is not what you expected.
Numerical instabilities may result if the sampling weights in the design object are wrong by mul-tiple orders of magnitude. The code now attempts to rescale the weights first, but it is better for theuser to ensure that the scale is reasonable.
The calibrate function implements linear, bounded linear, raking, bounded raking, and logit cal-ibration functions. All except unbounded linear calibration use the Newton-Raphson algorithmdescribed by Deville et al (1993). This algorithm is exposed for other uses in the grake function.Unbounded linear calibration uses an algorithm that is less sensitive to collinearity. The calibrationfunction may be specified as a string naming one of the three built-in functions or as an object ofclass calfun, allowing user-defined functions. See make.calfun for details.
Calibration with bounds, or on highly collinear data, may fail. If force=TRUE the approximatelycalibrated design object will still be returned (useful for examining why it failed). A failure incalibrating a set of replicate weights when the sampling weights were successfully calibrated willgive only a warning, not an error.
When calibration to the desired set of bounds is not possible, another option is to trim weights.To do this set bounds to a looser set of bounds for which calibration is achievable and set trimto the tighter bounds. Weights outside the bounds will be trimmed to the bounds, and the excessweight distributed over other observations in proportion to their sampling weight (and so this mayput some other observations slightly over the trimming bounds). The projection matrix used incomputing standard errors is based on the feasible bounds specified by the bounds argument. See

18 calibrate
also trimWeights, which trims the final weights in a design object rather than the calibration ad-justments.
For two-phase designs calfun="rrz" estimates the sampling probabilities using logistic regressionas described by Robins et al (1994). estWeights will do the same thing.
Calibration may result in observations within the last-stage sampling units having unequal weighteven though they necessarily are sampled together. Specifying aggegrate.stage ensures that thecalibration weight adjustments are constant within sampling units at the specified stage; if the orig-inal sampling weights were equal the final weights will also be equal. The algorithm is as describedby Vanderhoeft (2001, section III.D). Specifying aggregate.index does the same thing for repli-cate weight designs; a warning will be given if the original weights are not constant within levels ofaggregate.index.
In a model with two-stage sampling, population totals may be available for the PSUs actually sam-pled, but not for the whole population. In this situation, calibrating within each PSU reduces withsecond-stage contribution to variance. This generalizes to multistage sampling. The stage argu-ment specifies which stage of sampling the totals refer to. Stage 0 is full population totals, stage1 is totals for PSUs, and so on. The default, stage=NULL is interpreted as stage 0 when a singlepopulation vector is supplied and stage 1 when a list is supplied. Calibrating to PSU totals will fail(with a message about an exactly singular matrix) for PSUs that have fewer observations than thenumber of calibration variables.
For unbounded linear calibration only, the variance in the calibration model may depend on covari-ates. If variance=NULL the calibration model has constant variance. If variance is not NULL itspecifies a linear combination of the columns of the model matrix and the calibration variance isproportional to that linear combination.
The design matrix specified by formula (after any aggregation) must be of full rank, with oneexception. If the population total for a column is zero and all the observations are zero the columnwill be ignored. This allows the use of factors where the population happens to have no observationsat some level.
In a two-phase design, population may be omitted when phase=2, to specify calibration to thephase-one sample. If the two-phase design object was constructed using the more memory-efficientmethod="approx" argument to twophase, calibration of the first phase of sampling to the popula-tion is not supported.
Value
A survey design object.
References
Deville J-C, Sarndal C-E, Sautory O (1993) Generalized Raking Procedures in Survey Sampling.JASA 88:1013-1020
Kalton G, Flores-Cervantes I (2003) "Weighting methods" J Official Stat 19(2) 81-97
Lumley T, Shaw PA, Dai JY (2011) "Connections between survey calibration estimators and semi-parametric models for incomplete data" International Statistical Review. 79:200-220. (with discus-sion 79:221-232)
Sarndal C-E, Swensson B, Wretman J. "Model Assisted Survey Sampling". Springer. 1991.
calibrate 19
Rao JNK, Yung W, Hidiroglou MA (2002) Estimating equations for the analysis of survey datausing poststratification information. Sankhya 64 Series A Part 2, 364-378.
Robins JM, Rotnitzky A, Zhao LP. (1994) Estimation of regression coefficients when some regres-sors are not always observed. Journal of the American Statistical Association, 89, 846-866.
Vanderhoeft C (2001) Generalized Calibration at Statistics Belgium. Statistics Belgium WorkingPaper No 3. http://www.statbel.fgov.be/studies/paper03_en.asp
See Also
postStratify, rake for other ways to use auxiliary information
twophase and vignette("epi") for an example of calibration in two-phase designs
survey/tests/kalton.R for examples replicating those in Kalton & Flores-Cervantes (2003)
make.calfun for user-defined calibration distances.
trimWeights to trim final weights rather than calibration adjustments.
Examples
data(api)dclus1<-svydesign(id=~dnum, weights=~pw, data=apiclus1, fpc=~fpc)
pop.totals<-c(‘(Intercept)‘=6194, stypeH=755, stypeM=1018)
## For a single factor variable this is equivalent to## postStratify
(dclus1g<-calibrate(dclus1, ~stype, pop.totals))
svymean(~api00, dclus1g)svytotal(~enroll, dclus1g)svytotal(~stype, dclus1g)
## Make weights constant within school district(dclus1agg<-calibrate(dclus1, ~stype, pop.totals, aggregate=1))svymean(~api00, dclus1agg)svytotal(~enroll, dclus1agg)svytotal(~stype, dclus1agg)
## Now add sch.wide(dclus1g2 <- calibrate(dclus1, ~stype+sch.wide, c(pop.totals, sch.wideYes=5122)))
svymean(~api00, dclus1g2)svytotal(~enroll, dclus1g2)svytotal(~stype, dclus1g2)
## Finally, calibrate on 1999 API and school type
(dclus1g3 <- calibrate(dclus1, ~stype+api99, c(pop.totals, api99=3914069)))
svymean(~api00, dclus1g3)

20 calibrate
svytotal(~enroll, dclus1g3)svytotal(~stype, dclus1g3)
## Same syntax with replicate weightsrclus1<-as.svrepdesign(dclus1)
(rclus1g3 <- calibrate(rclus1, ~stype+api99, c(pop.totals, api99=3914069)))
svymean(~api00, rclus1g3)svytotal(~enroll, rclus1g3)svytotal(~stype, rclus1g3)
(rclus1agg3 <- calibrate(rclus1, ~stype+api99, c(pop.totals,api99=3914069), aggregate.index=~dnum))
svymean(~api00, rclus1agg3)svytotal(~enroll, rclus1agg3)svytotal(~stype, rclus1agg3)
##### Bounded weightsrange(weights(dclus1g3)/weights(dclus1))dclus1g3b <- calibrate(dclus1, ~stype+api99, c(pop.totals, api99=3914069),bounds=c(0.6,1.6))range(weights(dclus1g3b)/weights(dclus1))
svymean(~api00, dclus1g3b)svytotal(~enroll, dclus1g3b)svytotal(~stype, dclus1g3b)
## trimmingdclus1tr <- calibrate(dclus1, ~stype+api99, c(pop.totals, api99=3914069),bounds=c(0.5,2), trim=c(2/3,3/2))svymean(~api00+api99+enroll, dclus1tr)svytotal(~stype,dclus1tr)range(weights(dclus1tr)/weights(dclus1))
rclus1tr <- calibrate(rclus1, ~stype+api99, c(pop.totals, api99=3914069),bounds=c(0.5,2), trim=c(2/3,3/2))svymean(~api00+api99+enroll, rclus1tr)svytotal(~stype,rclus1tr)
## Input in the same format as rake() for classical rakingpop.table <- xtabs(~stype+sch.wide,apipop)pop.table2 <- xtabs(~stype+comp.imp,apipop)dclus1r<-rake(dclus1, list(~stype+sch.wide, ~stype+comp.imp),
list(pop.table, pop.table2))gclus1r<-calibrate(dclus1, formula=list(~stype+sch.wide, ~stype+comp.imp), population=list(pop.table, pop.table2),calfun="raking")svymean(~api00+stype, dclus1r)svymean(~api00+stype, gclus1r)
## generalised rakingdclus1g3c <- calibrate(dclus1, ~stype+api99, c(pop.totals,
api99=3914069), calfun="raking")

compressWeights 21
range(weights(dclus1g3c)/weights(dclus1))
(dclus1g3d <- calibrate(dclus1, ~stype+api99, c(pop.totals,api99=3914069), calfun=cal.logit, bounds=c(0.5,2.5)))
range(weights(dclus1g3d)/weights(dclus1))
## Ratio estimators are calibration estimatorsdstrat<-svydesign(id=~1,strata=~stype, weights=~pw, data=apistrat, fpc=~fpc)svytotal(~api.stu,dstrat)
common<-svyratio(~api.stu, ~enroll, dstrat, separate=FALSE)predict(common, total=3811472)
pop<-3811472## equivalent to (common) ratio estimatordstratg1<-calibrate(dstrat,~enroll-1, pop, variance=1)svytotal(~api.stu, dstratg1)
compressWeights Compress replicate weight matrix
Description
Many replicate weight matrices have redundant rows, such as when weights are the same for allobservations in a PSU. This function produces a compressed form. Methods for as.matrix andas.vector extract and expand the weights.
Usage
compressWeights(rw, ...)## S3 method for class ’svyrep.design’compressWeights(rw,...)## S3 method for class ’repweights_compressed’as.matrix(x,...)## S3 method for class ’repweights_compressed’as.vector(x,...)
Arguments
rw A set of replicate weights or a svyrep.design object
x A compressed set of replicate weights
... For future expansion

22 confint.svyglm
Value
An object of class repweights_compressed or a svyrep.design object with repweights elementof class repweights_compressed
See Also
jknweights,as.svrepdesign
Examples
data(api)dclus1<-svydesign(id=~dnum, weights=~pw, data=apiclus1, fpc=~fpc)rclus1c<-as.svrepdesign(dclus1,compress=TRUE)rclus1<-as.svrepdesign(dclus1,compress=FALSE)
confint.svyglm Confidence intervals for regression parameters
Description
Computes confidence intervals for regression parameters in svyglm objects. The default is a Wald-type confidence interval, adding and subtracting a multiple of the standard error. The method="likelihood"is an interval based on inverting the Rao-Scott likelihood ratio test. That is, it is an interval wherethe working model deviance is lower than the threshold for the Rao-Scott test at the specified level.
Usage
## S3 method for class ’svyglm’confint(object, parm, level = 0.95, method = c("Wald", "likelihood"), ddf = Inf, ...)
Arguments
object svyglm object
parm numeric or character vector indicating which parameters to construct intervalsfor.
level desired coverage
method See description above
ddf Denominator degrees of freedom for "likelihood" method, to use a t distribu-tion rather than norma. If NULL, use object$df.residual
... for future expansion
Value
A matrix of confidence intervals

crowd 23
References
J. N. K. Rao and Alistair J. Scott (1984) On Chi-squared Tests For Multiway Contigency Tableswith Proportions Estimated From Survey Data. Annals of Statistics 12:46-60
See Also
confint
Examples
data(api)dclus2<-svydesign(id=~dnum+snum, fpc=~fpc1+fpc2, data=apiclus2)
m<-svyglm(I(comp.imp=="Yes")~stype*emer+ell, design=dclus2, family=quasibinomial)confint(m)confint(m, method="like",ddf=NULL, parm=c("ell","emer"))
crowd Household crowding
Description
A tiny dataset from the VPLX manual.
Usage
data(crowd)
Format
A data frame with 6 observations on the following 5 variables.
rooms Number of rooms in the house
person Number of people in the household
weight Sampling weight
cluster Cluster number
stratum Stratum number
Source
Manual for VPLX, Census Bureau.

24 dimnames.DBIsvydesign
Examples
data(crowd)
## Example 1-1i1.1<-as.svrepdesign(svydesign(id=~cluster, weight=~weight,data=crowd))i1.1<-update(i1.1, room.ratio=rooms/person,overcrowded=factor(person>rooms))svymean(~rooms+person+room.ratio,i1.1)svytotal(~rooms+person+room.ratio,i1.1)svymean(~rooms+person+room.ratio,subset(i1.1,overcrowded==TRUE))svytotal(~rooms+person+room.ratio,subset(i1.1,overcrowded==TRUE))
## Example 1-2i1.2<-as.svrepdesign(svydesign(id=~cluster,weight=~weight,strata=~stratum, data=crowd))svymean(~rooms+person,i1.2)svytotal(~rooms+person,i1.2)
dimnames.DBIsvydesign Dimensions of survey designs
Description
dimnames returns variable names and row names for the data variables in a design object and dimreturns dimensions. For multiple imputation designs there is a third dimension giving the numberof imputations. For database-backed designs the second dimension includes variables defined byupdate. The first dimension excludes observations with zero weight.
Usage
## S3 method for class ’survey.design’dim(x)## S3 method for class ’svyimputationList’dim(x)## S3 method for class ’survey.design’dimnames(x)## S3 method for class ’DBIsvydesign’dimnames(x)## S3 method for class ’ODBCsvydesign’dimnames(x)## S3 method for class ’svyimputationList’dimnames(x)
Arguments
x Design object

election 25
Value
A vector of numbers for dim, a list of vectors of strings for dimnames.
See Also
update.DBIsvydesign, with.svyimputationList
Examples
data(api)dclus1 <- svydesign(ids=~dnum,weights=~pw,data=apiclus1,fpc=~fpc)dim(dclus1)dimnames(dclus1)colnames(dclus1)
election US 2004 presidential election data at state or county level
Description
A sample of voting data from US states or counties (depending on data availability), sampled withprobability proportional to number of votes. The sample was drawn using Tille’s splitting method,implemented in the "sampling" package.
Usage
data(election)
Format
election is a data frame with 4600 observations on the following 8 variables.
County A factor specifying the state or country
TotPrecincts Number of precincts in the state or county
PrecinctsReporting Number of precincts supplying data
Bush Votes for George W. Bush
Kerry Votes for John Kerry
Nader Votes for Ralph Nader
votes Total votes for those three candidates
p Sampling probability, proportional to votes
election_pps is a sample of 40 counties or states taken with probability proportional to the numberof votes. It includes the additional column wt with the sampling weights.
election_insample indicates which rows of election were sampled.
election_jointprob are the pairwise sampling probabilities and election_jointHR are approx-imate pairwise sampling probabilities using the Hartley-Rao approximation.

26 estweights
Source
.
Examples
data(election)## high positive correlation between totalsplot(Bush~Kerry,data=election,log="xy")## high negative correlation between proportionsplot(I(Bush/votes)~I(Kerry/votes), data=election)
## Variances without replacement## Horvitz-Thompson typedpps_br<- svydesign(id=~1, fpc=~p, data=election_pps, pps="brewer")dpps_ov<- svydesign(id=~1, fpc=~p, data=election_pps, pps="overton")dpps_hr<- svydesign(id=~1, fpc=~p, data=election_pps, pps=HR(sum(election$p^2)/40))dpps_hr1<- svydesign(id=~1, fpc=~p, data=election_pps, pps=HR())dpps_ht<- svydesign(id=~1, fpc=~p, data=election_pps, pps=ppsmat(election_jointprob))## Yates-Grundy typedpps_yg<- svydesign(id=~1, fpc=~p, data=election_pps, pps=ppsmat(election_jointprob),variance="YG")dpps_hryg<- svydesign(id=~1, fpc=~p, data=election_pps, pps=HR(sum(election$p^2)/40),variance="YG")
## The with-replacement approximationdppswr <-svydesign(id=~1, probs=~p, data=election_pps)
svytotal(~Bush+Kerry+Nader, dpps_ht)svytotal(~Bush+Kerry+Nader, dpps_yg)svytotal(~Bush+Kerry+Nader, dpps_hr)svytotal(~Bush+Kerry+Nader, dpps_hryg)svytotal(~Bush+Kerry+Nader, dpps_hr1)svytotal(~Bush+Kerry+Nader, dpps_br)svytotal(~Bush+Kerry+Nader, dpps_ov)svytotal(~Bush+Kerry+Nader, dppswr)
estweights Estimated weights for missing data
Description
Creates or adjusts a two-phase survey design object using a logistic regression model for second-phase sampling probability. This function should be particularly useful in reweighting to accountfor missing data.
Usage
estWeights(data,formula,...)## S3 method for class ’twophase’estWeights(data,formula=NULL, working.model=NULL,...)## S3 method for class ’data.frame’

estweights 27
estWeights(data,formula=NULL, working.model=NULL,subset=NULL, strata=NULL,...)
Arguments
data twophase design object or data frameformula Predictors for estimating weightsworking.model Model fitted to complete (ie phase 1) datasubset Subset of data frame with complete data (ie phase 1). If NULL use all complete
casesstrata Stratification (if any) of phase 2 sampling... for future expansion
Details
If data is a data frame, estWeights first creates a two-phase design object. The strata argument isused only to compute finite population corrections, the same variables must be included in formulato compute stratified sampling probabilities.
With a two-phase design object, estWeights estimates the sampling probabilities using logisticregression as described by Robins et al (1994) and adds information to the object to enable correctsandwich standard errors to be computed.
An alternative to specifying formula is to specify working.model. The estimating functions fromthis model will be used as predictors of the sampling probabilities, which will increase efficiency tothe extent that the working model and the model of interest estimate the same parameters (Kulich\& Lin 2004).
The effect on a two-phase design object is very similar to calibrate, and is identical when formulaspecifies a saturated model.
Value
A two-phase survey design object.
References
Breslow NE, Lumley T, Ballantyne CM, Chambless LE, Kulich M. (2009) Using the Whole Cohortin the Analysis of Case-Cohort Data. Am J Epidemiol. 2009 Jun 1;169(11):1398-405.
Robins JM, Rotnitzky A, Zhao LP. (1994) Estimation of regression coefficients when some regres-sors are not always observed. Journal of the American Statistical Association, 89, 846-866.
Kulich M, Lin DY (2004). Improving the Efficiency of Relative-Risk Estimation in Case-CohortStudies. Journal of the American Statistical Association, Vol. 99, pp.832-844
Lumley T, Shaw PA, Dai JY (2011) "Connections between survey calibration estimators and semi-parametric models for incomplete data" International Statistical Review. 79:200-220. (with discus-sion 79:221-232)
See Also
postStratify, calibrate, twophase

28 fpc
Examples
data(airquality)
## ignoring missingness, using model-based standard errorsummary(lm(log(Ozone)~Temp+Wind, data=airquality))
## Without covariates to predict missingness we get## same point estimates, but different (sandwich) standard errorsdaq<-estWeights(airquality, formula=~1,subset=~I(!is.na(Ozone)))summary(svyglm(log(Ozone)~Temp+Wind,design=daq))
## Reweighting based on weather, monthd2aq<-estWeights(airquality, formula=~Temp+Wind+Month,
subset=~I(!is.na(Ozone)))summary(svyglm(log(Ozone)~Temp+Wind,design=d2aq))
fpc Small survey example
Description
The fpc data frame has 8 rows and 6 columns. It is artificial data to illustrate survey samplingestimators.
Usage
data(fpc)
Format
This data frame contains the following columns:
stratid Stratum ids
psuid Sampling unit ids
weight Sampling weights
nh number sampled per stratum
Nh population size per stratum
x data
Source
http://www.stata-press.com/data/r7/fpc.dta
ftable.svystat 29
Examples
data(fpc)fpc
withoutfpc<-svydesign(weights=~weight, ids=~psuid, strata=~stratid, variables=~x, data=fpc, nest=TRUE)
withoutfpcsvymean(~x, withoutfpc)
withfpc<-svydesign(weights=~weight, ids=~psuid, strata=~stratid,fpc=~Nh, variables=~x, data=fpc, nest=TRUE)
withfpcsvymean(~x, withfpc)
## Other equivalent formswithfpc<-svydesign(prob=~I(1/weight), ids=~psuid, strata=~stratid,fpc=~Nh, variables=~x, data=fpc, nest=TRUE)
svymean(~x, withfpc)
withfpc<-svydesign(weights=~weight, ids=~psuid, strata=~stratid,fpc=~I(nh/Nh), variables=~x, data=fpc, nest=TRUE)
svymean(~x, withfpc)
withfpc<-svydesign(weights=~weight, ids=~interaction(stratid,psuid),strata=~stratid, fpc=~I(nh/Nh), variables=~x, data=fpc)
svymean(~x, withfpc)
withfpc<-svydesign(ids=~psuid, strata=~stratid, fpc=~Nh,variables=~x,data=fpc,nest=TRUE)
svymean(~x, withfpc)
withfpc<-svydesign(ids=~psuid, strata=~stratid,fpc=~I(nh/Nh), variables=~x, data=fpc, nest=TRUE)
svymean(~x, withfpc)
ftable.svystat Lay out tables of survey statistics
Description
Reformat the output of survey computations to a table.

30 ftable.svystat
Usage
## S3 method for class ’svystat’ftable(x, rownames,...)## S3 method for class ’svrepstat’ftable(x, rownames,...)## S3 method for class ’svyby’ftable(x,...)
Arguments
x Output of functions such as svymean,svrepmean, svyby
rownames List of vectors of strings giving dimension names for the resulting table (seeexamples)
... Arguments for future expansion
Value
An object of class "ftable"
See Also
ftable
Examples
data(api)dclus1<-svydesign(id=~dnum, weights=~pw, data=apiclus1, fpc=~fpc)
a<-svymean(~interaction(stype,comp.imp), design=dclus1)b<-ftable(a, rownames=list(stype=c("E","H","M"),comp.imp=c("No","Yes")))b
a<-svymean(~interaction(stype,comp.imp), design=dclus1, deff=TRUE)b<-ftable(a, rownames=list(stype=c("E","H","M"),comp.imp=c("No","Yes")))round(100*b,1)
rclus1<-as.svrepdesign(dclus1)a<-svytotal(~interaction(stype,comp.imp), design=rclus1)b<-ftable(a, rownames=list(stype=c("E","H","M"),comp.imp=c("No","Yes")))bround(b)
a<-svyby(~api99 + api00, ~stype + sch.wide, rclus1, svymean, keep.var=TRUE)ftable(a)print(ftable(a),digits=2)
b<-svyby(~api99 + api00, ~stype + sch.wide, rclus1, svymean, keep.var=TRUE, deff=TRUE)print(ftable(b),digits=2)
d<-svyby(~api99 + api00, ~stype + sch.wide, rclus1, svymean, keep.var=TRUE, vartype=c("se","cvpct"))

hadamard 31
round(ftable(d),1)
hadamard Hadamard matrices
Description
Returns a Hadamard matrix of dimension larger than the argument.
Usage
hadamard(n)
Arguments
n lower bound for size
Details
For most n the matrix comes from paley. The 36× 36 matrix is from Plackett and Burman (1946)and the 28× 28 is from Sloane’s library of Hadamard matrices.
Matrices of dimension every multiple of 4 are thought to exist, but this function doesn’t know aboutall of them, so it will sometimes return matrices that are larger than necessary. The excess is at most4 for n < 180 and at most 5% for n > 100.
Value
A Hadamard matrix
Note
Strictly speaking, a Hadamard matrix has entries +1 and -1 rather than 1 and 0, so 2*hadamard(n)-1is a Hadamard matrix
References
Sloane NJA. A Library of Hadamard Matrices http://www.research.att.com/~njas/hadamard/
Plackett RL, Burman JP. (1946) The Design of Optimum Multifactorial Experiments Biometrika,Vol. 33, No. 4 pp. 305-325
Cameron PJ (2005) Hadamard Matrices http://designtheory.org/library/encyc/topics/had.pdf. In: The Encyclopedia of Design Theory http://designtheory.org/library/encyc/
See Also
brrweights, paley
32 hospital
Examples
par(mfrow=c(2,2))## Sylvester-typeimage(hadamard(63),main=quote("Sylvester: "*64==2^6))## Paley-typeimage(hadamard(59),main=quote("Paley: "*60==59+1))## from NJ Sloane’s libraryimage(hadamard(27),main=quote("Stored: "*28))## For n=90 we get 96 rather than the minimum possible size, 92.image(hadamard(90),main=quote("Constructed: "*96==2^3%*%(11+1)))
par(mfrow=c(1,1))plot(2:150,sapply(2:150,function(i) ncol(hadamard(i))),type="S",
ylab="Matrix size",xlab="n",xlim=c(1,150),ylim=c(1,150))abline(0,1,lty=3)lines(2:150, 2:150-(2:150 %% 4)+4,col="purple",type="S",lty=2)legend(c(x=10,y=140),legend=c("Actual size","Minimum possible size"),
col=c("black","purple"),bty="n",lty=c(1,2))
hospital Sample of obstetric hospitals
Description
The hospital data frame has 15 rows and 5 columns.
Usage
data(hospital)
Format
This data frame contains the following columns:
hospno Hospital id
oblevel level of obstetric care
weighta Weights, as given by the original reference
tothosp total hospitalisations
births births
weightats Weights, as given in the source
Source
http://www.ats.ucla.edu/stat/books/sop/hospsamp.dta

HR 33
References
Levy and Lemeshow. "Sampling of Populations" (3rd edition). Wiley.
Examples
data(hospital)hospdes<-svydesign(strata=~oblevel, id=~hospno, weights=~weighta,fpc=~tothosp, data=hospital)hosprep<-as.svrepdesign(hospdes)
svytotal(~births, design=hospdes)svytotal(~births, design=hosprep)
HR Wrappers for specifying PPS designs
Description
The Horvitz-Thompson estimator and the Hartley-Rao approximation require information in addi-tion to the sampling probabilities for sampled individuals. These functions allow this informationto be supplied.
Usage
HR(psum=NULL, strata = NULL)ppsmat(jointprob, tolerance = 1e-04)
Arguments
psum The sum of squared sampling probabilities for the population, divided by thesample size, as a single number or as a vector for stratified sampling
strata Stratum labels, of the same length as psum, if psum is a vector
jointprob Matrix of pairwise sampling probabilities for the sampled individuals
tolerance Tolerance for deciding that the covariance of sampling indicators is zero
Value
An object of class HR or ppsmat, suitable for supplying as the pps argument to svydesign.
See Also
election for examples of PPS designs
Examples
HR(0.1)

34 make.calfun
make.calfun Calibration metrics
Description
Create calibration metric for use in calibrate. The function F is the link function described insection 2 of Deville et al. To create a new calibration metric, specify F − 1 and its derivative. Thepackage provides cal.linear, cal.raking, and cal.logit.
Usage
make.calfun(Fm1, dF, name)
Arguments
Fm1 Function F − 1 taking a vector u and a vector of length 2, bounds.
dF Derivative of Fm1 wrt u: arguments u and bounds
name Character string to use as name
Value
An object of class "calfun"
References
Deville J-C, Sarndal C-E, Sautory O (1993) Generalized Raking Procedures in Survey Sampling.JASA 88:1013-1020
Deville J-C, Sarndal C-E (1992) Calibration Estimators in Survey Sampling. JASA 87: 376-382
See Also
calibrate
Examples
str(cal.linear)cal.linear$Fm1cal.linear$dF
hellinger <- make.calfun(Fm1=function(u, bounds) ((1-u/2)^-2)-1,dF= function(u, bounds) (1-u/2)^-3 ,name="hellinger distance")
hellinger
data(api)dclus1<-svydesign(id=~dnum, weights=~pw, data=apiclus1, fpc=~fpc)

marginpred 35
svymean(~api00,calibrate(dclus1, ~api99, pop=c(6194, 3914069),calfun=hellinger))
svymean(~api00,calibrate(dclus1, ~api99, pop=c(6194, 3914069),calfun=cal.linear))
svymean(~api00,calibrate(dclus1, ~api99, pop=c(6194,3914069),calfun=cal.raking))
marginpred Standardised predictions (predictive margins) for regression models.
Description
Reweights the design (using calibrate) so that the adjustment variables are uncorrelated with thevariables in the model, and then performs predictions by calling predict. When the adjustmentmodel is saturated this is equivalent to direct standardization on the adjustment variables.
The svycoxph and svykmlist methods return survival curves.
Usage
marginpred(model, adjustfor, predictat, ...)## S3 method for class ’svycoxph’marginpred(model, adjustfor, predictat, se=FALSE, ...)## S3 method for class ’svykmlist’marginpred(model, adjustfor, predictat, se=FALSE, ...)## S3 method for class ’svyglm’marginpred(model, adjustfor, predictat, ...)
Arguments
model A regression model object of a class that has a marginpred method
adjustfor Model formula specifying adjustment variables, which must be in the designobject of the model
predictat A data frame giving values of the variables in model to predict at
se Estimate standard errors for the survival curve (uses a lot of memory if the sam-ple size is large)
... Extra arguments, passed to the predict method for model
See Also
calibrate
predict.svycoxph
36 mu284
Examples
## generate data with apparent group effect from confoundingset.seed(42)df<-data.frame(x=rnorm(100))df$time<-rexp(100)*exp(df$x-1)df$status<-1df$group<-(df$x+rnorm(100))>0des<-svydesign(id=~1,data=df)newdf<-data.frame(group=c(FALSE,TRUE), x=c(0,0))
## Cox modelm0<-svycoxph(Surv(time,status)~group,design=des)m1<-svycoxph(Surv(time,status)~group+x,design=des)## conditional predictions, unadjusted and adjustedcpred0<-predict(m0, type="curve", newdata=newdf, se=TRUE)cpred1<-predict(m1, type="curve", newdata=newdf, se=TRUE)## adjusted marginal predictionmpred<-marginpred(m0, adjustfor=~x, predictat=newdf, se=TRUE)
plot(cpred0)lines(cpred1[[1]],col="red")lines(cpred1[[2]],col="red")lines(mpred[[1]],col="blue")lines(mpred[[2]],col="blue")
## Kaplan--Meiers2<-svykm(Surv(time,status>0)~group, design=des)p2<-marginpred(s2, adjustfor=~x, predictat=newdf,se=TRUE)plot(s2)lines(p2[[1]],col="green")lines(p2[[2]],col="green")
## logistic regressionlogisticm <- svyglm(group~time, family=quasibinomial, design=des)newdf$time<-c(0.1,0.8)logisticpred <- marginpred(logisticm, adjustfor=~x, predictat=newdf)
mu284 Two-stage sample from MU284
Description
The MU284 population comes from Sarndal et al, and the complete data are available from Statlib.These data are a two-stage sample from the population, analyzed on page 143 of the book.
Usage
data(mu284)

nhanes 37
Format
A data frame with 15 observations on the following 5 variables.
id1 identifier for PSUn1 number of PSUs in populationid2 identifier for second-stage unity1 variable to be analysedn2 number of second-stage units in this PSU
Source
Carl Erik Sarndal, Bengt Swensson, Jan Wretman. (1991) "Model Assisted Survey Sampling"Springer.
References
Full MU284 population at http://lib.stat.cmu.edu/datasets/mu284
Examples
data(mu284)(dmu284<-svydesign(id=~id1+id2,fpc=~n1+n2, data=mu284))(ytotal<-svytotal(~y1, dmu284))vcov(ytotal)
nhanes Cholesterol data from a US survey
Description
Data extracted from NHANES 2009-2010 on high cholesterol.
Usage
data(nhanes)
Format
A data frame with 8591 observations on the following 7 variables.
SDMVPSU Primary sampling unitsSDMVSTRA Sampling strataWTMEC2YR Sampling weightsHI_CHOL Numeric vector: 1 for total cholesterol over 240mg/dl, 0 under 240mg/dlrace 1=Hispanic, 2=non-Hispanic white, 3=non-Hispanic black, 4=otheragecat Age group (0,19] (19,39] (39,59] (59,Inf]
RIAGENDR Gender: 1=male, 2=female

38 nonresponse
Source
ftp://ftp.cdc.gov/pub/Health_Statistics/NCHS/nhanes/2009-2010
Examples
data(nhanes)design <- svydesign(id=~SDMVPSU, strata=~SDMVSTRA, weights=~WTMEC2YR, nest=TRUE,data=nhanes)design
nonresponse Experimental: Construct non-response weights
Description
Functions to simplify the construction of non-reponse weights by combining strata with small num-bers or large weights.
Usage
nonresponse(sample.weights, sample.counts, population)sparseCells(object, count=0,totalweight=Inf, nrweight=1.5)neighbours(index,object)joinCells(object,a,...)## S3 method for class ’nonresponse’weights(object,...)
Arguments
sample.weights table of sampling weight by stratifying variables
sample.counts table of sample counts by stratifying variables
population table of population size by stratifying variables
object object of class "nonresponse"
count Cells with fewer sampled units than this are "sparse"
nrweight Cells with higher non-response weight than this are "sparse"
totalweight Cells with average sampling weight times non-response weight higher than thisare "sparse"
index Number of a cell whose neighbours are to be found
a,... Cells to join

nonresponse 39
Details
When a stratified survey is conducted with imperfect response it is desirable to rescale the samplingweights to reflect the nonresponse. If some strata have small sample size, high non-response, oralready had high sampling weights it may be desirable to get less variable non-response weights byaveraging non-response across strata. Suitable strata to collapse may be similar on the stratifyingvariables and/or on the level of non-response.
nonresponse() combines stratified tables of population size, sample size, and sample weight intoan object. sparseCells identifies cells that may need combining. neighbours describes the cellsadjacent to a specified cell, and joinCells collapses the specified cells. When the collapsing iscomplete, use weights() to extract the nonresponse weights.
Value
nonresponse and joinCells return objects of class "nonresponse", neighbours and sparseCellsreturn objects of class "nonresponseSubset"
Examples
data(api)## pretend the sampling was stratified on three variablespoptable<-xtabs(~sch.wide+comp.imp+stype,data=apipop)sample.count<-xtabs(~sch.wide+comp.imp+stype,data=apiclus1)sample.weight<-xtabs(pw~sch.wide+comp.imp+stype, data=apiclus1)
## create a nonresponse objectnr<-nonresponse(sample.weight,sample.count, poptable)
## sparse cellssparseCells(nr)
## Look at neighboursneighbours(3,nr)neighbours(11,nr)
## Collapse some contiguous cellsnr1<-joinCells(nr,3,5,7)
## sparse cells nowsparseCells(nr1)nr2<-joinCells(nr1,3,11,8)
nr2
## one relatively sparse cellsparseCells(nr2)## but nothing suitable to join it toneighbours(3,nr2)
## extract the weightsweights(nr2)
40 open.DBIsvydesign
open.DBIsvydesign Open and close DBI connections
Description
A database-backed survey design object contains a connection to a database. This connection willbe broken if the object is saved and reloaded, and the connection should ideally be closed withclose before quitting R (although it doesn’t matter for SQLite connections). The connection canbe reopened with open.
Usage
## S3 method for class ’DBIsvydesign’open(con, ...)## S3 method for class ’DBIsvydesign’close(con, ...)## S3 method for class ’ODBCsvydesign’open(con, ...)## S3 method for class ’ODBCsvydesign’close(con, ...)
Arguments
con Object of class DBIsvydesign or ODBCsvydesign
... Other options, to be passed to dbConnect or dbDisconnect, or odbcReConnector odbcDisconnect
Value
The same survey design object with the connection opened or closed.
See Also
svydesign
DBI package
Examples
## Not run:library(RSQLite)dbclus1<-svydesign(id=~dnum, weights=~pw, fpc=~fpc,data="apiclus1",dbtype="SQLite",dbname=system.file("api.db",package="survey"))
dbclus1close(dbclus1)dbclus1try(svymean(~api00, dbclus1))
paley 41
dbclus1<-open(dbclus1)open(dbclus1)svymean(~api00, dbclus1)
## End(Not run)
paley Paley-type Hadamard matrices
Description
Computes a Hadamard matrix of dimension (p+1)× 2k, where p is a prime, and p+1 is a multipleof 4, using the Paley construction. Used by hadamard.
Usage
paley(n, nmax = 2 * n, prime=NULL, check=!is.null(prime))
is.hadamard(H, style=c("0/1","+-"), full.orthogonal.balance=TRUE)
Arguments
n Minimum size for matrix
nmax Maximum size for matrix. Ignored if prime is specified.
prime Optional. A prime at least as large as n, such that prime+1 is divisible by 4.
check Check that the resulting matrix is of Hadamard type
H Matrix
style "0/1" for a matrix of 0s and 1s, "+-" for a matrix of ±1.full.orthogonal.balance
Require full orthogonal balance?
Details
The Paley construction gives a Hadamard matrix of order p+1 if p is prime and p+1 is a multiple of4. This is then expanded to order (p+ 1)× 2k using the Sylvester construction.
paley knows primes up to 7919. The user can specify a prime with the prime argument, in whichcase a matrix of order p+ 1 is constructed.
If check=TRUE the code uses is.hadamard to check that the resulting matrix really is of Hadamardtype, in the same way as in the example below. As this test takes n3 time it is preferable to just besure that prime really is prime.
A Hadamard matrix including a row of 1s gives BRR designs where the average of the replicates fora linear statistic is exactly the full sample estimate. This property is called full orthogonal balance.

42 pchisqsum
Value
For paley, a matrix of zeros and ones, or NULL if no matrix smaller than nmax can be found.
For is.hadamard, TRUE if H is a Hadamard matrix.
References
Cameron PJ (2005) Hadamard Matrices. http://designtheory.org/library/encyc/topics/had.pdf. In: The Encyclopedia of Design Theory http://designtheory.org/library/encyc/
See Also
hadamard
Examples
M<-paley(11)
is.hadamard(M)## internals of is.hadamard(M)H<-2*M-1## HH^T is diagonal for any Hadamard matrixH%*%t(H)
pchisqsum Distribution of quadratic forms
Description
The distribution of a quadratic form in p standard Normal variables is a linear combination of p chi-squared distributions with 1df. When there is uncertainty about the variance, a reasonable modelfor the distribution is a linear combination of F distributions with the same denominator.
Usage
pchisqsum(x, df, a, lower.tail = TRUE, method = c("satterthwaite", "integration","saddlepoint"))pFsum(x, df, a, ddf=Inf,lower.tail = TRUE, method = c("saddlepoint","integration","satterthwaite"), ...)
Arguments
x Observed valuesdf Vector of degrees of freedoma Vector of coefficientsddf Denominator degrees of freedomlower.tail lower or upper tail?method See Details below... arguments to pchisqsum

pchisqsum 43
Details
The "satterthwaite" method uses Satterthwaite’s approximation, and this is also used as a fall-back for the other methods. The accuracy is usually good, but is more variable depending on athan the other methods and is anticonservative in the extreme tail. The Satterthwaite approximationrequires all a>0.
"integration" requires the CompQuadForm package. For pchisqsum it uses Farebrother’s algo-rithm if all a>0. For pFsum or when some a<0 it inverts the characteristic function using the algo-rithm of Davies (1980). If the CompQuadForm package is not present, a warning is given and thesaddlepoint approximation is used. These algorithms are not accurate for very large x or when somea are close to zero: a warning is given if the relative error bound is more than 10% of the result.
"saddlepoint" uses Kuonen’s saddlepoint approximation. This is accurate even very far out in theupper tail or with some a=0 and does not require any additional packages. It is implemented in pureR and so is slower than the "integration" method.
The distribution in pFsum is standardised so that a likelihood ratio test can use the same x value asin pchisqsum. That is, the linear combination of chi-squareds is multiplied by ddf and then dividedby an independent chi-squared with ddf degrees of freedom.
Value
Vector of cumulative probabilities
References
Davies RB (1973). "Numerical inversion of a characteristic function" Biometrika 60:415-7
Davies RB (1980) "Algorithm AS 155: The Distribution of a Linear Combination of chi-squaredRandom Variables" Applied Statistics,Vol. 29, No. 3 (1980), pp. 323-333
P. Duchesne, P. Lafaye de Micheaux (2010) "Computing the distribution of quadratic forms: Fur-ther comparisons between the Liu-Tang-Zhang approximation and exact methods", ComputationalStatistics and Data Analysis, Volume 54, (2010), 858-862
Farebrother R.W. (1984) "Algorithm AS 204: The distribution of a Positive Linear Combination ofchi-squared random variables". Applied Statistics Vol. 33, No. 3 (1984), p. 332-339
Kuonen D (1999) Saddlepoint Approximations for Distributions of Quadratic Forms in NormalVariables. Biometrika, Vol. 86, No. 4 (Dec., 1999), pp. 929-935
See Also
pchisq
Examples
x <- 2.7*rnorm(1001)^2+rnorm(1001)^2+0.3*rnorm(1001)^2x.thin<-sort(x)[1+(0:100)*10]p.invert<-pchisqsum(x.thin,df=c(1,1,1),a=c(2.7,1,.3),method="int" ,lower=FALSE)p.satt<-pchisqsum(x.thin,df=c(1,1,1),a=c(2.7,1,.3),method="satt",lower=FALSE)p.sadd<-pchisqsum(x.thin,df=c(1,1,1),a=c(2.7,1,.3),method="sad",lower=FALSE)
plot(p.invert, p.satt,type="l",log="xy")

44 postStratify
abline(0,1,lty=2,col="purple")plot(p.invert, p.sadd,type="l",log="xy")abline(0,1,lty=2,col="purple")
pchisqsum(20, df=c(1,1,1),a=c(2.7,1,.3), lower.tail=FALSE,method="sad")pFsum(20, df=c(1,1,1),a=c(2.7,1,.3), ddf=49,lower.tail=FALSE,method="sad")pFsum(20, df=c(1,1,1),a=c(2.7,1,.3), ddf=1000,lower.tail=FALSE,method="sad")
postStratify Post-stratify a survey
Description
Post-stratification adjusts the sampling and replicate weights so that the joint distribution of a set ofpost-stratifying variables matches the known population joint distribution. Use rake when the fulljoint distribution is not available.
Usage
postStratify(design, strata, population, partial = FALSE, ...)## S3 method for class ’svyrep.design’postStratify(design, strata, population, partial = FALSE, compress=NULL,...)## S3 method for class ’survey.design’postStratify(design, strata, population, partial = FALSE, ...)
Arguments
design A survey design with replicate weights
strata A formula or data frame of post-stratifying variables, which must not containmissing values.
population A table, xtabs or data.frame with population frequencies
partial if TRUE, ignore population strata not present in the sample
compress Attempt to compress the replicate weight matrix? When NULL will attempt tocompress if the original weight matrix was compressed
... arguments for future expansion
Details
The population totals can be specified as a table with the strata variables in the margins, or as adata frame where one column lists frequencies and the other columns list the unique combinationsof strata variables (the format produced by as.data.frame acting on a table object). A table musthave named dimnames to indicate the variable names.
Compressing the replicate weights will take time and may even increase memory use if there isactually little redundancy in the weight matrix (in particular if the post-stratification variables havemany values and cut across PSUs).

postStratify 45
If a svydesign object is to be converted to a replication design the post-stratification should beperformed after conversion.
The variance estimate for replication designs follows the same procedure as Valliant (1993) de-scribed for estimating totals. Rao et al (2002) describe this procedure for estimating functions (andalso the GREG or g-calibration procedure, see calibrate)
Value
A new survey design object.
Note
If the sampling weights are already post-stratified there will be no change in point estimates afterpostStratify but the standard error estimates will decrease to correctly reflect the post-stratification.See http://www.dcs.napier.ac.uk/peas/exemplar1.htm for an example.
References
Valliant R (1993) Post-stratification and conditional variance estimation. JASA 88: 89-96
Rao JNK, Yung W, Hidiroglou MA (2002) Estimating equations for the analysis of survey datausing poststratification information. Sankhya 64 Series A Part 2, 364-378.
See Also
rake, calibrate for other things to do with auxiliary information
compressWeights for information on compressing weights
Examples
data(api)dclus1<-svydesign(id=~dnum, weights=~pw, data=apiclus1, fpc=~fpc)rclus1<-as.svrepdesign(dclus1)
svymean(~api00, rclus1)svytotal(~enroll, rclus1)
# post-stratify on school typepop.types <- data.frame(stype=c("E","H","M"), Freq=c(4421,755,1018))#or: pop.types <- xtabs(~stype, data=apipop)#or: pop.types <- table(stype=apipop$stype)
rclus1p<-postStratify(rclus1, ~stype, pop.types)summary(rclus1p)svymean(~api00, rclus1p)svytotal(~enroll, rclus1p)
## and for svydesign objectsdclus1p<-postStratify(dclus1, ~stype, pop.types)summary(dclus1p)

46 rake
svymean(~api00, dclus1p)svytotal(~enroll, dclus1p)
rake Raking of replicate weight design
Description
Raking uses iterative post-stratification to match marginal distributions of a survey sample to knownpopulation margins.
Usage
rake(design, sample.margins, population.margins, control = list(maxit =10, epsilon = 1, verbose=FALSE), compress=NULL)
Arguments
design A survey object
sample.margins list of formulas or data frames describing sample margins, which must not con-tain missing values
population.margins
list of tables or data frames describing corresponding population margins
control maxit controls the number of iterations. Convergence is declared if the maxi-mum change in a table entry is less than epsilon. If epsilon<1 it is taken to bea fraction of the total sampling weight.
compress If design has replicate weights, attempt to compress the new replicate weightmatrix? When NULL, will attempt to compress if the original weight matrix wascompressed
Details
The sample.margins should be in a format suitable for postStratify.
Raking (aka iterative proportional fitting) is known to converge for any table without zeros, andfor any table with zeros for which there is a joint distribution with the given margins and the samepattern of zeros. The ‘margins’ need not be one-dimensional.
The algorithm works by repeated calls to postStratify (iterative proportional fitting), which isefficient for large multiway tables. For small tables calibrate will be faster, and also allowsraking to population totals for continuous variables, and raking with bounded weights.
Value
A raked survey design.

rake 47
See Also
postStratify, compressWeights
calibrate for other ways to use auxiliary information.
Examples
data(api)dclus1 <- svydesign(id=~dnum, weights=~pw, data=apiclus1, fpc=~fpc)rclus1 <- as.svrepdesign(dclus1)
svymean(~api00, rclus1)svytotal(~enroll, rclus1)
## population marginal totals for each stratumpop.types <- data.frame(stype=c("E","H","M"), Freq=c(4421,755,1018))pop.schwide <- data.frame(sch.wide=c("No","Yes"), Freq=c(1072,5122))
rclus1r <- rake(rclus1, list(~stype,~sch.wide), list(pop.types, pop.schwide))
svymean(~api00, rclus1r)svytotal(~enroll, rclus1r)
## marginal totals correspond to populationxtabs(~stype, apipop)svytable(~stype, rclus1r, round=TRUE)xtabs(~sch.wide, apipop)svytable(~sch.wide, rclus1r, round=TRUE)
## joint totals don’t correspondxtabs(~stype+sch.wide, apipop)svytable(~stype+sch.wide, rclus1r, round=TRUE)
## Do it for a design without replicate weightsdclus1r<-rake(dclus1, list(~stype,~sch.wide), list(pop.types, pop.schwide))
svymean(~api00, dclus1r)svytotal(~enroll, dclus1r)
## compare to raking with calibrate()dclus1gr<-calibrate(dclus1, ~stype+sch.wide, pop=c(6194, 755,1018,5122),
calfun="raking")svymean(~stype+api00, dclus1r)svymean(~stype+api00, dclus1gr)
## compare to joint post-stratification## (only possible if joint population table is known)##pop.table <- xtabs(~stype+sch.wide,apipop)rclus1ps <- postStratify(rclus1, ~stype+sch.wide, pop.table)svytable(~stype+sch.wide, rclus1ps, round=TRUE)
svymean(~api00, rclus1ps)
48 regTermTest
svytotal(~enroll, rclus1ps)
## Example of raking with partial joint distributionspop.imp<-data.frame(comp.imp=c("No","Yes"),Freq=c(1712,4482))dclus1r2<-rake(dclus1, list(~stype+sch.wide, ~comp.imp),
list(pop.table, pop.imp))svymean(~api00, dclus1r2)
## compare to calibrate() syntax with tablesdclus1r2<-calibrate(dclus1, formula=list(~stype+sch.wide, ~comp.imp),
population=list(pop.table, pop.imp),calfun="raking")svymean(~api00, dclus1r2)
regTermTest Wald test for a term in a regression model
Description
Provides Wald test and working likelihood ratio (Rao-Scott) test of the hypothesis that all coeffi-cients associated with a particular regression term are zero (or have some other specified values).Particularly useful as a substitute for anova when not fitting by maximum likelihood. The Waldtests use a chisquared or F distribution, the LRT uses a linear combination of chisquared or F dis-tributions as in pchisqsum.
Usage
regTermTest(model, test.terms, null=NULL,df=NULL,method=c("Wald","LRT"), lrt.approximation="saddlepoint")
Arguments
model A model object with coef and vcov methods
test.terms Character string or one-sided formula giving name of term or terms to test
null Null hypothesis values for parameters. Default is zeros
df Denominator degrees of freedom for an F test. If NULL these are estimated fromthe model. Use Inf for a chi-squared test.
method If "Wald", the Wald-type test; if "LRT" the Rao-Scott test based on the estimatedlog likelihood ratio
lrt.approximation
method for approximating the distribution of the LRT statistic; see pchisqsum
Value
An object of class regTermTest or regTermTestLRT.

scd 49
References
Rao, JNK, Scott, AJ (1984) "On Chi-squared Tests For Multiway Contingency Tables with Propor-tions Estimated From Survey Data" Annals of Statistics 12:46-60.
Lumley T, Scott A (2012) "Partial likelihood ratio tests for the Cox model under complex sampling"Statistics in Medicine 17 JUL 2012. DOI: 10.1002/sim.5492
See Also
anova, vcov, contrasts,pchisqsum
Examples
data(esoph)model1 <- glm(cbind(ncases, ncontrols) ~ agegp + tobgp *
alcgp, data = esoph, family = binomial())anova(model1)
regTermTest(model1,"tobgp")regTermTest(model1,"tobgp:alcgp")regTermTest(model1, ~alcgp+tobgp:alcgp)
data(api)dclus2<-svydesign(id=~dnum+snum, weights=~pw, data=apiclus2)model2<-svyglm(I(sch.wide=="Yes")~ell+meals+mobility, design=dclus2, family=quasibinomial())regTermTest(model2, ~ell)regTermTest(model2, ~ell,df=NULL)regTermTest(model2, ~ell, method="LRT", df=Inf)regTermTest(model2, ~ell+meals, method="LRT", df=NULL)
scd Survival in cardiac arrest
Description
These data are from Section 12.2 of Levy and Lemeshow. They describe (a possibly apocryphal)study of survival in out-of-hospital cardiac arrest. Two out of five ambulance stations were sampledfrom each of three emergency service areas.
Usage
data(scd)
50 scd
Format
This data frame contains the following columns:
ESA Emergency Service Area (strata)
ambulance Ambulance station (PSU)
arrests estimated number of cardiac arrests
alive number reaching hospital alive
Source
Levy and Lemeshow. "Sampling of Populations" (3rd edition). Wiley.
Examples
data(scd)
## survey design objectsscddes<-svydesign(data=scd, prob=~1, id=~ambulance, strata=~ESA,nest=TRUE, fpc=rep(5,6))scdnofpc<-svydesign(data=scd, prob=~1, id=~ambulance, strata=~ESA,nest=TRUE)
# convert to BRR replicate weightsscd2brr <- as.svrepdesign(scdnofpc, type="BRR")# or to Rao-Wu bootstrapscd2boot <- as.svrepdesign(scdnofpc, type="subboot")
# use BRR replicate weights from Levy and Lemeshowrepweights<-2*cbind(c(1,0,1,0,1,0), c(1,0,0,1,0,1), c(0,1,1,0,0,1),c(0,1,0,1,1,0))scdrep<-svrepdesign(data=scd, type="BRR", repweights=repweights)
# ratio estimatessvyratio(~alive, ~arrests, design=scddes)svyratio(~alive, ~arrests, design=scdnofpc)svyratio(~alive, ~arrests, design=scd2brr)svyratio(~alive, ~arrests, design=scd2boot)svyratio(~alive, ~arrests, design=scdrep)
# or a logistic regressionsummary(svyglm(cbind(alive,arrests-alive)~1, family=quasibinomial, design=scdnofpc))summary(svyglm(cbind(alive,arrests-alive)~1, family=quasibinomial, design=scdrep))
# Because no sampling weights are given, can’t compute design effects# without replacement: use deff="replace"
svymean(~alive+arrests, scddes, deff=TRUE)svymean(~alive+arrests, scddes, deff="replace")

SE 51
SE Extract standard errors
Description
Extracts standard errors from an object. The default method is for objects with a vcov method.
Usage
SE(object, ...)## Default S3 method:SE(object,...)## S3 method for class ’svrepstat’SE(object,...)
Arguments
object An object
... Arguments for future expansion
Value
Vector of standard errors.
See Also
vcov
stratsample Take a stratified sample
Description
This function takes a stratified sample without replacement from a data set.
Usage
stratsample(strata, counts)
Arguments
strata Vector of stratum identifiers; will be coerced to character
counts named vector of stratum sample sizes, with names corresponding to the valuesof as.character(strata)

52 subset.survey.design
Value
vector of indices into strata giving the sample
See Also
sample
The "sampling" package has many more sampling algorithms.
Examples
data(api)s<-stratsample(apipop$stype, c("E"=5,"H"=4,"M"=2))table(apipop$stype[s])
subset.survey.design Subset of survey
Description
Restrict a survey design to a subpopulation, keeping the original design information about numberof clusters, strata. If the design has no post-stratification or calibration data the subset will useproportionately less memory.
Usage
## S3 method for class ’survey.design’subset(x, subset, ...)## S3 method for class ’svyrep.design’subset(x, subset, ...)
Arguments
x A survey design object
subset An expression specifying the subpopulation
... Arguments not used by this method
Value
A new survey design object
See Also
svydesign

surveyoptions 53
Examples
data(fpc)dfpc<-svydesign(id=~psuid,strat=~stratid,weight=~weight,data=fpc,nest=TRUE)dsub<-subset(dfpc,x>4)summary(dsub)svymean(~x,design=dsub)
## These should give the same domain estimates and standard errorssvyby(~x,~I(x>4),design=dfpc, svymean)summary(svyglm(x~I(x>4)+0,design=dfpc))
data(api)dclus1<-svydesign(id=~dnum, weights=~pw, data=apiclus1, fpc=~fpc)rclus1<-as.svrepdesign(dclus1)svymean(~enroll, subset(dclus1, sch.wide=="Yes" & comp.imp=="Yes"))svymean(~enroll, subset(rclus1, sch.wide=="Yes" & comp.imp=="Yes"))
surveyoptions Options for the survey package
Description
This help page documents the options that control the behaviour of the survey package.
Details
All the options for the survey package have names beginning with "survey". Four of them controlstandard error estimation.
options("survey.replicates.mse") controls the default in svrepdesign and as.svrepdesignfor computing variances. When options("survey.replicates.mse") is TRUE, the default is tocreate replicate weight designs that compute variances centered at the point estimate, rather than atthe mean of the replicates. The option can be overridden by specifying the mse argument explicitlyin svrepdesign and as.svrepdesign. The default is FALSE.
When options("survey.ultimate.cluster") is TRUE, standard error estimation is based on in-dependence of PSUs at the first stage of sampling, without using any information about subsequentstages. When FALSE, finite population corrections and variances are estimated recursively. Seesvyrecvar for more information. This option makes no difference unless first-stage finite popula-tion corrections are specified, in which case setting the option to TRUE gives the wrong answer fora multistage study. The only reason to use TRUE is for compatibility with other software that givesthe wrong answer.
Handling of strata with a single PSU that are not certainty PSUs is controlled by options("survey.lonely.psu").The default setting is "fail", which gives an error. Use "remove" to ignore that PSU for variancecomputation, "adjust" to center the stratum at the population mean rather than the stratum mean,and "average" to replace the variance contribution of the stratum by the average variance contri-bution across strata. As of version 3.4-2 as.svrepdesign also uses this option.
54 surveysummary
The variance formulas for domain estimation give well-defined, positive results when a stratum con-tains only one PSU with observations in the domain, but are not unbiased. If options("survey.adjust.domain.lonely")is TRUE and options("survey.lonely.psu") is "average" or "adjust" the same adjustment forlonely PSUs will be used within a domain. Note that this adjustment is not available for replicate-weight designs, nor (currently) for raked, post-stratified, or calibrated designs.
The fourth option is options("survey.want.obsolete"). This controls the warnings about usingthe deprecated pre-2.9.0 survey design objects.
The behaviour of replicate-weight designs for self-representing strata is controlled by options("survey.drop.replicates").When TRUE, various optimizations are used that take advantage of the fact that these strata do notcontribute to the variance. The only reason ever to use FALSE is if there is a bug in the code forthese optimizations.
The fifth option controls the use of multiple processors with the multicore package. This optionshould not affect the values computed by any of the survey functions. If TRUE, all functions thatare able to use multiple processors will do so by default. Using multiple processors may speedup calculations, but need not, especially if the computer is short on memory. The best strategy isprobably to experiment with explicitly requesting multicore=TRUE in functions that support it, tosee if there is an increase in speed before setting the global option.
surveysummary Summary statistics for sample surveys
Description
Compute means, variances, ratios and totals for data from complex surveys.
Usage
## S3 method for class ’survey.design’svymean(x, design, na.rm=FALSE,deff=FALSE,...)## S3 method for class ’twophase’svymean(x, design, na.rm=FALSE,deff=FALSE,...)## S3 method for class ’svyrep.design’svymean(x, design, na.rm=FALSE, rho=NULL,
return.replicates=FALSE, deff=FALSE,...)## S3 method for class ’survey.design’svyvar(x, design, na.rm=FALSE,...)## S3 method for class ’svyrep.design’svyvar(x, design, na.rm=FALSE, rho=NULL,
return.replicates=FALSE,...,estimate.only=FALSE)## S3 method for class ’survey.design’svytotal(x, design, na.rm=FALSE,deff=FALSE,...)## S3 method for class ’twophase’svytotal(x, design, na.rm=FALSE,deff=FALSE,...)## S3 method for class ’svyrep.design’svytotal(x, design, na.rm=FALSE, rho=NULL,
return.replicates=FALSE, deff=FALSE,...)

surveysummary 55
## S3 method for class ’svystat’coef(object,...)## S3 method for class ’svrepstat’coef(object,...)## S3 method for class ’svystat’vcov(object,...)## S3 method for class ’svrepstat’vcov(object,...)## S3 method for class ’svystat’confint(object, parm, level = 0.95,df =Inf,...)## S3 method for class ’svrepstat’confint(object, parm, level = 0.95,df =Inf,...)cv(object,...)deff(object, quietly=FALSE,...)make.formula(names)
Arguments
x A formula, vector or matrixdesign survey.design or svyrep.design objectna.rm Should cases with missing values be dropped?rho parameter for Fay’s variance estimator in a BRR designreturn.replicates
Return the replicate means?deff Return the design effect (see below)object The result of one of the other survey summary functionsquietly Don’t warn when there is no design effect computedestimate.only Don’t compute standard errors (useful when svyvar is used to estimate the de-
sign effect)parm a specification of which parameters are to be given confidence intervals, either
a vector of numbers or a vector of names. If missing, all parameters are consid-ered.
level the confidence level required.df degrees of freedom for t-distribution in confidence interval, use degf(design)
for number of PSUs minus number of strata... additional arguments to methods,not currently usednames vector of character strings
Details
These functions perform weighted estimation, with each observation being weighted by the inverseof its sampling probability. Except for the table functions, these also give precision estimates thatincorporate the effects of stratification and clustering.
Factor variables are converted to sets of indicator variables for each category in computing meansand totals. Combining this with the interaction function, allows crosstabulations. See ftable.svystatfor formatting the output.

56 surveysummary
With na.rm=TRUE, all cases with missing data are removed. With na.rm=FALSE cases with miss-ing data are not removed and so will produce missing results. When using replicate weights andna.rm=FALSE it may be useful to set options(na.action="na.pass"), otherwise all replicateswith any missing results will be discarded.
The svytotal and svreptotal functions estimate a population total. Use predict on svyratioand svyglm, to get ratio or regression estimates of totals.
svyvar estimates the population variance. The object returned includes the full matrix of estimatedpopulation variances and covariances, but by default only the diagonal elements are printed. Todisplay the whole matrix use as.matrix(v) or print(v,covariance=TRUE).
The design effect compares the variance of a mean or total to the variance from a study of thesame size using simple random sampling without replacement. Note that the design effect will beincorrect if the weights have been rescaled so that they are not reciprocals of sampling probabilities.To obtain an estimate of the design effect comparing to simple random sampling with replacement,which does not have this requirement, use deff="replace". This with-replacement design effectis the square of Kish’s "deft".
The design effect for a subset of a design conditions on the size of the subset. That is, it comparesthe variance of the estimate to the variance of an estimate based on a simple random sample of thesame size as the subset, taken from the subpopulation. So, for example, under stratified randomsampling the design effect in a subset consisting of a single stratum will be 1.0.
The cv function computes the coefficient of variation of a statistic such as ratio, mean or total. Thedefault method is for any object with methods for SE and coef.
make.formula makes a formula from a vector of names. This is useful because formulas as the bestway to specify variables to the survey functions.
Value
Objects of class "svystat" or "svrepstat", which are vectors with a "var" attribute giving thevariance and a "statistic" attribute giving the name of the statistic.
These objects have methods for vcov, SE, coef, confint, svycontrast.
Author(s)
Thomas Lumley
See Also
svydesign, as.svrepdesign, svrepdesign for constructing design objects.
degf to extract degrees of freedom from a design.
svyquantile for quantiles
ftable.svystat for more attractive tables
svyciprop for more accurate confidence intervals for proportions near 0 or 1.
svyttest for comparing two means.
svycontrast for linear and nonlinear functions of estimates.

surveysummary 57
Examples
data(api)
## one-stage cluster sampledclus1<-svydesign(id=~dnum, weights=~pw, data=apiclus1, fpc=~fpc)
svymean(~api00, dclus1, deff=TRUE)svymean(~factor(stype),dclus1)svymean(~interaction(stype, comp.imp), dclus1)svyquantile(~api00, dclus1, c(.25,.5,.75))svytotal(~enroll, dclus1, deff=TRUE)svyratio(~api.stu, ~enroll, dclus1)
v<-svyvar(~api00+api99, dclus1)vprint(v, cov=TRUE)as.matrix(v)
# replicate weights - jackknife (this is slower)dstrat<-svydesign(id=~1,strata=~stype, weights=~pw,
data=apistrat, fpc=~fpc)jkstrat<-as.svrepdesign(dstrat)
svymean(~api00, jkstrat)svymean(~factor(stype),jkstrat)svyvar(~api00+api99,jkstrat)
svyquantile(~api00, jkstrat, c(.25,.5,.75))svytotal(~enroll, jkstrat)svyratio(~api.stu, ~enroll, jkstrat)
# coefficients of variationcv(svytotal(~enroll,dstrat))cv(svyratio(~api.stu, ~enroll, jkstrat))
# extracting information from the resultscoef(svytotal(~enroll,dstrat))vcov(svymean(~api00+api99,jkstrat))SE(svymean(~enroll, dstrat))confint(svymean(~api00+api00, dclus1))confint(svymean(~api00+api00, dclus1), df=degf(dclus1))
# Design effectsvymean(~api00, dstrat, deff=TRUE)svymean(~api00, dstrat, deff="replace")svymean(~api00, jkstrat, deff=TRUE)svymean(~api00, jkstrat, deff="replace")(a<-svytotal(~enroll, dclus1, deff=TRUE))deff(a)

58 svrepdesign
svrepdesign Specify survey design with replicate weights
Description
Some recent large-scale surveys specify replication weights rather than the sampling design (partlyfor privacy reasons). This function specifies the data structure for such a survey.
Usage
svrepdesign(variables , repweights , weights, data,...)## Default S3 method:svrepdesign(variables = NULL, repweights = NULL, weights = NULL, data =NULL, type = c("BRR", "Fay", "JK1","JKn","bootstrap","other"),combined.weights=TRUE, rho = NULL, bootstrap.average=NULL,scale=NULL, rscales=NULL,fpc=NULL, fpctype=c("fraction","correction"),mse=getOption("survey.replicates.mse"),...)## S3 method for class ’imputationList’svrepdesign(variables=NULL, repweights,weights,data,mse=getOption("survey.replicates.mse"),...)## S3 method for class ’character’svrepdesign(variables=NULL,repweights=NULL, weights=NULL,data=NULL,type=c("BRR","Fay","JK1", "JKn","bootstrap","other"),combined.weights=TRUE, rho=NULL,bootstrap.average=NULL, scale=NULL,rscales=NULL,fpc=NULL,fpctype=c("fraction","correction"),mse=getOption("survey.replicates.mse"),dbtype="SQLite", dbname,...)
## S3 method for class ’svyrep.design’image(x, ..., col=grey(seq(.5,1,length=30)), type.=c("rep","total"))
Arguments
variables formula or data frame specifying variables to include in the design (default isall)
repweights formula or data frame specifying replication weights, or character string spec-ifying a regular expression that matches the names of the replication weightvariables
weights sampling weights
data data frame to look up variables in formulas, or character string giving name ofdatabase table
type Type of replication weightscombined.weights
TRUE if the repweights already include the sampling weights. This is usuallythe case.
rho Shrinkage factor for weights in Fay’s method

svrepdesign 59
bootstrap.average
For type="bootstrap", if the bootstrap weights have been averaged, gives thenumber of iterations averaged over
scale, rscales Scaling constant for variance, see Details below
fpc,fpctype Finite population correction information
mse If TRUE, compute variances based on sum of squares around the point estimate,rather than the mean of the replicates
dbname name of database, passed to DBI::dbConnect()
dbtype Database driver: see Details
x survey design with replicate weights
... Other arguments to image
col Colors
type. "rep" for only the replicate weights, "total" for the replicate and samplingweights combined.
Details
In the BRR method, the dataset is split into halves, and the difference between halves is used toestimate the variance. In Fay’s method, rather than removing observations from half the samplethey are given weight rho in one half-sample and 2-rho in the other. The ideal BRR analysis isrestricted to a design where each stratum has two PSUs, however, it has been used in a much widerclass of surveys.
The JK1 and JKn types are both jackknife estimators deleting one cluster at a time. JKn is designedfor stratified and JK1 for unstratified designs.
Averaged bootstrap weights ("mean bootstrap") are used for some surveys from Statistics Canada.Yee et al (1999) describe their construction and use for one such survey.
The variance is computed as the sum of squared deviations of the replicates from their mean. Thismay be rescaled: scale is an overall multiplier and rscales is a vector of replicate-specific mul-tipliers for the squared deviations. That is, rscales should have one entry for each column ofrepweights If thereplication weights incorporate the sampling weights (combined.weights=TRUE)or for type="other" these must be specified, otherwise they can be guessed from the weights.
A finite population correction may be specified for type="other", type="JK1" and type="JKn".fpc must be a vector with one entry for each replicate. To specify sampling fractions use fpctype="fraction"and to specify the correction directly use fpctype="correction"
repweights may be a character string giving a regular expression for the replicate weight vari-ables. For example, in the California Health Interview Survey public-use data, the sampling weightsare "rakedw0" and the replicate weights are "rakedw1" to "rakedw80". The regular expression"rakedw[1-9]" matches the replicate weight variables (and not the sampling weight variable).
data may be a character string giving the name of a table or view in a relational database that can beaccessed through the DBI or ODBC interfaces. For DBI interfaces dbtype should be the name of thedatabase driver and dbname should be the name by which the driver identifies the specific database(eg file name for SQLite). For ODBC databases dbtype should be "ODBC" and dbname should bethe registed DSN for the database. On the Windows GUI, dbname="" will produce a dialog box forinteractive selection.
60 svrepdesign
The appropriate database interface package must already be loaded (eg RSQLite for SQLite, RODBCfor ODBC). The survey design object will contain the replicate weights, but actual variables will beloaded from the database only as needed. Use close to close the database connection and open toreopen the connection, eg, after loading a saved object.
The database interface does not attempt to modify the underlying database and so can be used withread-only permissions on the database.
To generate your own replicate weights either use as.svrepdesign on a survey.design object, orsee brrweights, bootweights, jk1weights and jknweights
The model.frame method extracts the observed data.
Value
Object of class svyrep.design, with methods for print, summary, weights, image.
Note
To use replication-weight analyses on a survey specified by sampling design, use as.svrepdesignto convert it.
Note
The successive difference weights in the American Community Survey use scale = 4/ncol(repweights)and rscales=rep(1, ncol(repweights). JK2 weights use scale=1, rscales=rep(1, ncol(repweights))
References
Levy and Lemeshow. "Sampling of Populations". Wiley.
Shao and Tu. "The Jackknife and Bootstrap." Springer.
Yee et al (1999). Bootstrat Variance Estimation for the National Population Health Survey. Proceed-ings of the ASA Survey Research Methodology Section. http://www.amstat.org/Sections/Srms/Proceedings/papers/1999_136.pdf
See Also
as.svrepdesign, svydesign, brrweights, bootweights
Examples
data(scd)# use BRR replicate weights from Levy and Lemeshowrepweights<-2*cbind(c(1,0,1,0,1,0), c(1,0,0,1,0,1), c(0,1,1,0,0,1),c(0,1,0,1,1,0))scdrep<-svrepdesign(data=scd, type="BRR", repweights=repweights, combined.weights=FALSE)svyratio(~alive, ~arrests, scdrep)
## Not run:## Needs RSQLitelibrary(RSQLite)db_rclus1<-svrepdesign(weights=~pw, repweights="wt[1-9]+", type="JK1", scale=(1-15/757)*14/15,

svrVar 61
data="apiclus1rep",dbtype="SQLite", dbname=system.file("api.db",package="survey"), combined=FALSE)svymean(~api00+api99,db_rclus1)
summary(db_rclus1)
## closing and re-opening a connectionclose(db_rclus1)db_rclus1try(svymean(~api00+api99,db_rclus1))db_rclus1<-open(db_rclus1)svymean(~api00+api99,db_rclus1)
## End(Not run)
svrVar Compute variance from replicates
Description
Compute an appropriately scaled empirical variance estimate from replicates. The mse argumentspecifies whether the sums of squares should be centered at the point estimate (mse=TRUE) or themean of the replicates. It is usually taken from the mse component of the design object.
Usage
svrVar(thetas, scale, rscales, na.action=getOption("na.action"), mse=getOption("survey.replicates.mse"),coef)
Arguments
thetas matrix whose rows are replicates (or a vector of replicates)scale Overall scaling factorrscales Scaling factor for each squared deviationna.action How to handle replicates where the statistic could not be estimatedmse if TRUE, center at the point estimated, if FALSE center at the mean of the repli-
catescoef The point estimate, required only if mse==TRUE
Value
covariance matrix.
See Also
svrepdesign, as.svrepdesign, brrweights, jk1weights, jknweights

62 svyby
svy.varcoef Sandwich variance estimator for glms
Description
Computes the sandwich variance estimator for a generalised linear model fitted to data from acomplex sample survey. Designed to be used internally by svyglm.
Usage
svy.varcoef(glm.object, design)
Arguments
glm.object A glm object
design A survey.design object
Value
A variance matrix
Author(s)
Thomas Lumley
See Also
svyglm,svydesign, svyCprod
svyby Survey statistics on subsets
Description
Compute survey statistics on subsets of a survey defined by factors.
Usage
svyby(formula, by ,design,...)## Default S3 method:svyby(formula, by, design, FUN, ..., deff=FALSE,keep.var = TRUE,keep.names = TRUE,verbose=FALSE, vartype=c("se","ci","ci","cv","cvpct","var"),drop.empty.groups=TRUE, covmat=FALSE, return.replicates=FALSE,na.rm.by=FALSE, na.rm.all=FALSE, multicore=getOption("survey.multicore"))
## S3 method for class ’svyby’SE(object,...)

svyby 63
## S3 method for class ’svyby’deff(object,...)## S3 method for class ’svyby’coef(object,...)## S3 method for class ’svyby’confint(object, parm, level = 0.95,df =Inf,...)unwtd.count(x, design, ...)
Arguments
formula,x A formula specifying the variables to pass to FUN (or a matrix, data frame, orvector)
by A formula specifying factors that define subsets, or a list of factors.
design A svydesign or svrepdesign object
FUN A function taking a formula and survey design object as its first two arguments.
... Other arguments to FUN
deff Request a design effect from FUN
keep.var If FUN returns a svystat object, extract standard errors from it
keep.names Define row names based on the subsets
verbose If TRUE, print a label for each subset as it is processed.
vartype Report variability as one or more of standard error, confidence interval, coeffi-cient of variation, percent coefficient of variation, or variance
drop.empty.groups
If FALSE, report NA for empty groups, if TRUE drop them from the output
na.rm.by If true, omit groups defined by NA values of the by variables.
na.rm.all If true, check for groups with no non-missing observations for variables definedby formula and treat these groups as empty
covmat If TRUE, compute covariances between estimates for different subsets (currentlyonly for replicate-weight designs). Allows svycontrast to be used on output.
return.replicates
Only for replicate-weight designs. If TRUE, return all the replicates as the "repli-cates" attribute of the result
multicore Use multicore package to distribute subsets over multiple processors?
parm a specification of which parameters are to be given confidence intervals, eithera vector of numbers or a vector of names. If missing, all parameters are consid-ered.
level the confidence level required.
df degrees of freedom for t-distribution in confidence interval, use degf(design)for number of PSUs minus number of strata
object An object of class "svyby"

64 svyby
Details
The variance type "ci" asks for confidence intervals, which are produced by confint. In some casesadditional options to FUN will be needed to produce confidence intervals, for example, svyquantileneeds ci=TRUE or keep.var=FALSE.
unwtd.count is designed to be passed to svyby to report the number of non-missing observationsin each subset. Observations with exactly zero weight will also be counted as missing, since that’show subsets are implemented for some designs.
Parallel processing with multicore=TRUE is useful only for fairly large problems and on computerswith sufficient memory. The multicore package is incompatible with some GUIs, although theMac Aqua GUI appears to be safe.
Value
An object of class "svyby": a data frame showing the factors and the results of FUN.
For unwtd.count, the unweighted number of non-missing observations in the data matrix specifiedby x for the design.
Note
The function works by making a lot of calls of the form FUN(formula, subset(design, by==i)),where formula is re-evaluated in each subset, so it is unwise to use data-dependent terms informula. In particular, svyby(~factor(a), ~b, design=d, svymean), will create factorvariables whose levels are only those values of a present in each subset. Use update.survey.designto add variables to the design object instead.
Note
Asking for a design effect (deff=TRUE) from a function that does not produce one will cause an erroror incorrect formatting of the output. The same will occur with keep.var=TRUE if the function doesnot compute a standard error.
See Also
svytable and ftable.svystat for contingency tables, ftable.svyby for pretty-printing of svyby
Examples
data(api)dclus1<-svydesign(id=~dnum, weights=~pw, data=apiclus1, fpc=~fpc)
svyby(~api99, ~stype, dclus1, svymean)svyby(~api99, ~stype, dclus1, svyquantile, quantiles=0.5,ci=TRUE,vartype="ci")## without ci=TRUE svyquantile does not compute standard errorssvyby(~api99, ~stype, dclus1, svyquantile, quantiles=0.5, keep.var=FALSE)svyby(~api99, list(school.type=apiclus1$stype), dclus1, svymean)svyby(~api99+api00, ~stype, dclus1, svymean, deff=TRUE,vartype="ci")svyby(~api99+api00, ~stype+sch.wide, dclus1, svymean, keep.var=FALSE)## report raw number of observationssvyby(~api99+api00, ~stype+sch.wide, dclus1, unwtd.count, keep.var=FALSE)

svycdf 65
rclus1<-as.svrepdesign(dclus1)
svyby(~api99, ~stype, rclus1, svymean)svyby(~api99, ~stype, rclus1, svyquantile, quantiles=0.5)svyby(~api99, list(school.type=apiclus1$stype), rclus1, svymean, vartype="cv")svyby(~enroll,~stype, rclus1,svytotal, deff=TRUE)svyby(~api99+api00, ~stype+sch.wide, rclus1, svymean, keep.var=FALSE)##report raw number of observationssvyby(~api99+api00, ~stype+sch.wide, rclus1, unwtd.count, keep.var=FALSE)
## comparing subgroups using covmat=TRUEmns<-svyby(~api99, ~stype, rclus1, svymean,covmat=TRUE)vcov(mns)svycontrast(mns, c(E = 1, M = -1))
str(svyby(~api99, ~stype, rclus1, svymean,return.replicates=TRUE))
## extractor functions(a<-svyby(~enroll, ~stype, rclus1, svytotal, deff=TRUE, verbose=TRUE, vartype=c("se","cv","cvpct","var")))deff(a)SE(a)cv(a)coef(a)confint(a, df=degf(rclus1))
## ratio estimatessvyby(~api.stu, by=~stype, denominator=~enroll, design=dclus1, svyratio)
## empty groupssvyby(~api00,~comp.imp+sch.wide,design=dclus1,svymean)svyby(~api00,~comp.imp+sch.wide,design=dclus1,svymean,drop.empty.groups=FALSE)
svycdf Cumulative Distribution Function
Description
Estimates the population cumulative distribution function for specified variables. In contrast tosvyquantile, this does not do any interpolation: the result is a right-continuous step function.
Usage
svycdf(formula, design, na.rm = TRUE,...)## S3 method for class ’svycdf’print(x,...)## S3 method for class ’svycdf’plot(x,xlab=NULL,...)
66 svyciprop
Arguments
formula one-sided formula giving variables from the design object
design survey design object
na.rm remove missing data (case-wise deletion)?
... other arguments to plot.stepfun
x object of class svycdf
xlab a vector of x-axis labels or NULL for the default labels
Value
An object of class svycdf, which is a list of step functions (of class stepfun)
See Also
svyquantile, svyhist, plot.stepfun
Examples
data(api)dstrat <- svydesign(id = ~1, strata = ~stype, weights = ~pw, data = apistrat,
fpc = ~fpc)cdf.est<-svycdf(~enroll+api00+api99, dstrat)cdf.est## functioncdf.est[[1]]## evaluate the functioncdf.est[[1]](800)cdf.est[[2]](800)
## compare to population and sample CDFs.opar<-par(mfrow=c(2,1))cdf.pop<-ecdf(apipop$enroll)cdf.samp<-ecdf(apistrat$enroll)plot(cdf.pop,main="Population vs sample", xlab="Enrollment")lines(cdf.samp,col.points="red")
plot(cdf.pop, main="Population vs estimate", xlab="Enrollment")lines(cdf.est[[1]],col.points="red")
par(opar)
svyciprop Confidence intervals for proportions
Description
Computes confidence intervals for proportions using methods that may be more accurate near 0 and1 than simply using confint(svymean()).
svyciprop 67
Usage
svyciprop(formula, design, method = c("logit", "likelihood", "asin", "beta","mean"), level = 0.95, df=degf(design),...)
Arguments
formula Model formula specifying a single binary variable
design survey design object
method See Details below. Partial matching is done on the argument.
level Confidence level for interval
df denominator degrees of freedom, for all methods except "beta". Use Inf forconfidence intervals based on a Normal distribution, and for "likelihood" and"logit" use NULL for the default method in glms (currently degf(design)-1,but this may be improved in the future)
... For "mean" and "asin", this is passed to confint.svystat
Details
The "logit" method fits a logistic regression model and computes a Wald-type interval on thelog-odds scale, which is then transformed to the probability scale.
The "likelihood" method uses the (Rao-Scott) scaled chi-squared distribution for the loglikeli-hood from a binomial distribution.
The "asin" method uses the variance-stabilising transformation for the binomial distribution, thearcsine square root, and then back-transforms the interval to the probability scale
The "beta" method uses the incomplete beta function as in binom.test, with an effective samplesize based on the estimated variance of the proportion. (Korn and Graubard, 1998)
The "mean" method is a Wald-type interval on the probability scale, the same as confint(svymean())
All methods undercover for probabilities close enough to zero or one, but "beta", "likelihood"and "logit" are noticeably better than the other two. None of the methods will work when theobserved proportion is exactly 0 or 1.
The confint method extracts the confidence interval; the vcov and SE methods just report thevariance or standard error of the mean.
Value
The point estimate of the proportion, with the confidence interval as an attribute
References
Rao, JNK, Scott, AJ (1984) "On Chi-squared Tests For Multiway Contingency Tables with Propor-tions Estimated From Survey Data" Annals of Statistics 12:46-60.
Korn EL, Graubard BI. (1998) Confidence Intervals For Proportions With Small Expected Numberof Positive Counts Estimated From Survey Data. Survey Methodology 23:193-201.

68 svycontrast
See Also
svymean
Examples
data(api)dclus1<-svydesign(id=~dnum, fpc=~fpc, data=apiclus1)
svyciprop(~I(ell==0), dclus1, method="li")svyciprop(~I(ell==0), dclus1, method="lo")svyciprop(~I(ell==0), dclus1, method="as")svyciprop(~I(ell==0), dclus1, method="be")svyciprop(~I(ell==0), dclus1, method="me")## reproduces Stata svy: meansvyciprop(~I(ell==0), dclus1, method="me", df=degf(dclus1))## reproduces Stata svy: propsvyciprop(~I(ell==0), dclus1, method="lo", df=degf(dclus1))
rclus1<-as.svrepdesign(dclus1)svyciprop(~I(emer==0), rclus1, method="li")svyciprop(~I(emer==0), rclus1, method="lo")svyciprop(~I(emer==0), rclus1, method="as")svyciprop(~I(emer==0), rclus1, method="be")svyciprop(~I(emer==0), rclus1, method="me")
svycontrast Linear and nonlinearconstrasts of survey statistics
Description
Computes linear or nonlinear contrasts of estimates produced by survey functions (or any objectwith coef and vcov methods).
Usage
svycontrast(stat, contrasts, ...)
Arguments
stat object of class svrepstat or svystat
contrasts A vector or list of vectors of coefficients, or a call or list of calls
... For future expansion

svycoplot 69
Details
If contrasts is a list, the element names are used as names for the returned statistics.
If an element of contrasts is shorter than coef(stat) and has names, the names are used to matchup the vectors and the remaining elements of contrasts are assumed to be zero. If the names arenot legal variable names (eg 0.1) they must be quoted (eg "0.1")
If contrasts is a "call" or list of "call"s, the delta-method is used to compute variances, andthe calls must use only functions that deriv knows how to differentiate. If the names are not legalvariable names they must be quoted with backticks (eg ‘0.1‘).
Value
Object of class svrepstat or svystat
See Also
regTermTest, svyglm
Examples
data(api)dclus1<-svydesign(id=~dnum, weights=~pw, data=apiclus1, fpc=~fpc)
a <- svytotal(~api00+enroll+api99, dclus1)svycontrast(a, list(avg=c(0.5,0,0.5), diff=c(1,0,-1)))## if contrast vectors have names, zeroes may be omittedsvycontrast(a, list(avg=c(api00=0.5,api99=0.5), diff=c(api00=1,api99=-1)))
## nonlinear contrastssvycontrast(a, quote(api00/api99))svyratio(~api00, ~api99, dclus1)
## Example: standardised skewness coefficientmoments<-svymean(~I(api00^3)+I(api00^2)+I(api00), dclus1)svycontrast(moments, quote((‘I(api00^3)‘-3*‘I(api00^2)‘*‘I(api00)‘+3*‘I(api00)‘*‘I(api00)‘^2-‘I(api00)‘^3)/(‘I(api00^2)‘-‘I(api00)‘^2)^1.5))
svycoplot Conditioning plots of survey data
Description
Draws conditioned scatterplots (’Trellis’ plots) of survey data using hexagonal binning or trans-parency.
Usage
svycoplot(formula, design, style = c("hexbin", "transparent"), basecol ="black", alpha = c(0, 0.8),hexscale=c("relative","absolute"), ...)

70 svycoplot
Arguments
formula A graph formula suitable for xyplot
design A survey design object
style Hexagonal binning or transparent color?
basecol The fully opaque ’base’ color for creating transparent colors. This may also bea function; see svyplot for details
alpha Minimum and maximum opacity
hexscale Scale hexagons separate for each panel (relative) or across all panels (absolute)
... Other arguments passed to grid.hexagons or xyplot
Value
An object of class trellis
Note
As with all ’Trellis’ graphs, this function creates an object but does not draw the graph. When usedinside a function or non-interactively you need to print() the result to create the graph.
See Also
svyplot
Examples
data(api)dclus2<-svydesign(id=~dnum+snum, weights=~pw,
data=apiclus2, fpc=~fpc1+fpc2)
svycoplot(api00~api99|sch.wide*comp.imp, design=dclus2, style="hexbin")svycoplot(api00~api99|sch.wide*comp.imp, design=dclus2, style="hexbin", hexscale="absolute")
svycoplot(api00~api99|sch.wide, design=dclus2, style="trans")
svycoplot(api00~meals|stype,design=dclus2,style="transparent",basecol=function(d) c("darkred","purple","forestgreen")[as.numeric(d$stype)],alpha=c(0,1))

svycoxph 71
svycoxph Survey-weighted Cox models.
Description
Fit a proportional hazards model to data from a complex survey design.
Usage
svycoxph(formula, design,subset=NULL, ...)## S3 method for class ’svycoxph’predict(object, newdata, se=FALSE,
type=c("lp", "risk", "expected", "terms","curve"),...)
Arguments
formula Model formula. Any cluster() terms will be ignored.
design survey.design object. Must contain all variables in the formula
subset Expression to select a subpopulation
object A svycoxph object
newdata New data for prediction
se Compute standard errors? This takes a lot of memory for type="curve"
type "curve" does predicted survival curves. The other values are passed to predict.coxph()
... Other arguments passed to coxph.
Details
The main difference between svycoxph function and the robust=TRUE option to coxph in the sur-vival package is that this function accounts for the reduction in variance from stratified samplingand the increase in variance from having only a small number of clusters.
Note that strata terms in the model formula describe subsets that have a separate baseline hazardfunction and need not have anything to do with the stratification of the sampling.
The standard errors for predicted survival curves are available only by linearization, not by repli-cate weights (at the moment). Use withReplicates to get standard errors with replicate weights.Predicted survival curves are not available for stratified Cox models.
The standard errors use the delta-method approach of Williams (1995) for the Nelson-Aalen estima-tor, modified to handle the Cox model following Tsiatis (1981). The standard errors agree closelywith survfit.coxph for independent sampling when the model fits well, but are larger when themodel fits poorly. I believe the standard errors are equivalent to those of Lin (2000), but I don’tknow of any implementation that would allow a check.
Value
An object of class svycoxph for svycoxph, an object of class svykm or svykmlist for predict(,type="curve").

72 svycoxph
Warning
The standard error calculation for survival curves uses memory proportional to the sample sizetimes the square of the number of events.
Author(s)
Thomas Lumley
References
Binder DA. (1992) Fitting Cox’s proportional hazards models from survey data. Biometrika 79:139-147
Lin D-Y (2000) On fitting Cox’s proportional hazards model to survey data. Biometrika 87: 37-47
Tsiatis AA (1981) A Large Sample Study of Cox’s Regression Model. Annals of Statistics 9(1)93-108
Williams RL (1995) "Product-Limit Survival Functions with Correlated Survival Times" LifetimeData Analysis 1: 171–186
See Also
coxph, predict.coxph
svykm for estimation of Kaplan-Meier survival curves and for methods that operate on survivalcurves.
regTermTest for Wald and (Rao-Scott) likelihood ratio tests for one or more parameters.
Examples
## Somewhat unrealistic example of nonresponse bias.data(pbc, package="survival")
pbc$randomized<-with(pbc, !is.na(trt) & trt>0)biasmodel<-glm(randomized~age*edema,data=pbc,family=binomial)pbc$randprob<-fitted(biasmodel)if (is.null(pbc$albumin)) pbc$albumin<-pbc$alb ##pre2.9.0
dpbc<-svydesign(id=~1, prob=~randprob, strata=~edema, data=subset(pbc,randomized))rpbc<-as.svrepdesign(dpbc)
(model<-svycoxph(Surv(time,status>0)~log(bili)+protime+albumin,design=dpbc))
svycoxph(Surv(time,status>0)~log(bili)+protime+albumin,design=rpbc)
s<-predict(model,se=TRUE, type="curve",newdata=data.frame(bili=c(3,9), protime=c(10,10), albumin=c(3.5,3.5)))
plot(s[[1]],ci=TRUE,col="sienna")lines(s[[2]], ci=TRUE,col="royalblue")quantile(s[[1]], ci=TRUE)confint(s[[2]], parm=365*(1:5))

svyCprod 73
svyCprod Computations for survey variances
Description
Computes the sum of products needed for the variance of survey sample estimators. svyCprodis used for survey design objects from before version 2.9, onestage is called by svyrecvar forpost-2.9 design objects.
Usage
svyCprod(x, strata, psu, fpc, nPSU,certainty=NULL, postStrata=NULL,lonely.psu=getOption("survey.lonely.psu"))
onestage(x, strata, clusters, nPSU, fpc,lonely.psu=getOption("survey.lonely.psu"),stage=0,cal)
Arguments
x A vector or matrix
strata A vector of stratum indicators (may be NULL for svyCprod)
psu A vector of cluster indicators (may be NULL)
clusters A vector of cluster indicators
fpc A data frame (svyCprod) or vector (onestage) of population stratum sizes, orNULL
nPSU Table (svyprod) or vector (onestage) of original sample stratum sizes (or NULL)
certainty logical vector with stratum names as names. If TRUE and that stratum has asingle PSU it is a certainty PSU
postStrata Post-stratification variables
lonely.psu One of "remove", "adjust", "fail", "certainty", "average". See Detailsbelow
stage Used internally to track the depth of recursion
cal Used to pass calibration information at stages below the population
Details
The observations for each cluster are added, then centered within each stratum and the outer productis taken of the row vector resulting for each cluster. This is added within strata, multiplied by adegrees-of-freedom correction and by a finite population correction (if supplied) and added acrossstrata.
If there are fewer clusters (PSUs) in a stratum than in the original design extra rows of zeroes areadded to x to allow the correct subpopulation variance to be computed.
See postStratify for information about post-stratification adjustments.
74 svyCprod
The variance formula gives 0/0 if a stratum contains only one sampling unit. If the certaintyargument specifies that this is a PSU sampled with probability 1 (a "certainty" PSU) then it doesnot contribute to the variance (this is correct only when there is no subsampling within the PSU –otherwise it should be defined as a pseudo-stratum). If certainty is FALSE for this stratum or isnot supplied the result depends on lonely.psu.
The options are "fail" to give an error, "remove" or "certainty" to give a variance contributionof 0 for the stratum, "adjust" to center the stratum at the grand mean rather than the stratum mean,and "average" to assign strata with one PSU the average variance contribution from strata withmore than one PSU. The choice is controlled by setting options(survey.lonely.psu). If this isnot done the factory default is "fail". Using "adjust" is conservative, and it would often be betterto combine strata in some intelligent way. The properties of "average" have not been investigatedthoroughly, but it may be useful when the lonely PSUs are due to a few strata having PSUs missingcompletely at random.
The "remove"and "certainty" options give the same result, but "certainty" is intended forsituations where there is only one PSU in the population stratum, which is sampled with certainty(also called ‘self-representing’ PSUs or strata). With "certainty" no warning is generated forstrata with only one PSU. Ordinarily, svydesign will detect certainty PSUs, making this optionunnecessary.
For strata with a single PSU in a subset (domain) the variance formula gives a value that is well-defined and positive, but not typically correct. If options("survey.adjust.domain.lonely") isTRUE and options("survey.lonely.psu") is "adjust" or "average", and no post-stratificationor G-calibration has been done, strata with a single PSU in a subset will be treated like those with asingle PSU in the sample. I am not aware of any theoretical study of this procedure, but it should atleast be conservative.
Value
A covariance matrix
Author(s)
Thomas Lumley
References
Binder, David A. (1983). On the variances of asymptotically normal estimators from complexsurveys. International Statistical Review, 51, 279- 292.
See Also
svydesign, svyrecvar, surveyoptions, postStratify

svydesign 75
svydesign Survey sample analysis.
Description
Specify a complex survey design.
Usage
svydesign(ids, probs=NULL, strata = NULL, variables = NULL, fpc=NULL,data = NULL, nest = FALSE, check.strata = !nest, weights=NULL,pps=FALSE,...)## Default S3 method:svydesign(ids, probs=NULL, strata = NULL, variables = NULL, fpc=NULL,data = NULL, nest = FALSE, check.strata = !nest, weights=NULL,pps=FALSE,variance=c("HT","YG"),...)## S3 method for class ’imputationList’svydesign(ids, probs = NULL, strata = NULL, variables = NULL,
fpc = NULL, data, nest = FALSE, check.strata = !nest, weights = NULL, pps=FALSE,...)
## S3 method for class ’character’svydesign(ids, probs = NULL, strata = NULL, variables = NULL,
fpc = NULL, data, nest = FALSE, check.strata = !nest, weights = NULL, pps=FALSE,dbtype = "SQLite", dbname, ...)
Arguments
ids Formula or data frame specifying cluster ids from largest level to smallest level,~0 or ~1 is a formula for no clusters.
probs Formula or data frame specifying cluster sampling probabilities
strata Formula or vector specifying strata, use NULL for no strata
variables Formula or data frame specifying the variables measured in the survey. If NULL,the data argument is used.
fpc Finite population correction: see Details below
weights Formula or vector specifying sampling weights as an alternative to prob
data Data frame to look up variables in the formula arguments, or database tablename, or imputationList object, see below
nest If TRUE, relabel cluster ids to enforce nesting within strata
check.strata If TRUE, check that clusters are nested in strata.
pps "brewer" to use Brewer’s approximation for PPS sampling without replace-ment. "overton" to use Overton’s approximation. An object of class HR to usethe Hartley-Rao approximation. An object of class ppsmat to use the Horvitz-Thompson estimator.
dbtype name of database driver to pass to dbDriver
dbname name of database (eg file name for SQLite)
76 svydesign
variance For pps without replacement, use variance="YG" for the Yates-Grundy estima-tor instead of the Horvitz-Thompson estimator
... for future expansion
Details
The svydesign object combines a data frame and all the survey design information needed toanalyse it. These objects are used by the survey modelling and summary functions. The id argumentis always required, the strata, fpc, weights and probs arguments are optional. If these variablesare specified they must not have any missing values.
By default, svydesign assumes that all PSUs, even those in different strata, have a unique value ofthe id variable. This allows some data errors to be detected. If your PSUs reuse the same identifiersacross strata then set nest=TRUE.
The finite population correction (fpc) is used to reduce the variance when a substantial fraction ofthe total population of interest has been sampled. It may not be appropriate if the target of inferenceis the process generating the data rather than the statistics of a particular finite population.
The finite population correction can be specified either as the total population size in each stratumor as the fraction of the total population that has been sampled. In either case the relevant populationsize is the sampling units. That is, sampling 100 units from a population stratum of size 500 can bespecified as 500 or as 100/500=0.2. The exception is for PPS sampling without replacement, wherethe sampling probability (which will be different for each PSU) must be used.
If population sizes are specified but not sampling probabilities or weights, the sampling probabilitieswill be computed from the population sizes assuming simple random sampling within strata.
For multistage sampling the id argument should specify a formula with the cluster identifiers ateach stage. If subsequent stages are stratified strata should also be specified as a formula withstratum identifiers at each stage. The population size for each level of sampling should also bespecified in fpc. If fpc is not specified then sampling is assumed to be with replacement at thetop level and only the first stage of cluster is used in computing variances. If fpc is specified butfor fewer stages than id, sampling is assumed to be complete for subsequent stages. The variancecalculations for multistage sampling assume simple or stratified random sampling within clusters ateach stage except possibly the last.
For PPS sampling without replacement it is necessary to specify the probabilities for each stageof sampling using the fpc arguments, and an overall weight argument should not be given. Atthe moment, multistage or stratified PPS sampling without replacement is supported only withpps="brewer", or by giving the full joint probability matrix using ppsmat. [Cluster sampling issupported by all methods, but not subsampling within clusters].
The dim, "[", "[<-" and na.action methods for survey.design objects operate on the dataframespecified by variables and ensure that the design information is properly updated to correspond tothe new data frame. With the "[<-" method the new value can be a survey.design object insteadof a data frame, but only the data frame is used. See also subset.survey.design for a simple wayto select subpopulations.
The model.frame method extracts the observed data.
If the strata with only one PSU are not self-representing (or they are, but svydesign cannot tellbased on fpc) then the handling of these strata for variance computation is determined by options("survey.lonely.psu").See svyCprod for details.

svydesign 77
data may be a character string giving the name of a table or view in a relational database that can beaccessed through the DBI or ODBC interfaces. For DBI interfaces dbtype should be the name of thedatabase driver and dbname should be the name by which the driver identifies the specific database(eg file name for SQLite). For ODBC databases dbtype should be "ODBC" and dbname should bethe registed DSN for the database. On the Windows GUI, dbname="" will produce a dialog box forinteractive selection.
The appropriate database interface package must already be loaded (eg RSQLite for SQLite, RODBCfor ODBC). The survey design object will contain only the design meta-data, and actual variableswill be loaded from the database as needed. Use close to close the database connection and opento reopen the connection, eg, after loading a saved object.
The database interface does not attempt to modify the underlying database and so can be used withread-only permissions on the database.
If data is an imputationList object (from the "mitools" package), svydesign will return asvyimputationList object containing a set of designs. Use with.svyimputationList to do anal-yses on these designs and MIcombine to combine the results.
Value
An object of class survey.design.
Author(s)
Thomas Lumley
See Also
as.svrepdesign for converting to replicate weight designs, subset.survey.design for domainestimates, update.survey.design to add variables.
mitools package for using multiple imputations
svyrecvar and svyCprod for details of variance estimation
election for examples of PPS sampling without replacement.
http://faculty.washington.edu/tlumley/survey/ for examples of database-backed objects.
Examples
data(api)# stratified sampledstrat<-svydesign(id=~1,strata=~stype, weights=~pw, data=apistrat, fpc=~fpc)# one-stage cluster sampledclus1<-svydesign(id=~dnum, weights=~pw, data=apiclus1, fpc=~fpc)# two-stage cluster sample: weights computed from population sizes.dclus2<-svydesign(id=~dnum+snum, fpc=~fpc1+fpc2, data=apiclus2)
## multistage sampling has no effect when fpc is not given, so## these are equivalent.dclus2wr<-svydesign(id=~dnum+snum, weights=weights(dclus2), data=apiclus2)dclus2wr2<-svydesign(id=~dnum, weights=weights(dclus2), data=apiclus2)
78 svyfactanal
## syntax for stratified cluster sample##(though the data weren’t really sampled this way)svydesign(id=~dnum, strata=~stype, weights=~pw, data=apistrat,nest=TRUE)
## PPS sampling without replacementdata(election)dpps<- svydesign(id=~1, fpc=~p, data=election_pps, pps="brewer")
##database example: requires RSQLite## Not run:library(RSQLite)dbclus1<-svydesign(id=~dnum, weights=~pw, fpc=~fpc,data="apiclus1",dbtype="SQLite", dbname=system.file("api.db",package="survey"))
## End(Not run)
svyfactanal Factor analysis in complex surveys (experimental).
Description
This function fits a factor analysis model or SEM, by maximum weighted likelihood.
Usage
svyfactanal(formula, design, factors, n = c("none", "sample", "degf","effective", "min.effective"), ...)
Arguments
formula Model formula specifying the variables to usedesign Survey design objectfactors Number of factors to estimaten Sample size to be used for testing: see below... Other arguments to pass to factanal.
Details
The population covariance matrix is estimated by svyvar and passed to factanal
Although fitting these models requires only the estimated covariance matrix, inference requires asample size. With n="sample", the sample size is taken to be the number of observations; withn="degf", the survey degrees of freedom as returned by degf. Using "sample" corresponds tostandardizing weights to have mean 1, and is known to result in anti-conservative tests.
The other two methods estimate an effective sample size for each variable as the sample size wherethe standard error of a variance of a Normal distribution would match the design-based standarderror estimated by svyvar. With n="min.effective" the minimum sample size across the vari-ables is used; with n="effective" the harmonic mean is used. For svyfactanal the test of modeladequacy is optional, and the default choice, n="none", does not do the test.

svyglm 79
Value
An object of class factanal
References
.
See Also
factanal
Examples
data(api)dclus1<-svydesign(id=~dnum, weights=~pw, data=apiclus1, fpc=~fpc)
svyfactanal(~api99+api00+hsg+meals+ell+emer, design=dclus1, factors=2)
svyfactanal(~api99+api00+hsg+meals+ell+emer, design=dclus1, factors=2, n="effective")
##Population dat for comparisonfactanal(~api99+api00+hsg+meals+ell+emer, data=apipop, factors=2)
svyglm Survey-weighted generalised linear models.
Description
Fit a generalised linear model to data from a complex survey design, with inverse-probabilityweighting and design-based standard errors.
Usage
## S3 method for class ’survey.design’svyglm(formula, design, subset=NULL, ...)## S3 method for class ’svyrep.design’svyglm(formula, design, subset=NULL, ..., rho=NULL,return.replicates=FALSE, na.action,multicore=getOption("survey.multicore"))## S3 method for class ’svyglm’summary(object, correlation = FALSE, df.resid=NULL,...)## S3 method for class ’svyglm’predict(object,newdata=NULL,total=NULL,
type=c("link","response","terms"),se.fit=(type != "terms"),vcov=FALSE,...)
## S3 method for class ’svrepglm’predict(object,newdata=NULL,total=NULL,

80 svyglm
type=c("link","response","terms"),se.fit=(type != "terms"),vcov=FALSE,return.replicates=!is.null(object$replicates),...)
Arguments
formula Model formula
design Survey design from svydesign or svrepdesign. Must contain all variables inthe formula
subset Expression to select a subpopulation
... Other arguments passed to glm or summary.glm
rho For replicate BRR designs, to specify the parameter for Fay’s variance method,giving weights of rho and 2-rho
return.replicates
Return the replicates as a component of the result? (for predict, only possibleif they were computed in the svyglm fit)
object A svyglm object
correlation Include the correlation matrix of parameters?
na.action Handling of NAs
multicore Use the multicore package to distribute replicates across processors?
df.resid Optional denominator degrees of freedom for Wald tests
newdata new data frame for prediction
total population size when predicting population total
type linear predictor (link) or response
se.fit if TRUE, return variances of predictions
vcov if TRUE and se=TRUE return full variance-covariance matrix of predictions
Details
There is no anova method for svyglm as the models are not fitted by maximum likelihood. Thefunction regTermTest may be useful for testing sets of regression terms.
For binomial and Poisson families use family=quasibinomial() and family=quasipoisson()to avoid a warning about non-integer numbers of successes. The ‘quasi’ versions of the familyobjects give the same point estimates and standard errors and do not give the warning.
If df.resid is not specified the df for the null model is computed by degf and the residual dfcomputed by subtraction. This is recommended by Korn and Graubard and is correct for PSU-levelcovariates but is potentially very conservative for individual-level covariates. To get tests based ona Normal distribution use df.resid=Inf, and to use number of PSUs-number of strata, specifydf.resid=degf(design).
Parallel processing with multicore=TRUE is helpful only for fairly large data sets and on computerswith sufficient memory. It may be incompatible with GUIs, although the Mac Aqua GUI appears tobe safe.

svyglm 81
predict gives fitted values and sampling variability for specific new values of covariates. Whennewdata are the population mean it gives the regression estimator of the mean, and when newdataare the population totals and total is specified it gives the regression estimator of the populationtotal. Regression estimators of mean and total can also be obtained with calibrate.
Value
svyglm returns an object of class svyglm. The predict method returns an object of class svystat
Author(s)
Thomas Lumley
See Also
glm, which is used to do most of the work.
regTermTest, for multiparameter tests
calibrate, for an alternative way to specify regression estimators of population totals or means
svyttest for one-sample and two-sample t-tests.
Examples
data(api)
dstrat<-svydesign(id=~1,strata=~stype, weights=~pw, data=apistrat, fpc=~fpc)dclus2<-svydesign(id=~dnum+snum, weights=~pw, data=apiclus2)rstrat<-as.svrepdesign(dstrat)rclus2<-as.svrepdesign(dclus2)
summary(svyglm(api00~ell+meals+mobility, design=dstrat))summary(svyglm(api00~ell+meals+mobility, design=dclus2))summary(svyglm(api00~ell+meals+mobility, design=rstrat))summary(svyglm(api00~ell+meals+mobility, design=rclus2))
## use quasibinomial, quasipoisson to avoid warning messagessummary(svyglm(sch.wide~ell+meals+mobility, design=dstrat,
family=quasibinomial()))
## Compare regression and ratio estimation of totalsapi.ratio <- svyratio(~api.stu,~enroll, design=dstrat)pop<-data.frame(enroll=sum(apipop$enroll, na.rm=TRUE))npop <- nrow(apipop)predict(api.ratio, pop$enroll)
## regression estimator is less efficientapi.reg <- svyglm(api.stu~enroll, design=dstrat)predict(api.reg, newdata=pop, total=npop)## same as calibration estimator

82 svyhist
svytotal(~api.stu, calibrate(dstrat, ~enroll, pop=c(npop, pop$enroll)))
## svyglm can also reproduce the ratio estimatorapi.reg2 <- svyglm(api.stu~enroll-1, design=dstrat,
family=quasi(link="identity",var="mu"))predict(api.reg2, newdata=pop, total=npop)
## higher efficiency by modelling variance betterapi.reg3 <- svyglm(api.stu~enroll-1, design=dstrat,
family=quasi(link="identity",var="mu^3"))predict(api.reg3, newdata=pop, total=npop)## true valuesum(apipop$api.stu)
svyhist Histograms and boxplots
Description
Histograms and boxplots weighted by the sampling weights.
Usage
svyhist(formula, design, breaks = "Sturges",include.lowest = TRUE, right = TRUE, xlab = NULL,main = NULL, probability = TRUE, freq = !probability, ...)
svyboxplot(formula, design, all.outliers=FALSE,...)
Arguments
formula One-sided formula for svyhist, two-sided for svyboxplot
design A survey design object
xlab x-axis label
main Main titleprobability,freq
Y-axis is probability density or frequency
all.outliers Show all outliers in the boxplot, not just extremes
breaks, include.lowest, right
As for hist
... Other arguments to hist or bxp

svykappa 83
Details
The histogram breakpoints are computed as if the sample were a simple random sample of the samesize.
The grouping variable in svyboxplot, if present, must be a factor.
The boxplot whiskers go to the maximum and minimum observations or to 1.5 interquartile rangesbeyond the end of the box, whichever is closer. The maximum and minimum are plotted as out-liers if they are beyond the ends of the whiskers, but other outlying points are not plotted unlessall.outliers=TRUE. svyboxplot requires a two-sided formula; use variable~1 for a single box-plot.
See Also
svyplot
Examples
data(api)dstrat <- svydesign(id = ~1, strata = ~stype, weights = ~pw, data = apistrat,
fpc = ~fpc)opar<-par(mfrow=c(1,3))svyhist(~enroll, dstrat, main="Survey weighted",col="purple",ylim=c(0,1.3e-3))hist(apistrat$enroll, main="Sample unweighted",col="purple",prob=TRUE,ylim=c(0,1.3e-3))hist(apipop$enroll, main="Population",col="purple",prob=TRUE,ylim=c(0,1.3e-3))
par(mfrow=c(1,1))svyboxplot(enroll~stype,dstrat,all.outliers=TRUE)svyboxplot(enroll~1,dstrat)par(opar)
svykappa Cohen’s kappa for agreement
Description
Computes the unweighted kappa measure of agreement between two raters and the standard error.The measurements must both be factor variables in the survey design object.
Usage
svykappa(formula, design, ...)
Arguments
formula one-sided formula giving two measurements
design survey design object
... for future expansion

84 svykm
Value
Object of class svystat
See Also
svycontrast
Examples
data(api)dclus1<-svydesign(id=~dnum, weights=~pw, data=apiclus1, fpc=~fpc)svykappa(~comp.imp+sch.wide, dclus1)
dclus1<-update(dclus1, stypecopy=stype)svykappa(~stype+stypecopy,dclus1)
svykm Estimate survival function.
Description
Estimates the survival function using a weighted Kaplan-Meier estimator.
Usage
svykm(formula, design,se=FALSE, ...)## S3 method for class ’svykm’plot(x,xlab="time",ylab="Proportion surviving",
ylim=c(0,1),ci=NULL,lty=1,...)## S3 method for class ’svykm’lines(x,xlab="time",type="s",ci=FALSE,lty=1,...)## S3 method for class ’svykmlist’plot(x, pars=NULL, ci=FALSE,...)## S3 method for class ’svykm’quantile(x, probs=c(0.75,0.5,0.25),ci=FALSE,level=0.95,...)## S3 method for class ’svykm’confint(object,parm,level=0.95,...)
Arguments
formula Two-sided formula. The response variable should be a right-censored Surv ob-ject
design survey design object
se Compute standard errors? This is slow for moderate to large data sets
... in plot and lines methods, graphical parameters
x a svykm or svykmlist object

svykm 85
xlab,ylab,ylim,type
as for plot
lty Line type, see par
ci Plot (or return, forquantile) the confidence interval
pars A list of vectors of graphical parameters for the separate curves in a svykmlistobject
object A svykm object
parm vector of times to report confidence intervals
level confidence level
probs survival probabilities for computing survival quantiles (note that these are thecomplement of the usual quantile input, so 0.9 means 90% surviving, not 90%dead)
Details
When standard errors are computed, the survival curve is actually the Aalen (hazard-based) estima-tor rather than the Kaplan-Meier estimator.
The standard error computations use memory proportional to the sample size times the square ofthe number of events. This can be a lot.
In the case of equal-probability cluster sampling without replacement the computations are essen-tially the same as those of Williams (1995), and the same linearization strategy is used for otherdesigns.
Confidence intervals are computed on the log(survival) scale, following the default in survivalpackage, which was based on simulations by Link(1984).
Confidence intervals for quantiles use Woodruff’s method: the interval is the intersection of thehorizontal line at the specified quantile with the pointwise confidence band around the survivalcurve.
Value
For svykm, an object of class svykm for a single curve or svykmlist for multiple curves.
References
Link, C. L. (1984). Confidence intervals for the survival function using Cox’s proportional hazardsmodel with covariates. Biometrics 40, 601-610.
Williams RL (1995) "Product-Limit Survival Functions with Correlated Survival Times" LifetimeData Analysis 1: 171–186
Woodruff RS (1952) Confidence intervals for medians and other position measures. JASA 57, 622-627.
See Also
predict.svycoxph for survival curves from a Cox model

86 svyloglin
Examples
data(pbc, package="survival")pbc$randomized <- with(pbc, !is.na(trt) & trt>0)biasmodel<-glm(randomized~age*edema,data=pbc)pbc$randprob<-fitted(biasmodel)
dpbc<-svydesign(id=~1, prob=~randprob, strata=~edema, data=subset(pbc,randomized))
s1<-svykm(Surv(time,status>0)~1, design=dpbc)s2<-svykm(Surv(time,status>0)~I(bili>6), design=dpbc)
plot(s1)plot(s2)plot(s2, lwd=2, pars=list(lty=c(1,2),col=c("purple","forestgreen")))
quantile(s1, probs=c(0.9,0.75,0.5,0.25,0.1))
s3<-svykm(Surv(time,status>0)~I(bili>6), design=dpbc,se=TRUE)plot(s3[[2]],col="purple")
confint(s3[[2]], parm=365*(1:5))quantile(s3[[1]], ci=TRUE)
svyloglin Loglinear models
Description
Fit and compare hierarchical loglinear models for complex survey data.
Usage
svyloglin(formula, design, ...)## S3 method for class ’svyloglin’update(object,formula,...)## S3 method for class ’svyloglin’anova(object,object1,...,integrate=FALSE)## S3 method for class ’anova.svyloglin’print(x,pval=c("F","saddlepoint","lincom","chisq"),...)## S3 method for class ’svyloglin’coef(object,...,intercept=FALSE)
Arguments
formula Model formula
design survey design object
object,object1 loglinear model from svyloglin

svyloglin 87
pval p-value approximation: see Details
integrate Compute the exact asymptotic p-value (slow)?
... not used
intercept Report the intercept?
x anova object
Details
The loglinear model is fitted to a multiway table with probabilities estimated by svymean and withthe sample size equal to the observed sample size, treating the resulting table as if it came fromiid multinomial sampling, as described by Rao and Scott. The variance-covariance matrix does notinclude the intercept term, and so by default neither does the coef method. A Newton-Raphsonalgorithm is used, rather than iterative proportional fitting, so starting values are not needed.
The anova method computes the quantities that would be the score (Pearson) and likelihood ratiochi-squared statistics if the data were an iid sample. It computes four p-values for each of these,based on the exact asymptotic distribution (see pchisqsum), a saddlepoint approximateion to thisdistribution, a scaled chi-squared distribution, and a scaled F-distribution. When testing the two-way interaction model against the main-effects model in a two-way table the score statistic andp-values match the Rao-Scott tests computed by svychisq.
The anova method can only compare two models if they are for exactly the same multiway table(same variables and same order). The update method will help with this. It is also much faster touse update than svyloglin for a large data set: its time complexity depends only on the size of themodel, not on the size of the data set.
It is not possible to fit a model using a variable created inline, eg I(x<10), since the multiway tableis based on all variables used in the formula.
Value
Object of class "svyloglin"
References
Rao, JNK, Scott, AJ (1984) "On Chi-squared Tests For Multiway Contingency Tables with Propor-tions Estimated From Survey Data" Annals of Statistics 12:46-60.
See Also
svychisq, svyglm,pchisqsum
Examples
data(api)dclus1<-svydesign(id=~dnum, weights=~pw, data=apiclus1, fpc=~fpc)a<-svyloglin(~stype+comp.imp,dclus1)b<-update(a,~.^2)an<-anova(a,b)anprint(an, pval="saddlepoint")
88 svylogrank
## Wald testregTermTest(b, ~stype:comp.imp)
## linear-by-linear associationd<-update(a,~.+as.numeric(stype):as.numeric(comp.imp))an1<-anova(a,d)an1
svylogrank Compare survival distributions
Description
Computes a weighted version of the logrank and stratified logrank tests for comparing two or moresurvival distributions. The generalization to complex samples is based on the characterization ofthe logrank test as the score test in a Cox model. Under simple random sampling with replacement,this function is almost identical to the robust score test in the survival package.
Usage
svylogrank(formula, design, ...)
Arguments
formula Model formula with a single predictor and optionally a strata term. The pre-dictor must be a factor if it has more than two levels.
design A survey design object
... for future expansion.
Value
A vector containing the z-statistic for comparing each level of the variable to the lowest, thechisquared statistic for the logrank test, and the p-value.
See Also
svykm, svycoxph.
Examples
library("survival")data(nwtco)## stratified on case statusdcchs<-twophase(id=list(~seqno,~seqno), strata=list(NULL,~rel),
subset=~I(in.subcohort | rel), data=nwtco, method="simple")
svymle 89
svylogrank(Surv(edrel,rel)~factor(stage),design=dcchs)
data(pbc, package="survival")pbc$randomized <- with(pbc, !is.na(trt) & trt>0)biasmodel<-glm(randomized~age*edema,data=pbc)pbc$randprob<-fitted(biasmodel)dpbc<-svydesign(id=~1, prob=~randprob, strata=~edema, data=subset(pbc,randomized))
svylogrank(Surv(time,status==2)~trt,design=dpbc)
rpbc<-as.svrepdesign(dpbc)svylogrank(Surv(time,status==2)~trt,design=rpbc)
svymle Maximum pseudolikelihood estimation in complex surveys
Description
Fits a user-specified likelihood parametrised by multiple linear predictors to data from a complexsample survey and computes the sandwich variance estimator of the coefficients. Note that thisfunction maximises an estimated population likelihood, it is not the sample MLE.
Usage
svymle(loglike, gradient = NULL, design, formulas, start = NULL, control= list(maxit=1000), na.action="na.fail", method=NULL, ...)## S3 method for class ’svymle’summary(object, stderr=c("robust", "model"),...)
Arguments
loglike vectorised loglikelihood function
gradient Derivative of loglike. Required for variance computation and helpful for fitting
design a survey.design object
formulas A list of formulas specifying the variable and linear predictors: see Details be-low
start Starting values for parameters
control control options for optim
na.action Handling of NAs
method "nlm" to use nlm, otherwise passed to optim
... Arguments to loglike and gradient that are not to be optimised over.
object svymle object
stderr Choice of standard error estimator. The default is a standard sandwich estimator.See Details below.

90 svymle
Details
Optimization is done by nlm by default or if method=="nlm". Otherwise optim is used and methodspecifies the method and control specifies control parameters.
The design object contains all the data and design information from the survey, so all the formulasrefer to variables in this object. The formulas argument needs to specify the response variable anda linear predictor for each freely varying argument of loglike.
Consider for example the dnorm function, with arguments x, mean, sd and log, and suppose we wantto estimate the mean of y as a linear function of a variable z, and to estimate a constant standarddeviation. The log argument must be fixed at FALSE to get the loglikelihood. A formulas argumentwould be list(~y, mean=~z, sd=~1). Note that the data variable y must be the first argument todnorm and the first formula and that all the other formulas are labelled. It is also permitted to havethe data variable as the left-hand side of one of the formulas: eg list( mean=y~z, sd=~1).
The usual variance estimator for MLEs in a survey sample is a ‘sandwich’ variance that requires thescore vector and the information matrix. It requires only sampling assumptions to be valid (thoughsome model assumptions are required for it to be useful). This is the stderr="robust" option,which is available only when the gradient argument was specified.
If the model is correctly specified and the sampling is at random conditional on variables in themodel then standard errors based on just the information matrix will be approximately valid. Inparticular, for independent sampling where weights and strata depend on variables in the model thestderr="model" should work fairly well.
Value
An object of class svymle
Author(s)
Thomas Lumley
See Also
svydesign, svyglm
Examples
data(api)
dstrat<-svydesign(id=~1, strata=~stype, weight=~pw, fpc=~fpc, data=apistrat)
## fit with glmm0 <- svyglm(api00~api99+ell,family="gaussian",design=dstrat)## fit as mle (without gradient)m1 <- svymle(loglike=dnorm,gradient=NULL, design=dstrat, formulas=list(mean=api00~api99+ell, sd=~1),start=list(c(80,1,0),c(20)), log=TRUE)## with gradientgr<- function(x,mean,sd,log){dm<-2*(x - mean)/(2*sd^2)ds<-(x-mean)^2*(2*(2 * sd))/(2*sd^2)^2 - sqrt(2*pi)/(sd*sqrt(2*pi))
cbind(dm,ds)

svymle 91
}m2 <- svymle(loglike=dnorm,gradient=gr, design=dstrat, formulas=list(mean=api00~api99+ell, sd=~1),
start=list(c(80,1,0),c(20)), log=TRUE, method="BFGS")
summary(m0)summary(m1,stderr="model")summary(m2)
## More complicated censored data example## showing that the response variable can be multivariate
data(pbc, package="survival")pbc$randomized <- with(pbc, !is.na(trt) & trt>0)biasmodel<-glm(randomized~age*edema,data=pbc)pbc$randprob<-fitted(biasmodel)dpbc<-svydesign(id=~1, prob=~randprob, strata=~edema,
data=subset(pbc,randomized))
lcens<-function(x,mean,sd){ifelse(x[,2]==1,
dnorm(log(x[,1]),mean,sd,log=TRUE),pnorm(log(x[,1]),mean,sd,log=TRUE,lower.tail=FALSE))
}
gcens<- function(x,mean,sd){
dz<- -dnorm(log(x[,1]),mean,sd)/pnorm(log(x[,1]),mean,sd,lower.tail=FALSE)
dm<-ifelse(x[,2]==1,2*(log(x[,1]) - mean)/(2*sd^2),dz*-1/sd)
ds<-ifelse(x[,2]==1,(log(x[,1])-mean)^2*(2*(2 * sd))/(2*sd^2)^2 - sqrt(2*pi)/(sd*sqrt(2*pi)),ds<- dz*-(log(x[,1])-mean)/(sd*sd))
cbind(dm,ds)}
if(!is.null(pbc$albumin)){svymle(loglike=lcens, gradient=gcens, design=dpbc,
formulas=list(mean=I(cbind(time,status>0))~bili+protime+albumin,sd=~1),
start=list(c(10,0,0,0),c(1)))} else {
svymle(loglike=lcens, gradient=gcens, design=dpbc,formulas=list(mean=I(cbind(time,status>0))~bili+protime+alb,
sd=~1),start=list(c(10,0,0,0),c(1)))
}

92 svyolr
svyolr Proportional odds and related models
Description
Fits cumulative link models: proportional odds, probit, complementary log-log, and cauchit.
Usage
svyolr(formula, design, ...)## S3 method for class ’survey.design2’svyolr(formula, design, start, ..., na.action = na.omit, method = c("logistic",
"probit", "cloglog", "cauchit"))## S3 method for class ’svyrep.design’svyolr(formula,design,...,return.replicates=FALSE,
multicore=getOption("survey.multicore"))
Arguments
formula Formula: the response must be a factor with at least three levels
design survey design object
... dots
start Optional starting values for optimization
na.action handling of missing values
multicore Use multicore package to distribute computation of replicates across multipleprocessors?
method Link functionreturn.replicates
return the individual replicate-weight estimates
Value
An object of class svyolr
Author(s)
The code is based closely on polr() from the MASS package of Venables and Ripley.
See Also
svyglm, regTermTest

svyplot 93
Examples
data(api)dclus1<-svydesign(id=~dnum, weights=~pw, data=apiclus1, fpc=~fpc)dclus1<-update(dclus1, mealcat=cut(meals,c(0,25,50,75,100)))
m<-svyolr(mealcat~avg.ed+mobility+stype, design=dclus1)m
## Use regTermTest for testing multiple parametersregTermTest(m, ~avg.ed+stype, method="LRT")
svyplot Plots for survey data
Description
Because observations in survey samples may represent very different numbers of units in the pop-ulation ordinary plots can be misleading. The svyplot function produces scatterplots adjusted invarious ways for sampling weights.
Usage
svyplot(formula, design,...)## Default S3 method:svyplot(formula, design, style = c("bubble", "hex", "grayhex","subsample","transparent"),sample.size = 500, subset = NULL, legend = 1, inches = 0.05,amount=NULL, basecol="black",alpha=c(0, 0.8),xbins=30,...)
Arguments
formula A model formula
design A survey object (svydesign or svrepdesign)
style See Details below
sample.size For style="subsample"
subset expression using variables in the design object
legend For style="hex" or "grayhex"
inches Scale for bubble plots
amount list with x and y components for amount of jittering to use in subsample plots,or NULL for the default amount
basecol base color for transparent plots, or a function to compute the color (see below),or color for bubble plots
alpha minimum and maximum opacity for transparent plots
xbins Number of (x-axis) bins for hexagonal binning
... Passed to plot methods

94 svyplot
Details
Bubble plots are scatterplots with circles whose area is proportional to the sampling weight. Thetwo "hex" styles produce hexagonal binning scatterplots, and require the hexbin package fromBioconductor. The "transparent" style plots points with opacity proportional to sampling weight.
The subsample method uses the sampling weights to create a sample from approximately the pop-ulation distribution and passes this to plot
Bubble plots are suited to small surveys, hexagonal binning and transparency to large surveys whereplotting all the points would result in too much overlap.
basecol can be a function taking one data frame argument, which will be passed the data frame ofvariables from the survey object. This could be memory-intensive for large data sets.
Value
None
See Also
symbols for other options (such as colour) for bubble plots.
svytable for plots of discrete data.
Examples
data(api)dstrat<-svydesign(id=~1,strata=~stype, weights=~pw, data=apistrat, fpc=~fpc)
svyplot(api00~api99, design=dstrat, style="bubble")svyplot(api00~api99, design=dstrat, style="transparent",pch=19)## Not run:## these two require the hexbin packagesvyplot(api00~api99, design=dstrat, style="hex", xlab="1999 API",ylab="2000 API")svyplot(api00~api99, design=dstrat, style="grayhex",legend=0)
## End(Not run)
dclus2<-svydesign(id=~dnum+snum, weights=~pw,data=apiclus2, fpc=~fpc1+fpc2)
svyplot(api00~api99, design=dclus2, style="subsample")svyplot(api00~api99, design=dclus2, style="subsample",
amount=list(x=25,y=25))
svyplot(api00~api99, design=dstrat,basecol=function(df){c("goldenrod","tomato","sienna")[as.numeric(df$stype)]},style="transparent",pch=19,alpha=c(0,1))
legend("topleft",col=c("goldenrod","tomato","sienna"), pch=19, legend=c("E","H","M"))
## For discrete data, estimate a population table and plot the table.plot(svytable(~sch.wide+comp.imp+stype,design=dstrat))fourfoldplot(svytable(~sch.wide+comp.imp+stype,design=dstrat,round=TRUE))

svyprcomp 95
## To draw on a hexbin plot you need grid graphics, eg,
h<-svyplot(api00~api99, design=dstrat, style="hex", xlab="1999 API",ylab="2000 API")s<-svysmooth(api00~api99,design=dstrat)grid.polyline(s$api99$x,s$api99$y,[email protected],default.units="native", gp=gpar(col="red",lwd=2))
svyprcomp Sampling-weighted principal component analysis
Description
Computes principal components using the sampling weights.
Usage
svyprcomp(formula, design, center = TRUE, scale. = FALSE, tol = NULL, scores = FALSE, ...)## S3 method for class ’svyprcomp’biplot(x, cols=c("black","darkred"),xlabs=NULL,weight=c("transparent","scaled","none"),
max.alpha=0.5,max.cex=0.5,xlim=NULL,ylim=NULL,pc.biplot=FALSE,expand=1,xlab=NULL,ylab=NULL,arrow.len=0.1,...)
Arguments
formula model formula describing variables to be useddesign survey design object.center Center data before analysis?scale. Scale to unit variance before analysis?tol Tolerance for omitting components from the results; a proportion of the standard
deviation of the first component. The default is to keep all components.scores Return scores on each component? These are needed for biplot.x A svyprcomp objectcols Base colors for observations and variables respectivelyxlabs Formula, or character vector, giving labels for each observationweight How to display the sampling weights: "scaled" changes the size of the point
label, "transparent" uses opacity proportional to sampling weight, "none"changes neither.
max.alpha Opacity for the largest sampling weight, or for all points if weight!="transparent"max.cex Character size (as a multiple of par("cex")) for the largest sampling weight, or
for all points if weight!="scaled"xlim,ylim,xlab,ylab
Graphical parametersexpand,arrow.len
See biplot
pc.biplot See link{biplot.prcomp}
... Other arguments to prcomp, or graphical parameters for biplot

96 svyquantile
Value
svyprcomp returns an object of class svyprcomp, similar to class prcomp but including designinformation
See Also
prcomp, biplot.prcomp
Examples
data(api)dclus2<-svydesign(id=~dnum+snum, fpc=~fpc1+fpc2, data=apiclus2)
pc <- svyprcomp(~api99+api00+ell+hsg+meals+emer, design=dclus2,scale=TRUE,scores=TRUE)pcbiplot(pc, xlabs=~dnum, weight="none")
biplot(pc, xlabs=~dnum,max.alpha=1)
biplot(pc, weight="scaled",max.cex=1.5, xlabs=~dnum)
svyquantile Quantiles for sample surveys
Description
Compute quantiles for data from complex surveys.
Usage
## S3 method for class ’survey.design’svyquantile(x, design, quantiles, alpha=0.05,
ci=FALSE, method = "linear", f = 1,interval.type=c("Wald","score","betaWald"), na.rm=FALSE,se=ci,ties=c("discrete","rounded"), df=Inf,...)
## S3 method for class ’svyrep.design’svyquantile(x, design, quantiles,
method ="linear", interval.type=c("probability","quantile"), f = 1,return.replicates=FALSE, ties=c("discrete","rounded"),na.rm=FALSE,...)
## S3 method for class ’svyquantile’SE(object,...)

svyquantile 97
Arguments
x A formula, vector or matrix
design survey.design or svyrep.design object
quantiles Quantiles to estimate
method see approxfun
f see approxfun
ci Compute a confidence interval? (relatively slow; needed for svyby)
se Compute standard errors from the confidence interval length?
alpha Level for confidence interval
interval.type See Details below
ties See Details below
df Degrees of freedom for a t-distribution. Inf requests a Normal distribution,NULL uses degf. Not relevant for type="betaWald"
return.replicates
Return the replicate means?
na.rm Remove NAs?
... arguments for future expansion
object Object returned by svyquantile.survey.design
Details
The definition of the CDF and thus of the quantiles is ambiguous in the presence of ties. Withties="discrete" the data are treated as genuinely discrete, so the CDF has vertical steps at tiedobservations. With ties="rounded" all the weights for tied observations are summed and the CDFinterpolates linearly between distinct observed values, and so is a continuous function. Combin-ing interval.type="betaWald" and ties="discrete" is (close to) the proposal of Shah andVaish(2006) used in some versions of SUDAAN.
Interval estimation for quantiles is complicated, because the influence function is not continuous.Linearisation cannot be used directly, and computing the variance of replicates is valid only forsome designs (eg BRR, but not jackknife). The interval.type option controls how the intervalsare computed.
For survey.design objects the default is interval.type="Wald". A 95% Wald confidence in-terval is constructed for the proportion below the estimated quantile. The inverse of the estimatedCDF is used to map this to a confidence interval for the quantile. This is the method of Woodruff(1952). For "betaWald" the same procedure is used, but the confidence interval for the propor-tion is computed using the exact binomial cdf with an effective sample size proposed by Korn &Graubard (1998).
If interval.type="score" we use a method described by Binder (1991) and due originally toFrancisco and Fuller (1986), which corresponds to inverting a robust score test. At the upper andlower limits of the confidence interval, a test of the null hypothesis that the cumulative distributionfunction is equal to the target quantile just rejects. This was the default before version 2.9. It ismuch slower than "Wald", and Dorfman & Valliant (1993) suggest it is not any more accurate.

98 svyquantile
Standard errors are computed from these confidence intervals by dividing the confidence intervallength by 2*qnorm(alpha/2).
For replicate-weight designs, ordinary replication-based standard errors are valid for BRR and Fay’smethod, and for some bootstrap-based designs, but not for jackknife-based designs. interval.type="quantile"gives these replication-based standard errors. The default, interval.type="probability" com-putes confidence on the probability scale and then transforms back to quantiles, the equivalent ofinterval.type="Wald" for survey.design objects (with alpha=0.05).
There is a confint method for svyquantile objects; it simply extracts the pre-computed confi-dence interval.
Value
returns a list whose first component is the quantiles and second component is the confidence inter-vals. For replicate weight designs, returns an object of class svyrepstat.
Author(s)
Thomas Lumley
References
Binder DA (1991) Use of estimating functions for interval estimation from complex surveys. Pro-ceedings of the ASA Survey Research Methods Section 1991: 34-42
Dorfman A, Valliant R (1993) Quantile variance estimators in complex surveys. Proceedings of theASA Survey Research Methods Section. 1993: 866-871
Korn EL, Graubard BI. (1998) Confidence Intervals For Proportions With Small Expected Numberof Positive Counts Estimated From Survey Data. Survey Methodology 23:193-201.
Francisco CA, Fuller WA (1986) Estimation of the distribution function with a complex survey.Technical Report, Iowa State University.
Shao J, Tu D (1995) The Jackknife and Bootstrap. Springer.
Shah BV, Vaish AK (2006) Confidence Intervals for Quantile Estimation from Complex SurveyData. Proceedings of the Section on Survey Research Methods.
Woodruff RS (1952) Confidence intervals for medians and other position measures. JASA 57, 622-627.
See Also
svykm for quantiles of survival curves
svyciprop for confidence intervals on proportions.
Examples
data(api)## populationquantile(apipop$api00,c(.25,.5,.75))

svyranktest 99
## one-stage cluster sampledclus1<-svydesign(id=~dnum, weights=~pw, data=apiclus1, fpc=~fpc)svyquantile(~api00, dclus1, c(.25,.5,.75),ci=TRUE)svyquantile(~api00, dclus1, c(.25,.5,.75),ci=TRUE,interval.type="betaWald")svyquantile(~api00, dclus1, c(.25,.5,.75),ci=TRUE,df=NULL)
dclus1<-svydesign(id=~dnum, weights=~pw, data=apiclus1, fpc=~fpc)(qapi<-svyquantile(~api00, dclus1, c(.25,.5,.75),ci=TRUE, interval.type="score"))SE(qapi)
#stratified sampledstrat<-svydesign(id=~1, strata=~stype, weights=~pw, data=apistrat, fpc=~fpc)svyquantile(~api00, dstrat, c(.25,.5,.75),ci=TRUE)
#stratified sample, replicate weights# interval="probability" is necessary for jackknife weightsrstrat<-as.svrepdesign(dstrat)svyquantile(~api00, rstrat, c(.25,.5,.75), interval.type="probability")
# BRR methoddata(scd)repweights<-2*cbind(c(1,0,1,0,1,0), c(1,0,0,1,0,1), c(0,1,1,0,0,1),
c(0,1,0,1,1,0))scdrep<-svrepdesign(data=scd, type="BRR", repweights=repweights)svyquantile(~arrests+alive, design=scdrep, quantile=0.5, interval.type="quantile")
svyranktest Design-based rank tests
Description
Design-based versions of two-sample rank tests. The built-in tests are all for location hypotheses,but the user can specify others.
Usage
svyranktest(formula, design, test = c("wilcoxon", "vanderWaerden", "median"), ...)
Arguments
formula Model formula y~g for outcome variable y and group g
design A survey design object
test Which rank test to use: Wilcoxon, van der Waerden’s normal-scores test, Mood’stest for the median, or a function f(r,N) where r is the rank and N the estimatedpopulation size.
... for future expansion

100 svyratio
Value
Object of class htest
References
Lumley T, Scott AJ (2012) "Two-sample rank tests under complex sampling". Technical Report2012-4, Department of Statistics, University of Auckland.
See Also
svyttest, svylogrank
Examples
data(api)dclus1<-svydesign(id=~dnum, weights=~pw, fpc=~fpc, data=apiclus1)
svyranktest(ell~comp.imp, dclus1)svyranktest(ell~comp.imp, dclus1, test="median")
## upper quartilesvyranktest(ell~comp.imp, dclus1, test=function(r,N) as.numeric(r>0.75*N))
quantiletest<-function(p){rval<-function(r,N) as.numeric(r>(N*p))attr(rval,"name")<-paste(p,"quantile")rval
}svyranktest(ell~comp.imp, dclus1, test=quantiletest(0.5))svyranktest(ell~comp.imp, dclus1, test=quantiletest(0.75))
svyratio Ratio estimation
Description
Ratio estimation and estimates of totals based on ratios for complex survey samples. Estimatingdomain (subpopulation) means can be done more easily with svymean.
Usage
## S3 method for class ’survey.design2’svyratio(numerator=formula, denominator,
design,separate=FALSE, na.rm=FALSE,formula, covmat=FALSE,deff=FALSE,...)## S3 method for class ’svyrep.design’

svyratio 101
svyratio(numerator=formula, denominator, design,na.rm=FALSE,formula, covmat=FALSE,return.replicates=FALSE,deff=FALSE, ...)
## S3 method for class ’twophase’svyratio(numerator=formula, denominator, design,
separate=FALSE, na.rm=FALSE,formula,...)## S3 method for class ’svyratio’predict(object, total, se=TRUE,...)## S3 method for class ’svyratio_separate’predict(object, total, se=TRUE,...)## S3 method for class ’svyratio’SE(object,...,drop=TRUE)## S3 method for class ’svyratio’coef(object,...,drop=TRUE)## S3 method for class ’svyratio’confint(object, parm, level = 0.95,df =Inf,...)
Arguments
numerator,formula
formula, expression, or data frame giving numerator variable(s)
denominator formula, expression, or data frame giving denominator variable(s)
design survey design object
object result of svyratio
total vector of population totals for the denominator variables in object, or list ofvectors of population stratum totals if separate=TRUE
se Return standard errors?
separate Estimate ratio separately for strata
na.rm Remove missing values?
covmat Compute the full variance-covariance matrix of the ratios
deff Compute design effects
return.replicates
Return replicate estimates of ratios
drop Return a vector rather than a matrix
parm a specification of which parameters are to be given confidence intervals, eithera vector of numbers or a vector of names. If missing, all parameters are consid-ered.
level the confidence level required.
df degrees of freedom for t-distribution in confidence interval, use degf(design)for number of PSUs minus number of strata
... Other unused arguments for other methods

102 svyratio
Details
The separate ratio estimate of a total is the sum of ratio estimates in each stratum. If the stratumtotals supplied in the total argument and the strata in the design object both have names thesenames will be matched. If they do not have names it is important that the sample totals are suppliedin the correct order, the same order as shown in the output of summary(design).
When design is a two-phase design, stratification will be on the second phase.
Value
svyratio returns an object of class svyratio. The predict method returns a matrix of populationtotals and optionally a matrix of standard errors.
Author(s)
Thomas Lumley
References
Levy and Lemeshow. "Sampling of Populations" (3rd edition). Wiley
See Also
svydesign
svymean for estimating proportions and domain means
calibrate for estimators related to the separate ratio estimator.
Examples
data(scd)
## survey design objectsscddes<-svydesign(data=scd, prob=~1, id=~ambulance, strata=~ESA,nest=TRUE, fpc=rep(5,6))scdnofpc<-svydesign(data=scd, prob=~1, id=~ambulance, strata=~ESA,nest=TRUE)
# convert to BRR replicate weightsscd2brr <- as.svrepdesign(scdnofpc, type="BRR")
# use BRR replicate weights from Levy and Lemeshowrepweights<-2*cbind(c(1,0,1,0,1,0), c(1,0,0,1,0,1), c(0,1,1,0,0,1),c(0,1,0,1,1,0))scdrep<-svrepdesign(data=scd, type="BRR", repweights=repweights)
# ratio estimatessvyratio(~alive, ~arrests, design=scddes)svyratio(~alive, ~arrests, design=scdnofpc)svyratio(~alive, ~arrests, design=scd2brr)svyratio(~alive, ~arrests, design=scdrep)

svyrecvar 103
data(api)dstrat<-svydesign(id=~1,strata=~stype, weights=~pw, data=apistrat, fpc=~fpc)
## domain means are ratio estimates, but available directlysvyratio(~I(api.stu*(comp.imp=="Yes")), ~as.numeric(comp.imp=="Yes"), dstrat)svymean(~api.stu, subset(dstrat, comp.imp=="Yes"))
## separate and combined ratio estimates of total(sep<-svyratio(~api.stu,~enroll, dstrat,separate=TRUE))(com<-svyratio(~api.stu, ~enroll, dstrat))
stratum.totals<-list(E=1877350, H=1013824, M=920298)
predict(sep, total=stratum.totals)predict(com, total=sum(unlist(stratum.totals)))
SE(com)coef(com)coef(com, drop=FALSE)confint(com)
svyrecvar Variance estimation for multistage surveys
Description
Compute the variance of a total under multistage sampling, using a recursive descent algorithm.
Usage
svyrecvar(x, clusters, stratas,fpcs, postStrata = NULL,lonely.psu = getOption("survey.lonely.psu"),one.stage=getOption("survey.ultimate.cluster"))
Arguments
x Matrix of data or estimating functions
clusters Data frame or matrix with cluster ids for each stage
stratas Strata for each stage
fpcs Information on population and sample size for each stage, created by as.fpc
postStrata post-stratification information as created by postStratify or calibrate
lonely.psu How to handle strata with a single PSU
one.stage If TRUE, compute a one-stage (ultimate-cluster) estimator

104 svyrecvar
Details
The main use of this function is to compute the variance of the sum of a set of estimating functionsunder multistage sampling. The sampling is assumed to be simple or stratified random samplingwithin clusters at each stage except perhaps the last stage. The variance of a statistic is computedfrom the variance of estimating functions as described by Binder (1983).
Use one.stage=FALSE for compatibility with other software that does not perform multi-stagecalculations, and set options(survey.ultimate.cluster=TRUE) to make this the default.
The idea of a recursive algorithm is due to Bellhouse (1985). Texts such as Cochran (1977) andSarndal et al (1991) describe the decomposition of the variance into a single-stage between-clusterestimator and a within-cluster estimator, and this is applied recursively.
If one.stage is a positive integer it specifies the number of stages of sampling to use in the recursiveestimator.
If pps="brewer", standard errors are estimated using Brewer’s approximation for PPS without re-placement, option 2 of those described by Berger (2004). The fpc argument must then be specifiedin terms of sampling fractions, not population sizes (or omitted, but then the pps argument wouldhave no effect and the with-replacement standard errors would be correct).
Value
A covariance matrix
Note
A simple set of finite population corrections will only be exactly correct when each successive stageuses simple or stratified random sampling without replacement. A correction under general unequalprobability sampling (eg PPS) would require joint inclusion probabilities (or, at least, samplingprobabilities for units not included in the sample), information not generally available.
The quality of Brewer’s approximation is excellent in Berger’s simulations, but the accuracy mayvary depending on the sampling algorithm used.
References
Bellhouse DR (1985) Computing Methods for Variance Estimation in Complex Surveys. Journal ofOfficial Statistics. Vol.1, No.3, 1985
Berger, Y.G. (2004), A Simple Variance Estimator for Unequal Probability Sampling Without Re-placement. Journal of Applied Statistics, 31, 305-315.
Binder, David A. (1983). On the variances of asymptotically normal estimators from complexsurveys. International Statistical Review, 51, 279-292.
Brewer KRW (2002) Combined Survey Sampling Inference (Weighing Basu’s Elephants) [Chapter9]
Cochran, W. (1977) Sampling Techniques. 3rd edition. Wiley.
Sarndal C-E, Swensson B, Wretman J (1991) Model Assisted Survey Sampling. Springer.

svysmooth 105
See Also
svrVar for replicate weight designs
svyCprod for a description of how variances are estimated at each stage
Examples
data(mu284)dmu284<-svydesign(id=~id1+id2,fpc=~n1+n2, data=mu284)svytotal(~y1, dmu284)
data(api)# two-stage cluster sampledclus2<-svydesign(id=~dnum+snum, fpc=~fpc1+fpc2, data=apiclus2)summary(dclus2)svymean(~api00, dclus2)svytotal(~enroll, dclus2,na.rm=TRUE)
# bootstrap for multistage samplemrbclus2<-as.svrepdesign(dclus2, type="mrb", replicates=100)svytotal(~enroll, mrbclus2, na.rm=TRUE)
# two-stage ‘with replacement’dclus2wr<-svydesign(id=~dnum+snum, weights=~pw, data=apiclus2)summary(dclus2wr)svymean(~api00, dclus2wr)svytotal(~enroll, dclus2wr,na.rm=TRUE)
svysmooth Scatterplot smoothing and density estimation
Description
Scatterplot smoothing and density estimation for probability-weighted data.
Usage
svysmooth(formula, design, ...)## Default S3 method:svysmooth(formula, design, method = c("locpoly", "quantreg"),
bandwidth = NULL, quantile, df = 4, ...)## S3 method for class ’svysmooth’plot(x, which=NULL, type="l", xlabs=NULL, ylab=NULL,...)## S3 method for class ’svysmooth’lines(x,which=NULL,...)make.panel.svysmooth(design,bandwidth=NULL)

106 svysmooth
Arguments
formula One-sided formula for density estimation, two-sided for smoothing
design Survey design object
method local polynomial smoothing for the mean or regression splines for quantiles
bandwidth Smoothing bandwidth for "locpoly" or NULL for automatic choice
quantile quantile to be estimated for "quantreg"
df Degrees of freedom for "quantreg"
which Which plots to show (default is all)
type as for plot
xlabs Optional vector of x-axis labels
ylab Optional y-axis label
... More arguments
x Object of class svysmooth
Details
svysmooth does one-dimensional smoothing. If formula has multiple predictor variables a separateone-dimensional smooth is performed for each one.
For method="locpoly" the extra arguments are passed to locpoly from the KernSmooth package,for method="quantreg" they are passed to rq from the quantreg package. The automatic choice ofbandwidth for method="locpoly" uses the default settings for dpik and dpill in the KernSmoothpackage.
make.panel.svysmooth() makes a function that plots points and draws a weighted smooth curvethrough them, a weighted replacement for panel.smooth that can be passed to functions such astermplot or plot.lm. The resulting function has a span argument that will set the bandwidth; ifthis is not specified the automatic choice will be used.
Value
An object of class svysmooth, a list of lists, each with x and y components.
See Also
svyhist for histograms
Examples
data(api)dstrat<-svydesign(id=~1,strata=~stype, weights=~pw, data=apistrat, fpc=~fpc)
smth<-svysmooth(api00~api99+ell,dstrat)dens<-svysmooth(~api99, dstrat,bandwidth=30)dens1<-svysmooth(~api99, dstrat)qsmth<-svysmooth(api00~ell,dstrat, quantile=0.75, df=3,method="quantreg")

svystandardize 107
plot(smth)plot(smth, which="ell",lty=2,ylim=c(500,900))lines(qsmth, col="red")
svyhist(~api99,design=dstrat)lines(dens,col="purple",lwd=3)lines(dens1, col="forestgreen",lwd=2)
m<-svyglm(api00~sin(api99/100)+stype, design=dstrat)termplot(m, data=model.frame(dstrat), partial.resid=TRUE, se=TRUE,smooth=make.panel.svysmooth(dstrat))
svystandardize Direct standardization within domains
Description
In health surveys it is often of interest to standardize domains to have the same distribution of, eg,age as in a target population. The operation is similar to post-stratification, except that the totalsfor the domains are fixed at the current estimates, not at known population values. This functionmatches the estimates produced by the (US) National Center for Health Statistics.
Usage
svystandardize(design, by, over, population, excluding.missing = NULL)
Arguments
design survey design object
by A one-sided formula specifying the variables whose distribution will be stan-dardised
over A one-sided formula specifying the domains within which the standardisationwill occur
population Desired population totals or proportions for the levels of combinations of vari-ables in by
excluding.missing
Optionally, a one-sided formula specifying variables whose missing values shouldbe dropped before calculating the domain totals.
Value
A new survey design object of the same type as the input.
Note
The standard error estimates do not exactly match the NCHS estimates

108 svytable
References
National Center for Health Statistics http://www.cdc.gov/nchs/tutorials/NHANES/NHANESAnalyses/agestandardization/age_standardization_intro.htm
See Also
postStratify, svyby
Examples
## matches http://www.cdc.gov/nchs/data/databriefs/db92_fig1.pngdata(nhanes)popage <- c( 55901 , 77670 , 72816 , 45364 )design<-svydesign(id=~SDMVPSU, strata=~SDMVSTRA, weights=~WTMEC2YR, data=nhanes, nest=TRUE)stdes<-svystandardize(design, by=~agecat, over=~race+RIAGENDR, population=popage, excluding.missing=~HI_CHOL)svyby(~HI_CHOL, ~race+RIAGENDR, svymean, design=subset(stdes, agecat!="(0,19]"))
svytable Contingency tables for survey data
Description
Contingency tables and chisquared tests of association for survey data.
Usage
## S3 method for class ’survey.design’svytable(formula, design, Ntotal = NULL, round = FALSE,...)## S3 method for class ’svyrep.design’svytable(formula, design, Ntotal = sum(weights(design, "sampling")), round = FALSE,...)## S3 method for class ’survey.design’svychisq(formula, design, statistic = c("F", "Chisq","Wald","adjWald","lincom","saddlepoint"),na.rm=TRUE,...)## S3 method for class ’svyrep.design’svychisq(formula, design, statistic = c("F", "Chisq","Wald","adjWald","lincom","saddlepoint"),na.rm=TRUE,...)## S3 method for class ’svytable’summary(object, statistic = c("F","Chisq","Wald","adjWald","lincom","saddlepoint"),...)degf(design, ...)## S3 method for class ’survey.design2’degf(design, ...)## S3 method for class ’svyrep.design’degf(design, tol=1e-5,...)

svytable 109
Arguments
formula Model formula specifying margins for the table (using + only)
design survey object
statistic See Details below
Ntotal A population total or set of population stratum totals to normalise to.
round Should the table entries be rounded to the nearest integer?
na.rm Remove missing values
object Output from svytable
... For svytable these are passed to xtabs. Use exclude=NULL, na.action=na.passto include NAs in the table
tol Tolerance for qr in computing the matrix rank
Details
The svytable function computes a weighted crosstabulation. This is especially useful for produc-ing graphics. It is sometimes easier to use svytotal or svymean, which also produce standarderrors, design effects, etc.
The frequencies in the table can be normalised to some convenient total such as 100 or 1.0 byspecifying the Ntotal argument. If the formula has a left-hand side the mean or sum of this variablerather than the frequency is tabulated.
The Ntotal argument can be either a single number or a data frame whose first column gives the(first-stage) sampling strata and second column the population size in each stratum. In this secondcase the svytable command performs ‘post-stratification’: tabulating and scaling to the populationwithin strata and then adding up the strata.
As with other xtabs objects, the output of svytable can be processed by ftable for more attractivedisplay. The summary method for svytable objects calls svychisq for a test of independence.
svychisq computes first and second-order Rao-Scott corrections to the Pearson chisquared test,and two Wald-type tests.
The default (statistic="F") is the Rao-Scott second-order correction. The p-values are computedwith a Satterthwaite approximation to the distribution and with denominator degrees of freedom asrecommended by Thomas and Rao (1990). The alternative statistic="Chisq" adjusts the Pearsonchisquared statistic by a design effect estimate and then compares it to the chisquared distributionit would have under simple random sampling.
The statistic="Wald" test is that proposed by Koch et al (1975) and used by the SUDAANsoftware package. It is a Wald test based on the differences between the observed cells counts andthose expected under independence. The adjustment given by statistic="adjWald" reduces thestatistic when the number of PSUs is small compared to the number of degrees of freedom of thetest. Thomas and Rao (1990) compare these tests and find the adjustment benefical.
statistic="lincom" replaces the numerator of the Rao-Scott F with the exact asymptotic distribu-tion, which is a linear combination of chi-squared variables (see pchisqsum, and statistic="saddlepoint"uses a saddlepoint approximation to this distribution. The CompQuadForm package is needed forstatistic="lincom" but not for statistic="saddlepoint". The saddlepoint approximation isespecially useful when the p-value is very small (as in large-scale multiple testing problems).
110 svytable
For designs using replicate weights the code is essentially the same as for designs with sam-pling structure, since the necessary variance computations are done by the appropriate methodsof svytotal and svymean. The exception is that the degrees of freedom is computed as one lessthan the rank of the matrix of replicate weights (by degf).
At the moment, svychisq works only for 2-dimensional tables.
Value
The table commands return an xtabs object, svychisq returns a htest object.
Note
Rao and Scott (1984) leave open one computational issue. In computing ‘generalised design effects’for these tests, should the variance under simple random sampling be estimated using the observedproportions or the the predicted proportions under the null hypothesis? svychisq uses the observedproportions, following simulations by Sribney (1998), and the choices made in Stata
References
Davies RB (1973). "Numerical inversion of a characteristic function" Biometrika 60:415-7
P. Duchesne, P. Lafaye de Micheaux (2010) "Computing the distribution of quadratic forms: Fur-ther comparisons between the Liu-Tang-Zhang approximation and exact methods", ComputationalStatistics and Data Analysis, Volume 54, 858-862
Koch, GG, Freeman, DH, Freeman, JL (1975) "Strategies in the multivariate analysis of data fromcomplex surveys" International Statistical Review 43: 59-78
Rao, JNK, Scott, AJ (1984) "On Chi-squared Tests For Multiway Contigency Tables with Propor-tions Estimated From Survey Data" Annals of Statistics 12:46-60.
Sribney WM (1998) "Two-way contingency tables for survey or clustered data" Stata TechnicalBulletin 45:33-49.
Thomas, DR, Rao, JNK (1990) "Small-sample comparison of level and power for simple goodness-of-fit statistics under cluster sampling" JASA 82:630-636
See Also
svytotal and svymean report totals and proportions by category for factor variables.
See svyby and ftable.svystat to construct more complex tables of summary statistics.
See svyloglin for loglinear models.
See regTermTest for Rao-Scott tests in regression models.
Examples
data(api)xtabs(~sch.wide+stype, data=apipop)
dclus1<-svydesign(id=~dnum, weights=~pw, data=apiclus1, fpc=~fpc)summary(dclus1)

svyttest 111
(tbl <- svytable(~sch.wide+stype, dclus1))plot(tbl)fourfoldplot(svytable(~sch.wide+comp.imp+stype,design=dclus1,round=TRUE), conf.level=0)
svychisq(~sch.wide+stype, dclus1)summary(tbl, statistic="Chisq")svychisq(~sch.wide+stype, dclus1, statistic="adjWald")
rclus1 <- as.svrepdesign(dclus1)summary(svytable(~sch.wide+stype, rclus1))svychisq(~sch.wide+stype, rclus1, statistic="adjWald")
svyttest Design-based t-test
Description
One-sample or two-sample t-test. This function is a wrapper for svymean in the one-sample caseand for svyglm in the two-sample case. Degrees of freedom are degf(design) for the one-sampletest and degf(design)-1 for the two-sample case.
Usage
svyttest(formula, design, ...)
Arguments
formula Formula, outcome~group for two-sample, outcome~0 or outcome~1 for one-sample
design survey design object
... for methods
Value
Object of class htest
See Also
t.test
Examples
data(api)dclus2<-svydesign(id=~dnum+snum, fpc=~fpc1+fpc2, data=apiclus2)svyttest(enroll~comp.imp, dclus2)
svyttest(I(api00-api99)~0, dclus2)

112 trimWeights
trimWeights Trim sampling weights
Description
Trims very high or very low sampling weights to reduce the influence of outlying observations. Ina replicate-weight design object, the replicate weights are also trimmed. The total amount trimmedis divided among the observations that were not trimmed, so that the total weight remains the same.
Usage
trimWeights(design, upper = Inf, lower = -Inf, ...)## S3 method for class ’survey.design2’trimWeights(design, upper = Inf, lower = -Inf, strict=FALSE,...)## S3 method for class ’svyrep.design’trimWeights(design, upper = Inf, lower = -Inf,compress=FALSE,...)
Arguments
design A survey design object
upper Upper bound for weights
lower Lower bound for weights
strict The reapportionment of the ‘trimmings’ from the weights can push other weightsover the limits. If trim=TRUE the function calls itself recursively to prevent this.
compress Compress the replicate weights after trimming.
... Other arguments for future expansion
Value
A new survey design object with trimmed weights.
See Also
calibrate has a trim option for trimming the calibration adjustments.
Examples
data(api)dclus1<-svydesign(id=~dnum, weights=~pw, data=apiclus1, fpc=~fpc)
pop.totals<-c(‘(Intercept)‘=6194, stypeH=755, stypeM=1018,api99=3914069)dclus1g<-calibrate(dclus1, ~stype+api99, pop.totals)
summary(weights(dclus1g))dclus1t<-trimWeights(dclus1g,lower=20, upper=45)summary(weights(dclus1t))

twophase 113
dclus1tt<-trimWeights(dclus1g, lower=20, upper=45,strict=TRUE)summary(weights(dclus1tt))
svymean(~api99+api00+stype, dclus1g)svymean(~api99+api00+stype, dclus1t)svymean(~api99+api00+stype, dclus1tt)
twophase Two-phase designs
Description
In a two-phase design a sample is taken from a population and a subsample taken from the sample,typically stratified by variables not known for the whole population. The second phase can use anydesign supported for single-phase sampling. The first phase must currently be one-stage element orcluster sampling
Usage
twophase(id, strata = NULL, probs = NULL, weights = NULL, fpc = NULL,subset, data, method=c("full","approx","simple"))twophasevar(x,design)twophase2var(x,design)
Arguments
id list of two formulas for sampling unit identifiers
strata list of two formulas (or NULLs) for stratum identifies
probs list of two formulas (or NULLs) for sampling probabilities
weights Only for method="approx", list of two formulas (or NULLs) for sampling weights
fpc list of two formulas (or NULLs) for finite population corrections
subset formula specifying which observations are selected in phase 2
data Data frame will all data for phase 1 and 2
method "full" requires (much) more memory, but gives unbiased variance estimatesfor general multistage designs at both phases. "simple" or "approx" uses thestandard error calculation from version 3.14 and earlier, which uses much lessmemory and is correct for designs with simple random sampling at phase oneand stratified random sampling at phase two.
x probability-weighted estimating functions
design two-phase design

114 twophase
Details
The population for the second phase is the first-phase sample. If the second phase sample usesstratified (multistage cluster) sampling without replacement and all the stratum and sampling unitidentifier variables are available for the whole first-phase sample it is possible to estimate the sam-pling probabilities/weights and the finite population correction. These would then be specified asNULL.
Two-phase case-control and case-cohort studies in biostatistics will typically have simple randomsampling with replacement as the first stage. Variances given here may differ slightly from those inthe biostatistics literature where a model-based estimator of the first-stage variance would typicallybe used.
Variance computations are based on the conditioning argument in Section 9.3 of Sarndal et al.Method "full" corresponds exactly to the formulas in that reference. Method "simple" or "approx"(the two are the same) uses less time and memory but is exact only for some special cases. Themost important special case is the two-phase epidemiologic designs where phase 1 is simple ran-dom sampling from an infinite population and phase 2 is stratified random sampling. See the testsdirectory for a worked example. The only disadvantage of method="simple" in these cases is thatstandardization of margins (marginpred) is not available.
For method="full", sampling probabilities must be available for each stage of sampling, withineach phase. For multistage sampling this requires specifying either fpc or probs as a formula witha term for each stage of sampling. If no fpc or probs are specified at phase 1 it is treated as simplerandom sampling from an infinite population, and population totals will not be correctly estimated,but means, quantiles, and regression models will be correct.
Value
twophase returns an object of class twophase2 (for method="full") or twophase. The structureof twophase2 objects may change as unnecessary components are removed.
twophase2var and twophasevar return a variance matrix with an attribute containing the separatephase 1 and phase 2 contributions to the variance.
References
Sarndal CE, Swensson B, Wretman J (1992) "Model Assisted Survey Sampling" Springer.
Breslow NE and Chatterjee N, Design and analysis of two-phase studies with binary outcome ap-plied to Wilms tumour prognosis. "Applied Statistics" 48:457-68, 1999
Breslow N, Lumley T, Ballantyne CM, Chambless LE, Kulick M. (2009) Improved Horvitz-Thompsonestimation of model parameters from two-phase stratified samples: applications in epidemiology.Statistics in Biosciences. doi 10.1007/s12561-009-9001-6
Lin, DY and Ying, Z (1993). Cox regression with incomplete covariate measurements. "Journal ofthe American Statistical Association" 88: 1341-1349.
See Also
svydesign, svyrecvar for multi*stage* sampling
calibrate for calibration (GREG) estimators.
estWeights for two-phase designs for missing data.

twophase 115
The "epi" and "phase1" vignettes for examples and technical details.
Examples
## two-phase simple random sampling.data(pbc, package="survival")pbc$randomized<-with(pbc, !is.na(trt) & trt>0)pbc$id<-1:nrow(pbc)d2pbc<-twophase(id=list(~id,~id), data=pbc, subset=~randomized)svymean(~bili, d2pbc)
## two-stage sampling as two-phasedata(mu284)ii<-with(mu284, c(1:15, rep(1:5,n2[1:5]-3)))mu284.1<-mu284[ii,]mu284.1$id<-1:nrow(mu284.1)mu284.1$sub<-rep(c(TRUE,FALSE),c(15,34-15))dmu284<-svydesign(id=~id1+id2,fpc=~n1+n2, data=mu284)## first phase cluster sample, second phase stratified within clusterd2mu284<-twophase(id=list(~id1,~id),strata=list(NULL,~id1),
fpc=list(~n1,NULL),data=mu284.1,subset=~sub)svytotal(~y1, dmu284)svytotal(~y1, d2mu284)svymean(~y1, dmu284)svymean(~y1, d2mu284)
## case-cohort design: this example requires R 2.2.0 or laterlibrary("survival")data(nwtco)
## stratified on case statusdcchs<-twophase(id=list(~seqno,~seqno), strata=list(NULL,~rel),
subset=~I(in.subcohort | rel), data=nwtco)svycoxph(Surv(edrel,rel)~factor(stage)+factor(histol)+I(age/12), design=dcchs)
## Using survival::cchsubcoh <- nwtco$in.subcohortselccoh <- with(nwtco, rel==1|subcoh==1)ccoh.data <- nwtco[selccoh,]ccoh.data$subcohort <- subcoh[selccoh]cch(Surv(edrel, rel) ~ factor(stage) + factor(histol) + I(age/12), data =ccoh.data,
subcoh = ~subcohort, id=~seqno, cohort.size=4028, method="LinYing")
## two-phase case-control## Similar to Breslow & Chatterjee, Applied Statistics (1999) but with## a slightly different version of the data set
nwtco$incc2<-as.logical(with(nwtco, ifelse(rel | instit==2,1,rbinom(nrow(nwtco),1,.1))))dccs2<-twophase(id=list(~seqno,~seqno),strata=list(NULL,~interaction(rel,instit)),
data=nwtco, subset=~incc2)dccs8<-twophase(id=list(~seqno,~seqno),strata=list(NULL,~interaction(rel,stage,instit)),
data=nwtco, subset=~incc2)

116 update.survey.design
summary(glm(rel~factor(stage)*factor(histol),data=nwtco,family=binomial()))summary(svyglm(rel~factor(stage)*factor(histol),design=dccs2,family=quasibinomial()))summary(svyglm(rel~factor(stage)*factor(histol),design=dccs8,family=quasibinomial()))
## Stratification on stage is really post-stratification, so we should use calibrate()gccs8<-calibrate(dccs2, phase=2, formula=~interaction(rel,stage,instit))summary(svyglm(rel~factor(stage)*factor(histol),design=gccs8,family=quasibinomial()))
## For this saturated model calibration is equivalent to estimating weights.pccs8<-calibrate(dccs2, phase=2,formula=~interaction(rel,stage,instit), calfun="rrz")summary(svyglm(rel~factor(stage)*factor(histol),design=pccs8,family=quasibinomial()))
## Since sampling is SRS at phase 1 and stratified RS at phase 2, we## can use method="simple" to save memory.dccs8_simple<-twophase(id=list(~seqno,~seqno),strata=list(NULL,~interaction(rel,stage,instit)),
data=nwtco, subset=~incc2,method="simple")summary(svyglm(rel~factor(stage)*factor(histol),design=dccs8_simple,family=quasibinomial()))
update.survey.design Add variables to a survey design
Description
Update the data variables in a survey design, either with a formula for a new set of variables or withan expression for variables to be added.
Usage
## S3 method for class ’survey.design’update(object, ...)## S3 method for class ’twophase’update(object, ...)## S3 method for class ’svyrep.design’update(object, ...)## S3 method for class ’DBIsvydesign’update(object, ...)## S3 method for class ’ODBCsvydesign’update(object, ...)
Arguments
object a survey design object
... Arguments tag=expr add a new variable tag computed by evaluating expr inthe survey data.

weights.survey.design 117
Details
Database-backed objects may not have write access to the database and so update does not attemptto modify the database. The expressions are stored and are evaluated when the data is loaded.
If a set of new variables will be used extensively it may be more efficient to modify the database,either with SQL queries from the R interface or separately. One useful intermediate approach is tocreate a table with the new variables and a view that joins this table to the table of existing variables.
There is now a base-R function transform for adding new variables to a data frame, so I haveadded transform as a synonym for update for survey objects.
Value
A survey design object
See Also
svydesign, svrepdesign, twophase
Examples
data(api)dstrat<-svydesign(id=~1,strata=~stype, weights=~pw, data=apistrat,fpc=~fpc)dstrat<-update(dstrat, apidiff=api00-api99)svymean(~api99+api00+apidiff, dstrat)
weights.survey.design Survey design weights
Description
Extract weights from a survey design object.
Usage
## S3 method for class ’survey.design’weights(object, ...)## S3 method for class ’svyrep.design’weights(object,type=c("replication","sampling","analysis"), ...)## S3 method for class ’survey_fpc’weights(object,final=TRUE,...)
Arguments
object Survey design objecttype Type of weights: "analysis" combines sampling and replication weights.final If FALSE return a data frame with sampling weights at each stage of sampling.... Other arguments ignored

118 with.svyimputationList
Value
vector or matrix of weights
See Also
svydesign, svrepdesign, as.fpc
Examples
data(scd)
scddes<-svydesign(data=scd, prob=~1, id=~ambulance, strata=~ESA,nest=TRUE, fpc=rep(5,6))
repweights<-2*cbind(c(1,0,1,0,1,0), c(1,0,0,1,0,1), c(0,1,1,0,0,1), c(0,1,0,1,1,0))scdrep<-svrepdesign(data=scd, type="BRR", repweights=repweights)
weights(scdrep)weights(scdrep, type="sampling")weights(scdrep, type="analysis")weights(scddes)
with.svyimputationList
Analyse multiple imputations
Description
Performs a survey analysis on each of the designs in a svyimputationList objects and returnsa list of results suitable for MIcombine. The analysis may be specified as an expression or as afunction.
Usage
## S3 method for class ’svyimputationList’with(data, expr, fun, ...,multicore=getOption("survey.multicore"))## S3 method for class ’svyimputationList’subset(x, subset,...)
Arguments
data,x A svyimputationList objectexpr An expression giving a survey analysisfun A function taking a survey design object as its argument... for future expansionmulticore Use multicore package to distribute imputed data sets over multiple proces-
sors?subset An logical expression specifying the subset

withReplicates 119
Value
A list of the results from applying the analysis to each design object.
See Also
MIcombine, in the mitools package
Examples
library(mitools)data.dir<-system.file("dta",package="mitools")files.men<-list.files(data.dir,pattern="m.\\.dta$",full=TRUE)men<-imputationList(lapply(files.men, foreign::read.dta))files.women<-list.files(data.dir,pattern="f.\\.dta$",full=TRUE)women<-imputationList(lapply(files.women, foreign::read.dta))men<-update(men, sex=1)women<-update(women,sex=0)all<-rbind(men,women)
designs<-svydesign(id=~id, strata=~sex, data=all)designs
results<-with(designs, svymean(~drkfre))
MIcombine(results)
summary(MIcombine(results))
withReplicates Compute variances by replicate weighting
Description
Given a function or expression computing a statistic based on sampling weights, withReplicatesevaluates the statistic and produces a replicate-based estimate of variance.
Usage
withReplicates(design, theta,..., return.replicates=FALSE)## S3 method for class ’svyrep.design’withReplicates(design, theta, rho = NULL, ..., scale.weights=FALSE, return.replicates=FALSE)## S3 method for class ’svrepvar’withReplicates(design, theta, ..., return.replicates=FALSE)## S3 method for class ’svrepstat’withReplicates(design, theta, ..., return.replicates=FALSE)

120 withReplicates
Arguments
design A survey design with replicate weights (eg from svrepdesign) or a suitableobject with replicate parameter estimates
theta A function or expression: see Details below
rho If design uses BRR weights, rho optionally specifies the parameter for Fay’svariance estimator.
... Other arguments to theta
scale.weights Divide the probability weights by their sum (can help with overflow problems)return.replicates
Return the replicate estimates as well as the variance?
Details
The method for svyrep.design objects evaluates a function or expression using the samplingweights and then each set of replicate weights. The method for svrepvar objects evaluates thefunction or expression on an estimated population covariance matrix and its replicates, to simplifymultivariate statistics such as structural equation models.
For the svyrep.design method, if theta is a function its first argument will be a vector of weightsand the second argument will be a data frame containing the variables from the design object. Ifit is an expression, the sampling weights will be available as the variable .weights. Variables inthe design object will also be in scope. It is possible to use global variables in the expression, butunwise, as they may be masked by local variables inside withReplicates.
For the svrepvar method a function will get the covariance matrix as its first argument, and anexpression will be evaluated with .replicate set to the variance matrix.
For the svrepstat method a function will get the point estimate, and an expression will be evaluatedwith .replicate set to each replicate. The method can only be used when the svrepstat objectincludes replicates.
Value
If return.replicates=FALSE, the weighted statistic, with the variance matrix as the "var" at-tribute. If return.replicates=TRUE, a list with elements theta for the usual return value andreplicates for the replicates.
See Also
svrepdesign, as.svrepdesign, svrVar
Examples
data(scd)repweights<-2*cbind(c(1,0,1,0,1,0), c(1,0,0,1,0,1), c(0,1,1,0,0,1),c(0,1,0,1,1,0))scdrep<-svrepdesign(data=scd, type="BRR", repweights=repweights)
a<-svyratio(~alive, ~arrests, design=scdrep)print(a$ratio)

withReplicates 121
print(a$var)withReplicates(scdrep, quote(sum(.weights*alive)/sum(.weights*arrests)))withReplicates(scdrep, function(w,data)sum(w*data$alive)/sum(w*data$arrests))
data(api)dclus1<-svydesign(id=~dnum, weights=~pw, data=apiclus1, fpc=~fpc)rclus1<-as.svrepdesign(dclus1)varmat<-svyvar(~api00+api99+ell+meals+hsg+mobility,rclus1,return.replicates=TRUE)withReplicates(varmat, quote( factanal(covmat=.replicate, factors=2)$unique) )
data(nhanes)nhanesdesign <- svydesign(id=~SDMVPSU, strata=~SDMVSTRA, weights=~WTMEC2YR, nest=TRUE,data=nhanes)logistic <- svyglm(HI_CHOL~race+agecat+RIAGENDR, design=as.svrepdesign(nhanesdesign),family=quasibinomial, return.replicates=TRUE)fitted<-predict(logistic, return.replicates=TRUE, type="response")sensitivity<-function(pred,actual) mean(pred>0.1 & actual)/mean(actual)withReplicates(fitted, sensitivity, actual=logistic$y)
## Not run:library(quantreg)data(api)## one-stage cluster sampledclus1<-svydesign(id=~dnum, weights=~pw, data=apiclus1, fpc=~fpc)## convert to bootstrapbclus1<-as.svrepdesign(dclus1,type="bootstrap", replicates=100)
## median regressionwithReplicates(bclus1, quote(coef(rq(api00~api99, tau=0.5, weights=.weights))))
## End(Not run)

Index
∗Topic algebrapaley, 41
∗Topic categorysvytable, 108
∗Topic datasetsapi, 4crowd, 23election, 25fpc, 28hospital, 32mu284, 36nhanes, 37scd, 49
∗Topic distributionpchisqsum, 42
∗Topic hplotbarplot.svystat, 11svycdf, 65svycoplot, 69svyhist, 82svyplot, 93svyprcomp, 95svysmooth, 105
∗Topic htestsvyranktest, 99svytable, 108svyttest, 111
∗Topic manipas.fpc, 7as.svydesign2, 10calibrate, 16compressWeights, 21dimnames.DBIsvydesign, 24estweights, 26ftable.svystat, 29nonresponse, 38postStratify, 44rake, 46subset.survey.design, 52
svyby, 62svydesign, 75update.survey.design, 116
∗Topic modelsSE, 51svymle, 89
∗Topic multivariatesvyfactanal, 78svyprcomp, 95
∗Topic optimizesvymle, 89
∗Topic regressionanova.svyglm, 3regTermTest, 48svy.varcoef, 62svycoxph, 71svyglm, 79
∗Topic surveyanova.svyglm, 3as.fpc, 7as.svrepdesign, 8as.svydesign2, 10barplot.svystat, 11bootweights, 12brrweights, 13calibrate, 16compressWeights, 21confint.svyglm, 22dimnames.DBIsvydesign, 24election, 25estweights, 26ftable.svystat, 29hadamard, 31HR, 33make.calfun, 34marginpred, 35nonresponse, 38open.DBIsvydesign, 40paley, 41
122

INDEX 123
pchisqsum, 42postStratify, 44rake, 46stratsample, 51subset.survey.design, 52surveyoptions, 53surveysummary, 54svrepdesign, 58svrVar, 61svy.varcoef, 62svyby, 62svycdf, 65svyciprop, 66svycontrast, 68svycoplot, 69svycoxph, 71svyCprod, 73svydesign, 75svyfactanal, 78svyglm, 79svyhist, 82svykappa, 83svykm, 84svyloglin, 86svylogrank, 88svymle, 89svyolr, 92svyplot, 93svyprcomp, 95svyquantile, 96svyranktest, 99svyratio, 100svyrecvar, 103svysmooth, 105svystandardize, 107svytable, 108svyttest, 111trimWeights, 112twophase, 113update.survey.design, 116weights.survey.design, 117with.svyimputationList, 118withReplicates, 119
∗Topic survivalsvycoxph, 71svykm, 84svylogrank, 88
∗Topic univar
surveysummary, 54svydesign, 75svyquantile, 96
∗Topic utilitiessvyCprod, 73
.svycheck (as.svydesign2), 10[.nonresponse (nonresponse), 38[.repweights_compressed
(compressWeights), 21[.survey.design (subset.survey.design),
52[.svyrep.design (svrepdesign), 58[.twophase (twophase), 113
anova, 3, 48, 49anova.svyglm, 3anova.svyloglin (svyloglin), 86api, 4apiclus1 (api), 4apiclus2 (api), 4apipop (api), 4apisrs (api), 4apistrat (api), 4approxfun, 97as.fpc, 7, 103, 118as.matrix.repweights (compressWeights),
21as.matrix.repweights_compressed
(compressWeights), 21as.svrepdesign, 8, 13, 15, 22, 56, 60, 61, 77,
120as.svydesign2, 10as.vector.repweights_compressed
(compressWeights), 21
barplot, 11barplot.svrepstat (barplot.svystat), 11barplot.svyby (barplot.svystat), 11barplot.svystat, 11binom.test, 67biplot, 95biplot.prcomp, 96biplot.svyprcomp (svyprcomp), 95bootstratum (bootweights), 12bootweights, 9, 12, 60brrweights, 9, 13, 31, 60, 61bxp, 82
cal.linear (make.calfun), 34

124 INDEX
cal.logit (make.calfun), 34cal.raking (make.calfun), 34calibrate, 16, 27, 34, 35, 45–47, 81, 102,
103, 112, 114close, 60, 77close.DBIsvydesign (open.DBIsvydesign),
40close.ODBCsvydesign
(open.DBIsvydesign), 40coef, 48coef.svrepstat (surveysummary), 54coef.svyby (svyby), 62coef.svyglm (svyglm), 79coef.svyloglin (svyloglin), 86coef.svymle (svymle), 89coef.svyratio (svyratio), 100coef.svystat (surveysummary), 54compressWeights, 21, 45, 47confint, 23confint.svrepstat (surveysummary), 54confint.svyby (svyby), 62confint.svyglm, 22confint.svykm (svykm), 84confint.svyratio (svyratio), 100confint.svystat, 67confint.svystat (surveysummary), 54contrasts, 49coxph, 71, 72crowd, 23cv (surveysummary), 54
deff (surveysummary), 54deff.svyby (svyby), 62degf, 56, 78, 80, 97degf (svytable), 108deriv, 69dim.DBIsvydesign
(dimnames.DBIsvydesign), 24dim.ODBCsvydesign
(dimnames.DBIsvydesign), 24dim.repweights_compressed
(compressWeights), 21dim.survey.design
(dimnames.DBIsvydesign), 24dim.svyimputationList
(dimnames.DBIsvydesign), 24dim.svyrep.design
(dimnames.DBIsvydesign), 24dim.twophase (dimnames.DBIsvydesign), 24
dimnames.DBIsvydesign, 24dimnames.ODBCsvydesign
(dimnames.DBIsvydesign), 24dimnames.repweights_compressed
(compressWeights), 21dimnames.survey.design
(dimnames.DBIsvydesign), 24dimnames.svyimputationList
(dimnames.DBIsvydesign), 24dimnames.svyrep.design
(dimnames.DBIsvydesign), 24dimnames.twophase
(dimnames.DBIsvydesign), 24dnorm, 90dotchart (barplot.svystat), 11
election, 25, 33, 77election_insample (election), 25election_jointHR (election), 25election_jointprob (election), 25election_pps (election), 25estWeights, 18, 114estWeights (estweights), 26estweights, 26
factanal, 78, 79fpc, 28ftable, 30ftable.svrepstat (ftable.svystat), 29ftable.svyby, 64ftable.svyby (ftable.svystat), 29ftable.svystat, 29, 55, 56, 64, 110
glm, 62, 81grake (calibrate), 16
hadamard, 14, 15, 31, 41, 42hist, 82hospital, 32HR, 33, 75
image, 59image.svyrep.design (svrepdesign), 58interaction, 55is.hadamard (paley), 41
jk1weights, 60, 61jk1weights (brrweights), 13jknweights, 22, 60, 61jknweights (brrweights), 13

INDEX 125
joinCells (nonresponse), 38
lines.svykm (svykm), 84lines.svysmooth (svysmooth), 105
make.calfun, 17, 19, 34make.formula (surveysummary), 54make.panel.svysmooth (svysmooth), 105marginpred, 35, 114model.frame.svyrep.design
(svrepdesign), 58model.frame.twophase (twophase), 113mrbweights, 9mrbweights (bootweights), 12mu284, 36multistage (svyrecvar), 103multistage.phase1 (twophase), 113
na.exclude.survey.design (svydesign), 75na.exclude.twophase (twophase), 113na.fail.survey.design (svydesign), 75na.fail.twophase (twophase), 113na.omit.survey.design (svydesign), 75na.omit.twophase (twophase), 113neighbours (nonresponse), 38nhanes, 37nlm, 90nonresponse, 38
onestage (svyCprod), 73onestage.phase1 (twophase), 113onestrat (svyCprod), 73onestrat.phase1 (twophase), 113open, 60, 77open.DBIsvydesign, 40open.ODBCsvydesign (open.DBIsvydesign),
40optim, 89, 90
paley, 31, 41panel.smooth, 106par, 85pchisq, 43pchisqsum, 4, 42, 48, 49, 87, 109pFsum (pchisqsum), 42plot, 94plot.lm, 106plot.stepfun, 66plot.svycdf (svycdf), 65
plot.svykm (svykm), 84plot.svykmlist (svykm), 84plot.svysmooth (svysmooth), 105postStratify, 19, 27, 44, 46, 47, 73, 74, 103,
108ppsmat, 75, 76ppsmat (HR), 33prcomp, 95, 96predict.coxph, 72predict.svrepglm (svyglm), 79predict.svycoxph, 35, 85predict.svycoxph (svycoxph), 71predict.svyglm (svyglm), 79predict.svyratio (svyratio), 100predict.svyratio_separate (svyratio),
100print.anova.svyloglin (svyloglin), 86print.nonresponse (nonresponse), 38print.nonresponseSubset (nonresponse),
38print.regTermTest (regTermTest), 48print.summary.svyrep.design
(svrepdesign), 58print.summary.svytable (svytable), 108print.summary.twophase (twophase), 113print.svycdf (svycdf), 65print.svymle (svymle), 89print.svyquantile (svyquantile), 96print.svyratio (svyratio), 100print.svyratio_separate (svyratio), 100print.svyrep.design (svrepdesign), 58print.svysmooth (svysmooth), 105print.twophase (twophase), 113
qr, 109quantile, 85quantile.svykm (svykm), 84
rake, 17, 19, 44, 45, 46regTermTest, 4, 48, 69, 72, 80, 81, 92, 110residuals.svrepglm (svyglm), 79residuals.svyglm (svyglm), 79
sample, 52scd, 49SE, 51, 56SE.svyby (svyby), 62SE.svyquantile (svyquantile), 96SE.svyratio (svyratio), 100
126 INDEX
sparseCells (nonresponse), 38stepfun, 66strata, 88stratsample, 51subbootweights, 9subbootweights (bootweights), 12subset.survey.design, 52, 76, 77subset.svyimputationList
(with.svyimputationList), 118subset.svyrep.design
(subset.survey.design), 52subset.twophase (twophase), 113summary.svrepglm (svyglm), 79summary.svreptable (svytable), 108summary.svyglm (svyglm), 79summary.svymle (svymle), 89summary.svyrep.design (svrepdesign), 58summary.svytable (svytable), 108summary.twophase (twophase), 113survey.adjust.domain.lonely
(surveyoptions), 53survey.drop.replicates (surveyoptions),
53survey.lonely.psu (surveyoptions), 53survey.multicore (surveyoptions), 53survey.replicates.mse (surveyoptions),
53survey.ultimate.cluster
(surveyoptions), 53survey.want.obsolete (surveyoptions), 53surveyoptions, 15, 53, 74surveysummary, 54svrepdesign, 9, 56, 58, 61, 80, 117, 118, 120svreptable (svytable), 108svrVar, 15, 61, 105, 120svy.varcoef, 62svyboxplot (svyhist), 82svyby, 62, 97, 108, 110svycdf, 65svychisq, 87svychisq (svytable), 108svyciprop, 56, 66, 98svycontrast, 56, 63, 68, 84svycoplot, 69svycoxph, 71, 88svyCprod, 62, 73, 76, 77, 105svydesign, 8–10, 33, 40, 52, 56, 60, 62, 74,
75, 80, 90, 102, 114, 117, 118
svyfactanal, 78svyglm, 3, 22, 56, 62, 79, 87, 90, 92, 111svyhist, 66, 82, 106svykappa, 83svykm, 72, 84, 88, 98svyloglin, 86, 110svylogrank, 88, 100svymean, 68, 87, 100, 102, 109–111svymean (surveysummary), 54svymle, 89svyolr, 92svyplot, 70, 83, 93svyprcomp, 95svyquantile, 56, 65, 66, 96svyranktest, 99svyratio, 56, 100svyrecvar, 8, 10, 53, 73, 74, 77, 103, 114svyrecvar.phase1 (twophase), 113svysmooth, 105svystandardize, 107svytable, 11, 64, 94, 108svytotal, 109, 110svytotal (surveysummary), 54svyttest, 56, 81, 100, 111svyvar, 78svyvar (surveysummary), 54symbols, 94
t.test, 111table, 44termplot, 106transform, 117trimWeights, 18, 19, 112twophase, 18, 19, 27, 113, 117twophase2var (twophase), 113twophasevar (twophase), 113
unwtd.count (svyby), 62update.DBIsvydesign, 25update.DBIsvydesign
(update.survey.design), 116update.ODBCsvydesign
(update.survey.design), 116update.survey.design, 64, 77, 116update.svyloglin (svyloglin), 86update.svyrep.design
(update.survey.design), 116update.twophase (update.survey.design),
116

INDEX 127
vcov, 48, 49, 51vcov.svrepstat (surveysummary), 54vcov.svyglm (svyglm), 79vcov.svymle (svymle), 89vcov.svystat (surveysummary), 54
weights.nonresponse (nonresponse), 38weights.survey.design, 117weights.survey_fpc
(weights.survey.design), 117weights.svyrep.design
(weights.survey.design), 117with.svyimputationList, 25, 77, 118withReplicates, 71, 119
xtabs, 44xyplot, 70