Embed Size (px)
Citation preview

September 2012
Monthly Infectious Diseases Surveillance Report
VOLUME 1, ISSUE 10 The Monthly Infectious Diseases Surveillance Report is produced by Public Health Ontario (PHO) for the public health community of Ontario. We anticipate that the report will evolve over time according to our users’ needs and following a formal evaluation in 2012. We welcome feedback by email to [email protected].
Past issues and additional information on the Monthly Infectious Diseases Surveillance Report are available online at: http://www.oahpp.ca/resources/monthly-infectious-diseases-surveillance-report.html.
Infectious Disease in Focus
RABIES Rabies is caused by the rabies virus, which affects only mammals. It is most often spread through the bite of an infected animal, or through contact between broken skin or mucous membranes and saliva from a rabid animal.1 Although extremely rare, person-to-person transmission of rabies has occurred but has only been well documented among recipients of organs from donors with undiagnosed rabies.1,2 Rabies is transmissible to other animals and humans when the virus is present in saliva, which typically occurs prior to onset of symptoms and throughout the course of illness.1 The time from exposure to the rabies virus to the development of related symptoms ranges from three to eight weeks, but can be as short as nine days or as long as seven years.1,2 Early symptoms of human rabies infection are similar to many other illnesses and include fever, headache, general weakness and sensory changes at the site of exposure. As the disease progresses, more classic symptoms of rabies such as excitability, fear of air and water, hypersalivation, delirium and convulsions
In this issue:
INFECTIOUS DISEASE IN FOCUS Rabies
SIGNIFICANT REPORTABLE DISEASE ACTIVITY
INFECTIOUS DISEASE ACTIVITY IN OTHER JURISDICTIONS
Hantavirus Pulmonary Syndrome outbreak at Yosemite National Park Influenza A (H3N2v) variant virus Legionellosis outbreak in Quebec
TELEHEALTH REPORT TeleHealth Call Volumes - Fever/ILI syndrome TeleHealth Call Volumes - Gastrointestinal (GI) syndrome TeleHealth Call Volumes - Respiratory syndrome
ONTARIO OUTBREAK REVIEW
ENHANCED SURVEILLANCE DIRECTIVES (ESD) DISCONTINUED IN AUGUST
REFERENCES
APPENDIX – REPORTABLE DISEASES

Page 2 of 14
Monthly Infectious Diseases Surveillance Report
appear. These classic symptoms, described as “furious rabies”, are observed in two-thirds of cases.1 In other cases, rabies presents as paralysis of the limbs and respiratory muscles, frequently characterized as “dumb rabies”. Death usually occurs within one to two weeks of onset of central nervous system symptoms1, leading to a case fatality rate of almost 100%.3 Unvaccinated domestic animals, mainly dogs and cats, are an important bridge for infection between humans and rabid wildlife. In Ontario and Canada, a combination of wildlife vaccination programs and compulsory vaccination of pets against rabies in most jurisdictions has resulted in a significant decrease in transmission between animals and humans.4,5 Following an exposure, rabies can be prevented by appropriate wound care and prompt medical assessment to determine if rabies post-exposure prophylaxis (PEP) is indicated. Where indicated, appropriate PEP for previously unvaccinated persons is comprised of rabies immune globulin (RIG) and a five-dose series of an approved rabies vaccine.6 Rabies vaccine is also recommended for routine pre-exposure prophylaxis of persons who work with animals, cave explorers and travellers to rabies endemic countries who engage in outdoor or rural excursions that increase the risk of contact with animals.6 Travellers are additionally advised to avoid contact with wild or domestic animals.7
In Canada, rabies is largely confined to wildlife, primarily affecting bats, foxes, racoons and skunks, and occasionally in spill-over populations such as livestock, pets and small rodents.8,9,10 During the late 1980s and continuing into the 2000s, the province experienced a significant reduction in the number of animal rabies cases,10 achieving an annual average of less than 130 cases in animals per year since 2009.9 This decline correlates with the initiation of the province’s wildlife oral rabies vaccination program in 1989.5 Since 1924, 25 human cases of rabies have been reported in Canada, including seven cases in Ontario. Six of the eight cases identified nationally since 1970 have been attributed to infections with rabies strains associated with bats.11,12 The most recent case in Canada occurred in April 2012 in a Toronto resident who lived in the Dominican Republic and travelled to Haiti, countries in which animal and human rabies have been reported. Prior to this case, the last human case of rabies in Toronto occurred in 1931, in Ontario in 1967,4 and in Canada in 2007 in Alberta.13 Ontario’s most recent case of rabies was a Toronto man who returned to Canada in April 2012 after working in the Dominican Republic for several years. He presented to a Toronto hospital within hours of arrival in Canada, citing a 10 day history of increasing neck and shoulder pain, arm tingling and numbness, headache, anxiety and hydrophobia (fear of water), which progressed rapidly to include fever, confusion, seizures, and hypersalivation. Three days after his return, rabies immunofluorescent antibody testing and confirmatory testing by nested polymerase chain reaction (PCR) identified a terrestrial (i.e. non-bat) rabies strain from the Caribbean basin. This rabies strain is frequently found in dogs and mongooses, but most closely matches rabies strains isolated from Haitian dogs. The patient died 30 days after the onset of initial symptoms. Neither the patient nor his family or friends could recall any potential animal exposures in the Dominican Republic, or in Haiti, where he had travelled twice in the previous three to five months. However, laboratory evidence and the patient’s travel history suggests he was most likely exposed to rabies during one of his visits to Haiti, possibly through an unmemorable exposure such as a lick by a stray dog. Following the confirmation of rabies, hospital workers and other close contacts were identified in order to assess their risk of exposure to rabies and the need for PEP. Rabies PEP was indicated as a precautionary measure and provided for five close contacts in Toronto assessed as having possible exposure to saliva through kissing or wiping of the case’s saliva with tissues using ungloved hands. Hospital workers were also evaluated for exposures occurring prior to the implementation of droplet/contact precautions on day two of hospitalization. Fifteen of 150 hospital workers had a potential exposure and were offered rabies PEP. Of these hospital contacts, 12 accepted RIG and vaccine; one accepted the vaccine but refused RIG and two refused all PEP. Three additional hospital workers with ill-defined exposures were also given PEP. In the

Page 3 of 14
Monthly Infectious Diseases Surveillance Report
Dominican Republic, an additional 15 close contacts received PEP. Investigation of the case’s return to Toronto (including the flight) identified no exposures warranting PEP. An estimated 10 million people worldwide receive rabies PEP annually for exposures to potentially rabid animals.14 In Ontario, risk assessments for reported animal exposures are conducted by local health units. Although human and animal cases of rabies are rare in Ontario, the number of assessments of human contact with potentially rabid animals in Ontario remains high.10 In the 1980s, requests for PEP averaged 2,400 per year but declined to 1,500 per year in the 1990s following the implementation of the wildlife vaccination program.10 From 2007 to 2011, 8,818 animal exposures requiring PEP were reported in Ontario through the integrated Public Health Information System (iPHIS), representing an average of 1,764 PEP regimens per year. Overall, the number of requests for PEP declined significantly from 2,089 regimens in 2007 to 1,340 in 2011 – a 38% decrease in incidence from 16.3 to 10.1 rabies PEP regimens per 100,000 population, respectively (p<0.05) (Figure 1). Over this period, annual decreases were observed every year except 2008 when exposure to a rabid puppy at a public market resulted in the mass prophylaxis of over 320 persons. Figure 1. Number and incidence rate of animal exposures requiring rabies post-exposure prophylaxis, Ontario: 2007-2011
Sources: PEP data - Ontario Ministry of Health and Long-Term Care, integrated Public Health Information System (iPHIS) database, extracted by Public Health Ontario [2012/08/28]. Population data - Ontario Ministry of Health and Long-Term Care, IntelliHEALTH Ontario, extracted by PHO [2012/03/15]. On average, more than half of all exposures requiring PEP from 2007 to 2011 (52%) were due to contact with family pets, particularly dogs and cats. Contact with bats (32%) and other wild animals such as raccoons, foxes, squirrels/chipmunks and skunks (12%) was the second most frequent animal exposure category, accounting for a total of 44% of PEP requests made from 2007 to 2011. Contact with other animals and unknown animals accounted for the remaining requests for PEP at 4% and 1%, respectively (Figure 2). During this time, there was a significant increase in the proportion of exposures to family pets (63%) and wild animals excluding bats (75%), and a significant decrease of 55% in the proportion of exposures to bats (p<.05). From 2009 to 2011, 42% of all animal exposures requiring PEP occurred in the warmer months from June to August when more people engage in outdoor activities.
2089
2506
15171366 1340
0
500
1000
1500
2000
2500
3000
2007 2008 2009 2010 2011
Reported Year
Num
ber o
f exp
osur
es re
quiri
ng P
EP
0
5
10
15
20
25
Inci
denc
e ra
te p
er 1
00,0
00
Number of PEP Incidence/100,000

Page 4 of 14
Monthly Infectious Diseases Surveillance Report
Figure 2. Proportion of animal exposures requiring rabies post-exposure prophylaxis by animal type, Ontario: 2007-2011
Ontario Ministry of Health and Long-Term Care, integrated Public Health Information System (iPHIS) database, extracted by Public Health Ontario [2012/08/28]. * Other animals include livestock and animals reported as “OTHER”. In 2011, all health units in Ontario reported requests for PEP. More than two-thirds (25/36) reported incidence rates that were greater than the overall provincial rate of 10.1 PEP requests per 100,000 population. Timiskaming Health Unit reported the highest incidence rate in 2011, with 38 requests for PEP per 100,000 population, accounting for 1% of total requests in 2011. Perth District and Peterborough County-City health units followed with 22 and 21 requests for PEP per 100,000 population, respectively, and together accounted for 3% of total requests for PEP in 2011. On the other hand, exposures requiring PEP were most frequently reported by health units with large urban centres such as Toronto with 234 requests, representing 17% of total requests reported in that year for a rate of 9 PEP requests per 100,000 population. Durham Region followed with 92 reported requests, or 7% of total requests reported in 2011 for a rate of 15 PEP requests per 100,000 population. Although the figures presented in this summary are likely an under-estimation of animal exposures in Ontario, the trends are nonetheless useful in informing the development and evaluation of related policies and programmes. The cost of PEP to prevent rabies after animal exposures varies by the weight of the exposed and is provided by the province at an average cost of CA $2,000 - $2,500 per regimen, excluding public health and medical assessment costs (Ontario Government Pharmacy). The high cost of rabies PEP coupled with the recent shortages in the vaccine component of the regimen suggests the continued need for a multi-faceted strategy that promotes responsible pet ownership (e.g. vaccination of pets), responsible behaviour around stray and wild animals, especially bats, pre-exposure prophylaxis for persons at greater risk of exposure, and evidenced-based risk assessments by physicians coupled with stronger public health support for physicians who assess risk. This “In Focus” on rabies commemorates World Rabies Day on September 28, 2012. The summary was produced jointly by PHO and Dr. Elizabeth Rea, Associate Medical Officer of Health at Toronto Public Health.
0%
10%
20%
30%
40%
50%
60%
70%
2007 2008 2009 2010 2011
Annu
al %
of a
nim
al e
xpos
ures
requ
iring
PEP
Reported year
Family pets Bats Other wild animals Other animals* Unknown
Page 5 of 14
Monthly Infectious Diseases Surveillance Report
Significant Reportable Disease Activity
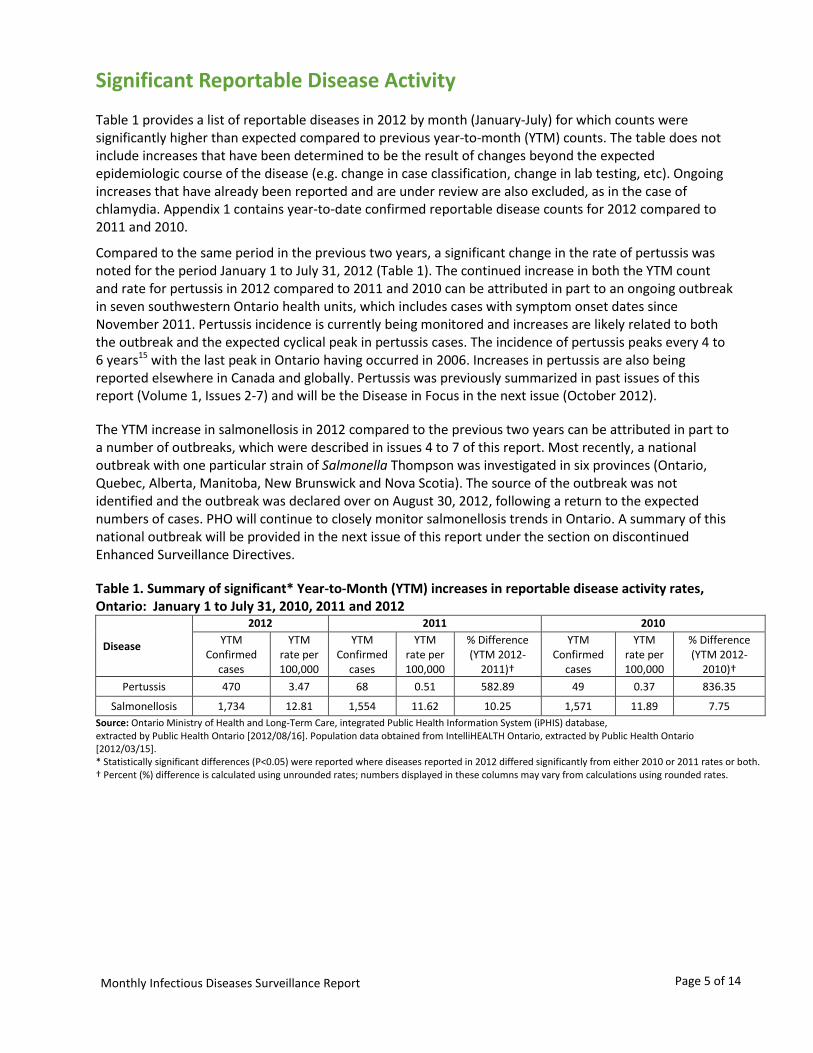
Table 1 provides a list of reportable diseases in 2012 by month (January-July) for which counts were significantly higher than expected compared to previous year-to-month (YTM) counts. The table does not include increases that have been determined to be the result of changes beyond the expected epidemiologic course of the disease (e.g. change in case classification, change in lab testing, etc). Ongoing increases that have already been reported and are under review are also excluded, as in the case of chlamydia. Appendix 1 contains year-to-date confirmed reportable disease counts for 2012 compared to 2011 and 2010.
Compared to the same period in the previous two years, a significant change in the rate of pertussis was noted for the period January 1 to July 31, 2012 (Table 1). The continued increase in both the YTM count and rate for pertussis in 2012 compared to 2011 and 2010 can be attributed in part to an ongoing outbreak in seven southwestern Ontario health units, which includes cases with symptom onset dates since November 2011. Pertussis incidence is currently being monitored and increases are likely related to both the outbreak and the expected cyclical peak in pertussis cases. The incidence of pertussis peaks every 4 to 6 years15 with the last peak in Ontario having occurred in 2006. Increases in pertussis are also being reported elsewhere in Canada and globally. Pertussis was previously summarized in past issues of this report (Volume 1, Issues 2-7) and will be the Disease in Focus in the next issue (October 2012).
The YTM increase in salmonellosis in 2012 compared to the previous two years can be attributed in part to a number of outbreaks, which were described in issues 4 to 7 of this report. Most recently, a national outbreak with one particular strain of Salmonella Thompson was investigated in six provinces (Ontario, Quebec, Alberta, Manitoba, New Brunswick and Nova Scotia). The source of the outbreak was not identified and the outbreak was declared over on August 30, 2012, following a return to the expected numbers of cases. PHO will continue to closely monitor salmonellosis trends in Ontario. A summary of this national outbreak will be provided in the next issue of this report under the section on discontinued Enhanced Surveillance Directives.
Table 1. Summary of significant* Year-to-Month (YTM) increases in reportable disease activity rates, Ontario: January 1 to July 31, 2010, 2011 and 2012
Disease
2012 2011 2010 YTM
Confirmed cases
YTM rate per 100,000
YTM Confirmed
cases
YTM rate per 100,000
% Difference (YTM 2012-
2011)†
YTM Confirmed
cases
YTM rate per 100,000
% Difference (YTM 2012-
2010)† Pertussis 470 3.47 68 0.51 582.89 49 0.37 836.35
Salmonellosis 1,734 12.81 1,554 11.62 10.25 1,571 11.89 7.75 Source: Ontario Ministry of Health and Long-Term Care, integrated Public Health Information System (iPHIS) database, extracted by Public Health Ontario [2012/08/16]. Population data obtained from IntelliHEALTH Ontario, extracted by Public Health Ontario [2012/03/15]. * Statistically significant differences (P<0.05) were reported where diseases reported in 2012 differed significantly from either 2010 or 2011 rates or both. † Percent (%) difference is calculated using unrounded rates; numbers displayed in these columns may vary from calculations using rounded rates.

Page 6 of 14
Monthly Infectious Diseases Surveillance Report
Infectious Disease Activity in Other Jurisdictions This section of the report provides a snapshot of current activity related to infectious diseases across Canada and/or globally. The items included in this section are selected based on ongoing or potential impact on public health in Ontario.
HANTAVIRUS PULMONARY SYNDROME OUTBREAK AT YOSEMITE NATIONAL PARK
The US Centers for Disease Control and Prevention (CDC) and the California State Department of Health are investigating an outbreak of hantavirus pulmonary syndrome (HPS) at Yosemite National Park. As of September 13, 2012, nine cases and three deaths have been confirmed in visitors since June of this year. HPS is a rare but serious rodent-borne disease associated with rodent infestations around the home. http://www.cdc.gov/hantavirus/outbreaks/yosemite-national-park-2012.html
Editor’s Note: Annually, 3.5 million visitors from around the world visit Yosemite National Park to explore, lodge or camp, presenting a potential risk for travelers from Ontario. Human cases of HPS occur infrequently in Canada with one to eight reported cases per year for a total of 79 cases since 1994, mostly in the western provinces. In Ontario, HPS has been identified in mice and meadow voles, however, no human cases of HPS have been reported in Ontario since the disease became reportable in 2001.
INFLUENZA A (H3N2V) VARIANT VIRUS
As of September 21, 2012, 305 cases of influenza A H3N2v virus have been reported in the US since July 2012. The CDC reports that confirmed cases with this new virus continue to be associated with prolonged exposures to swine, particularly in fair settings; person-to-person transmission is limited. The number of H3N2v cases is expected to rise in the US because the virus has been found in swine in many states and there is increased exposure to swine at fairs and other events at this time of year.
http://www.cdc.gov/flu/swineflu/h3n2v-outbreak.htm
Editor’s Note: Ontario has not reported any cases of H3N2v to date. Symptoms and outcomes for this influenza strain are similar to those observed for seasonal influenza. In addition to everyday preventive actions against influenza spread, infection with H3N2v may be prevented by avoiding both extended contact with swine and their environments, as well as food and liquid consumption in such areas, and through proper hand hygiene following contact.
LEGIONELLOSIS OUTBREAK IN QUEBEC
Quebec City is investigating a local outbreak of legionellosis. As of September 24, 2012, 180 confirmed cases, including thirteen deaths, have been reported. Investigations conducted to date have not confirmed the source of the outbreak. The leading hypothesis is cooling towers in a specific area of the city and local authorities have disinfected more than 100 cooling towers as a precautionary measure.
http://www.dspq.qc.ca/legionellose.html
Editor’s Note: Legionellosis does not spread from person to person and the suspected exposure is confined to Quebec City. To date, no cases linked to this outbreak have been identified in Ontario; however, the number of cases reported in Ontario in August 2012 is higher than expected. No common exposures have been identified for cases reported in Ontario since August 1. The proper maintenance of cooling towers and water systems are often highlighted as important ways of preventing contamination with Legionella.

Page 7 of 14
Monthly Infectious Diseases Surveillance Report
Telehealth Report Telehealth Ontario is a toll-free nursing helpline available to all residents of Ontario 24 hours a day, 7 days a week. PHO conducts surveillance using Telehealth call data that has been categorized into three syndromes: Gastrointestinal (GI), Fever/Influenza-like illness (ILI), and Respiratory (which includes both upper and lower respiratory symptoms). Data are used to determine whether observed call volumes are greater than statistically expected and to identify significant clusters of targeted syndromes. Significant geo-temporal clusters (detected using SaTScan) and/or temporal aberrations (detected using the Early Aberration Reporting System [EARS]) are communicated through the Public Health Ontario Portal and directly to the affected health unit(s) when they occur. Aberrations in Telehealth data may precede future case identification and outbreak activity, serving as a potential early warning system for these phenomena.* More information can be found in the Glossary.
In August 2012, two geographically distinct clusters (Table 2) were identified among Telehealth calls, including a GI cluster during the period July 31 to August 6 and a respiratory cluster identified during the period August 20 to 26. Additionally, two respiratory EARS flags, indicating statistically significant increases above the expected number of calls to Telehealth, were identified (Figure 3).
Table 2. Significant Fever/ILI, Gastrointestinal (GI), and Respiratory syndrome clusters identified by SaTScan in August 2012
Cluster Type Cluster FSA
# FSAs in the cluster
Health Units
affected
Rad (km) Obs Exp Obs/
exp p
Fever / ILI No Fever/ILI clusters identified GI July 31 to
August 6 M2P 3 TPH 2.19 11 3.25 3.38 0.043
Resp August 20 to August 26
P2A 29 GBO, SMD, NPS
109.54 30 15.13 1.98 0.035
Obs = Observed count, Exp = Expected count, FSA = Forward sortation area, Rad = Radius of cluster, Km = Kilometre Source: Ontario Ministry of Health and Long-Term Care, Telehealth Ontario, extracted by Public Health Ontario [2012/09/07].
* Evidence on the use of Telehealth to flag outbreaks is limited; however this information is being provided in order to present full disclosure of information available to Public Health Ontario

Page 8 of 14
Monthly Infectious Diseases Surveillance Report
TELEHEALTH CALL VOLUMES - FEVER/ILI SYNDROME For the month of August 2012, no Fever/ILI syndrome clusters or EARS flags were identified (Table 2 and Figure 3). For several days during the month, Telehealth call volumes were greater than the rolling seven-day average; however a statistically significant difference was not observed (Figure 3).
Figure 3. Fever/ILI syndrome calls: August 1-31, 2012.
Source: Ontario Ministry of Health and Long-Term Care, Telehealth Ontario, extracted by Public Health Ontario [2012/09/07].

Page 9 of 14
Monthly Infectious Diseases Surveillance Report
TELEHEALTH CALL VOLUMES - GASTROINTESTINAL (GI) SYNDROME One cluster pertaining to the GI syndrome was detected among Telehealth calls made in August 2012 (Table 2). The cluster was identified among calls made from July 31 to August 6 in the Toronto area. During the month of August 2012, there were no statistically significant increases in call volumes for the GI syndrome (Figure 4).
Figure 4. Gastrointestinal syndrome calls: August 1-31, 2012.
Source: Ontario Ministry of Health and Long-Term Care, Telehealth Ontario, extracted by Public Health Ontario [2012/09/07].

Page 10 of 14
Monthly Infectious Diseases Surveillance Report
TELEHEALTH CALL VOLUMES - RESPIRATORY SYNDROME One respiratory syndrome cluster was identified in August 2012 (Table 2). The cluster was identified among calls made from August 20 to 26 in Grey-Bruce, Simcoe-Muskoka District and North Bay-Parry Sound District health units (Table 2). Two EARS flags were also generated on August 5 and August 26, indicating an increase above expected in the overall number of calls to Telehealth for the respiratory syndrome (Figure 5).
Figure 5. Respiratory syndrome calls: August 1-31, 2012.
Source: Ontario Ministry of Health and Long-Term Care, Telehealth Ontario, extracted by Public Health Ontario [2012/09/07].

Page 11 of 14
Monthly Infectious Diseases Surveillance Report
Ontario Outbreak Review The review of outbreaks section provides the total number of institutional respiratory infection outbreaks for the 2011-2012 influenza season (Table 3). The number of outbreaks during the same period for the 2009-2010 and 2010-2011 influenza seasons are also presented for comparison.
Table 3. Total number of institutional respiratory infection outbreaks for surveillance season to week 35, Ontario.
Time period Total Number of Confirmed Outbreaks
Total confirmed respiratory infection outbreaks for the 2011-12 season 734 Total confirmed respiratory infection outbreaks for the 2010-11 season 1,040 Total confirmed respiratory infection outbreaks for the 2009-10 season 583
Sources: Ontario Influenza Bulletin - Surveillance Week 34 & 35 (August 19 – September 1, 2012); Surveillance Week 34 & 35 (August 21 – September 3, 2011); and Surveillance Week 34 & 35 (August 22 – September 4, 2010)
Enhanced Surveillance Directives (ESD) Discontinued in August An enhanced surveillance directive for S. Thompson was discontinued during the last week of August. As noted in the Significant Reportable Disease Activity section, the outbreak summary for the national outbreak will be provided in the next issue of this report.

Page 12 of 14
Monthly Infectious Diseases Surveillance Report
References 1. Heymann DL, editor. Control of communicable diseases manual. 19th ed. Washington: American Public Health Association; 2008.
2. Pickering LK, Baker CJ, Kimberlin DW, Long SS, editors. Red book: 2012 report of the Committee on Infectious Diseases. 29th ed. Elk Grove Village, IL: American Academy of Pediatrics; 2012.
3. Rupprecht CE, Hanlon CA, Hemachuda T. Rabies re-examined. Lancet Infect Dis. 2002;2(6):327-43.
4. MacInnes CD. LeBer CA. Wildlife Management Agencies Should Participate in Rabies Control. Wildlife Society Bulletin. 2000;28:1156-67.
5. MacInnes CD, Smith SM, Tinline RR, Ayers NR, Bachmann P, Ball DGA, et al. Elimination of rabies from red foxes in eastern Ontario. J Wildl Dis. 2001;37:119-32.
6. Public Health Agency of Canada (National Advisory Committee on Immunization). Canadian Immunization Guide. 7th ed. Ottawa: Her Majesty the Queen in Right of Canada; 2006. [cited: 2012, August 27]. Available from: http://www.phac-aspc.gc.ca/publicat/cig-gci/pdf/cig-gci-2006_e.pdf.
7. Public Health Agency of Canada. Travel Health Fact Sheet – Rabies [cited 2012 September 19]. Available from: http://www.phac-aspc.gc.ca/tmp-pmv/info/rage-eng.php#4.
8. Varughese P. Rabies Surveillance in Canada. Can Med Assoc J. 1986;134(6):617-8.
9. Canadian Food Inspection Agency. Positive Rabies in Canada [cited 2012 August 27]. Available from: http://www.inspection.gc.ca/english/anima/disemala/rabrag/statse.shtml.
10. LeBer CA. Postexposure treatment and animal rabies, Ontario, 1958-2000. Emerging Infectious Diseases. 2002;8(2):214-7.
11. Johnstone J, Saxinger L, McDermid R, Bagshaw S, Resch L, Lee B, Johnson M, Joffe AM, et al, Human Rabies - Alberta, Canada, 2007. MMWR. 2008;57:197-200.
12. ProMED-mail. Rabies - Canada (03): (Ontario) human ex Dominican Republic (published 2012 April 20 and cited 2012 08 31). Available from: http://www.promedmail.org/direct.php?id=20120420.1108474.
13. Ministry of Health and Long-Term Care. Infectious Diseases Protocol - Disease Specific Chapters (Rabies). Toronto: Queen’s Printer for Ontario; 2008. [cited: 2012, August 27]. Available from: http://www.health.gov.on.ca/english/providers/program/pubhealth/oph_standards/ophs/progstds/idprotocol/appendixa/appendix_a.pdf.
14. World Health Organization. Rabies-General Information [cited 2012 September 19]. Available from: http://www.who.int/rabies/epidemiology/Rabiessurveillance.pdf.
15. National Consensus Conference on Pertussis - Canada Communicable Disease Report ISSN 1188-4169 Volume: 2953 April 2003. [Cited 2012 August 1] Available from: http://resources.cpha.ca/CCIAP/data/105e.pdf.

Page 13 of 14
Monthly Infectious Diseases Surveillance Report
Appendix – Reportable Diseases Appendix 1. Confirmed cases of reportable disease* by month: Ontario, 2010-2012
Sources: Ontario Ministry of Health and Long-Term Care, integrated Public Health Information System (iPHIS) database, extracted [2012/08/16]. Population data obtained from IntelliHEALTH Ontario, retrieved by Public Health Ontario [2012/03/15]. Note 1: Rates presented in the table are per 100,000 population: year-to-date (YTD) and year-to-month (YTM). Note 2: Does not include cases in which the Ministry of Health and Long-Term Care was selected as the Diagnosing Health Unit or cases with a Disposition Description set to ‘does not meet’ or ‘entered in error’. Note 3: Case counts for tuberculosis and AIDS are based on diagnosis date and not episode date. HIV case counts are based on encounter date. Note 4: Differentials in year over year comparisons are reflective of changes in disease incidence and changes in the size of the population. Note 5: The case of rubella reported in January 2012, the case of rabies reported in April 2012 and the measles case reported in May 2012 were related to travel and were not acquired in Ontario. Note 6: Statistical tests comparing rates were not performed when the YTM rate in previous years was zero. * Appendix 1 is not an exhaustive list of all reportable diseases in Ontario. † Percent (%) difference is calculated using unrounded rates; numbers displayed in these columns may vary from calculations using rounded rates. ** For 2010, influenza counts include the influenza A (H1N1) pdm09 counts, in addition to seasonal influenza A, B, and A & B. As influenza A (H1N1)pdm09 aggregate reporting occurred on a weekly basis, the week in which more days belonged to a particular month was counted in that month.

Page 14 of 14
Monthly Infectious Diseases Surveillance Report
Glossary Early Aberration Reporting System (EARS) – Software from the U.S. Centers for Disease Control and Prevention (CDC) designed for aberration detection using public health surveillance data. EARS uses three limited baseline aberration detection methods (based on a positive 1-sided CUSUM calculation) and produces three types of statistically marked aberrations, or flags, when the observed values are greater than statistically expected (details below). More information on EARS can be found at www.bt.cdc.gov/surveillance/ears. C1 (mild) – Lowest sensitivity EARS flag. The baseline period for C1-MILD is obtained from the previous 7 days in closest proximity to the current value. Therefore, when this flag is produced on a particular day, the next day is less likely to produce a flag because the elevated count from the previous day will be incorporated into the new baseline period. C2 (medium) – EARS flag that uses a 7-day baseline period, but with 2-days lag between the baseline and the current day. For example, on the 10th day of surveillance the baseline data will be from day 1 to day 7. This flag is more likely to note high consecutive values, because they are not immediately incorporated into the baseline period as for C1 flag. C3 (ultra) – Highest sensitivity EARS flag. Uses the baseline period as the C2-MEDIUM, but the threshold is based on a 3-day average run length of the one-sided positive CUSUM. It is useful for identifying aberrations that gradually increase over short periods of time. SaTScan – Software that analyzes geospatial and temporal data using space-time scan statistic. It utilizes thousands or millions of overlapping cylinders to define the scanning window with its base representing the geographical area of a potential outbreak and its height representing the number of days. For each cylinder the observed/expected ratio is calculated and the most likely cluster is identified, along with secondary clusters. More information on SaTScan can be found at www.satscan.org.