Embed Size (px)
Citation preview
National Environmental Engineering Research Institute
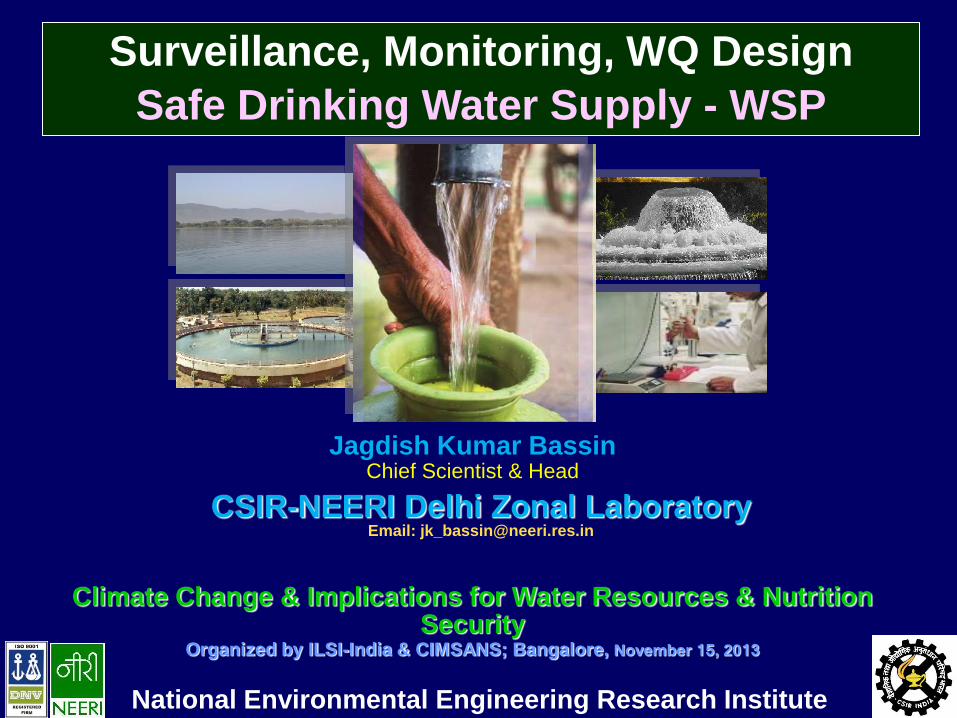
CSIR-NEERI Delhi Zonal Laboratory Email: [email protected]
Jagdish Kumar Bassin Chief Scientist & Head
Climate Change & Implications for Water Resources & Nutrition Security
Organized by ILSI-India & CIMSANS; Bangalore, November 15, 2013
Surveillance, Monitoring, WQ Design Safe Drinking Water Supply - WSP
National Environmental Engineering Research Institute
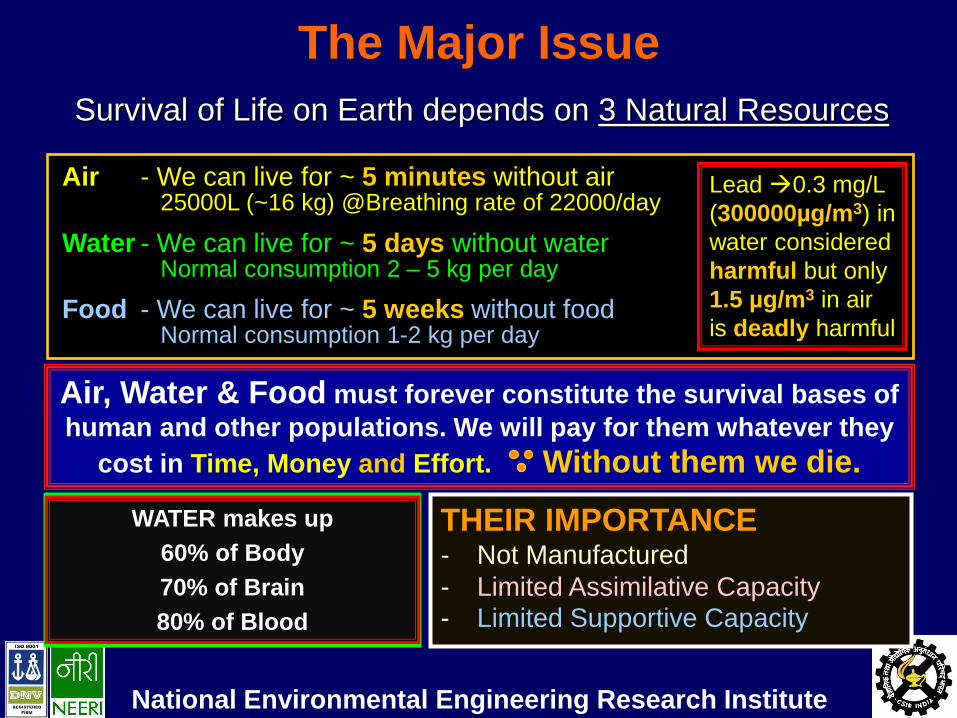
The Major Issue
Spatial Impact Zone - Land : Local
- Water : Regional
- Air : Global
THEIR IMPORTANCE - Not Manufactured
- Limited Assimilative Capacity - Limited Supportive Capacity
Survival of Life on Earth depends on 3 Natural Resources
Air - We can live for ~ 5 minutes without air 25000L (~16 kg) @Breathing rate of 22000/day Water - We can live for ~ 5 days without water Normal consumption 2 – 5 kg per day
Food - We can live for ~ 5 weeks without food Normal consumption 1-2 kg per day
Lead 0.3 mg/L
(300000µg/m3) in
water considered
harmful but only
1.5 µg/m3 in air
is deadly harmful
Air, Water & Food must forever constitute the survival bases of
human and other populations. We will pay for them whatever they
cost in Time, Money and Effort. Without them we die.
WATER makes up
60% of Body
70% of Brain
80% of Blood
National Environmental Engineering Research Institute
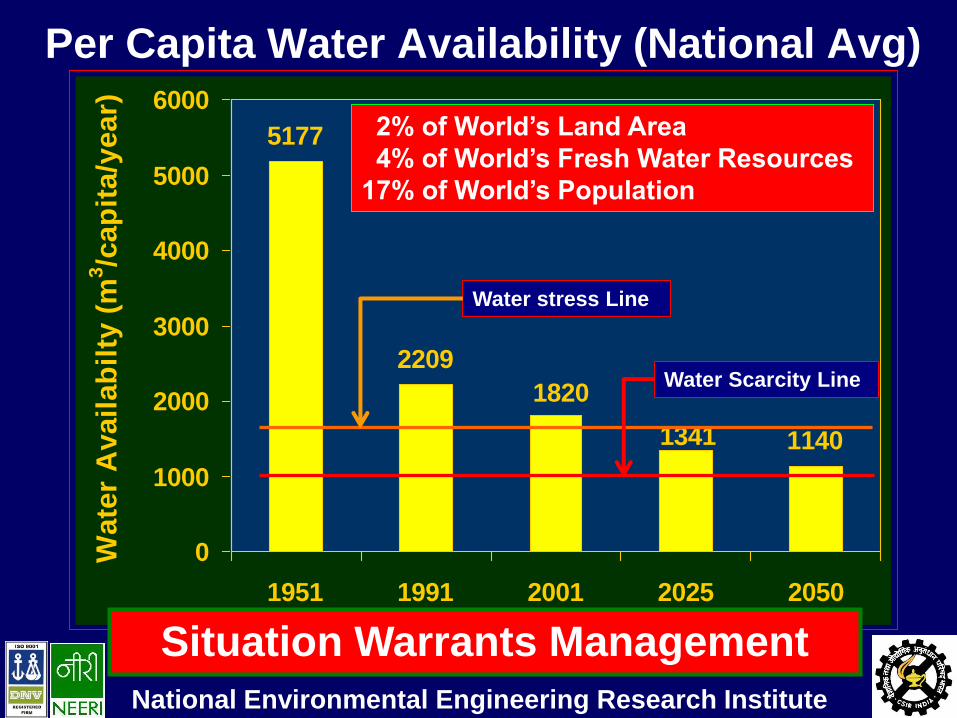
5177
2209
11401341
1820
0
1000
2000
3000
4000
5000
6000
1951 1991 2001 2025 2050
Wa
ter
Av
ail
ab
ilty
(m
3/c
ap
ita
/ye
ar)
Per Capita Water Availability (National Avg)
Water Scarcity Line
Water stress Line
2% of World’s Land Area
4% of World’s Fresh Water Resources
17% of World’s Population
Situation Warrants Management
National Environmental Engineering Research Institute
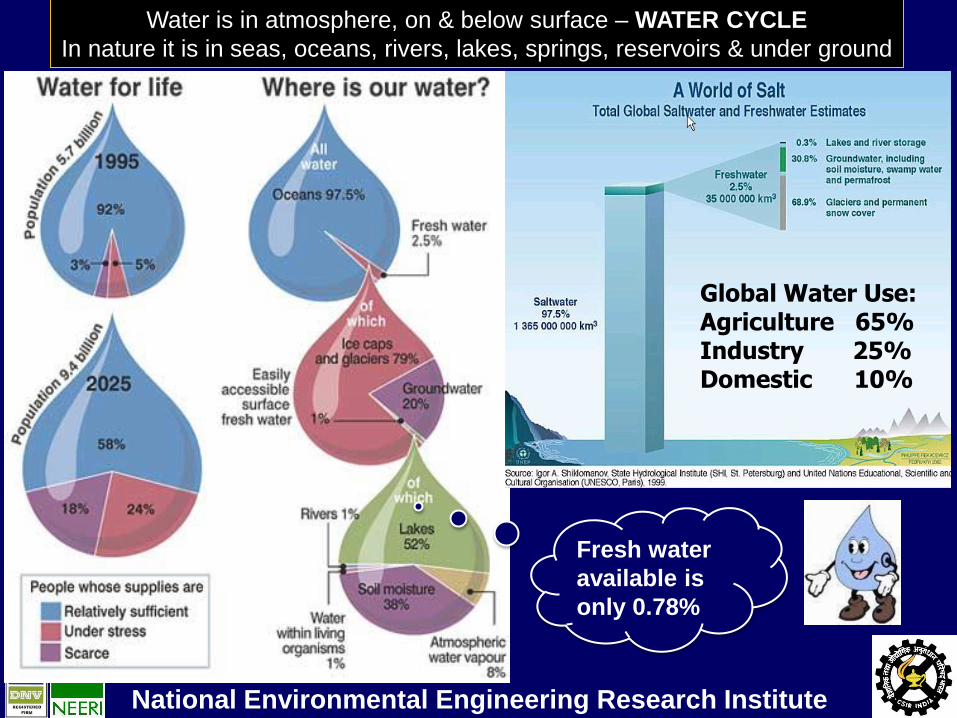
World Water Supply
Global Water Use: Agriculture 65% Industry 25% Domestic 10%
Fresh water
available is
only 0.78%
Water is in atmosphere, on & below surface – WATER CYCLE
In nature it is in seas, oceans, rivers, lakes, springs, reservoirs & under ground
National Environmental Engineering Research Institute
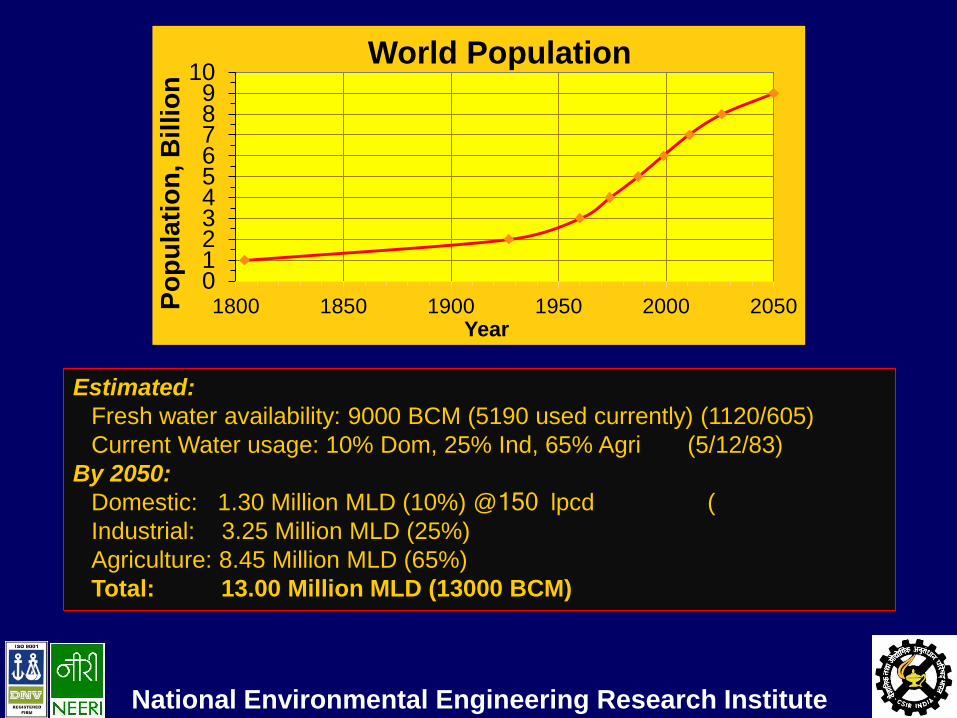
0123456789
10
1800 1850 1900 1950 2000 2050Po
pu
lati
on
, B
illio
n
Year
World Population
Estimated: Fresh water availability: 9000 BCM (5190 used currently) (1120/605) Current Water usage: 10% Dom, 25% Ind, 65% Agri (5/12/83) By 2050: Domestic: 1.30 Million MLD (10%) @150 lpcd ( Industrial: 3.25 Million MLD (25%) Agriculture: 8.45 Million MLD (65%) Total: 13.00 Million MLD (13000 BCM)
National Environmental Engineering Research Institute
National Environmental Engineering Research Institute
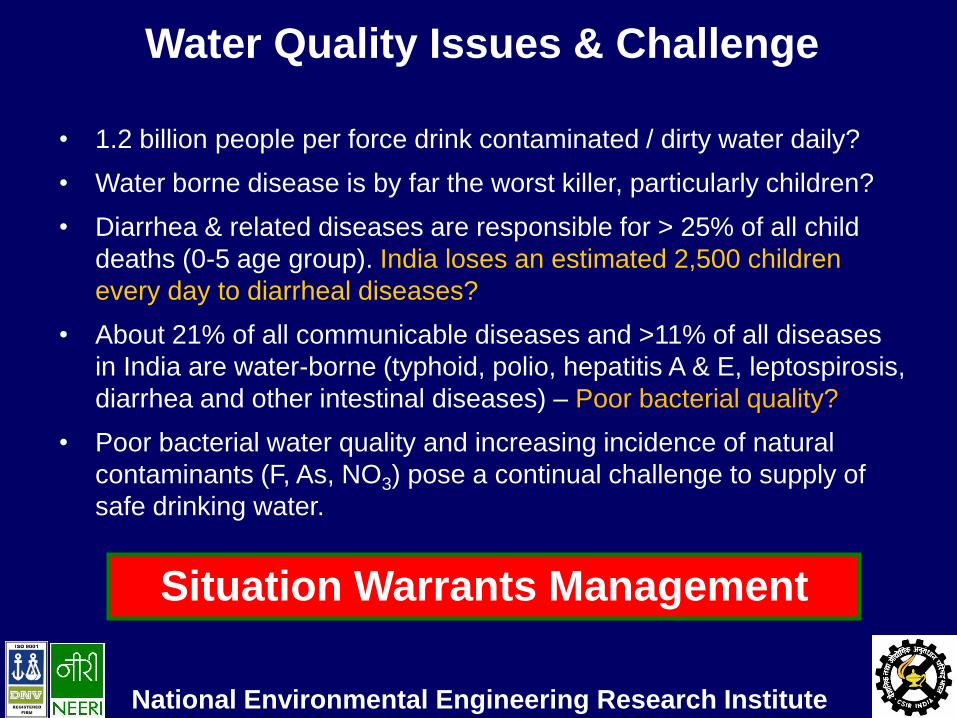
Water Quality Issues & Challenge
Situation Warrants Management
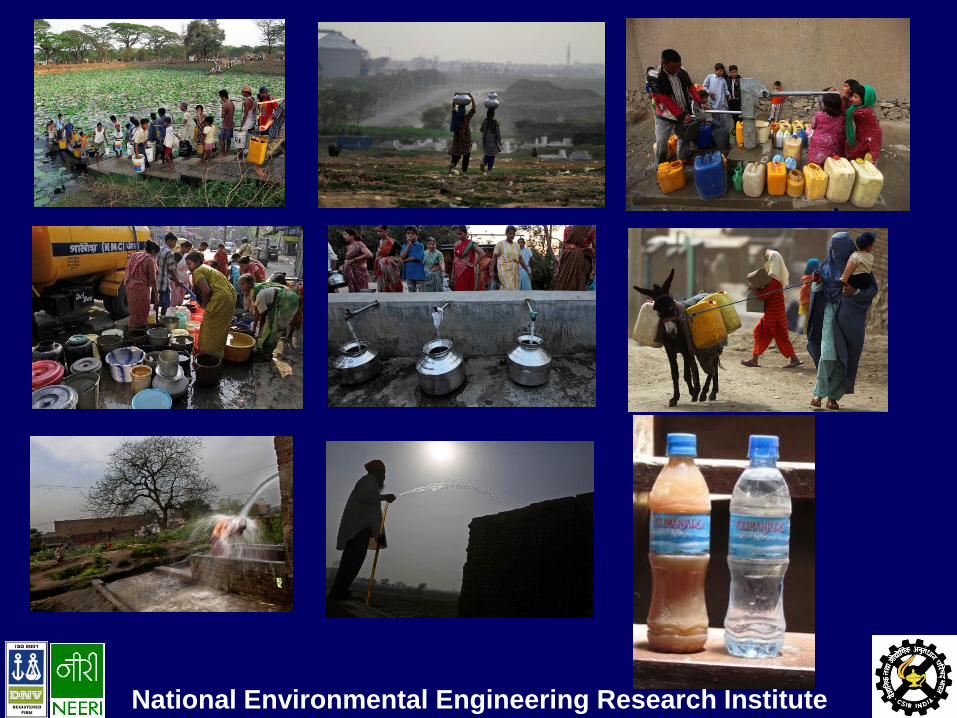
• 1.2 billion people per force drink contaminated / dirty water daily?
• Water borne disease is by far the worst killer, particularly children?
• Diarrhea & related diseases are responsible for > 25% of all child
deaths (0-5 age group). India loses an estimated 2,500 children
every day to diarrheal diseases?
• About 21% of all communicable diseases and >11% of all diseases
in India are water-borne (typhoid, polio, hepatitis A & E, leptospirosis,
diarrhea and other intestinal diseases) – Poor bacterial quality?
• Poor bacterial water quality and increasing incidence of natural
contaminants (F, As, NO3) pose a continual challenge to supply of
safe drinking water.
National Environmental Engineering Research Institute
National Environmental Engineering Research Institute
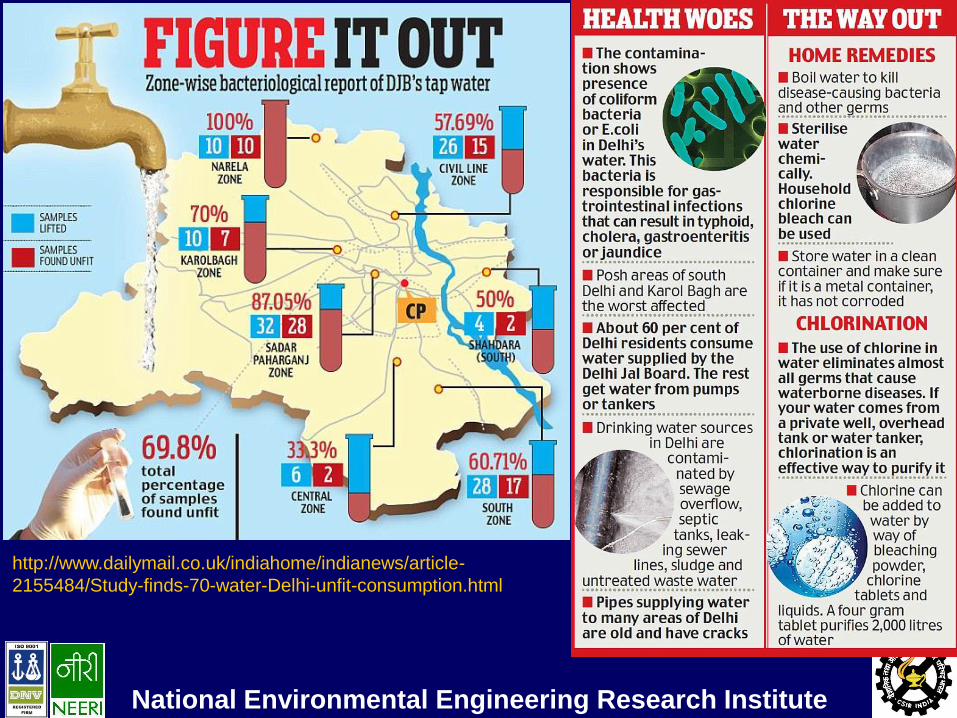
http://www.dailymail.co.uk/indiahome/indianews/article-
2155484/Study-finds-70-water-Delhi-unfit-consumption.html
National Environmental Engineering Research Institute
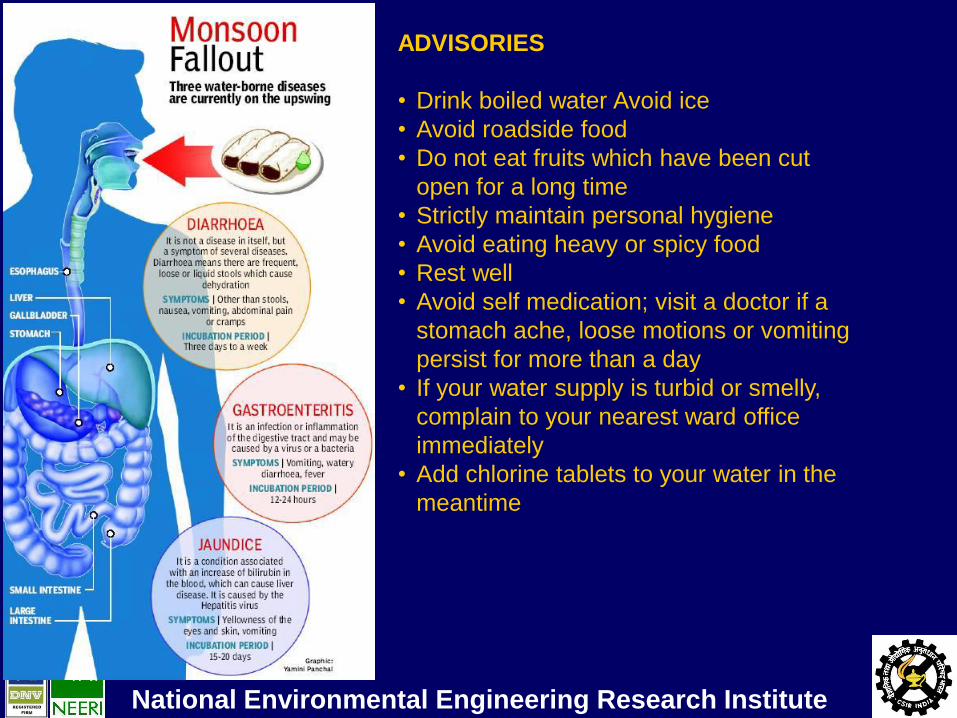
ADVISORIES
• Drink boiled water Avoid ice
• Avoid roadside food
• Do not eat fruits which have been cut
open for a long time
• Strictly maintain personal hygiene
• Avoid eating heavy or spicy food
• Rest well
• Avoid self medication; visit a doctor if a
stomach ache, loose motions or vomiting
persist for more than a day
• If your water supply is turbid or smelly,
complain to your nearest ward office
immediately
• Add chlorine tablets to your water in the
meantime
National Environmental Engineering Research Institute
National Environmental Engineering Research Institute
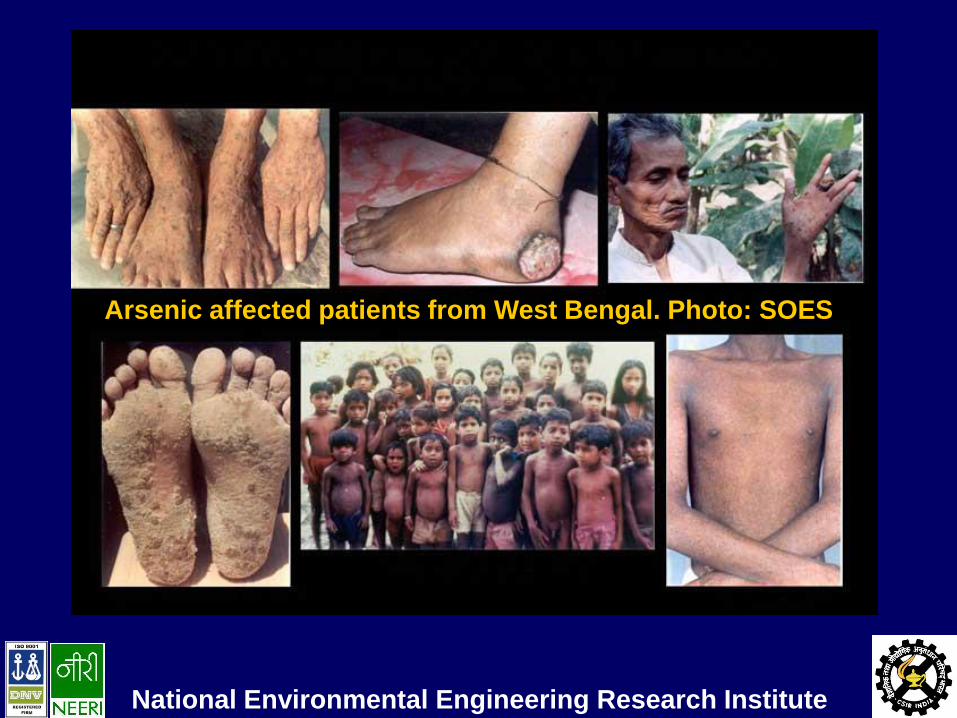
Arsenic affected patients from West Bengal. Photo: SOES
National Environmental Engineering Research Institute
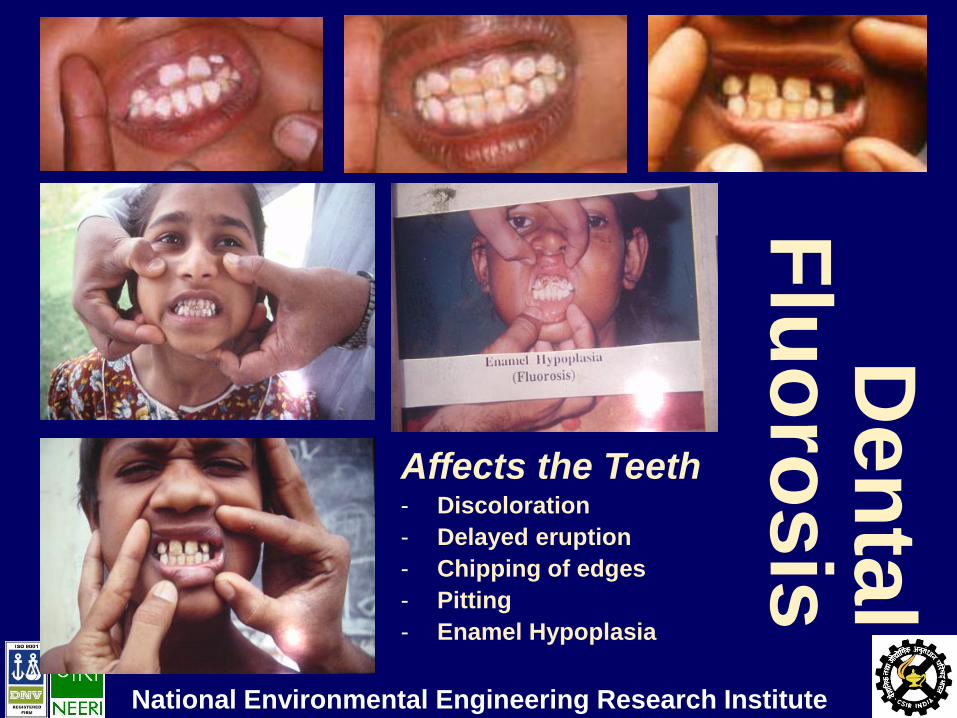
Affects the Teeth - Discoloration
- Delayed eruption
- Chipping of edges
- Pitting
- Enamel Hypoplasia
De
nta
l F
luo
ros
is
National Environmental Engineering Research Institute
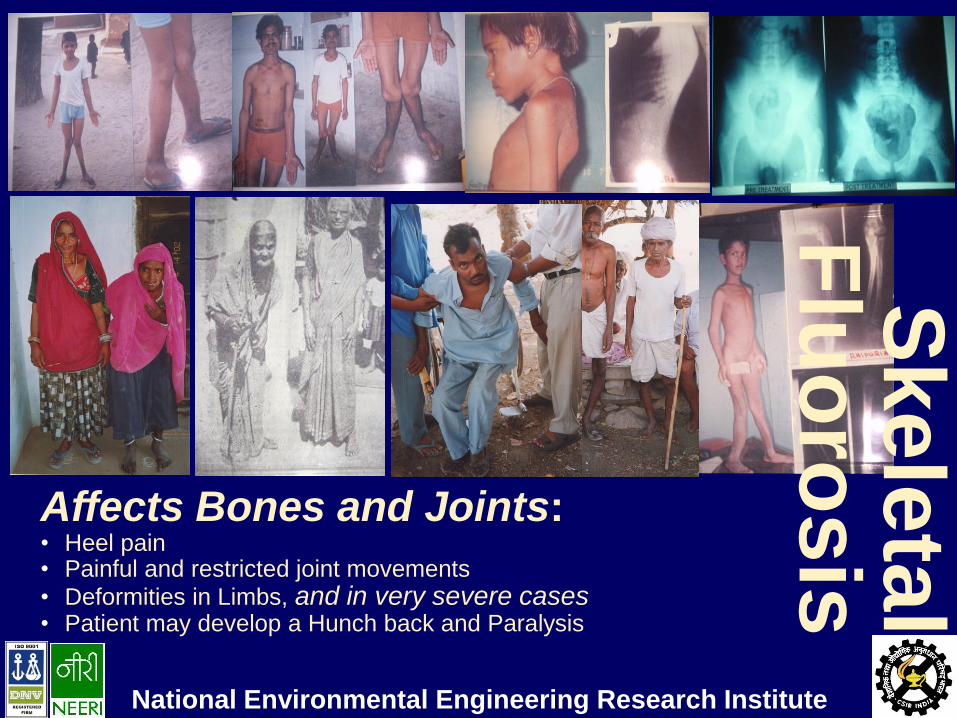
Affects Bones and Joints: • Heel pain • Painful and restricted joint movements
• Deformities in Limbs, and in very severe cases • Patient may develop a Hunch back and Paralysis
Sk
ele
tal
Flu
oro
sis
National Environmental Engineering Research Institute
Water Safety: Historically • Development of Public Water Supplies assumed greater importance with
the progressive increase in urbanisation.
• Potentially great advantages Convenience, health benefits deriving from washing & cleaning.
• Risk to health Large No. of people if contamination occurs.
• Substantiated by recorded outbreaks of diseases Outbreaks of cholera in European cities in the 19th century.
• 1st proof of PWS as source of infection Studies by J.Snow in 1850s.
At that time, water was supplied to London by a number of small companies. S&V Co. obtained its water from the Thames at Batter sea, WL Co. obtained its water from Thames but a considerable distance upstream, above the major sources of pollution from human sewage. Pipes of both companies were laid in the streets with houses connected to one or other source of supply.
Snow's analysis showed striking results: houses served by Lambeth Co. had a lower incidence & those served by S&V Co. had a very high incidence.
Snow concluded water supply route transmitted cholera agent.
National Environmental Engineering Research Institute
Water Safety: Historically
• It is recognised that the key to microbiologically safe drinking
water is the exclusion of fecal contamination.
• Outbreaks of cholera and typhoid in the 19th and the early 20th
centuries led to the wide-spread use of filtration to treat water
supplies followed by the gradual introduction of the use of
chlorine, usually on an intermittent basis, from 1910 onwards.
• The Croydon typhoid outbreak in 1937 led to continuous
chlorination of water being used almost universally on PWS.
Today, most PWS contain disinfectant, normally chlorine,
at a low level at consumer's tap to protect against
contamination, which may occur if integrity of distribution
system is breached (e.g. through pipe burst or cross
contamination).
National Environmental Engineering Research Institute
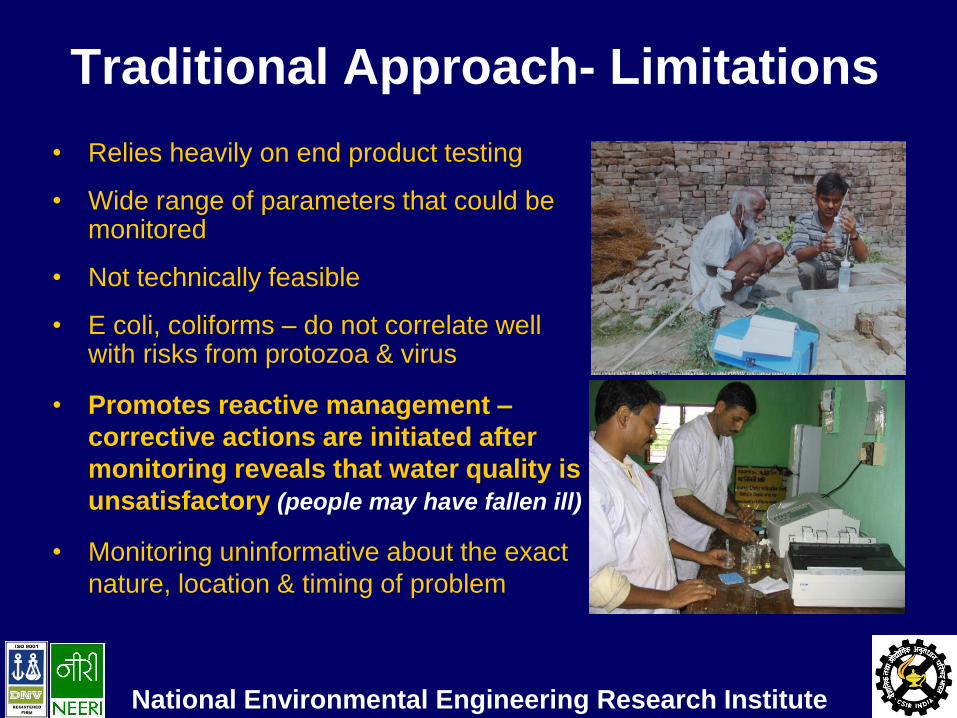
Traditional Approach- Limitations
• Relies heavily on end product testing
• Wide range of parameters that could be monitored
• Not technically feasible
• E coli, coliforms – do not correlate well with risks from protozoa & virus
• Promotes reactive management –
corrective actions are initiated after
monitoring reveals that water quality is
unsatisfactory (people may have fallen ill)
• Monitoring uninformative about the exact
nature, location & timing of problem
National Environmental Engineering Research Institute
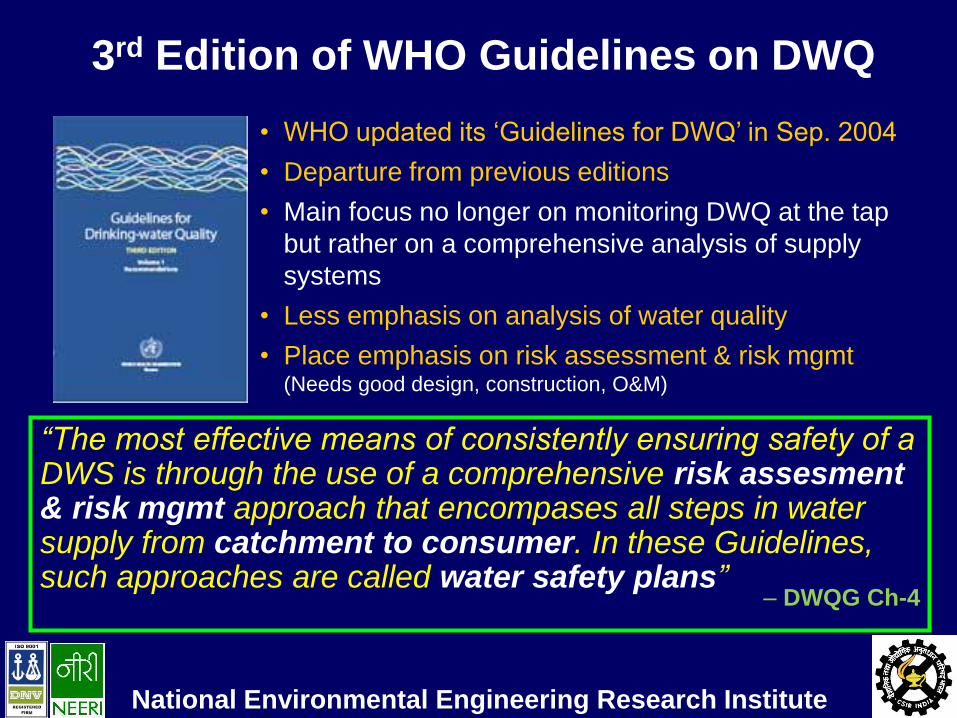
3rd Edition of WHO Guidelines on DWQ
• WHO updated its ‘Guidelines for DWQ’ in Sep. 2004
• Departure from previous editions
• Main focus no longer on monitoring DWQ at the tap
but rather on a comprehensive analysis of supply
systems
• Less emphasis on analysis of water quality
• Place emphasis on risk assessment & risk mgmt (Needs good design, construction, O&M)
“The most effective means of consistently ensuring safety of a DWS is through the use of a comprehensive risk assesment & risk mgmt approach that encompases all steps in water supply from catchment to consumer. In these Guidelines, such approaches are called water safety plans”
– DWQG Ch-4
National Environmental Engineering Research Institute
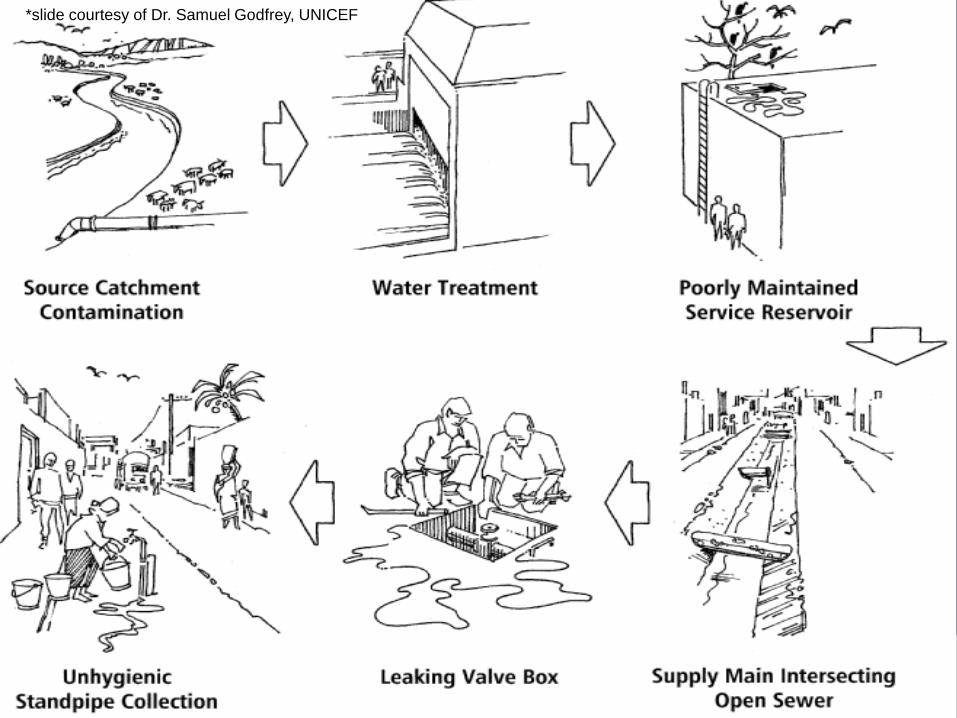
*slide courtesy of Dr. Samuel Godfrey, UNICEF
National Environmental Engineering Research Institute
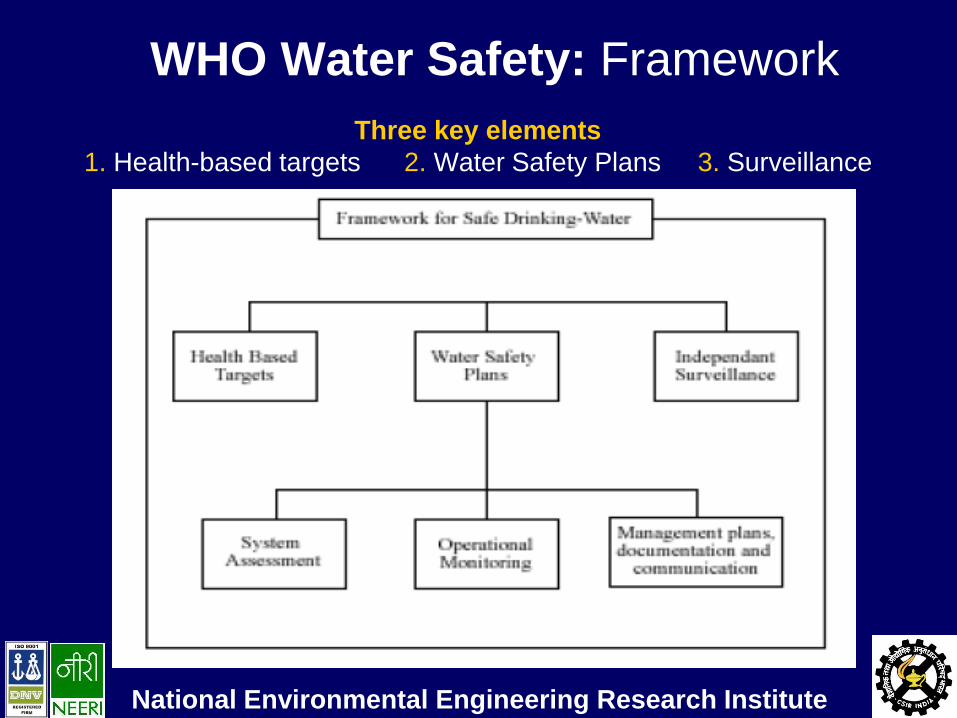
WHO Water Safety: Framework
Three key elements
1. Health-based targets 2. Water Safety Plans 3. Surveillance
National Environmental Engineering Research Institute
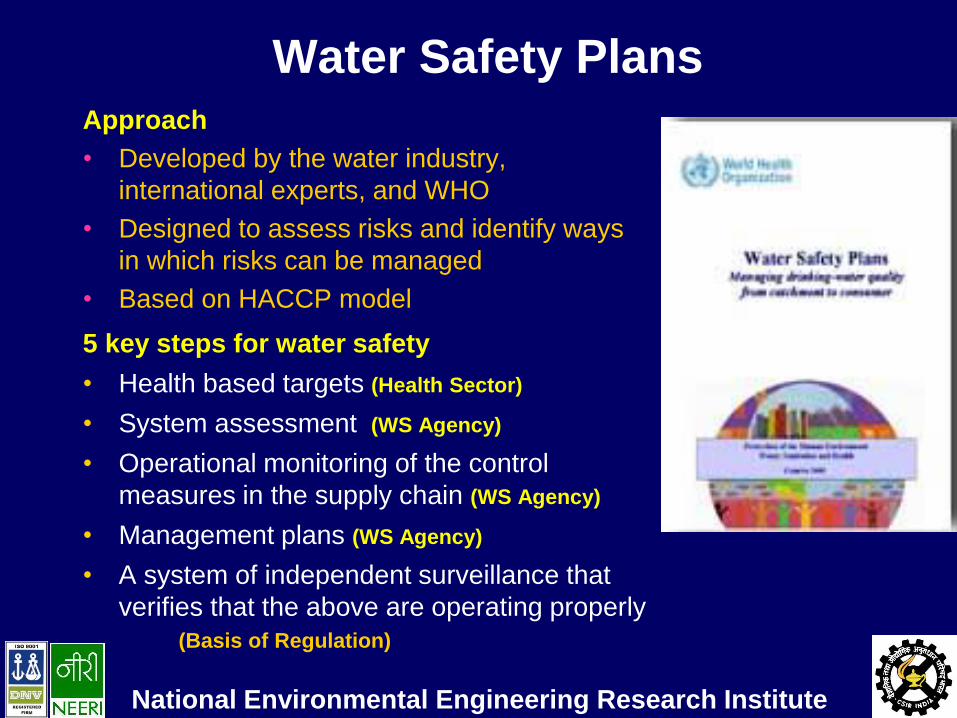
Water Safety Plans Approach
• Developed by the water industry,
international experts, and WHO
• Designed to assess risks and identify ways
in which risks can be managed
• Based on HACCP model
5 key steps for water safety
• Health based targets (Health Sector)
• System assessment (WS Agency)
• Operational monitoring of the control
measures in the supply chain (WS Agency)
• Management plans (WS Agency)
• A system of independent surveillance that
verifies that the above are operating properly
(Basis of Regulation)
National Environmental Engineering Research Institute
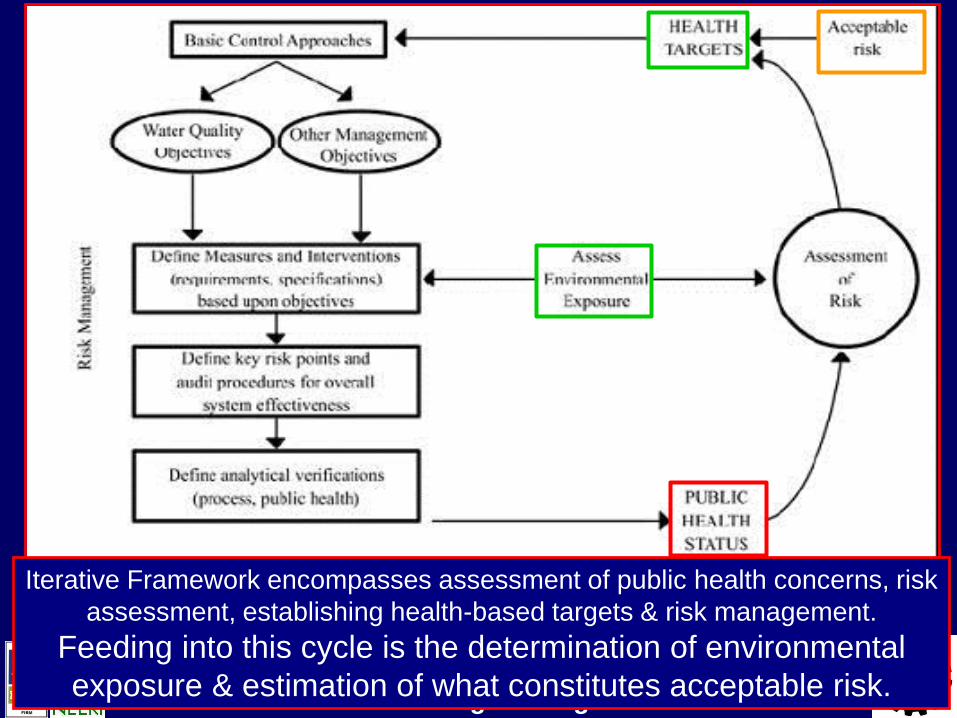
Iterative Framework encompasses assessment of public health concerns, risk
assessment, establishing health-based targets & risk management.
Feeding into this cycle is the determination of environmental
exposure & estimation of what constitutes acceptable risk.
National Environmental Engineering Research Institute
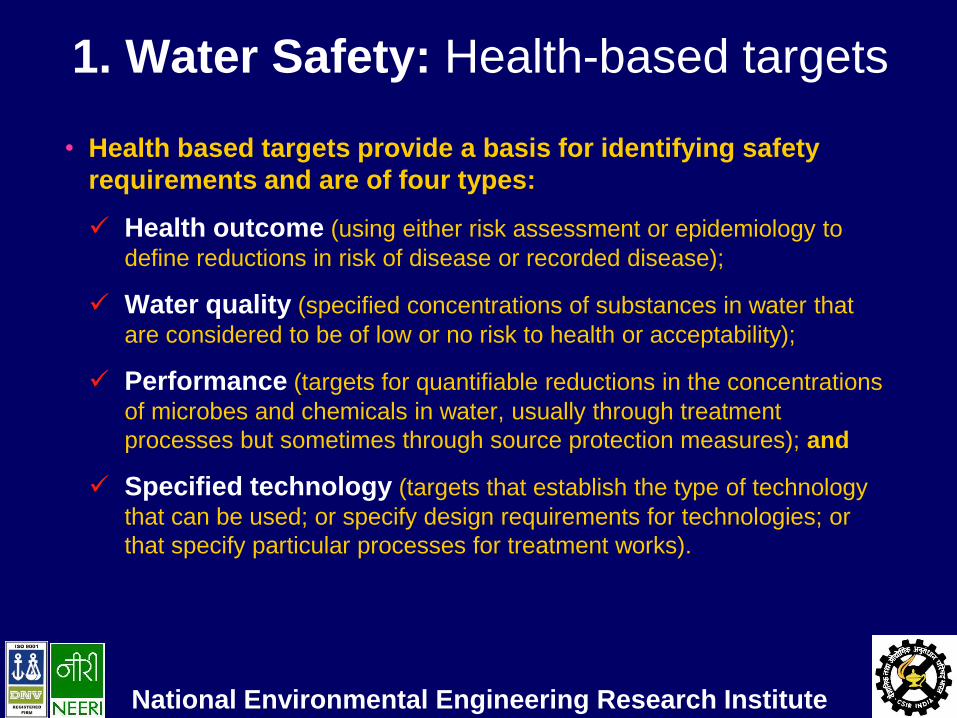
1. Water Safety: Health-based targets
• Health based targets provide a basis for identifying safety
requirements and are of four types:
Health outcome (using either risk assessment or epidemiology to
define reductions in risk of disease or recorded disease);
Water quality (specified concentrations of substances in water that
are considered to be of low or no risk to health or acceptability);
Performance (targets for quantifiable reductions in the concentrations
of microbes and chemicals in water, usually through treatment
processes but sometimes through source protection measures); and
Specified technology (targets that establish the type of technology
that can be used; or specify design requirements for technologies; or
that specify particular processes for treatment works).
National Environmental Engineering Research Institute
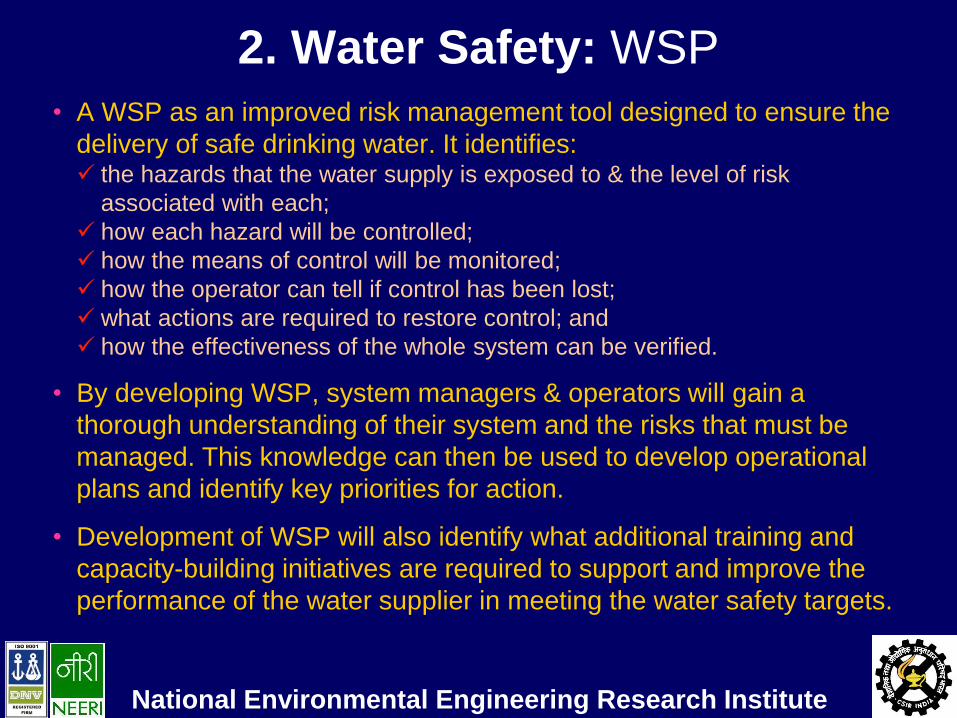
2. Water Safety: WSP
• A WSP as an improved risk management tool designed to ensure the
delivery of safe drinking water. It identifies: the hazards that the water supply is exposed to & the level of risk
associated with each;
how each hazard will be controlled;
how the means of control will be monitored;
how the operator can tell if control has been lost;
what actions are required to restore control; and
how the effectiveness of the whole system can be verified.
• By developing WSP, system managers & operators will gain a
thorough understanding of their system and the risks that must be
managed. This knowledge can then be used to develop operational
plans and identify key priorities for action.
• Development of WSP will also identify what additional training and
capacity-building initiatives are required to support and improve the
performance of the water supplier in meeting the water safety targets.
National Environmental Engineering Research Institute
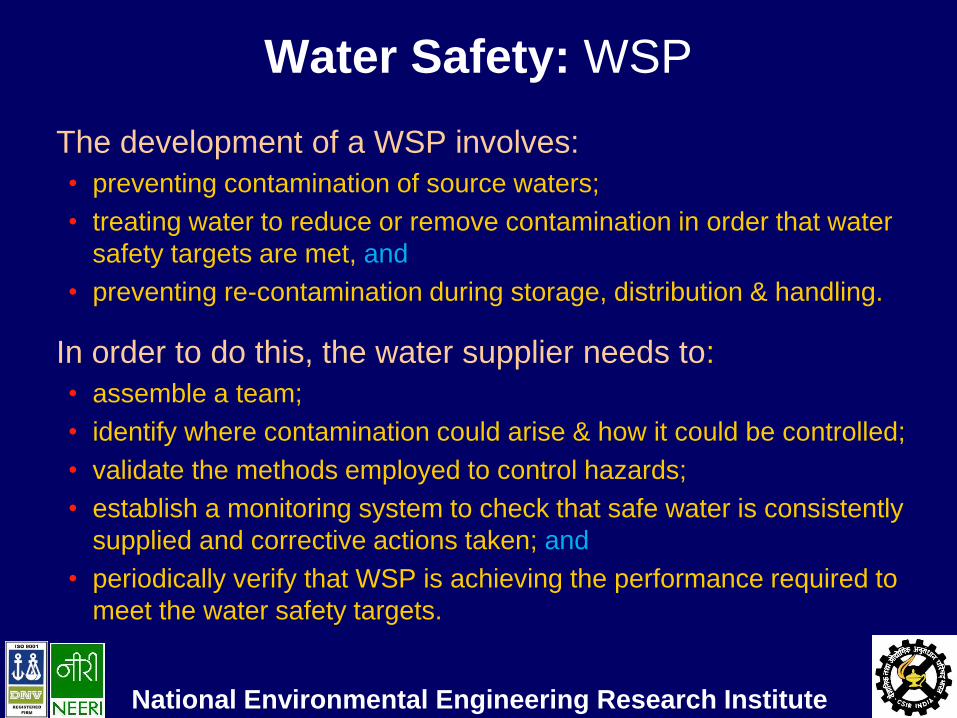
Water Safety: WSP
The development of a WSP involves:
• preventing contamination of source waters;
• treating water to reduce or remove contamination in order that water
safety targets are met, and
• preventing re-contamination during storage, distribution & handling.
In order to do this, the water supplier needs to:
• assemble a team;
• identify where contamination could arise & how it could be controlled;
• validate the methods employed to control hazards;
• establish a monitoring system to check that safe water is consistently
supplied and corrective actions taken; and
• periodically verify that WSP is achieving the performance required to
meet the water safety targets.
National Environmental Engineering Research Institute
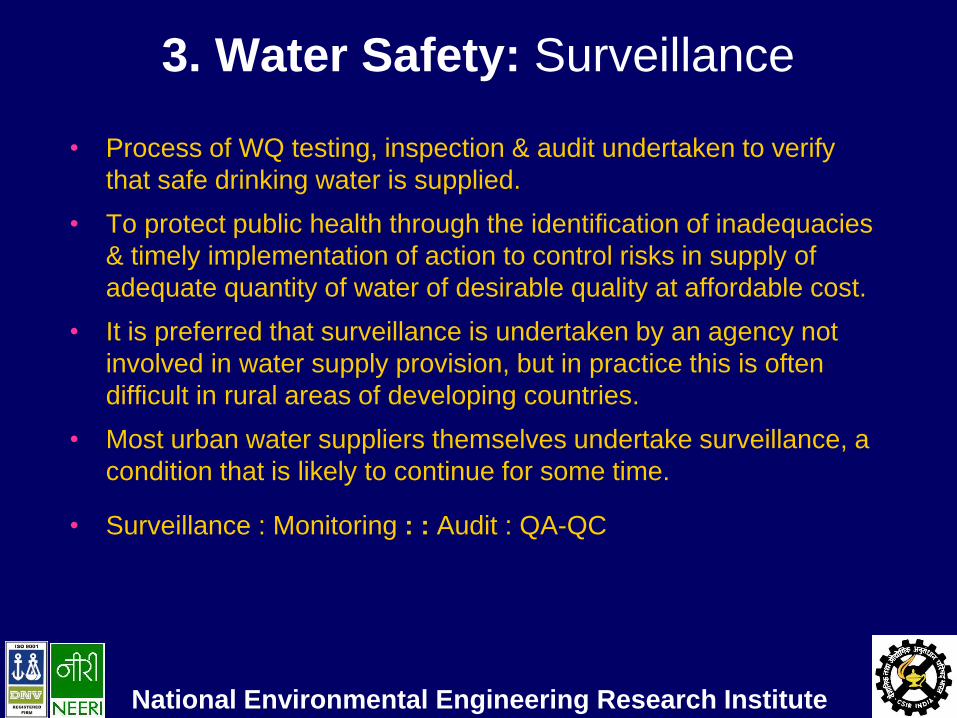
3. Water Safety: Surveillance
• Process of WQ testing, inspection & audit undertaken to verify
that safe drinking water is supplied.
• To protect public health through the identification of inadequacies
& timely implementation of action to control risks in supply of
adequate quantity of water of desirable quality at affordable cost.
• It is preferred that surveillance is undertaken by an agency not
involved in water supply provision, but in practice this is often
difficult in rural areas of developing countries.
• Most urban water suppliers themselves undertake surveillance, a
condition that is likely to continue for some time.
• Surveillance : Monitoring : : Audit : QA-QC
National Environmental Engineering Research Institute
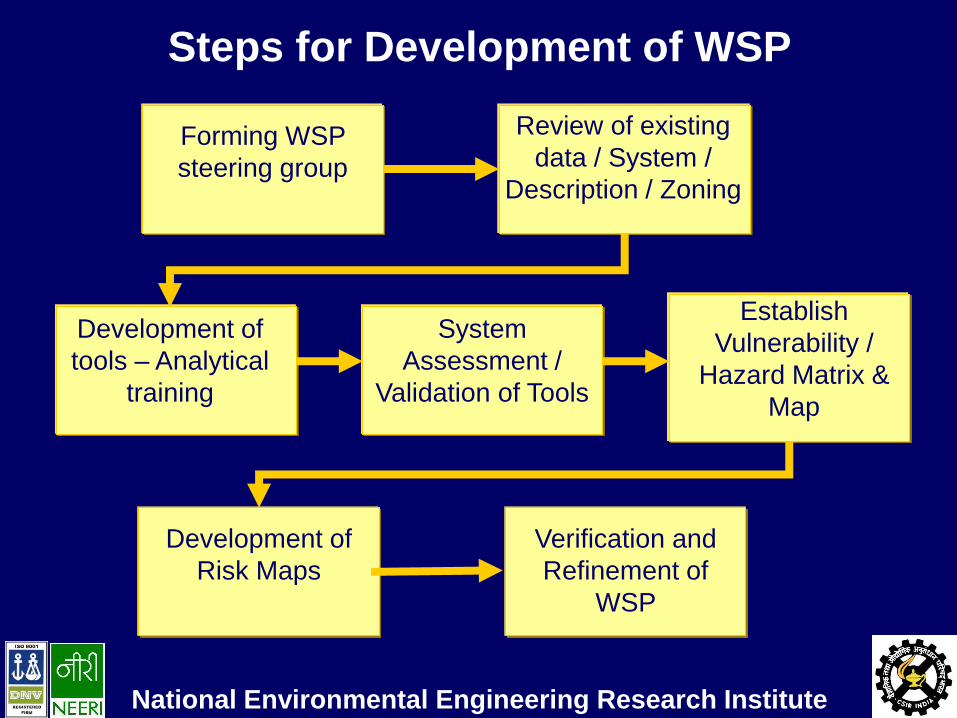
Steps for Development of WSP
Forming WSP
steering group
Review of existing
data / System /
Description / Zoning
Development of
tools – Analytical
training
System
Assessment /
Validation of Tools
Establish
Vulnerability /
Hazard Matrix &
Map
Development of
Risk Maps
Verification and
Refinement of
WSP
National Environmental Engineering Research Institute
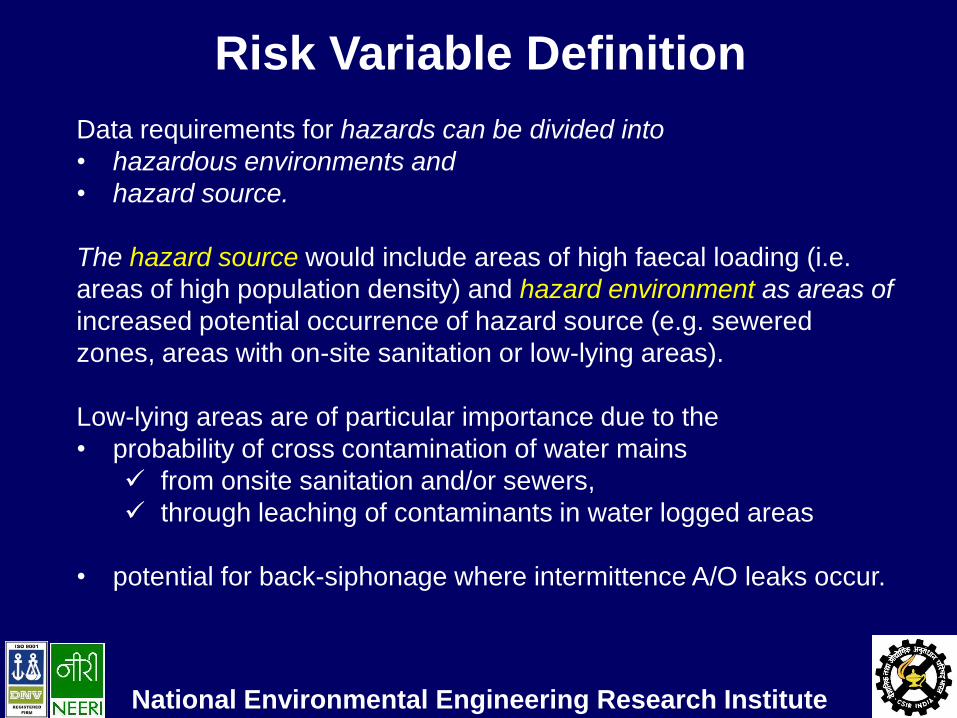
Risk Variable Definition
Data requirements for hazards can be divided into
• hazardous environments and
• hazard source.
The hazard source would include areas of high faecal loading (i.e.
areas of high population density) and hazard environment as areas of
increased potential occurrence of hazard source (e.g. sewered
zones, areas with on-site sanitation or low-lying areas).
Low-lying areas are of particular importance due to the
• probability of cross contamination of water mains
from onsite sanitation and/or sewers,
through leaching of contaminants in water logged areas
• potential for back-siphonage where intermittence A/O leaks occur.
National Environmental Engineering Research Institute
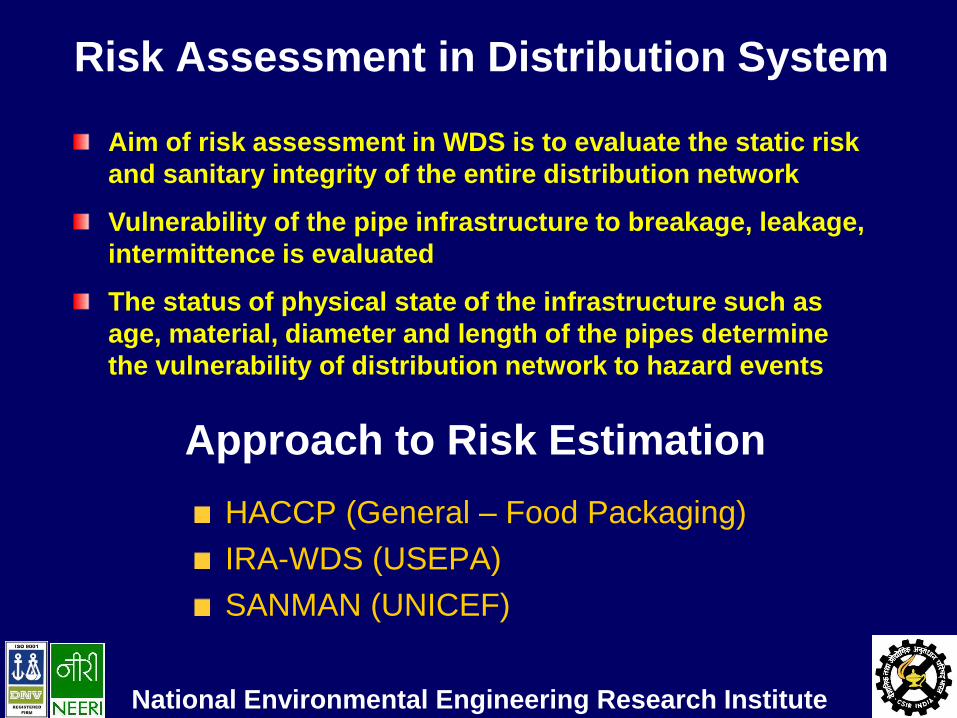
Risk Assessment in Distribution System
Aim of risk assessment in WDS is to evaluate the static risk
and sanitary integrity of the entire distribution network
Vulnerability of the pipe infrastructure to breakage, leakage,
intermittence is evaluated
The status of physical state of the infrastructure such as
age, material, diameter and length of the pipes determine
the vulnerability of distribution network to hazard events
Approach to Risk Estimation
HACCP (General – Food Packaging)
IRA-WDS (USEPA)
SANMAN (UNICEF)
National Environmental Engineering Research Institute
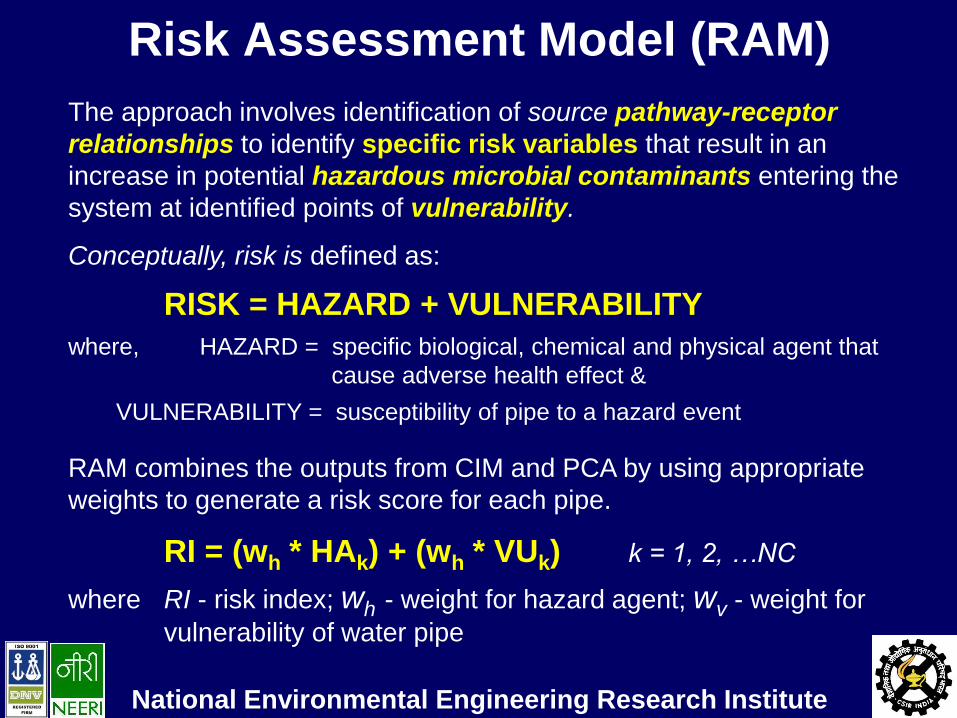
Risk Assessment Model (RAM)
The approach involves identification of source pathway-receptor
relationships to identify specific risk variables that result in an
increase in potential hazardous microbial contaminants entering the
system at identified points of vulnerability.
Conceptually, risk is defined as:
RISK = HAZARD + VULNERABILITY
where, HAZARD = specific biological, chemical and physical agent that
cause adverse health effect &
VULNERABILITY = susceptibility of pipe to a hazard event
RAM combines the outputs from CIM and PCA by using appropriate
weights to generate a risk score for each pipe.
RI = (wh * HAk) + (wh * VUk) k = 1, 2, …NC
where RI - risk index; wh - weight for hazard agent; wv - weight for
vulnerability of water pipe
National Environmental Engineering Research Institute
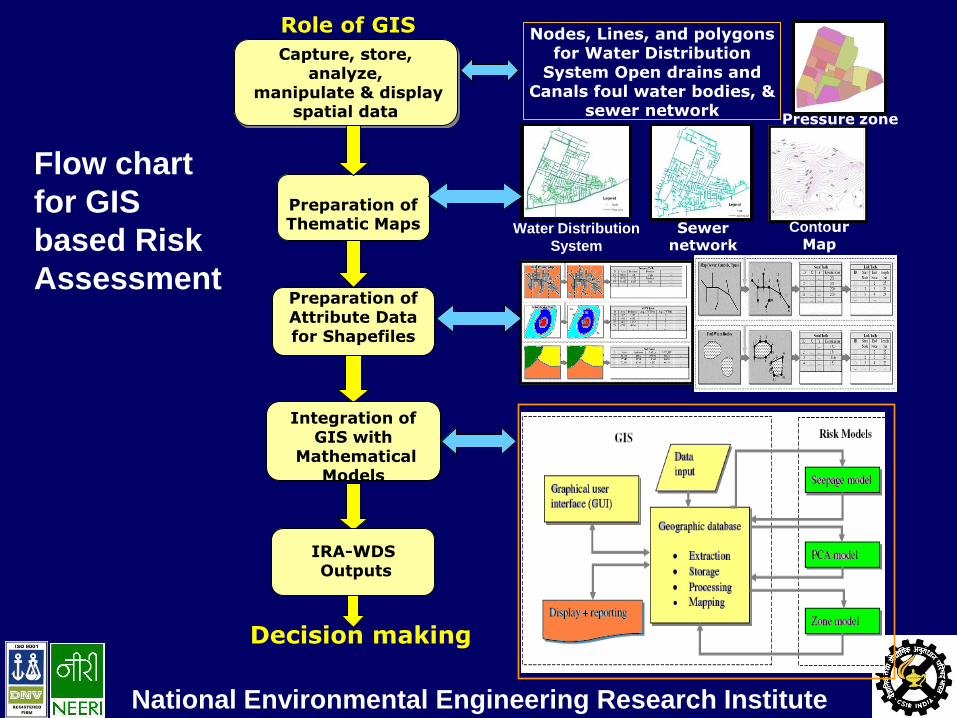
Role of GIS
Decision making
Nodes, Lines, and polygons for Water Distribution
System Open drains and Canals foul water bodies, &
sewer network
Water Distribution
System
Sewer network
Capture, store, analyze,
manipulate & display spatial data
Preparation of Thematic Maps
Preparation of Attribute Data for Shapefiles
Integration of
GIS with Mathematical
Models
IRA-WDS Outputs
Contour Map
Pressure zone
Flow chart
for GIS
based Risk
Assessment
National Environmental Engineering Research Institute
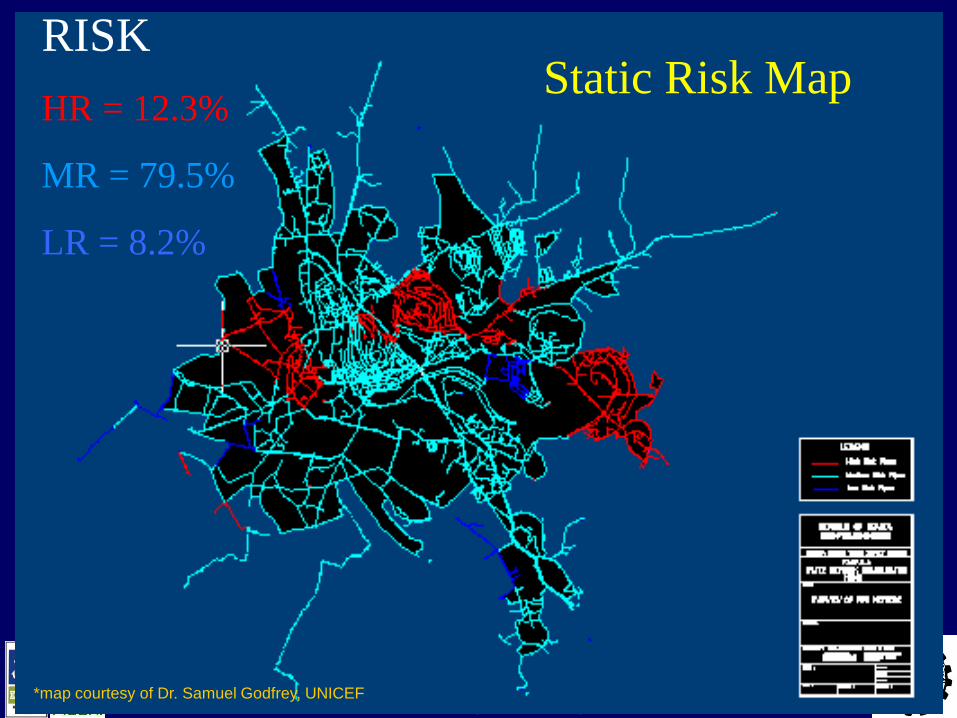
RISK
HR = 12.3%
MR = 79.5%
LR = 8.2%
Static Risk Map
*map courtesy of Dr. Samuel Godfrey, UNICEF
National Environmental Engineering Research Institute
Attractive Features of WSP
• WSP enables systematic & detailed assessment and prioritization of
hazards & operational monitoring of barriers or control measures
• Demonstration of application of best practices to secure water safety to public health bodies and regulators
• Provides for an organized & structured system to minimize chances of
failure through oversight or lapse of management
• Increase the consistency with which safe water is supplied
• Provides contingency plans to respond to system failure or
unforeseeable hazardous event
• Avoid limitations of relying on end point testing as means of water safety controls
• Potential for significant improvement in asset management, marketing of services to new & existing customers of improved product
• Benefits realized from delivering a more consistent water quality and safety through quality assurance systems

National Environmental Engineering Research Institute
Thank you for listening!