Embed Size (px)
Citation preview

Surveillance Knowledge and the Mass Media*
Jason Barabas Robert Wood Johnson Scholar
The Institute for Quantitative Social Science Harvard University
Cambridge, MA 02138 [email protected]
617-496-6075
and
Assistant Professor (on leave) Department of Political Science
Southern Illinois University Carbondale, IL 62901-4501
Jennifer Jerit Visiting Assistant Professor
Department of Political Science M.I.T.
77 Massachusetts Avenue Cambridge, MA 02139 E53-461
617-259-0751
and
Assistant Professor (on leave) Department of Political Science
Southern Illinois University Carbondale, IL 62901-4501
[email protected] * We thank Larry Bartels, Gary King, and Jas Sekhon for helpful comments. Toby Bolsen and Felix Anebo provided valuable research assistance. All correspondence should be directed to the first author.
Abstract
This study estimates the causal effect of news coverage on citizens’ knowledge of recent
political developments. We conduct within subject comparisons of knowledge for news events
receiving high and low levels of media coverage. Across twenty national surveys spanning more
than a decade, we show evidence of learning on a wide variety of topics. As media coverage
increases, citizens know more, although additional coverage has a declining marginal effect.
Similarly, the breadth of news coverage, but not intensity, elevates knowledge. When it comes to
important political developments, citizens monitor media coverage and learn policy relevant
facts. In contrast to studies that concentrate on individual-level determinants of knowledge, our
results offer a more optimistic view of democracy in the United States.

After decades of documenting the shortcomings of the American public, scholars have
begun to rethink the requirements of democratic citizenship. According to this view, people
need not have encyclopedic knowledge in order to perform the basic duties required of them,
such as voting. Low cost shortcuts are plentiful, and by several estimates, quite effective (Lau
and Redlawsk 1997; Lupia 1994; Sniderman Brody and Tetlock 1991). The outlines of this new
standard can be seen in the work of Schudson (1998), who frames citizenship in terms of a
monitorial obligation. In contrast to the individual who follows public affairs in all their details,
the monitorial citizen intermittently surveys political news. Attention peaks at predictable times
(e.g., during elections, wars, or other crises), but even then, monitorial citizens “scan (rather than
read) the information environment” (Schudson 1998, 310). What keeps democracy functioning,
at least in theory, is a mass media that alerts citizens to problems and issues that require their
attention—“Burglar Alarm Journalism” in Zaller’s (2003) words (also see Graber 2004).
However, we are just beginning to understand how well this system works, and in
particular, whether this style of journalism affects citizen learning and interest. This study takes
an important step in that direction (also see Hutchings 2003). We examine how citizens learn
about real world political happenings (e.g., passage of legislation, a popular drug taken off the
market, debate over a presidential initiative). We are aided by a unique collection of survey data,
one in which the same individual is queried about recent political developments receiving
different amounts of media attention. To this we add content analyses of these topics in the
national news. Each respondent serves as his or her own control, which enhances our ability to
make causal inferences about the relationship between media coverage and surveillance
knowledge.

2
We find that citizens become more knowledgeable in the aftermath of burglar alarms, but
that media coverage has a declining marginal effect. We also show that the breadth of coverage
(i.e., the extent to which multiple media outlets are covering a story) has a greater effect on
knowledge than its intensity (i.e., the number of stories per day in any given outlet). Our
findings contribute to the literature in two ways. First, we add to the growing body of research
documenting media effects, but do so in a relatively new area of study (surveillance knowledge).
Second, we show that citizens can and do learn about important political developments. As such,
we offer a more optimistic view of democracy than is provided by studies that focus on the
largely invariant individual-level determinants of knowledge (e.g., Bennett 1988).
Monitorial Citizens, the Mass Media, and Democracy
Information matters, even when most citizens’ attention to politics is intermittent at best.
Regardless of whether we look to collective deliberation and the principle of aggregation (Page
and Shapiro 1992), elite cues (Gilens and Murakawa 2002), or cognitive shortcuts (Sniderman,
Brody, and Tetlock 1991), “someone, somewhere, must be in possession of some supply of
information (Freedman, Franz, and Goldstein 2004, 724). The style of journalism described by
Zaller (2003) subsidizes the costs of information gathering by calling attention to news events
with dramatic and entertaining coverage. Though some scholars dismiss the quality of Burglar
Alarm Journalism (e.g., Bennett 2003; Patterson 2003), it provides the motivation to attend that
often is lacking in the day to day coverage of American politics.
In a similar vein, Schudson (1998) claims that all citizens really need is a headline
service. They can receive information about a variety of topics and can be mobilized toward a
wide variety of ends. As he describes it:

3
[Citizens] may learn that a product they own has been recalled; that a drought will make produce more expensive in a few weeks...that right-wing militia are far more numerous and serious than they had thought…that President Clinton is defending affirmative action policies (1998, 310).
According to Schudson, people become informed about important changes in the political world
through increases in the amount of media attention to a subject. They may then start reading
more about a subject, talk about it with friends, or even take political action. But—and this point
is key—nothing in Schudson’s view presumes a proactive or hyper-attentive public. Monitorial
citizens, as he describes them, engage in environmental surveillance, not thorough information
gathering (Schudson 1998, 311). Accordingly, we use the term surveillance knowledge to refer
to the information citizens glean from media coverage of recent political developments.1
Though this kind of information is arguably more relevant to citizen’s lives than basic
facts, such as the percent required in Congress to override a presidential veto, we know little
about how citizens acquire it. One possibility is that increasing the availability of information
(e.g., increasing the amount of media attention to a subject) will result in higher levels of
surveillance knowledge (e.g., Delli Carpini, Keeter, and Kennamer 1994; Nicholson 2003).
Implicitly, though, this argument assumes that citizens consume all available information,
whatever the amount. This standard might be appropriate for the “fully informed” citizen of yore
(e.g., Berelson et al. 1954, 308). The view of citizenship outlined here suggests that increases in
media coverage should at some point have decreasing returns.
1 See Delli Carpini and Keeter’s (1991) treatment of “surveillance facts” (1991, 598) or Price
and Zaller’s (1993) discussion of “news events” for related ideas. Some scholars use general
measures of knowledge as a proxy for the domain specific measures used here (Delli Carpini and
Keeter 1996). More recent work suggests the two concepts are different (Gilens 2001).

4
When confronted with an increase in news stories about a recent development (say, a bill
to make prescription drugs more affordable), the monitorial citizen will take notice. Keeping
with Schudson’s argument, this individual will seek to answer a few key questions, such as
“How does this change affect me?” and “Do I need to learn more about this development?”
Beyond this basic surveillance, however, it is unlikely that the monitorial citizen will avail him
or herself of all the relevant information in the media. More formally, we hypothesize that
citizens will become more knowledgeable about specific political developments in the aftermath
of burglar alarms, but that after a certain point, additional media coverage will have a decreasing
effect (Hypothesis 1).
We also have expectations about how other aspects of media coverage affect citizen
learning. If citizenship is a monitorial obligation, the extent to which different media outlets are
covering a news story should be more important than the number of news stories in any given
outlet. More precisely, we hypothesize that the Breadth of media coverage will have a greater
impact on learning than the Intensity of that coverage (Hypothesis 2). Breadth matters because it
increases the opportunities for surveillance (e.g., the person who does not read a story in the
newspaper is likely to encounter the subject on television). The intensity of coverage is less
important because ordinary citizens are not likely to be interested in multiple stories on the same
subject, regardless of the outlet (Graber 2004, 550-51; also see Graber 2001).2
2 Political junkies and sophisticates, on the other hand, may appreciate overlapping treatments of
the same subject. They might read a factual story about a political development (e.g., an article
about the status of patients’ rights legislation in Congress) as well as a news analysis piece (e.g.,
a story discussing the political implications of passing patients’ rights legislation).

5
Research Design, Data, and Methods
Past attempts at estimating the influence of media coverage on knowledge suffer from an
important limitation. What passes for media influence might simply reflect the impact of
individual-level characteristics that happen to be correlated with exposure to the news. That is,
only certain individuals (e.g., those with high incomes, Caucasians, males) might pay attention to
politics in the first place. Thus it is not clear if watching the news increases knowledge or if
knowledgeable people watch the news.
Our goal is to estimate the causal effect of media coverage on surveillance knowledge.
To do so, we invoke the idea of counterfactual reasoning captured by Rubin’s Causal Model
where causal effects are defined in terms of potential outcomes (Rubin 1974; also see Angrist,
Imbens, and Rubin 1996). Let Yi1 denote the level of knowledge when individual i is exposed to
media coverage (i.e., the “treatment” regime), and Yi0 represents the level of knowledge when
that same individual is not exposed to media coverage (the “control” regime). The casual effect
of media coverage is the difference in these two potential outcomes (i.e., Yi1 - Yi0). Typically,
however, only Yi0 or Yi1 can be observed for any given person because as Dehejia and Wahba
(1999) write, “…one cannot observe the same unit under both treatment and control” (p. 1057;
also see Little and Rubin 2004, 123).
One remedy, assuming only nonexperimental observational data exist, is to compare
groups of subjects who received treatment to those who did not (Rosenbaum 2002). This process
is aided by statistical matching procedures that create comparison groups of subjects who are
alike in all observable ways except that one group received treatment while the other did not
(Rosenbaum and Rubin 1983). The key assumption, however, is that the groups are balanced on
all observed characteristics.

6
Surveillance Knowledge Counterfactuals
We capitalize on the logic of causal inference in a way that does not require the key
matching assumption of equivalence conditional on observables. Using the iPoll database at the
Roper Center for Public Opinion Research, we identified twenty surveys that asked respondents
multiple questions about a single news event (e.g., legislation pending in Congress, the tobacco
settlement, a government report on Social Security). Thus, we have multiple observations for the
same respondent in a single survey. Importantly, there also is variation in the amount of media
coverage devoted to different aspects of the same news event. The treatment effect of media
coverage is the difference between knowledge of a topic with coverage (Yi1) and knowledge of a
topic without coverage (Yi0). In this design, individuals serve as control cases for themselves.
No assumptions about balancing need to be made since everything about the person, whether
observed or not, is held constant.3
These surveys, all administered by Princeton Survey Research Associates (PSRA), are
useful from the standpoint of causal inference. But they also contain a treasure trove of
questions that strike directly at the heart of the monitorial behavior we described earlier. Instead
of asking the typical battery of general knowledge questions (e.g., which branch of government
3 In slightly different notation, the quantity of interest is )0()1( =ΧΥ−=ΧΥ= ijijijijθ where ijΥ
represents individual i’s answer to a question about topic j ( ijΧ = 1 if topic j receives coverage, 0
otherwise). We estimate and assume equivalence across j topics
or that . In most cross-sectional studies, analysts compare
individuals by assuming
)0()1(ˆ =ΧΥ−=ΧΥ= ′′ jijiijijθ
)0()0( =ΧΥ==ΧΥ ′′ jijiijij
).0()0( =ΧΥ==ΧΥ ′′ jijiijij

7
declares laws unconstitutional), the surveys query people about recent political developments.
The subjects of these questions cover a variety of domestic issues; the crucial similarity is that
they refer to specific events that took place during six week period prior to each survey. Thus,
knowing the correct answer to these items depends almost exclusively on recent exposure to
information in the media rather than learning from years ago (see Appendix for list of issues).
To make the idea of surveillance knowledge more concrete, consider the following
example. In 1998, PSRA asked four questions about the recommendations made by a national
commission on Social Security. It read: “…Tell me if you think the commission on Social
Security…has recommended that this be done or has NOT made this recommendation.” The
first question asked if the commission “recommended increasing Social Security payroll taxes on
the wages of employed people under 65.” The second asked whether it “recommended raising
the retirement age at which someone becomes eligible for Social Security benefits.” For the
third question, respondents were asked if the commission “recommended investing some Social
Security funds in the stock market.” The fourth question asked if the commission
“recommended shifting some money from the Social Security trust fund into individual
retirement accounts.” The correct answers are no, yes, no, and yes. Prior to the commission’s
report, it would have been difficult if not impossible for someone to correctly answer these
questions. Regardless of the individual-level differences that explain variation in knowledge in
the cross-section (interest, income, etc.), for any given individual, variations in knowledge about
each of these recommendations can be attributed to varying levels of media attention.
News Media Coverage
We combine the surveillance batteries with content analysis of these same subjects in
national news stories. More specifically, we conducted a content analysis of the full text
8
transcripts of three national media outlets during the six weeks prior to the first day of each
survey.4 Our three sources, the Associated Press, USA Today, and CBS Evening News, reflect
major newswire, print and broadcast media outlets. We do not claim that the citizens in our
surveys were getting their news from these particular media outlets; we simply assert that these
sources provide a representative view of the information that might have been appearing in
newspapers and on television around the country.5
Once we identified the relevant sample of media reports in each media outlet, we tallied
the total number of stories mentioning the correct answer during the content analysis period.6 A
simple story count captured the essence of what we sought to measure—namely, the amount of
media coverage devoted to a particular surveillance issue. For each news event in our dataset,
we also know when (in terms of the actual calendar dates) the media covered the issue. We
4 The choice of a six week period was deliberate. The sponsors of the surveys designed
knowledge questions in response to political developments that had been in the news during this
period of time. Media reports for all three sources were obtained from Lexis-Nexis.
5 The Associated Press serves 1,700 newspapers and 5,000 radio and television stations by
providing ready-to-print news stories. The daily audience for USA Today is 5.2 million people,
earning it the nickname “the nation's most read daily newspaper.” Among major national
newspapers, the market share of USA Today is 44% (www.usatoday.com). Finally, we selected
CBS Evening News randomly from among the three major television news networks.
6 A story was considered relevant if it discussed the issue underlying the knowledge question.
Intercoder reliability analyses indicate high levels of agreement for identifying relevant articles
(kappa = .71) and identifying articles containing the correct answer (kappa = .84). According to
Cicchetti and Sparrow (1981), a value of kappa above .6 is good; .75 or higher is excellent.
9
calculated the number of days that each issue received coverage from any one of our three
sources and then operationalized intensity as the number of stories on a subject divided by the
number of days an issue received coverage. In our data, the average value of intensity is .59,
which corresponds to a little more than half a news story per day. Our measure of breadth is
coded 1 if both print and television news covered a particular topic during the six week period
and zero otherwise (see Appendix for additional descriptive information).7
This research design is sometimes called a “one group posttest-only design using multiple
substantive posttests” (Shadish, Cook, and Campbell 2002, 107), or pattern matching (Campbell
1966).8 Though we believe the design is a significant advance over past attempts to measure the
influence of the mass media, our approach is not free of assumptions. The most important one
concerns media coverage itself, which is not randomly assigned and could be a function of
knowledge patterns or issue salience. Later in the paper we consider the nature of media
coverage assignment and find little cause for concern.
Empirical Results
We begin by documenting examples of treatments effects within four surveys on different
issues. Panel A of Figure 1 shows surveillance knowledge patterns for health care proposals
offered by President Bill Clinton in 1997. The first proposal—expanding long-term care—did
7 Issues covered by print and television news did not, on average, receive more intense coverage
than those covered by a single outlet (t = -1.12; p = .26).
8 Our design resembles Sigelman’s (1980) technique for estimating presidential influence. He
asks respondents who do not already favor a policy whether they would if President Carter
considered the action necessary.

10
not receive any coverage in the sources we examined. Knowledge for this item was quite low.
Only 14% of the 316 respondents in the sample gave the correct answer (with a 95% confidence
interval of 10% to 18%). A second question in the same survey asked whether Clinton proposed
expanding coverage for people with low income. Again there was no coverage and again very
few respondents (only 20%) provided the correct answer. Indeed, the confidence interval [15 to
25] indicates that responses to this question are not statistically different from those on the long-
term care question. These same respondents also were asked about two health care proposals
that received more media attention. For the third item (9 news stories), the percent who knew
that Clinton proposed expanding coverage for the working poor grew to 71% [65 to 76]. The
most heavily covered part of Clinton’s health care proposals concerned expanding coverage for
children (18 news stories). Nearly 80% [75 to 85] of the respondents knew that Clinton wanted
to expand coverage for children.9
Figure 1 about here.
Since the same respondents were asked all four questions in the same survey, it is
possible to subtract each person’s response on one of the options that received coverage (the
“treatment” condition) from that same person’s response without any coverage (the “control”
condition). For Panel A of Figure 1, we can compute four treatment effects comparing the
9 Not all 1,003 respondents in this survey received these questions which explains the low
sample size and large confidence intervals. Other items we consider were asked of all
respondents. The items within any given question battery were read to respondents a random
fashion so response order effects are not a concern. Knowledge is coded as a dichotomous
measure coded “1” if the respondent answered the question correctly and “0” otherwise.
Following Luskin and Bullock (2004), we combine incorrect and “don’t know” responses.

11
counterfactuals of some coverage (9 or 18 stories) to either of the items that received no
coverage. For example, comparing the first and fourth items, the treatment effect is 66
percentage points (.80 – .14 = .66, s.e.=.03). This is the largest effect we observe in our data.10
The other effects are sizeable but smaller at 57% (item 3 versus item 1), 59% (item 4 minus item
2), and 50% (item 3 versus 2).
To help readers gain a feel for the counterfactual comparisons we are making, we present
three other sets of questions that appeared in separate cross-sectional surveys. As with Panel A,
knowledge varies positively with the number of news stories devoted to each aspect of the issues.
In Panels B through D, levels of knowledge for the baseline items are low and statistically
indistinguishable within each survey. The treatment items are higher and correspond in rough
fashion to the size of the increase in the number of stories for presidential proposals on the
subject of gun control (Panel B), a government report on medical errors (Panel C), and
recommendations from a national commission on Social Security (Panel D).
With the notable exception of Panel D, all the effects increase in magnitude along with
media coverage. The two treated items in Panel D receive just a few stories (3 and 4 each). In
both cases knowledge levels are greater than the two items that did not receive any coverage, but
there is an unexpectedly large increase in knowledge on the eligibility age item relative to the
positive treatment effect for the private investment accounts proposal. The aberration may be due
10 Nearly 70% of our sample (218 of 316) went from providing an incorrect response on item 1
to a correct response on item 4. Only a tiny fraction, 4% (n=13), moved in the opposite direction.
The overall effect is 66% because the remainder provided incorrect responses on both items
(16%, n=55) or gave correct responses on both items (10%, n=30).

12
to the way we aggregated stories across the three media outlets. Such anomalies prove
inconsequential later when we examine the effects separated by source.
Before doing that, however, two patterns from Figure 1 are worth noting. First, and
consistent with Hypothesis 1, the relationship between knowledge and media coverage appears
to be positive and non-linear. That is, knowledge gains are largest as we go from no media
coverage to some media coverage (approximately 3 to 9 stories). Once an issue has received
some coverage, additional media attention (20 stories and beyond) does little to increase
surveillance knowledge. Though we provide a more systematic test of Hypothesis 1 below, the
evidence so far suggests that citizens would gain little from extended news coverage of political
developments. The second notable pattern concerns the considerable variation in the baseline
level of knowledge (i.e., knowledge in the absence of media coverage). In Figure 1, this baseline
varies from 13 to 40 percent, a difference we attribute to variation across the issues in our
dataset. We deal more systematically with these differences below.
In a moment we will conduct a regression analysis of the treatment effects. First,
however, we provide a bird’s eye view of the range of these effects. In our dataset, there are 62
comparisons of no coverage versus some coverage. As shown in Figure 2, in 57 out of 62 cases
(92%) the treatment effect is positive; in nearly all of those cases that effect is statistically
distinguishable from zero. A notable feature of Figure 2 is the range of treatment effects.
Positive treatment effects range from a gain of 1 percentage point (coverage of the human
papilloma virus) to 66 (presidential health care proposals).
Figure 2 about here.

13
We also identified another 40 cases where it is possible to conduct ordinal comparisons
(some coverage versus more coverage).11 The statistics for treatment effects are similar. Thirty
four of the 40 are positive (85%) and 29 of 40 (73%) are statistically significant. All together, 89
of 102 (87%) counterfactual comparisons are positive (i.e., treatment > 0) and in 80 (78%) the
confidence intervals of those treatment effects do not overlap zero. The average size of the
treatment effect is 15.4 percentage points (standard deviation = 17.1).
Having shown that substantial treatment effects exist, we next sought to account for the
varying size of those effects. We expected the total number of stories in the media to be
positively associated with surveillance knowledge, but that after a certain point increasing media
attention would have a declining marginal effect. Table 1 shows the results of an analysis in
which we regress treatment effect on the total number of stories across all sources as well as
source specific measures of volume (all of which are logged). We capture differences across the
various issues in our dataset (e.g., issue difficulty) with fixed effects terms that have been
suppressed for presentation purposes. Table 1 reports the results.
Table 1 about here.
The first series of models (Models 1-4) examines just those issues in which the comparison is
between topics that received no coverage versus some coverage. The second series of models
(Models 5-8) examine all of our cases (i.e., they include the zero vs. some coverage comparisons
as well as all other ordinal comparisons).
11 An example of an ordinal comparison can be seen in Panel A of Figure 1. The working
uninsured question (9 stories) is the control case and the child health care coverage question (18
stories) is the treatment case. The effect is 9% (80 – 71), with a confidence interval from 2 to 16.

14
Focusing first on Model 1, the coefficient on our combined volume measure is positive
and significant, indicating that media coverage has the non-linear effect that we expected.12
Moving across the columns, we see that the same pattern appears when we include separate
measures for newswire, television and print news (Models 2-4). The positive and significant
finding for logged volume also extends to all ordinal comparisons (Model 5). In this second set
of models, medium-specific differences once again appear to be inconsequential. Regardless of
whether we examine the volume of coverage in newswire, print or television sources, our
measure of logged volume is positively and significantly related to the dependent variable
(Models 6-8). Consistent with our first hypothesis, then, we find that citizens have higher levels
of surveillance knowledge in the aftermath of heightened media coverage. The added benefit of
increased media coverage levels off, a point we can better illustrate through predicted values.
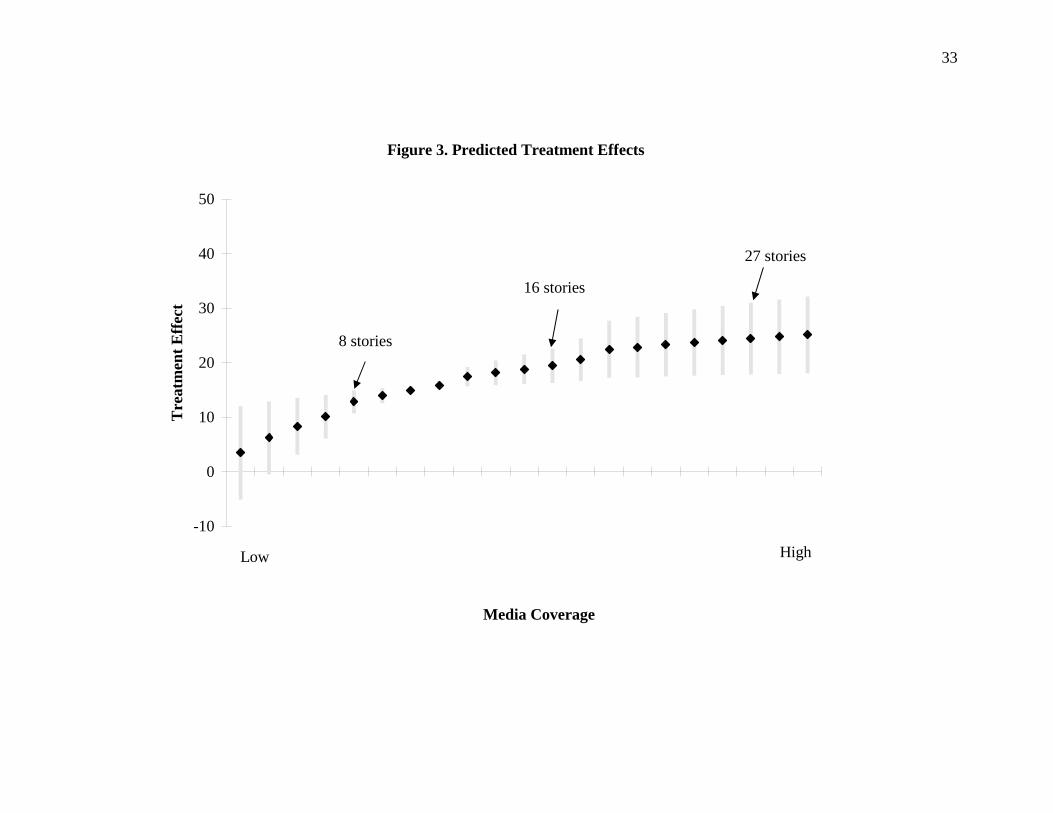
Figure 3 about here.
Figure 3 plots the predicted treatments effects for varying levels of media coverage.13
The curve is steepest at the beginning, as media coverage increases from zero stories to 8 news
stories. 14 An increase in media coverage of this magnitude is associated with a 13 point
treatment effect. As one can tell from the shape of the curve in Figure 3, doubling coverage does
12 Our measure of volume weights news stories from each source equally. This may strike some
as problematic, but as we show below, our results change little when we include each source in
the model separately. In the absence of any obvious way to weight the three media sources, we
simply aggregated them for the combined volume measure.
13 Predicted values were computed using the coefficients from Model 12 in Table 2.
14 Over a six week period, this translates into a little more than one news story per week. Of
course, some news events occur over a shorter period of time.

15
not translate into a treatment effect that is twice as large. Increasing coverage from 8 to 16
stories is accompanied by only a 7 point treatment effect. By the time there are 27 stories and
beyond, there are few noticeable gains in knowledge.
What about the influence of other features of news coverage? According to our second
hypothesis, breadth of media coverage should have a greater impact on citizen learning than its
intensity. Breadth speaks to the number of distinct outlets that are covering a news story and it
bears directly on the opportunity for learning. Intensity, by contrast, indicates how many stories
appeared in the media each day while the issue was in the news (e.g., less than one story per day,
one story per day, or multiple stories per day). To the extent that monitorial citizens merely scan
the information environment, they are not likely to take advantage of intense coverage.
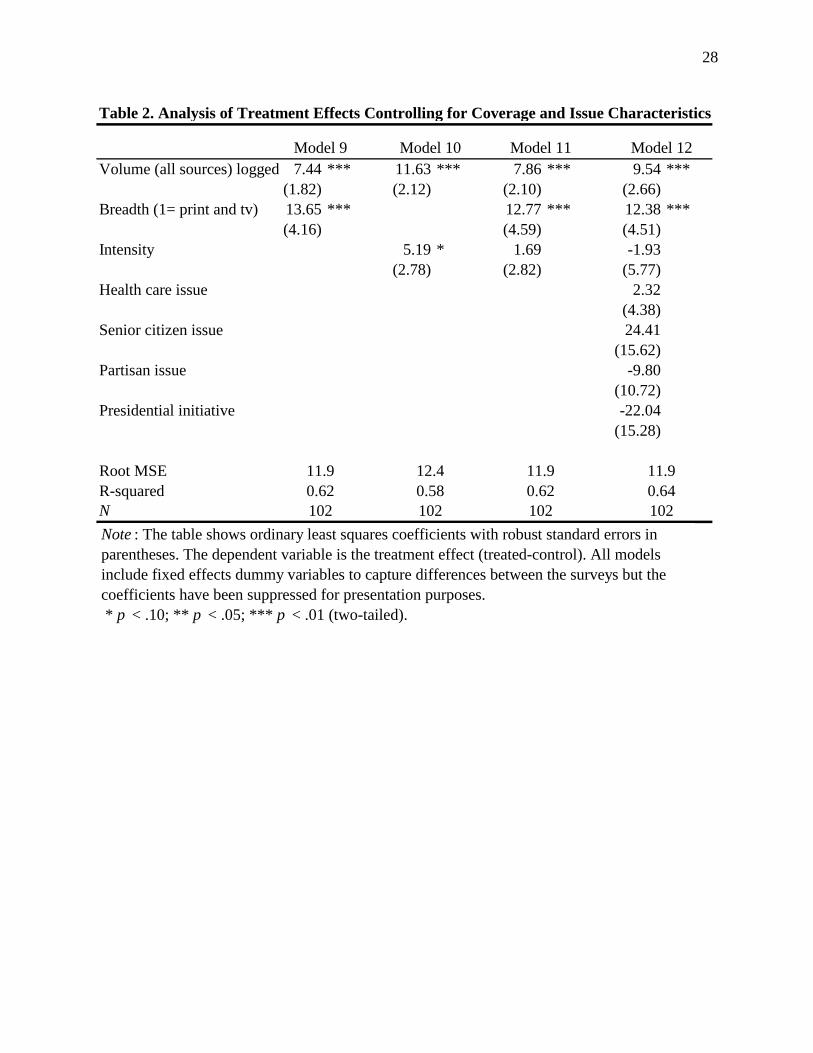
Table 2 presents the results of an analysis in which we regressed the treatment effect on
our combined measure of news stories plus our indicators of breadth and intensity.15 Breadth of
coverage clearly matters. There is a nearly 14 point increase in the treatment effect when a news
event is covered by both television and print news (p < .001; Model 9). In comparison to the
strong effect for breadth, intensity is only marginally related to the dependent variable (p < .10;
Model 10). And, as Model 11 shows, intensity has no impact once we take the breadth of
coverage into account. By contrast, even when we control for the total number of news stories
and the intensity of news coverage, reporting by different media outlets contributes to
surveillance knowledge.16
15 Again, we include fixed effects terms (coefficients not shown). Tables 1 and 2 report robust
standard errors; our results hold when we use STATA’s command for clustered standard errors.
16 We obtain a similar result when we include a measure of breadth that indicates how many
different news outlets (zero, 1, 2 or 3) covered an issue.
16
Table 2 about here.
Finally, in an effort to speak more directly to the differences between the news events in our
dataset, we included several issue-specific indicators in Model 12. These dummy variables take
on a value of 1 if the issue was characterized as a health care topic, an issue that affected senior
citizens, a partisan issue, or a presidential initiative. None of these indicators were significantly
related to surveillance knowledge. Note, however, that even when we control for differences in
issue type and the intensity of coverage, our combined measure of volume and our indicator for
breadth still have an effect on treatment size.
Of course, it is reasonable to wonder whether the treatment we are studying—varying
levels of media coverage—is exogenous. Some aspects of a political issue might be inherently
more newsworthy or dramatic, and this might lead to patterns in which news events get covered.
We examined this possibility with an auxiliary set of analyses in which we predict media
attention to the issues in our dataset. At least in the set of issues we have examined here, the
treatment is exogenous (see Appendix for details).
Discussion
According to our analyses, media coverage increases knowledge, although most of the
benefits occur with a relatively small number of news stories. Similarly, the breadth of coverage
is more important than its intensity. These findings underscore the importance of the mass
media’s surveillance function (Graber 2004). Citizens need not know everything about the
political world, but they can and do learn about important developments.
Historically, media effects have been hard to find (Klapper 1960; Patterson and McClure
1976; but see Bartels 1993; Neuman, Just, and Crigler 1992; Zaller 1996). Part of the challenge
stems from the methods and data being used. Simple correlations between survey measures of

17
media use and knowledge do not address causality. Even after controlling for a variety of
exogenous factors such as age or race, a high degree of correspondence between self-reported
media use and knowledge levels begs the question of what comes first. Do knowledgeable
people watch the news or does watching the news increase knowledge?17
Experiments can isolate the causal effect of information in laboratory settings (e.g.,
Iyengar and Kinder 1987; Iyengar 1991) or in surveys that provide information (Kuklinski et al.
2000; Gilens 2001). However, experiments suffer from important limitations concerning
external validity. It is nearly impossible to replicate the conditions under which someone
encounters news from the mass media. News coverage treatments in experiments run the risk of
being too strong or unrealistic (but see de Vreese 2004; see Cook and Campbell 1979, 71 for
general discussion of the external validity of treatments).
Confronting these realities, social scientists often turn to natural or quasi-experimental
designs in which some people are exposed to treatments and others are unexposed (e.g.,
Patterson and McClure 1976; Dalton, Beck, and Huckfeldt 1998). But between subjects designs
are not foolproof. Observing high and low media exposure groups over time can lead
questionable inferences since one cannot be certain, even with sophisticated statistical
techniques, whether the two groups are comparable. In other words, those who are exposed to
nonrandomly assigned news media treatments may differ in important ways from those who are
not exposed. What appears as a media effect or a non-effect might simply be due to differences
in the underlying treatment and comparison groups.
17 See King et al. (2004) for other problems with interpersonal comparisons that apply to self-
reported media measures.
18
What accounts for powerful media effects uncovered here? Two factors seem
particularly important. First, the use of within subject controls provides the type of analytical
leverage that is lacking in most studies. The fact that we have multiple observations for the same
respondent means that we can observe the counterfactual. To use an example from our study, we
can estimate a person’s level of knowledge about Social Security proposals when there are few
or no news stories about the subject as well as that same person’s level of knowledge about
Social Security proposals when there are many news stories. Causal inference is possible
because media coverage is the only factor that is changing.18
Second, we have a better measure of the treatment (media coverage). Unlike
experimental designs that have to simulate the provision of information (e.g., asking subjects to
read a news story in a lab), our treatments are completely realistic. We are studying actual
political developments that unfolded in the United States. Everything about the number and type
of stories mirrors reality as do the conditions under which respondents were exposed to the
treatments (see Druckman n.d. for a similar approach).
These advances do not mean our study is without limitations. Aside from concerns about
the exogeneity of media coverage that we address in the appendix, we assume (1) that our media
sources are representative of the information environment, (2) that we accurately characterize the
amount of coverage for each issue our dataset, (3) that the questions in any given survey are
equivalent indicators of surveillance knowledge, and (4) that the topics selected by the survey
organization are representative (i.e., not biased in a way that might impeach our results). Finally,
and on a somewhat different note, we say little about the meaning citizens attribute to real world 18 When the media cover an issue, a person might learn about the subject indirectly through
conversation. Within subject comparisons control for the strength or absence of social ties.
19
political happenings (Neuman, Just, and Crigler 1992) or how a person’s prior opinions affect
information search (Taber, Lodge, and Glathar 2001). However, it is our belief that these
inquiries can be furthered by a better understanding of what citizens learn from the mass media.
Conclusion
Citizens do not possess anything close to encyclopedic knowledge about the American
political system. The evidence on this point is ample. However, there are several reasons why
this core finding may not be as troubling as it once seemed to political scientists. For starters, the
traditional approach to measuring knowledge, which gives people little time to generate a
thoughtful response and even less motivation to do so, might understate actual levels of
knowledge (Prior and Lupia 2005). Second, Sekhon (2004) contends that information effects
vanish as elections approach—a result he attributes to the political and electoral institutions in an
advanced democracy such as the United States. Finally, a third stream of research argues that
when scholars settle on a more reasonable standard—citizenship as a monitorial obligation—the
American public does not perform so poorly (e.g., Graber 2004, 562).
This study finds evidence for the third proposition. We show that citizens are most
knowledgeable about events and issues that are being covered by multiple media outlets.
Furthermore, citizens show knowledge gains after only a modest amount of media attention. To
observe such gains in the context of the “typical” survey environment (i.e., one that provides
little time or motivation) speaks to the potential power of the information environment. We
therefore view our results as providing a more optimistic assessment of citizens and a more
realistic standard of citizenship in the United States.

20
References Angrist, Joshua D., Guido W. Imbens, and Donald B. Rubin. 1996. “Identification of Causal
Effects Using Instrumental Variables.” Journal of the American Statistical Association 91: 444-72.
Bartels, Larry M. 1993. "Messages Received: The Political Impact of Media Exposure."
American Political Science Review 87 (June): 267-85. Bennett, W. Lance. 2003. “The Burglar Alarm That Just Keeps Ringing: A Response to Zaller.”
Political Communication 20 (April-June): 131-138. Bennett, W. Lance. 2004. News: The Politics of Illusion 6th ed. New York: Longman. Bennett, Stephen E. 1988. “‘Know-Nothings’ Revisited: The Meaning of Political Ignorance
Today.” Social Science Quarterly 69 (June): 476-90. Berelson, Bernard R., Paul F. Lazarsfeld, and William N. McPhee. 1954. Voting: A Study of
Opinion Formation in a Presidential Campaign. Chicago: University of Chicago Press. Brodie, Molly Ann., Elizabeth C. Hamel, Drew E. Altman, Robert J. Blendon, and Jon M.
Benson. 2003. “Health News and the American Public, 1996-2002.” Journal of Health Politics, Policy, and Law 28 (5): 927-950.
Campbell, Donald T. 1966. “Pattern Matching as an Essential in Distal Knowing.” In K. R.
Hammond (Ed.), The Psychology of Egon Brunswik. New York: Rinehart and Winston. Cicchetti, D.C., and S.A. Sparrow. 1981. “Developing Criteria for Establishing Interrater
Reliability of Specific Items: Applications to Assessment of Adaptive Behavior.” American Journal of Mental Deficiency 86: 127-137.
Cook, Thomas D., and Donald T. Campbell. 1979. Quasi-experimentation: Design and Analysis
Issues for Field Settings. Boston: Houghton Mifflin. de Vreese, Claes H. 2004. “The Effects of Frames in Political Television News on Audience
Perceptions of Routine Political News.” Journalism and Mass Communication Quarterly 81: 36-52.
Dalton, Russell, Paul A. Beck, and Robert Huckfeldt. 1998. “Partisan Cues and the Media:
Information Flows in the 1992 Presidential Election. American Political Science Review 92 (March): 111-26.
Dehejia, Rajeev H., and Sadek Wahba. 1999. “Causal Effects in Nonexperimental Studies:
Reevaluating the Evaluation of Training Programs.” Journal of the American Statistical Association 94 (December): 1053-62.

21
Delli Carpini, Michael X., and Scott Keeter. 1991. “Stability and Change in the U.S. Public’s Knowledge of Politics.” Public Opinion Quarterly 55 (Winter): 583-612.
Delli Carpini, Michael X., and Scott Keeter. 1996. What Americans Know about Politics and
Why it Matters. New Haven, CT: Yale University Press. Delli Carpini, Michael X., Scott Keeter, and J. David Kennamer. 1994. “Effects of the News
Media Environment on Citizen Knowledge of State Politics and Government.” Journalism Quarterly 71: 443-56.
Druckman, James. N.d. “Media Matter: How Newspapers and Television News Cover
Campaigns and Influence Voters.” Political Communication. Forthcoming. Freedman, Paul, Michael Franz, and Kenneth Goldstein. 2004. “Campaign Advertising and
Democratic Citizenship.” American Journal of Political Science 48 (October): 723-741. Gilens, Martin 2001. “Political Ignorance and Collective Policy Preferences.” American Political
Science Review 95: 379-96. Gilens, Martin, and Niaomi Murakawa. 2002. “Elite Cues and Political Decision-Making.” In
Research in Micropolitics: Political Decision-Making, Deliberation, and Participation (Vol. 6), eds. Michael X. Delli Carpini, Leonie Huddy, Robert Y. Shapiro. New York: JAI Press.
Graber, Doris A. 2004. “Mediated Politics and Citizenship in the Twenty-First Century.” Annual
Review of Psychology 55 (January): 545-71. Graber, Doris A. 2001. Processing Politics: Learning from Television in the Internet Age.
Chicago: University of Chicago Press. Hutchings, Vincent L. 2003. Public Opinion and Democratic Accountability: How Citizens
Learn about Politics. Princeton: Princeton University Press. Iyengar, Shanto. 1991. Is Anyone Responsible? Chicago: University of Chicago Press. Iyengar, Shanto, and Donald Kinder. 1987. News that Matters. Chicago: Chicago University
Press. King, Gary, Christopher J. Murray, Joshua A. Salomon, and Ajay Tandon. 2004. “Enhancing the
Validity and Cross-Cultural Comparability of Measurement in Survey Research.” American Political Science Review 98 (February): 191-207.
Klapper, Joseph T. 1960. The Effects of Mass Communication. New York: The Free Press.
22
Kuklinski, James H., Paul J. Quirk, Jennifer Jerit, David Schwieder, and Robert F. Rich. 2000. “Misinformation and the Currency of Democratic Citizenship.” Journal of Politics 62 (August): 790-816.
Lau, Richard R., and David P. Redlawsk. 1997. “Voting Correctly.” American Political Science
Review 91 (September): 585-598. Little, Roderick J., and Donald B. Rubin. 2004. “Casual Effects in Clinical and Epidemiological
Studies via Potential Outcomes: Concepts and Approaches.” Annual Review of Public Health 21: 121-45.
Luskin, Robert C., and John Bullock. 2004. “Re(:) Measuring Political Sophistication.” Paper
presented at the annual meeting of the Midwest Political Science Association, Chicago, IL, April 15-18.
Lupia, Arthur. 1994. “Shortcuts Versus Encyclopedias: Information and Voting Behavior in
California Insurance Reform Elections” American Political Science Review 88 (March): 63-76.
Nicholson, Stephen P. 2003. “The Political Environment and Ballot Proposition Awareness.”
American Journal of Political Science 41 (July): 403-10. Neuman, W. Russell, Marion R. Just, Ann N. Crigler. 1992. Common Knowledge: News and the
Construction of Political Meaning. Chicago: University of Chicago Press. Page, Benjamin I., and Robert Y. Shapiro. 1992. The Rational Public: Fifty Years of Trends in
Americans’ Policy Preferences. Chicago: University of Chicago. Patterson, Thomas E. 2003. “The Search for a Standard: Markets and Media.” Political
Communication 20 (April): 145-48. Patterson, Thomas E., and Robert D. McClure. 1976. The Unseeing Eye: The Myth of Television
Power in National Politics. New York: G.P. Putnam’s Sons. Price, Vincent, and John Zaller. 1993. “Who Gets The News? Alternative Measures of News
Reception and Their Implications for Research.” Public Opinion Quarterly 57: 133-64. Prior, Markus, and Arthur Lupia. 2005. “Political Knowledge Under Respondent-Friendly
Conditions (or What Citizens Know Depends on How You Ask Them).” Paper presented at the annual meetings of the Midwest Political Science Association, Chicago, IL, April 7-10.
Rosenbaum, Paul R. 2002. Observational Studies, 2nd ed. New York: Springer-Verlag. Rosenbaum, Paul R., and Donald B. Rubin. 1983. “The Central Role of the Propensity Score in
Observational Studies for Causal Effects.” Biometrika 70 (April): 41-55.
23
Rubin, Donald B. 1974. “Estimating Causal Effects of Treatments in Randomized and Nonrandomized Studies.” Journal of Educational Psychology 66: 688-701.
Schudson, Michael. 1998. The Good Citizen: A History of American Civic Life. New York: Free
Press. Sekhon, Jasjeet S. 2004. “The Varying Role of Voter Information across Democratic Societies.”
Paper presented at the annual meetings of the Midwest Political Science Association, Chicago, IL, April 15-18.
Shadish, William R., Thomas D. Cook, and Donald T. Campbell. 2002. Experimental and
Quasi-experimental Designs for Generalized Causal Inference. Boston: Houghton Mifflin.
Sigelman, Lee. 1980. “Gauging the Public Response to Presidential Leadership.” Presidential
Studies Quarterly 10 (3): 427-33. Sniderman, Paul M., Richard A. Brody, and Philip E. Tetlock. 1991. Reasoning and Choice:
Explorations in Political Psychology. New York: Cambridge. Taber, Charles S., Milton Lodge, and Jill Glathar. 2001. “The Motivated Construction of
Political Judgements.” In Citizens and Politics: Perspectives from Political Psychology, ed. James H. Kuklinski. New York: Cambridge University Press.
Zaller, John. 2003. “A New Standard of News Quality: Burglar Alarms for the Monitorial
Citizen.” Political Communication 20 (April-June): 109-30. Zaller, John. 1996. "The Myth of Massive Media Impact Revived: New Support for a
Discredited Idea." In Political Persuasion and Attitude Change, ed. Diane Mutz, Paul Sniderman, and Richard Brody. Ann Arbor: University of Michigan Press.

24
Appendix
Surveillance Knowledge Data Series
Our zero versus some coverage comparisons (n=62) are drawn from 12 surveys on the
following subjects and dates: health care proposals from Feb. 22-24, 1997 (4 comparisons),
congressional budget agreement from June 18-22, 1997 (8), Medicare reform from August 7-10,
1997 (4), Social Security proposals from June 12-18, 1998 (4), health care and Social Security
proposals from Feb. 19-25, 1999 (6), a government report on medical marijuana from April 10-
22, 1999 (2), Senate gun control proposals from June 11-16, 1999 (6), a government report on
medical errors from December 3-13, 1999 (4), Medicare proposals and human papilloma virus
from Feb. 4-8, 2000 (13), Clinton actions on gun control from March 31-April 3, 2000 (4), FDA
regulation of PPA from Nov. 29-Dec. 3, 2000 (4), and findings regarding cervical cancer from
December 6-10, 2002 (3).
In addition to these 62 comparisons of no coverage versus some coverage, these same 12
surveys yielded another 30 ordinal comparisons of some versus more coverage. The remaining
10 ordinal comparisons we consider in the full dataset (n=102) were drawn from the following 8
surveys: health care proposals from Dec. 2-5, 1993 (1), patient’s rights legislation from Aug. 6-
20, 1998 (1), herbal remedies from Dec. 8-13, 1998 (1), Bush proposals on Social Security from
May 26-June 4, 2000 (2), AIDS epidemic awareness from Aug. 2-6, 2000 (1), diabetes rates
from Sept. 29-Oct. 2, 2000 (1), Bush cabinet appointments from Jan. 25-28, 2001 (1), and AIDS
prevention from July 18-22, 2002 (2).
Information on the surveys, including question wording, is available at the Roper Center.
For more information on survey methodology and response rates, see Brodie, Hamel, Altman,
Blendon, and Benson (2003).
25
Descriptive Statistics for the Media Coverage Variables
Insert Table A1 about here.
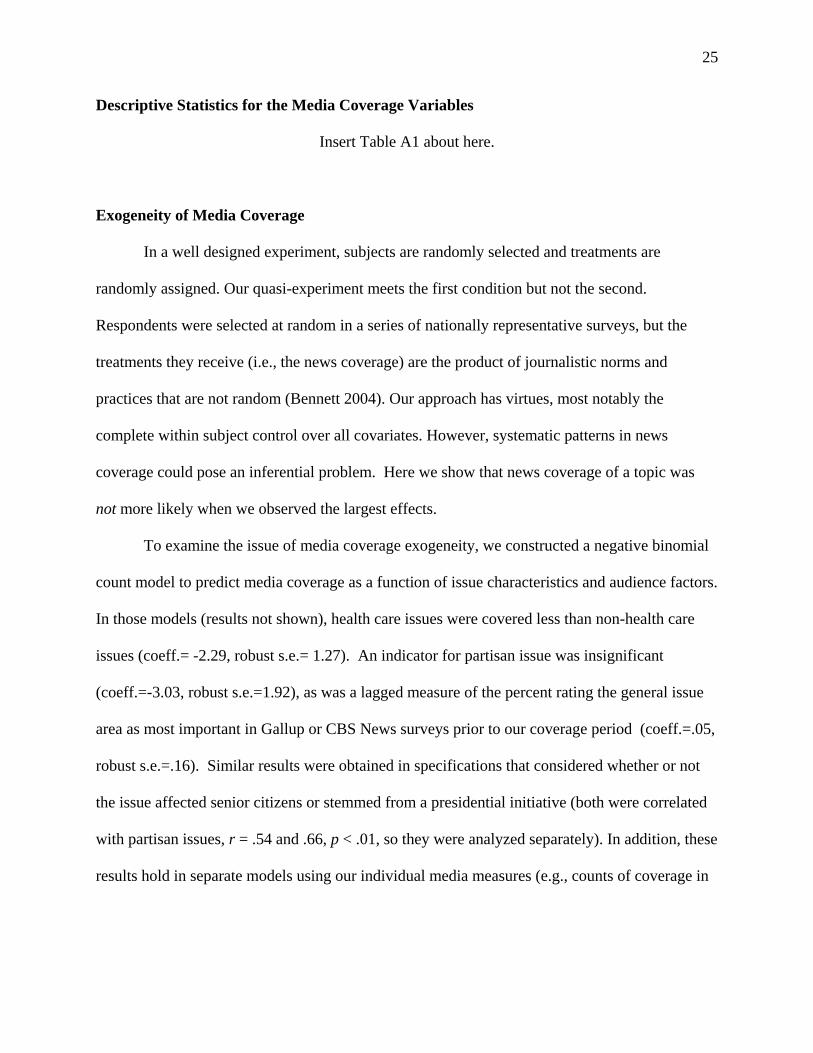
Exogeneity of Media Coverage
In a well designed experiment, subjects are randomly selected and treatments are
randomly assigned. Our quasi-experiment meets the first condition but not the second.
Respondents were selected at random in a series of nationally representative surveys, but the
treatments they receive (i.e., the news coverage) are the product of journalistic norms and
practices that are not random (Bennett 2004). Our approach has virtues, most notably the
complete within subject control over all covariates. However, systematic patterns in news
coverage could pose an inferential problem. Here we show that news coverage of a topic was
not more likely when we observed the largest effects.
To examine the issue of media coverage exogeneity, we constructed a negative binomial
count model to predict media coverage as a function of issue characteristics and audience factors.
In those models (results not shown), health care issues were covered less than non-health care
issues (coeff.= -2.29, robust s.e.= 1.27). An indicator for partisan issue was insignificant
(coeff.=-3.03, robust s.e.=1.92), as was a lagged measure of the percent rating the general issue
area as most important in Gallup or CBS News surveys prior to our coverage period (coeff.=.05,
robust s.e.=.16). Similar results were obtained in specifications that considered whether or not
the issue affected senior citizens or stemmed from a presidential initiative (both were correlated
with partisan issues, r = .54 and .66, p < .01, so they were analyzed separately). In addition, these
results hold in separate models using our individual media measures (e.g., counts of coverage in
26
AP, USA Today, and CBS) as well as in models that include measures of issue difficulty (e.g.,
expert ratings, number of words in the question, nonresponse rates, etc.).
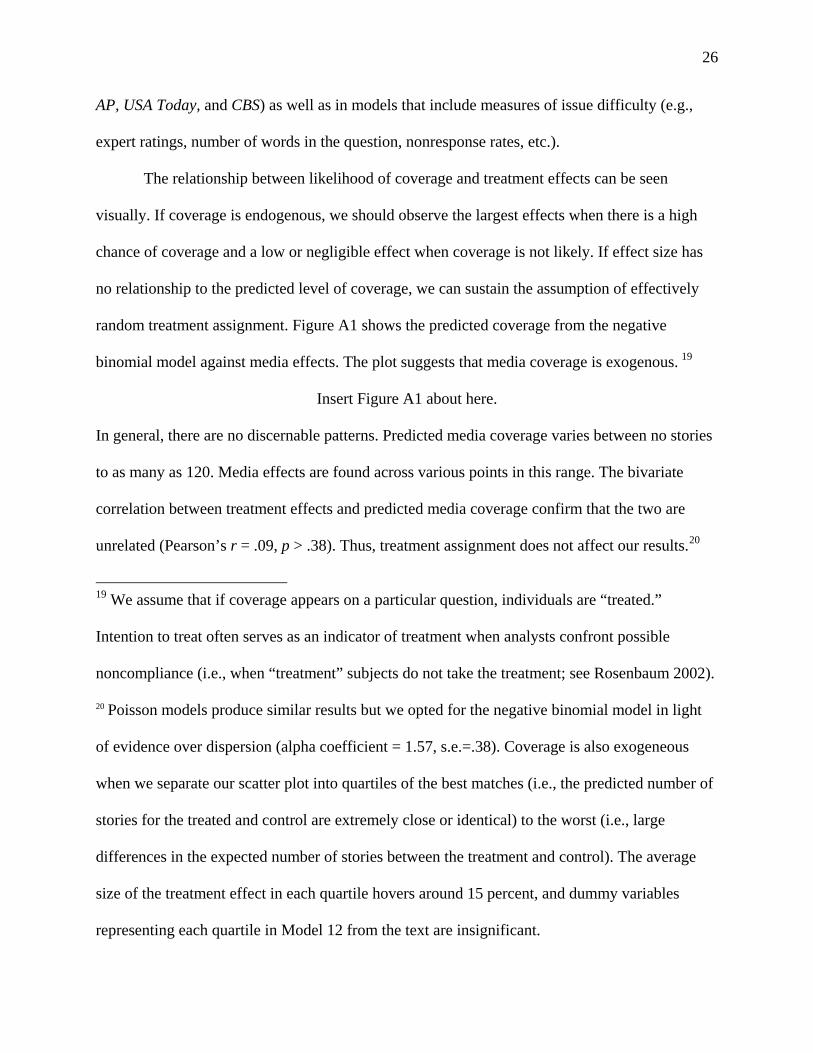
The relationship between likelihood of coverage and treatment effects can be seen
visually. If coverage is endogenous, we should observe the largest effects when there is a high
chance of coverage and a low or negligible effect when coverage is not likely. If effect size has
no relationship to the predicted level of coverage, we can sustain the assumption of effectively
random treatment assignment. Figure A1 shows the predicted coverage from the negative
binomial model against media effects. The plot suggests that media coverage is exogenous. 19
Insert Figure A1 about here.
In general, there are no discernable patterns. Predicted media coverage varies between no stories
to as many as 120. Media effects are found across various points in this range. The bivariate
correlation between treatment effects and predicted media coverage confirm that the two are
unrelated (Pearson’s r = .09, p > .38). Thus, treatment assignment does not affect our results.20
19 We assume that if coverage appears on a particular question, individuals are “treated.”
Intention to treat often serves as an indicator of treatment when analysts confront possible
noncompliance (i.e., when “treatment” subjects do not take the treatment; see Rosenbaum 2002).
20 Poisson models produce similar results but we opted for the negative binomial model in light
of evidence over dispersion (alpha coefficient = 1.57, s.e.=.38). Coverage is also exogeneous
when we separate our scatter plot into quartiles of the best matches (i.e., the predicted number of
stories for the treated and control are extremely close or identical) to the worst (i.e., large
differences in the expected number of stories between the treatment and control). The average
size of the treatment effect in each quartile hovers around 15 percent, and dummy variables
representing each quartile in Model 12 from the text are insignificant.

27
Table 1. Regression Analysis of Treatment Effects
Volume (all sources) logged 14.27 *** 11.03 ***(2.86) (2.00)
Newswire coverage logged 13.52 *** 8.17 ***(4.12) (1.94)
Print coverage logged 9.94 *** 9.72 ***(3.22) (2.38)
Television coverage logged 13.60 *** 13.81 ***(3.15) (2.82)
Root MSER-squaredN
10.60.6862
9.60.7462
10.30.7062
10.80.6762 102
12.50.57102
No Coverage vs. Some Coverage All Ordinal Comparisons
13.20.52
13.90.47
Model 6Model 5 Model 7 Model 8
102
13.30.51102
Model 1 Model 2 Model 3 Model 4
Note : The table shows ordinary least squares coefficients with robust standard errors in parentheses. The dependent variable is the treatment effect (treated-control). All models include fixed effects dummy variables to capture differences between the surveys but the coefficients have been suppressed for presentation purposes. * p < .10; ** p < .05; *** p < .01 (two-tailed).
28
Table 2. Analysis of Treatment Effects Controlling for Coverage and Issue Characteristics
Volume (all sources) logged 7.44 *** 11.63 *** 7.86 *** 9.54 ***(1.82) (2.12) (2.10) (2.66)
Breadth (1= print and tv) 13.65 *** 12.77 *** 12.38 ***(4.16) (4.59) (4.51)
Intensity 5.19 * 1.69 -1.93 (2.78) (2.82) (5.77)
Health care issue 2.32(4.38)
Senior citizen issue 24.41(15.62)
Partisan issue -9.80(10.72)
Presidential initiative -22.04(15.28)
Root MSER-squaredN
Model 9 Model 10 Model 11 Model 12
12.4
1020.6211.9
1020.58
11.9
1020.62
11.90.64102
Note : The table shows ordinary least squares coefficients with robust standard errors in parentheses. The dependent variable is the treatment effect (treated-control). All models include fixed effects dummy variables to capture differences between the surveys but the coefficients have been suppressed for presentation purposes. * p < .10; ** p < .05; *** p < .01 (two-tailed).

29
Table A1. Descriptive Stastitics for the Media Coverage Variables
Volume (all sources) logged 2.35 1.04 0 4.77Newswire coverage logged 1.75 1.15 0 4.26Print coverage logged 1.21 0.95 0 3.53Television coverage logged 0.51 0.70 0 2.56Intensity 0.59 0.52 0 2.00Breadth 0.84 0.37 0 1.00
Mean Std. Dev. Minimum Maximum
Note: The means of the raw series are as follows: Volume = 17.2 (s.d. = 18.8); Newswire coverage = 10.2 (s.d. = 11.4); Print coverage = 5.2 (s.d. = 6.1); and Television coverage = 1.8 (s.d. = 2.3).

30
Figure 1. Surveillance Knowledge for Varying Levels of Media Coverage
Panel B: Clinton Gun Control Proposals in 2000
0102030405060708090
100
0 stories 0 stories 9 stories 25 stories
% C
orre
ct
Continuation of gun buy-back
program
Agreement with the National Rifle
Association
Background checks at gun
shows
Manufacturers provide gun safety locks
Panel A: Clinton Proposals on Health Care in 1997
0102030405060708090
100
0 stories 0 stories 9 stories 18 stories
% C
orre
ct
Expand coverage for
long-term care
Expand coverage for low
income
Expand coverage for working uninsured
Expand coverage for children

31
Figure 1. Surveillance Knowledge for Varying Levels of Media Coverage (cont'd)
Panel C: Government Report on Medical Errors in 1999
0102030405060708090
100
0 stories 0 stories 3 stories 5 stories
% C
orre
ct
Tougher malpractice laws against doctors
and hospital who commit errors
More severe punishments
of doctors and nurses who
commit errors
New government agency to protect
patients from medical errors in
hospitals
Errors are a big problem that cause many
deaths in hospitals
Panel D: Recommendations from National Commission on Social Security in 1998
0102030405060708090
100
0 stories 0 stories 3 stories 4 stories
% C
orre
ct
Raise eligibility age for Social Security
benefits
Shift money into private accounts
Invest SS Trust Fund in stock
market
Increase payroll tax for workers

32
Figure 2. The Effects of Media Coverage on Surveillance Knowledge
60
80
100
-100
-80
-60
-40
-20
0
20
40
Tre
atm
ent E
ffec
t
Note. Figure includes all cases where the comparison is no coverage versus some coverage (n = 62).
33
Figure 3. Predicted Treatment Effects
-10
0
10
20
30
40
50
Media Coverage
Tre
atm
ent E
ffec
t
Low High
8 stories
16 stories
27 stories

34
Figure A1. Scatter Plot of Predicted News Coverage and Treatment Effects
0
20
40
60
80
100
120
140
-30 -20 -10 0 10 20 30 40 50 60 70 80
Media Treatment Effect
Pred
icte
d N
umbe
r of
New
s Sto
ries