Embed Size (px)
Citation preview

The Commercial Household. Servants and lodgers as alternatives to intergenerational support in town and countryside (the Netherlands, 17th century)
By Annemarie Bouman and Tine De Moor1
This article adds to the debate on the consequences of the development of the European Marriage
Pattern (EMP) that is currently in full swing. Life-cycle servanthood is one of the features of the
labour markets in EMP-areas, as this allows men, but in particular women to increase their pre-
marital savings. Our approach will however show that the high number of servants in nuclear
households was not just an effect of the EMP on the labour market, but a vital part of the
‘correction mechanism’ behind the EMP, to counter the negative side-effects of the changes in
household composition it brought along. Servanthood should not only be seen as a ‘labour market
instrument’ that allowed for pre-marriage saving, but also as a way to obtain the necessary social
security, in particular when children had moved out to set up their own households. By means of an
alternative method to classify households according to their composition, we can, more clearly than
has been done so far, identify which households were extended, how they were extended, and what
effects those extensions had on the viability of those households. This will show that not just the
paid-, living-in servants were part of the ‘correction mechanism’ that emerged as a consequence of
the EMP, but that other non-kin living in, such as lodgers (who paid for their stay in the household
or were being paid for), were also important in the area under consideration. Moreover, we will
demonstrate that this correction mechanism was present both in town and countryside, whereas
the literature until now has mainly stressed the relevance of servanthood in urban areas. On the
basis of a new large dataset on early seventeenth-century household composition in the Northern
Netherlands, we analyze the dependency between members of the household, and we can
demonstrate that the role of non-kin living in – both paid members (in the form of servants) as well
as paying members (lodgers, living-in, students, etc.) – contributed significantly to the viability of
the household and was an essential means of reducing nuclear hardship. In situations where kin
were no longer present in the households and elderly parents were no longer (re)incorporated in
the households of their children, the number of non-kin living in increased considerably. We 1

therefore claim that the ‘commercialization’ of a part of the household – by making it subject to
forces of supply and demand – was a vital stage in the establishment and continuation of the EMP.
Introduction
The European Marriage Pattern (EMP) of Northwestern-Europe, with a high age at marriage for
women, neolocal household formation, large numbers of singles, and a small age gap between
spouses, is generally believed to have given rise to substantially smaller households. Such
households would have concentrated around a single/widowed/married head of household, his
or her spouse and/or children: the so-called nuclear family household.2 This is in contrast to
non-EMP areas where the extended household remained dominant.3 Due to the limited number
of generations in the household, nuclear households have, in general, fewer adults around to
contribute financially and/or to provide care. In addition, when the age gap between spouses is
smaller, and people get married relatively late (as in EMP-areas), the life courses of spouses will
coincide. Young adults with children might not be able to provide for their children and their
ageing parents at the same time, a problem referred to as life-cycle squeezes.4 Those young,
unmarried adults would have had time to move away from their parents to earn their income as
servants or apprentices before getting married, which is referred to as life-cycle servanthood.5
Similarly, parents whose children had already left the household but were not yet ‘old’ could
have enjoyed a double income, which in turn made it possible to save for old age. This possibility
might have stimulated saving as well as investing, both before marriage and after children left
the household.
Strangely enough, servanthood has so far been mainly considered as a process leading up
to household formation because of its contribution to pre-marital savings and its influence on
the postponement of marriage. Studies have primarily focused on the (quantitative) importance
of servants within society as a whole, whereby comparisons of the presence of servants in the
whole population have led to conclusions that service was a much more common practice in the 2

North of Europe, in comparison to the South of Europe – or, for that matter, ‘the Mediterranean’.6
Other studies have focused on the relationship with masters, mainly based on qualitative
analysis of ego-documents.7 Servanthood has not yet been studied in the light of household
formation processes and its role in facilitating changes such households could go through. In fact
quite to the contrary: servants are usually not even considered to make a difference in the
classification of households, and are often not even counted as ’real’ household members. We
emphasize that not only extensions with kin have an impact on the way households cope with
‘nuclear hardship’ caused by life-cycle squeezes, but that families in EMP-areas could have
solved nuclear hardship8 – at least temporarily – with commercial solutions that extended their
families. By ‘commercializing’ a position in the household – either by ‘buying labour’ (servants)
or by ‘selling space’ (lodgers) – households could overcome temporary hardship of a financial or
physical nature. The non-kin extended households, therefore, should be considered separately in
order to be able to study this important aspect of the EMP. For if young adults actually were part
of the households they worked in – and North-western European households also included other
strangers that were paid to be part of the household (servants), had to pay to do so (lodgers), or
were being paid for by charity (orphans, widows or the poor) –, it is clear that the EMP initially
led to a new form of household formation, giving rise to a kind of (temporary) ‘commercial
household’.9 The actual size of a family – with nuclear households being in principle smaller than
extended ones – is in this approach of lesser importance, as extensions with non-kin could have
led to equally large households in the North in comparison to the South. Families might have
been smaller in EMP-areas, but some households remained – at some points in the life-cycle, and
this is a particularly important point – large, due to integration of non-kin. Relationships with
extended kin might have been replaced by commercialized relationships, which either provided
help and care in exchange for money, or provided money in exchange for a meal and a roof over
one’s head. We argue that this ’commercialization‘, in response to the weakening family ties, was
a vital aspect of the mechanisms behind the development of the European Marriage Pattern,
3

although there were – as we have demonstrated elsewhere – also other solutions to hardship
outside the realm of family or confines of the household.10
In a further reflection upon this phenomenon one could also claim that such
commercialization made the EMP-household more flexible in adjusting to changing internal
(household composition) and external (economic hardship, other opportunities) circumstances,
maintaining the household at an optimal size, instead of – what could be expected in more
extended households – a maximal size. This situation might have been temporary, but the
beginning and end of this temporary commercialization of the household, and its role in the
creation of the pre-industrial labour market, all remain unclear. A few authors have offered
some hints. Hareven suggested that the eventual loss of the flexibility regarding the
incorporation of strangers in the household started at the beginning of the twentieth century
and would change the form of the household substantially.11 Skolnick, amongst others,
connected this flexibility with changes in the labor market.12 We will, in this article, not try to re-
evaluate this relationship, but start with the basics: those of identifying the size of the
phenomenon (i.e. non-kin living in) and the mechanisms behind it.
On the basis of this reasoning, we may assume that households in EMP-areas might have
incorporated large numbers of non-kin exactly because they needed a helping hand or could use
additional money, as kin were no longer providing both. Thus, instead of stressing 'agency‘ at the
labor supply side – servants wanting to work because they needed to save for their marriage –,
we stress the actions undertaken by the ‘demand’-side. Understanding such a ‘commercial
household’ requires a view on lifecycles – not primarily of servants or lodgers themselves, as has
been the focus of the servanthood-debate so far – but of households. If households were able to
save in specific periods, they might have had the means in other periods to ‘buy’ the extra hands
they needed, for as long as they were needed. In doing so they created a labor market for young
people, including young women, who could, in turn, save money before getting married.
Vulnerable households might furthermore have strengthened their positions by having non-kin
4

living in. Widows might have shared households to cut expenses: letting part of their dwelling
could have provided them the opportunity to stay at home and generate an income.
Understanding such mechanisms requires both a dynamic approach and a possibility to
shed light on the income levels of households, as we will demonstrate in this article. In this
article we will look at the dynamics of the household by comparing a large set of households for
a single point in time. In a forthcoming article we will study the changes over a longer period of
time that take place within a number of households.
In order to deepen our understanding of this mechanism, we deal with a number of
issues in this article, all related to living-in non-kin in the early modern Dutch household, hereby
challenging historians, sociologists, and anthropologists with a new perspective on households
in EMP-areas.
In the first part, we will discuss the existing literature on servants and 'inmates' (in the
meaning of ‘living-in person’) regarding household formation and composition, followed by a
discussion of the categories used to classify households. Considering the rather blurred
categories some of the most prominent scholars have used to analyze households, a new
classification that takes into account the relationship between household members is necessary
to understand the phenomenon of the ‘commercial household’. Following this theoretical section
we will introduce our source – a dataset of the seventeenth-century Northern Netherlands, an
area right at the core of the EMP – and our methodology. Furthermore, we link the analyses of
household composition in early modern Northwestern-Europe to previous publications by
Laslett (for England) and van der Woude (for the Netherlands) among others, comparing figures
on household composition and household size. In our conclusions, we will state that most of
these households were indeed nuclear family households, and that the elderly usually were not
reincorporated in the households of their children – which is in line with the expectations
formulated in the Nuclear Hardship-literature. Our analysis demonstrates that parents were far
more likely to take in non-kin than to live with their own children. Our analysis also shows that
the dominance of the nuclear family (at the expense of the extended family) led to a high degree 5

of dependence on non-family related help, ‘filling the gap’ that could no longer be filled by the
extended family. An explanation for this – and one of the primary features of the European
Marriage Pattern – is neolocality, whereby a young couple forms its own household at marriage,
instead of moving into one of the parents’ households.13 This very idea can be considered as the
ideological basis for the presence of nuclear hardship, in combination with the late marriage age
for both men and women, which might have been a direct consequence of it as well (creating the
need for men and women to work before marriage).
The commercial household provided labor market opportunities, in particular for
women, and simultaneously provided opportunities for heads of households – including single
female heads of households – to earn an income by sharing their household with others on a
commercial basis. It also provided the elderly with the possibility to include ‘strangers’ in their
households, that could either provide them with care or the much needed extra income.14 In
turn, such temporary lodging arrangements provided opportunities for labour mobility and
flexibility. Our study can demonstrate this only for the early seventeenth century, a period when
the Dutch economy was flourishing. Considering that in later centuries this particular
phenomenon largely disappeared, the commercial household may have formed an essential step
in the development of the household oriented towards a commercial economy, rather than a
permanent feature of the EMP.
Connecting the dots: EMP, Nuclear Hardship, life cycle service, and household
composition
In his Nuclear Hardship Theory, Peter Laslett claims that the increasing dominance of the
nuclear household could lead to hardship among ageing parents and other groups in society in
need of care.15 But not only ageing parents would suffer from hardship; since grandparents were
no longer found within the nuclear family households, parents had to solve the lack of helping
6

hands. Financial stress (poverty) and a lack of care often coincided for elderly parents and their
offspring who had young children of their own.16 In non-EMP-areas enough adults were present
within the household to provide both care and income through labour. Marital partners were
often in different phases of their life course, which relieved the stress on the care for the elderly,
who would, logically, also be in a different phase of their life course. Given this and our earlier
explanation of the emergence of a ‘commercial household’, an essential element in our
interpretation of the Nuclear Hardship Theory is thus the lack of cohabitation of multiple
generations, and the extent to which the room left open by other generations was
‘commercialized’, and filled in by in particular non-kin. We thus need to distinguish between
different generations on the one hand, and kin versus non-kin on the other.
The household classification system Laslett developed does not tell us if households
included non-kin, and consequently does not tell us which households were extended by non-
kin.17
[TABLE 1 ABOUT HERE]
Servants can be found in simple, extended, multiple, and indeterminate family households.18 It is
not clear how inmates fit into this classification: Laslett never fails to mention they are not
considered a part of the household, but does not clarify whether he counts them separately,
ignores their presence in the census data, or removes them on purpose. When Laslett presents
figures on the proportion of servants on the total number of households in England, France,
Serbia, Japan, and Colonial North-America, he specifically mentions the inmates and inmate
households as being excluded from the Serbian data.19 What occurred with the other inmates, or
for that matter inmate households, in the English, French, Japanese, and American data, is not
clear. Another problem with the classification based on a central couple is that it becomes
impossible to determine who is living in with whom, although this can also be a consequence of
the restrictions created by the source material. The following example, also pictured in the figure
7

below, demonstrates that details about household composition are most valuable to
understanding intergenerational support.
[FIGURE 1 ABOUT HERE]
In the above figure, Household A, for instance, consists of a widow (Ego= the head of household),
with an living-in son, his wife, and their children. Household B consists of a male (Ego= the head
of household), his wife, their children, and his widowed mother living in. The classification used
by Laslett disguises the dependency between the members of the household. His classification
labels both households as ‘upward extended’, since the couple, rather than the head of
household, is central. This is problematic if one looks for the relationship between the
composition of a household and the contribution of children to elderly care. In our classification
we will distinguish A and C – as downward extended households – from B – being regarded as an
upward extended household. In Laslett’s analysis, A and B would have been considered as
extended households and C as a multiple family household.
With the above example, we intend to make clear that, in order to reveal the significance
of non-kin living in and the absence of family members in the role of carers, we need a
classification which does more than making a distinction between households that are simple,
extended, or multiple extended – which are in fact rather classifications of family within the
household –, instead of classifications of households. We need to see all different kinds of
extensions, whether they consist of kin or non-kin, and these need to be counted beginning from
the household head and extending upward or downward.
Household composition in a core-EMP-area (17th -century Northern Netherlands): the
sources
8

Any research into household size or composition is destined to use census or at least census-like
data, for whatever reason they may have been collected.20 In the Netherlands, the oldest useful
sources that include many of the variables we are looking for seem to be the ‘Hoofdgeldlijsten’ or
poll tax registers.21 During the Dutch War of Independence, near the end of the Twelve Years’
Truce (1609-1622), the Spanish again threatened to attack Holland with sieges of Bergen op
Zoom and Breda. In need of new funds, the States-General (Staten-Generaal) demanded a
contribution of ‘one guilder’ per inhabitant of the provinces of Holland and West-Friesland, to be
collected by the Provincial Council(Provinciale Staten), both in the towns as well as in the
countryside (ambachten).22 This ‘Hoofdgeld’, a taxation on the ‘heads’ (hoofden) of all citizens
regardless of their age, status, or property, was intended to be raised between 1622 and 1623. 23
The resulting sources have survived for a number of large towns, such as Leiden and Gouda, and
a fairly large number of villages in their vicinity.
Lodgers, students, and servants were described in our sources as members of those
‘blocks’ or households. In the Hoofdgeld-sources from Leiden, the question whether someone
‘belonged’ to a household is addressed in an even more specific way. Here we see how people
are ‘accounted for’ in the household while they are temporarily absent – for instance if they were
in the army or at sea; others are described as living in but ‘accounted for elsewhere’ – for
instance a young servant who is accounted for at a parents’ house. This source even indicates
who had been registered before (there must have been a version prior to the Hoofdgeld-taxation
of 1622-23), but had moved or disappeared. In building our database, we decided to base
conclusions solely on persons who were present within the households (thus excluding those
living elsewhere, whether temporarily or permanently).24
To collect data, interviewers followed specific itineraries going from house to house. And,
in the case of the Hoofdgeld-source from Leiden, interviewers described their inquiries road by
road, including addresses and household numbers. If units are mentioned separately, it is
indicated if they were sharing one house (in the Leiden data this is done by adding a/b/c to the
household number).25 Whenever servants and lodgers provided for their own (‘buiten de kost’) 9

this is also mentioned separately, which indicates that lodgers and servants normally might have
shared in the provisions of the economic unit in which they lived.
We have used Hoofdgeld-sources from the Zuiderkwartier26 and added specifics such as
gender, the anthropological notation for the relationships within the household (on the basis of
the indications given in the source), and information on, for instance, the living in of persons
mentioned and whether they were poor or not, for 41 hamlets/villages in total,27 as well as the
town of Leiden, all dating from 1622-23. The number of households in the Ambachten is 7,998
(36,176 inhabitants in total) and in Leiden 4,264 (18,993 inhabitants in total), making thus an
overall total of 12,262 households, with a total of 55,169 inhabitants.28 29 As mentioned above,
we need a new classification method for households which tells us how families are extended,
thus also providing information on dependency of household members.30 Whereas Laslett
chooses to call all single parents with children widowed, and classified living-in children without
a living-in spouse automatically as single,31 we choose to register only the actually mentioned
marital relationships, if indicated. We do not distinguish between singles and widowed persons,
only between those with or without a spouse.32 The ‘nuclear core’ of a household, also called the
‘central nucleus’ by Laslett and Hammel, consisting of a nuclear family (a head of household,
with or without his or her spouse and/or children), will now be depicted as follows:
F/M (Gender) – 0/1 (Spouse absent or present) – 0-15 (Number of children)33
By using the nuclear core plus extensions, we can not only see if households were extended by
kin or non-kin, but also what kinds of nuclear cores were extended by kin or non-kin.
A complete overview of all different relationships to the household head by using the
anthropological notational system might become quite elaborate. In the case of our database we
counted 74 different relationships to Ego (head of household). This makes it possible to register
the relationship between all household members, but makes a thorough comparison too
complicated. For the purpose of household classification, we therefore lumped categories 10

together to simplify the amount of possible kinship extensions. Basically, our household
classification differentiates between kin- and non-kin extensions. In the table underneath we
give an overview of the ways in which we have grouped the households.34
[TABLE 2 ABOUT HERE]
For the different generations within a household we use strings with a binary system: 0=absent,
1 is present. Ego always forms the core of the string. In our database we designed strings
showing two generations upward (with parents, upward) and three generations downward
(children, downward).35 For example, 0-1-E-1-0-0 indicates a family (within a household)
consisting of three consecutive generations: parents, Ego, and children.
Extensions by kin and non-kin (servant, inmates): a comparison within the Netherlands
In our analysis we need to focus on a number of questions. First of all, we want to identify the
importance of the “typical” EMP household: those households – nuclear and otherwise – that
consisted of just one couple with or without children; moreover, we want to identify the position
of the elderly within these households. Secondly, we want to find out to what extent households
were taking in non-kin to help out in the household and what type of household did so: were
these households with or without children? Thirdly, we want to contrast this with the number of
households which extended upward in order to find out whether those in need of support at old
age could count on their children, or if they had to commercialize part of their household in
order to get sufficient help.
‘Nuclear’ versus extended households
11

How many households did not have any kin or non-kin extensions, and are generally indicated
as ‘nuclear family households’ in the (not so specific) literature? We need to be specific about
what households we include, to make comparisons with other datasets possible. The term
'nuclear family households' is often used for the households which dominate in EMP-areas, but it
is not always clear if those ‘nuclear households’ include solitaries or families that are extended
by non-kin, such as servants. We want to separate the households that consist of just the nuclear
core – the households thus without living-in kin or non-kin–, which means that we include a
maximum of two generations of parents and children. This could, as the figure below
demonstrates, include solitaries as well, and also siblings without the presence of a parent or
spouse.36
[FIGURE 2 ABOUT HERE]
The table below demonstrates that, if we consider the above categories for our case-
study of the seventeenth-century Netherlands, three-quarters of the population, in towns and in
the countryside, lived in a one- or two-generation household without the presence of any
parents. Surprisingly, the number of solitaries was not larger in the city of Leiden in comparison
to the surrounding countryside, and the countryside also had a larger share of households
without parents living in.
[TABLE 3 ABOUT HERE]
If we consider the category of the extended households (see the tables below), our data show
that those households, both in town and the countryside, were primarily extended by non-kin: a
mere 2% of all households was extended by family members. More than one-fifth of all
households had non-kin in the household. In Leiden this was even over a third of all households
(non-kin + double extended).
12

[TABLE 4 ABOUT HERE]
[TABLE 5 ABOUT HERE]
[FIGURE 3 ABOUT HERE]
Our figures are in line with earlier attempts to demonstrate the dominance of the nuclear
household in the Netherlands. On the basis of the analysis of 7,763 households from Overijssel in
1749, Slicher van Bath concluded that 20.5 percent of the households were extended or joint
(with a difference between villages (15.3 percent) and the countryside (22.6 percent), and 14
percent of all households consisted of three generations. According to Slicher van Bath, servants
formed a greater proportion of the population than living-in kin. Sources from Overijssel from
1749 revealed that 33 percent (5,000 of the 15,304 households), had living-in servants; 7.5
percent had three or more servants living in. Servants, totalling 9,500 individuals, formed 12
percent of the total population.37
However, in comparison with our Hoofdgeld-sources of 1622, a much larger percentage
of the population in Overijssel was extended with kin (20.5 percent) (but the figures do not
differentiate between siblings living together and siblings living in with their married brother or
sister). Also the figures on three-generation households are rather high (13.9 percent),
compared to what we find for Holland. Slicher van Bath does not provide figures on households
that were solitaries, conjugal, or nuclear, but if he concludes that 33 percent had living-in
servants (which he separates from living-in kin), we must conclude that (although there are no
numbers given for living-in lodgers or other living-in non-kin) at least 33 percent of the families
were non-kin extended; that is, if those servants were not, in fact, kin ‘in disguise’.38
13

Roessingh studied 6,632 households at the Veluwe (1749), of which 44 percent lived in
in the countryside and 75 percent in towns, and calculated that only 4 percent of the households
in the countryside and 2 percent of the households in towns were vertically extended, whereas
in 32 percent of the households one could find servants living in. He furthermore states that the
number of servants in the total populations equated 14 percent. Faber, studying Friesland in
1796, deducted that in areas where at least 40 percent of the total population lives from
agriculture, the number of servants in the total population never dropped below 11 percent,
whereas in towns and villages – where other professions were more important –, the number of
servants dropped to 5 to 10 percent of the total population.39
Van der Woude described 8,500 households in 40 villages in the Noorderkwartier, (a
historical geographical indication, referring to the part of Holland north of the river IJ) in 1622
on the basis of the Hoofdgeld-data from the northern parts of Holland. Van der Woude
complements Struyk’s data by adding figures of data collected between 1622-1795 on 4,000
households in the same region. Van de Woude calculates that 5.9 percent of the total population
would have consisted of servants, with a total number of 17.6 percent of the households having
living-in servants. Furthermore, he states that living-in lodgers were found in about 10 percent
of the households, making the total amount of living-in non-kin per household at least 27.6
percent.40
Our figures match the findings of van der Woude on the Noorderkwartier: in the
Ambachten we see that 16.8 percent of the households are extended by non-kin (almost one -
sixth of all households), whereas in Leiden the total number of households extended by non-kin
is as high as 34.5 percent,41 matching the figures on servants in other parts of the Netherlands.
Overall, as is also demonstrated on the map below, our data confirm the differences between the
coastal and more inland parts of the Netherlands. Although the subsequent analyses cannot be
compared to those done in the work of van der Woude or other material, it is not unlikely that
the commercial household (and its implications we will discuss hereafter) was a phenomenon
present particularly in the coastal part of the Netherlands, and that, although numbers of 14

households with servants were much higher in the eastern part of the Netherlands, this was a
distinctly different phenomenon. In the eastern parts, servants were mainly active in agriculture,
and, given the fact that extensions of households with kin were not unlikely either, these
servants were probably not there to help out the elderly or needy, but simply participated in the
activities of the farm. In the areas around Leiden, it was less likely that servants would have
been active as farm hands.
[FIGURE 4 ABOUT HERE]
To find out if the elderly would have been reincorporated in the households of their children, we
need to locate them in those households. Our data do not only include information on household
composition, but also on family composition within households (by registering living-in kin).
Table 3c already indicated that the number of households including parents (as parents of the
head of household) or grandparents was very limited. The table below demonstrates that the
number of households composed of several generations was absolutely negligible. Only 2
percent of the households (F to K) are extended consecutively by two or three generations,
making for three- or four-generation households. Even if we look at all extensions, including
those that are ‘non-consecutively’ extended, the total amount of extended families does not
excede 2 percent.
[TABLE 6 ABOUT HERE]
If we only look at kin present within the households, we see that most households do contain
one or two parents and their children (C). The mere fact that the number of household heads
with a living-in parent and without children (B) is very low, indicates that neolocality was likely
15

practiced, and that reincorporation of the elderly rarely took place (at reincorporation the child
would likely remain the head of household).
It is generally assumed that nuclear hardship existed in different periods during the life-
cycle: at the onset of starting a household (which coincided with starting a family if rules of
neolocality are adhered to), and when children had left the homes of their parents and their
parents had aged, become widowed, and could no longer ensure their own incomes. The
argument of Pier Poalo Viazzo, citing Kertzer and Brettel among others, that looking at the
reincorporation of the elderly might shed an entirely different light on household formation
throughout Europe, can, according to our data, not have made the difference in early modern
Holland.42 On the basis of Table 4. with just 1 percent of upward extended family households, we
must conclude that the households in this area of the Northern Netherlands did not generally
reincorporate the elderly, nor did elderly incorporate the households of their married children.
The numbers furthermore indicate that the elderly (assuming they had not all perished) must
either have lived in their own households, alone or in couples, with their unmarried adult
children,43, incorporated as non-kin living in, or in their own households extended with non-kin.
Since our data do not include ages, it is difficult to trace those households, but, if we expect
married couples to form households only at marriage, and to have children not that long after
marriage,44 we can assume that only a very small percentage of the households of which the
nuclear core consisted of a couple without children (M-1-0 or F-1-0) had just been married or
was infertile. The bulk of households with couples and without children must have consisted of
households in which the children had already moved out. This is a rather large group, making up
10 percent of the households (9.8 percent for the ambachten, 10.3 percent for Leiden). Of course
the elderly might also have lived in solitaries or in households with non-kin extensions. And
although it is not evident that all widows and widowers were in fact elderly, there are quite a
few widows that shared households or lived in with families as ‘non-kin’.
16

This section demonstrated that the elderly could not have solved their hardship by
moving in with their married children. In the following sections we will take a look at the
incorporation of non-kin that might have provided nuclear hardship solutions.
The role of non-kin in the household: servants versus inmates
Our data demonstrate that over one-fifth of the households was extended with non-kin (of which
a very small part was extended by both kin and non-kin), which is a very substantial part of the
population. But how was this related to the rest of the household composition (dominance of
nuclear households and very few multi-generation-households)? ‘Renting’ an extra hand to do
the work children were not doing might be one way to alleviate hardship. Other non-kin living
in, such as lodgers or boarders, might have provided other solutions. As for the English situation,
our data also show that a substantial part of the living-in non-kin consisted of those lodgers,
though this was – logically – very different between town and countryside. In the city of Leiden
about one-fifth of the households with non-kin had lodgers, and over one-third had servants,
whereas in the countryside the latter were present in over two-thirds of the households, and a
negligible share was taken up by lodgers.
Part of these are referred to as simply ‘living in’ (‘woont in’), without a further reference
to their role within the household; sometimes this notion is followed by the note that the living-
in person is a widow or someone who is poor or ‘innocente’ (ignorant), whereby some sort of
financial arrangement could have been made to compensate for this kind of lodging. The church
and other charitable organisations paid families – and also widows – that accommodated the
poor, handicapped, and orphans.45 We shall refer to this category of living-in non-kin, as
‘inmates’, in line with Laslett.46 The inmates in our database can be divided into five categories:
the lodgers (clearly labelled for instance as thuyslegger [literally translated: ‘one who lies at
home’]), the living in (who are mentioned as living in, but not clearly labelled as lodgers),
temporarily or permanently adopted children (e.g. houkint [literally translated: ‘a child to
17

keep’]), students (only present in the Leiden database) and others (of whom no relationship is
mentioned).
[TABLE 7 ABOUT HERE]
For Italy, clearly not an EMP-area, it has been claimed that having living-in servants was
clearly typical for the nobility.47 Szoltysek displays rather different figures for the Polish-
Lithuanian Commonwealth (PLC), however, than those we find in early modern Holland or Italy.
Table 6 displays the most interesting features of his findings (based on 135 to 151 parishes in
the late eighteenth century) for our comparison.
[TABLE 8 ABOUT HERE]
We see that the percentage of kin is the lowest in the western part of the PLC, whereas the
percentage of servants as well as the percentage of inmates/lodgers is substantially higher
there. The percentage of living-in servants as well as inmates/lodgers seems to diminish
substantially when the percentage of living-in kin increases.48 This would confirm our idea of
non-kin solving the problems that an absence of kin within households might cause. But we
cannot jump to conclusions here, for the percentage of living-in kin is still, even in the ‘west’ of
the PLC, much higher than what we see in early modern Holland. Furthermore, we also do not
know if households were compensated for living-in inmates and lodgers. From the tables
displaying age groups we furthermore learn that the servanthood in both the ‘West’ as the
‘Middle East’ must have been a kind of life-cycle servanthood, with very few servants over the
age of 30.
Non-kin thus might substitute kin, but the relationship with the head of household and
his or her family might be quite different. It is often assumed that solidarity among kin must
have been higher than among non-kin. But even if this would have been the case, there are also 18

benefits to having non-kin living in. Non-kin can be treated differently and might be present for a
shorter period. If household members fall ill or become handicapped, it is easier to get rid of
non-productive non-kin than it is to get rid of non-productive kin. As harsh as this might sound,
this higher ‘flexibility’ of having non-kin might well have been preferred over ‘being stuck’ with
relatives.
If we look at the map of PLC and compare it with Laslett’s line dividing EMP- and non-
EMP-areas,49 we see that what he describes as ‘the West’ still fits the EMP-area, whereas the
‘East’ and ‘Middle East’ regions are definitely non-EMP-areas. Thus to some extent we see that
even at this ‘EMP-frontier’ the percentage of living-in non-kin is much higher than the
percentage of living-in kin in the EMP-area, whereas the percentage of living-in kin is much
higher than the percentage of living-in non-kin in both non-EMP-areas. But still, we have to keep
in mind that 20.8 percent of living-in kin is substantial, and considerably higher than what we
find in Holland.
South of the Polish-Lithuanian Commonwealth, in Bohemia (which is also an EMP-area
according to the Hajnal line), census data from 1651 also reveal large numbers of inmates, or
‘inmate sub-households’ as they are referred to in the work of Ogilvie and Cerman.50 It is not
clear however, whether those inmates include servants, since servants are not mentioned at all
in their work, but may have been included in this category. In the urban areas, the percentage of
inmates is as high as 26.9 percent, whereas in the rural areas the percentage is 15.5 percent. In
our data the percentage of non-kin including servants is 34.5 percent in Leiden, the urban area,
and 16.8 percent in the Ambachten, the rural areas. According to Ogilvie and Cerman, such a
difference can be foremost explained by housing structure and labor requirements, while
allowing that other theories emphasize inheritance, marriage, and retirement practices. The
very low percentage of what they call ‘non-nuclear kin’ (1.5 percent in Liberec, Frýdlant, and
Dĕčín) indicates that some inmates might in fact have been relatives. There might also be some
confusion on another level: ‘Social status was defined in essentially economic terms’, they
explain, before listing all the possible options such as peasant, gardener, cottager, crofter, or 19

indeed ‘inmate’ (Hausgenosse, podruh).51 The term ‘inmate’ in this census might thus also have
been attached to an economic status, rather than a purely residential one. Nevertheless, kin
relationship to the head of household was also registered, and if those inmates would have been
related to the head of household, it would have been registered. Since we also find such a low
percentage of kin living in in Holland, the 1.5 percent may be correct.
But how different was the EMP-area as far as the presence of servants is concerned? Was
having servants a typical feature of the top-classes of society, as in Italy, or was it such an
essential feature of the social and economic system that the practice had penetrated all layers of
society? To find whether having non-kin in the household was a common feature among early
modern Dutch households, and in what manner they did so, we have two instruments. On the
one hand, we can check in which households they resided: were they in households with
children, or without? In the cases where children were still living in, it is quite unlikely that
servants in particular were there to take care of the elderly, but they might have alleviated the
care for the children or the household chores; in households with children we might rather
expect lodgers, who would yield extra cash to survive temporary squeezes. Another way to
approach the question whether this phenomenon of the commercial household was common
among all layers of society is to control for poverty. The Hoofdgeld-source indicates which
households were incapable of paying taxes (onvermogend), and also the households that were
actually poor (arm), or living on poor-relief (leven van de armen, leven van de thuyssitten).52 The
following table shows to what extent the various household types were present among the poor,
which represented one-fifth of the total number of households.
The table below demonstrates that, on the whole, poor households belonged more
frequently to the category of nuclear households without any extensions, but that even so, in one
out of every ten poorer households non-kin were present. Here again it can be noted that neither
the poor nor the rest of society were organized in kin-extended households. The fact that the
non-poor had a slightly higher number of kin living in (with kin extension and double extension)
20

is in fact surprising, as one would rather expect the poor to resort to solutions within the family
than those who could actually afford it.
[TABLE 9 ABOUT HERE]
Clearly (see the table below), the poor households had more paying living-in non-kin than the
other households, in particular in the city of Leiden where nearly all living-in non-kin were
paying instead of being paid. The reason for a more balanced situation in the Ambachten is no
doubt that servants there were also working in local trade or agriculture, which was less an
option in the city. The picture for the non-poor households is – in particular in the Ambachten –
entirely the reverse of the poor. There, the non-poor were actually attracting servants in
particular, rather than attracting lodgers. In the city as well the non-poor households were
trying to get as much out of the lodgers as possible, but a substantial number (11 percent) had
both an inmate and a servant (see table 10). One could say these are the ultimate 'commercial
households' which were on both the demand and the supply side. Overall, looking at city and
countryside together, servants and inmates are more or less in balance, with less than 10
percent of all households having more servants than inmates. This result demonstrates that both
types of commercialization of the household space were almost equally important, but that to
some extent it depended on the economic situation and the location whether one paid someone
to live-in or whether a household received payment for having a lodger in the household. In a
next analysis we will find out more about who those households were that had servants and
inmates in the house.
[TABLE 10 ABOUT HERE]
The underneath table demonstrates that households that include non-kin are not randomly
extended. Households with couples tend to be extended with non-kin if they have no children. At
21

a first child this number drops slightly, only to rise again at the addition of a second child. After
the second child, the number of kin taken into the household drops with every successive child.
Although single and widowed household heads are very likely to live with non-kin, we see that
households with one or two children tend to be slightly more inclined to take in non-kin. Again
the number of living-in non-kin tends to drop slightly when more children are living in, but we
see the numbers rise again if more than seven children are part of the household. Single or
widowed male heads of household form an exception. They seem to extend their household with
non-kin exponentially with each consecutive child, but although there is a clear trend, we have to
be careful not to attach too much value to it when it comes to households with more than five
children, since those households are so sparse.
This demonstrates that the higher the number of children, the less an extension of the
household is needed (or the less room there is to incorporate non-kin, which also makes sense).
Furthermore, the slightly higher number of households with couples that incorporated kin at the
addition of a second child makes it likely that having two children was indeed an incentive to
demand a helping hand.
[TABLE 11 ABOUT HERE]
When servanthood is discussed in literature, the role of women is often stressed in particular as
a distinctive feature of Northwestern Europe, with far more female servants than in southern
European areas. The table below confirms that idea very clearly: 65 percent of the total number
of servants in our dataset was female; in the city nearly four out of five of the servants were
women. The picture for the inmates is however different, nearly the reverse. Although in the
countryside more than half of the inmates were female, in the city women contributed to only
one- third of the total number of individual inmates. This has, in the city in particular, entirely to
do with the fact that inmates – particularly in the city of Leiden – were in many cases students
22

(in a time when women were not welcome at the higly esteemed institution…). The female
inmates we find in Leiden are for a major part in-living widows.
[TABLE 12 ABOUT HERE]
[TABLE 13 ABOUT HERE]
Conclusions
In this article we have demonstrated that the household was much more than the ‘container’ of
potential labor market participants: each household was at least for some time in pre-industrial
EMP-Europe also a mini-market – for labor and housing – in itself. With our large dataset on
early seventeenth-century Dutch households, we have demonstrated that the nuclear household
was indeed quite dominant in this area, and that the number of kin-extended households was
negligible; all the more so did households extended by non-kin form an important part of
society. Both servants and inmates were present in nearly equal shares of the households, and
depending on the poverty level and the location, the one or the other was more important.
Although some literature refers to lodgers in EMP-households, our data show that much more
attention should go to their presence, especially because they may have had a role in facilitating
the households getting through periods of hardship due to their contribution to the household
budget. We have suggested that the ‘commercial household’ emerged as a consequence of the
changes to the household composition that went together with the EMP and that lead to reduced
intergenerational support. Servants may well have played a role in providing physical help, but
lodgers, taking the physical place of the children that left the household to set up their own, may
have provided that little extra cash necessary to make ends meet. Our short gender-analysis of
the inmates and servants showed that women were clearly very present among the non-kin. The
23

results were far more striking than what we would have expected given the existing literature.
Clearly women lived in a society where they had the right and the possibility to make their own
living, or, for that matter, to determine with whom they shared a household. We do not have
information about their ages, but it is not unlikely that many of these women worked as a
servant in the period just before marriage.
In conjunction with the above conclusions we have also demonstrated that among the
extended households there were very few multi-generational households, showing that it was
not common practice to take care of parents at the own home. Again this confirms earlier
suppositions, made on albeit rather scanty data. Our analysis of the relationship between
poverty and having non-kin in the household furthermore demonstrated that this phenomenon
of the commercial household was not typical for the higher classes of society. Even within the
bottom 20 percent of households, we find that one out of every ten of these households had non-
kin living in (in comparison with one out of every four among non-poor households).
Unfortunately we do not have more information about the income levels of the non-poor
households to search for a more explicit correlation between income and the affordability of
non-kin in the household.
Elsewhere,53 we have stressed that the increasing dominance of the nuclear family also
brought new opportunities, the possibility to save or invest, and – together with a growing
capital and labor market – also increased the agency of the elderly in arranging their own care,
in many cases within their original home. This article demonstrates that the nuclear household
led to an increased ‘commercialization’ of the household in terms of both providing care, via
living-in lodgers and students who paid for their stay and receiving care, through the presence of
living-in servants. This commercialization was much more evident in Leiden than in the
surrounding areas. Considering the number of households that engaged servants and had no
children, we might expect that the elderly could indeed have had the means to solve their
hardship by incorporating non-kin.
24

25
Notes
26

Table 1. Categories by Peter Laslett
Solitaries Households consisting of one person.No-family households Households consisting of two or more related or non-related
persons living together, without a couple being present.Simple family households Households consisting of a couple, or the remainder of a couple (a
widow or widower), with or without their (unmarried) children.Extended family households
Households with a family member (not belonging to the nuclear family) living in, but without his or her spouse or children
Multiple family households Households with a secondary couple living in (i.e. when a spouse of a child is living in, or the spouse of a parent).
Indeterminate Households where kin linkages are insufficient for classification in any category above.
27

Table 2: Terminology used in this paper to classify households according to their compositionaa
Type no.
Household form Household composition Core and/or extension
1. Solitaries Only the head of household living in the household
Nuclear CoreThe household core consists of a head of household, with or without a spouse and with or without children
2. Conjugal HH A head of household with a spouse, no children present
3a. Nuclear HH A head of household, with a spouse and children present
3b. Nuclear HH A head of household, without a spouse, but with children present
4a. Joint (extended sideways) HH
A nuclear core with an extension sideways: siblings living together without spouses or children
4b. Joint (extended sideways) HH
A nuclear core with an extension sideways: siblings living together with a spouse and/or children
Kin extendedA nuclear core with kin living in, whether sideways, parental, downward, upward or in any other way related to one of the members in the nuclear core
5. Extended HH Any of the combinations mentioned under 5a-5d
5a. Extended (parental) HH A nuclear core and a parent or several parents living in
5b. Extended (downward) HH
A nuclear core and a downward extension (grandchildren, great- grandchildren)
5c. Extended (upward) HH A nuclear core with an upward extension (no parents, though they are also upward extensions, here we only classify grandparents and great-grandparents)
5d. Extended (other-kin) HH
A nuclear core with any relative (that does not fit the parental, downward, upward category) living in
4.+5. Joint + Extended HH Any combination of 4 and 5a-5d
6a. Non-Kin Extended HH A nuclear core with living-in servants
Non-kin extendedA nuclear core extended by non-kin living in the household
6b. Non-Kin Extended HH A nuclear core with living-in inmates
6c. Non-Kin Extended HH A nuclear core with living-in servants and inmates
4.+6. Joint + Non-kin HH A combination of 4 and 6 Double extended
a
28

A nuclear core with both kin as well as non-kin living in the household
5.+6. Extended + Non-kin HH A combination of 5a-5d and 64.+5.+6. Joint + Extended + Non-
kin HHA combination of 4, 5a-5d and 6
a The following example, taken from our Leiden data, serves to demonstrate the classification:
Original text Labels Classification
Huish#: 202 Straat: Corte
Raemsteech, N
1 m: Malliaert Brievaert, cammer
2 v: Lijsbeth Joosten
3 k: Anna
4 k: Jan
alhier slapen ende logeren
5 ap: Gillis Duramel, uyt Artois,
cammer; weeten
niet beter off blijven metter woon
6 ap: Franchoys Gordain; van
Atrecht, cammer
1 m = Ego, male, married
2 v = W (Wife), female, married
3 k = D (Daughter), female
4 k = S (Son), male
5 ap = Lodger, male
6 ap = Lodger, male
Nuclear core: M-1-2
(Male headed household-
spouse-two children)
Extension: Non-Kin
Therefore classifies as:
‘Non-kin extended HH’
29

Table 3: Distribution of types of households according to categories previously described
1.Solitaries
2. Conjugal HH
3a. Nuclear HH, with couple
3b.Nuclear HH,no couple
4a.Joint HH, but only with siblings
Total nr of HH without extension
Ambachten N 937 781 3,886 834 66 6,504
% 11.7 9.8 48.6 10.4 0.8 81.3
Leiden N 285 441 1578 345 41 2,690
% 6.7 10.3 37.0 8.1 1.0 63.1
Total N 1,222 1,222 5,464 1,179 107 9,194
% 10.0 10.0 44.6 9.6 0.8 75.0
30

Table 4: Households extended by kin
4b.Joint*
5a.Parental
5bDownward
5c.Upward**
5d.Other
Kin extended on total # of
HHAmbachten N 35 39 50 10 18 152
% 0.4 0.5 0.6 0.1 0.2 1.8
Leiden N 30 25 24 4 21 104
% 0.7 0.6 0.6 0.1 0.5 2.5
Total N 65 64 74 14 39 256
% 0.5 0.5 0.6 0.1 0.3 2.0
*Joint in another way than only siblings, for instance a couple with living-in sister of Ego. **Upward extended other than with parents, thus grandparents/great-grandparents***Double extended means extended by kin as well as non-kin.
31

Table 5: Households with non-kin extensions (Double Extended HH excluded here)
% 6a.Servants
6b.Inmates
6c.S. & I.
Total extended with Non-Kin
Ambachten N 958 256 46 1,260
% 12.0 3.2 0.6 15.8Leiden N 396 819 142 1,357
% 9.3 19.2 3.3 31.8
Total N 1,354 1,075 188 2,617
% 11.0 8.8 1.5 21.3
32

Table 6: Overview of upward and downward family extensions, presenting the different generations, per householda
Nuclear core without kin-extensions
Nuclear core with upward and downward kin-extensions
1 G. 2G.* 2G.** 3G.* 3G.** 4G.
A.
not e
xten
ded
B.
Ext.
wit
h P
C.
Ext.
wit
h C
D.
Ext.
wit
h G
P
E.Ex
t. w
ith
GC
F.
Ext.
wit
h P
and
C
G.
Ext.
wit
h C
and
GC
H. E
xt.
wit
h G
C an
d G
GC
I. Ex
t. w
ith
P a
nd
GC
J. E
xt. w
ith
GP
and
C
K. E
xt. w
ith
P ,
C an
d G
C
Ambachten N 2,137
18 5,719
1 16 47 44 2 0 10 2
Ambachten % 27 0 72 0 0 1 1 0 0 0 0Leiden N 1,29
612 2,86
70 16 41 23 0 1 8 0
Leiden % 30 0 67 0 0 1 1 0 0 0 0Totaal N 3,43
330 8,58
61 32 88 67 2 1 18 2
Totaal % 28 0 70 0 0 1 1 0 0 0 0P= Parent(s), C= Child(ren), GP= Grandparent(s), GC= Grandchild(ren), GGC= Great-
grandchild(ren); G.=Generation; *Consecutive generations **Non consecutive generations.
a Only upward and downward (kin-)extensions are included here. Since we only included
upward/downward related kin in this analysis, the percentages in this table differ from the
percentages used to analyse household formation (Tables 2a, 2b and 2c). Since we are talking
about generations, we cannot compare those figures to the figures on household composition.
a
33

Table 7: Non-kin divided into different categories
Leiden (4,264 hh, - 18,918 individuals)
(avg. HH size: 4.4 members)
Ambachten (7,998 hh – 36,127 individuals)
(avg. HH size: 4.5 members)Non-kin # of HH
contain-ing at
least one of the below
% # of indivi-
duals per category
% # of HH contain-
ing at least one
of the below
% # of indivi-duals per
category
%
Servants (L)
603 14.1 794 4.2 1074 13.4 1,497 4.1
Lodgers 373 8.7 615 3.3 26 0.3 45 0.1
Living-in 498 11.7 753 4.0 29 0.4 34 0.1
Adopted childa
54 1.3 66 0.3 175 2.2 199 0.6
Other 19 0.4 25 0.1 85 1.1 108 0.3
Student 176 4.1 396 2.1 0 0.0 0 0.0
Total b (cf note 48)
2,649 14 (cf note 48) (cf note 48)
1,883 5.0
a The label adopted child does not actually mean adopted in the contemporary sense of the word,
i.e. any legalized adoption. Here we include all the children that are incorporated temporarily or
for a longer time in a household of non-relatives, such as ‘cost-kinderen’ [literally translated:
lodging children’] and orphans. The number in the Ambachten is rather high, the figure includes
a school (with children living in and paying (‘in de cost’), and an orphanage. Please note that
these numbers do not correspond with the total household number with non-kin in the previous
tables, as we now look at the households which contained any type of living-in non-kin. Some
households are thus counted double when they had, for example, a servant and a lodger in the
household.
b Here we cannot merely add the numbers mentioned above, since some HH have both students
and servants living in. Therefore, see Table 5 for the overview totals of HH containing non-kin.
34

35

Table 8: Percentages of living-in kin, servants and inmates on the Polish-Lithuanian Commonwealth in the eighteenth century.
Location % hh with kin
% hh with
servants
% hh withinmates/lodgersa
West 20.8 39.4 24.4Middle
East40.5 12.2 7.9
East 52.0 2.1 1.2
Table from Mikolay Szoltysek, “Rethinking Eastern Europe,” 400.a Szoltysek treats inmates and lodgers separately. Laslett, however, included lodgers with the inmates, as we do.
36

Table 9: Percentage of poor and non-poor households on total number of households per category
Poor (N) % of Poor HH in each category
Non Poor (N)
% of Non Poor HH in each category
Total Nr. Of HH
Total % per category
Without extension (types 1 to 4a)*
2,117 88.4 7,077 71.7 9,194 75.0
With kin extension (types 4b to 5)
35 1.5 221 2.2 256 2.1
With non-kin extension (type 6)
241 10.1 2,375 24.1 2,616 21.3
Double extended 3 0.1 193 2.0 196 1.6
Total 2,396 100.0 9,866 100.0 12,262 100.0
37

Table 10. Poor households subdivided per type of household (6a,6b,6c)*
Poor HH (244 total) , Non-Kin extended
Non-poor HH (2568 total), Non-Kin extended
Non
-kin
Serv
ants
Bot
h se
rvan
ts a
nd
inm
ates
Tot
al
serv
ants
Bot
h se
rvan
ts a
nd
inm
ates
Tot
al
Ambachten N 46 3 62 111 912 43 194 1,149% 41 3 56 100 79 4 17 100
Leiden N 4 2 124 130 392 140 695 1,227% 3 2 95 100 32 11 57 100
Total N 50 5 186 241 1304 183 889 2,376% 21 2 77 100 55 8 37 100
*Note that we only discuss non-kin extended households, we exclude the non-kin in double extended households.
38
Table 11: The distribution of non-kin over the households related to the number of children present within the HH
# of Children
0 1 2 3 4 5 6 7 8 9 10
Single F.Total N
1,108 319 271 209 149 98 50 29 5 5 0
Single F. extended by NK
217 72 56 35 25 9 3 4 1 1 0
Idem % 20 23 21 17 17 9 6 14 20 20 0Single MalesTotal N
608 94 96 84 56 35 15 17 3 7 3
Single Males extended by NK
136 21 28 21 20 10 6 3 2 0 0
Idem % 22 22 29 25 36 29 40 18 67 0 0CouplesTotal N
1,783 1,444
1,473 1,367
1,061 830 504 287 141 59 32
Couples extended by NK
513 366 401 328 212 163 82 43 22 3 4
Idem % 29 25 27 24 20 20 16 15 16 5 13F-0 = Single female head of household, M-0 = Single male head of household, NK = Non-Kin.Since households with more than 10 children were no longer extended by kin, we excluded them here, since the percentage of non-kin extended households adds up to 0 percent. 15 households had 11 children, 2 households had 12 children, 1 had 15 children, and 1 household had 17 children.
39

Table 12: Distribution of servants and inmates per sex and location.
Male servants N
Female servants N
Total servants
% of females among servants
Male inmates N
Female inmates N
Total inmates
% of females among inmates
Ambachten
626 845 1,471 57 199 240 439 55
Leiden 177 617 794 78 1,238 629 1,867 34Total 803 1,462 2,265 65 1,437 869 2,306 38
Note: for some of the inmates the sex was unknown; these have not been included in this table.
40

Table 13: Roles of male and female household members
HHH Spouse of HHH
Child Living in as Kin
Living in asNon-Kin
Total
Ambachten M N 6,594 2 10,177 142 825 17,740% 37 0 57 1 5 100
Ambachten F N 1,404 5862 9,741 268 1,085 18,360% 8 32 53 1 6 100
Tot. Ambachten N 7,998 5864 19,918 410 1,910 36,100% 22 16 55 1 5 100
Leiden M N 3,421 2 4,090 97 1,415 9,024% 38 0 45 1 16 100
Leiden F N 843 3134 4,441 229 1,246 9,893% 9 32 45 2 13 100
Total Leiden N 4,264 3136 8,531 326 2,661 18,917% 23 17 45 2 14 100
HHH = head of household
41

Figure 1: Different ways to classify households according to composition
Note: Ego is the head of household as mentioned in the sources.
42

Figure 2: Figurative overview of types of households consisting of only the nuclear core
Note: Figures in grey refer to absent members of the household, figures in black are present. Gender is arbitrary, as is the number of children (as well as stepchildren) within a household. Therefore 1. could also consist of just a male (M-0-0), and 3b. could also consist of a male head of household (M-0-3). In household 4a. the eldest sibling is the head of household. This might similarly be a male (M-0-0). This household, a joint household, can only be included if siblings are not (yet) married. If they are married, the household becomes truly joint. We added this particular case since the data mentioned such ‘orphaned’ households, referring to a dead parent as a household head.
43

Figure 3. Total percentages of householdsthat are not extended, kin extended, non-kin extended, and double extended
44

Figure 4: Geographical overview of servants/lodgers; comparison of figures in different early Dutch sources
Original map: http://www.livius.org/a/1/cornelis_de_bruijn/debruijn_holland_map.gifFigures based on van der Woude (who combines his own data with data of Struyk, Roessingh, Faber, and Slicher von Bath).a
a Van der Woude, “Variations,” 306ff.
45

1 Corresponding author: [email protected]; The research for this article was made possible by funding from the
European Research Council under the European Community's Seventh Framework Programme (FP7/2007-
2013)/ERC grant agreement n° 240928) as part of the project '"United we stand". The dynamics and
consequences of institutions for collective action in pre-industrial Europe'. See also www.collective-action.info
2 John Hajnal, “European marriage patterns in perspective,” in Population in History, eds. D.V. Glass and D. E. C.
Eversley(1965), 101–143; Christer Lundh, ”Households and families in pre-industrial Sweden,” Continuity and
Change 10 (1995): 33-68.
3 Alan Macfarlane, “Demographic structures and cultural regions in in Europe,” Cambridge Anthropology 6
(1981): 3; D. S. Reher, “Family Ties in Western Europe: Persistent Contrasts,” Population and Development
Review, 24 (1998): 203-234.
4W. Gove, J. Grimm, S. C. Motz, and J. Thompson, “The family life cycle: Internal dynamics and social
consequences,” Sociology & Social Research 57 (1973): 182-195; V. K. Oppenheimer, “The life-cycle squeeze: The
interaction of men’s occupational and family life cycles,” Demography 11 (1974): 227-245; R. A. Van Dusen and
E. B. Sheldon, “The Changing Status of American Women: A Life Cycle Perspective,” American Psychologist 31
(1976): 106-116; P. Laslett, “Family, kinship and collectivity as systems of support in pre-industrial Europe: a
consideration of the 'nuclear-hardship' hypothesis,” Continuity and Change 3 (1988): 169; A. Bouman, C.J.
Zuijderduijn, and T. De Moor, “From hardship to benefit: A critical review of the nuclear hardship theory in
relation to the emergence of the European Marriage Pattern” CGEH Working Paper Series, no. 28 ( March 2012),
available at http://www.cgeh.nl/sites/default/files/WorkingPapers/CGEH%20WP%20No28%20Bouman%20et
%20al.pdf
5 Laslett, “Family, kinship and collectivity,”155.
6 Peter Laslett, The World We Have Lost (New York, 1965); D. S. Reher, “Family Ties in Western Europe:
Persistent Contrasts,” Population and Development Review 24 (1998): 203-234; Pier Paolo Viazzo, “‘What’s so
special about the Mediterranean?‘ Thirty years of research on household and family in Italy,” Continuity and
Change 18 (2003): 111-137.
7 E.g. Alison Light, Mrs. Woolf and the Servants: An Intimate History of Domestic Life in Bloomsbury and The
servant’s hand: English fiction from below (New York, 2007).
8 For a discussion of the term Nuclear Hardship seeBouman, Zuijderduijn, and De Moor, “From hardship to
benefit”.
9 Lutz Berkner points at the fact that ‘the family’ in Germany not only included relatives but also servants ( Lutz
K. Berkner, “The Stem Family and the Developmental Cycle of the Peasant Household,” American Historical

Review 77 (1972): 398-418).
10 Bouman, Zuijderduijn, and De Moor, “From hardship to benefit”.
11 Tamara Hareven, Family time and industrial time: the relationship between the family and work in a New
England industrial community (New York, 1981), 449.
12 ‘Above all, the preindustrial household was an economic unit and its need for labor determined how many
people lived together under one roof. Families often brought in older children and young adults as servants and
apprentices, and send out their own children to work in other households if they were not needed at home’
(Arlene Skolnick, ”Changes of Heart, family dynamics in historical perspective,” in Family, Self, and Society,
Toward A New Agenda for Family Research, ed. Philip A. Cowan et al(Hillsdale, NJ, 1992), 48.
13 David Kertzer, “Household History and Sociological Theory," Annual Review of Sociology 17 (1991): 155-179;
Daniel Scott Smith, ”American family and demographic patterns and the Northwestern European model,”
Continuity and change 8 (1993): 389-415; D. S. Smith, "The Curious History of Theorizing about the History of the
Western Nuclear Family," Social Science History 17 (1993): 325-353.
14 We are not arguing, however, that the commercial household was the only solution to hardship at old age. As
we have demonstrated (Bouman, Zuijderduijn, and De Moor, “From hardship to benefit”), there were much more
possibilities for the elderly, like ‘proveniershuizen’ (elderly homes). Taking non-kin in was but one of the options.
15J. Smith, ”Widowhood and ageing in traditional English society,” Ageing and Society 4 (1984): 429-449; R. Smith,
“Some issues concerning families and their property in rural England 1250-1800,” in Land, kinship and life-cycle,
ed. R. Smith (Cambridge, UK, 1984), 1-86; Laslett, “Family, kinship and collectivity”.
16 L. Di Matteo, “Wealth accumulation and the life-cycle in economic history: implications of alternative
approaches to data,” Explorations in Economic History 35 (1998): 296-324.
17 Already in 1967, Donald Bender described similar concerns regarding the anthropological view of households
that linked residence directly to kinship based on the work of for instance Fischer and Bohannan (Donald R.
Bender, ”A refinement of the concept of household: Families, co-residence, and domestic functions,” American
Anthropologist 69 (1967): 497; the references of Bender refer to John L. Fischer, “The dassification of residence
in censuses,“ American Anthropologist 60 (1958): 508-517, and Paul Bohannan, Social Anthropology (New York,
1963)).
18 Laslett argues that servants hardly affect the final structure of households and therefore his classifications are
based solely on kinship (Peter Laslett, “Introduction, the history of the family,”in Household and Family in Past
Time: Comparative Studies in the Size and Structure of the Domestic Group Over the Last Three Centuries in
England, France, Serbia, Japan and Colonial: North America, eds. Peter Laslett and Richard Wall, (Cambridge

University Press, 1978), 29). In her critique of Miranda Chayton’s article “Household and Kinship: Ryton in the
Late 16th and Early 17th Centuries” (History Workshop 10 (1980): 25-60), Olivia Harris criticizes not only
Chayton, but also Laslett’s ideas on the inclusion or exclusion of servants in his classification of households.
Harris states that the presence of servants within a household ‘necessarily affect[s] the degree of cooperation in
different forms of labour between kin and neighbours’, which would especially affect the lives of female
household members and their domestic tasks. When children, furthermore, are likely to move out of the
household as teenagers, Harris questions the idea of the ‘nuclear family household’ and proposes the term
‘truncated nuclear family’. Such households might only include a couple and the younger children, as well as
servants (Olivia Harris, ”Households and Their Boundaries,” History Workshop 13 (1982):148-149).
19 ‘All MHS [Mean Household Size] ratios approximately correspond to uncorrected maximal mean household
size […](ratio 3 of Table 4.2 below) except in the case of Belgrade where it corresponds to ratio 5 […]. This ratio
excludes both individual inmates and inmate households’ (Laslett, “Introduction,” 76, table 1.6). In another
article on household size in England he also excludes inmates: ‘individual lodgers’ which he classifies as ‘persons
outside households’. See Peter Laslett, “The household in England over three centuries,” Population Studies 23
(1969), 207, Table 2.
20 Parish records and genealogies cannot reveal what households looked like in the past, since they do not
mention living-in non-kin. And whereas there might be ego-documents that do so (such as wills, diaries, or court
records), the use of such documents for this purpose is time consuming and only provides small samples (cf. Lutz
Berkner,“The Use and Misuse of Census Data for the Historical Analysis of Family Structure,” The Journal of
Interdisciplinary History 5 (1975): 721-738.
21 The sources provide us with a cross-section of a whole population in a certain area and time. However, we
have to keep in mind that the data might have been meddled with to prevent taxation. The fact that names had
not yet been standardized poses another difficulty. One and the same person might have been registered in
different registrations under quite different names, making it hard to trace them in different documents that
might validate the census data. Dirck Adriaenszn, for instance, might be registered as Dirk/Dirc/Dirck,
Adriaensz/Arentszn/Adriaens and Arentsz. The fact that the data have been collected by groups of men, who
were themselves inhabitants of the villages or towns they registered, makes it likely they knew at least part of
the households personally. In the case of Leiden, they furthermore seem to have followed a similar route tax
officers before them had taken, which gave them a point of reference. All in all, the amount of detail provided
gives us confidence in the accuracy of the data.

22 A very similar format of inquiry seems to have been used over and over again in subsequent centuries in
different regions of the Netherlands. In Zeeland we find ‘gemaallijsten’ from 1687-88, which are in every aspect
comparable to the Hoofdgeld-sources from the Zuiderkwartier. Similarly, such sources are available for the
whole province of Overijssel, dating from August 1748, and are referred to as ‘personele quotisatie’ or ‘hoofdelijke
omslag’. Although all those sources should definitely be considered in their context (they contain similar
information, on different periods and different regions, with a dissimilar historical context and dissimilar modes
of production), the format of those taxations is very consistent. All those ‘poll tax sources’ dating from 1622 until
the nineteenth century give us similar data, including time and region of the census, the head of household, his or
her marital status, all persons related to the head of household, as well as living-in non-kin. Sometimes it is
added that a household is not able to pay the tax.
23 Holland and West Friesland were divided in a northern and a southern region, respectively called
Noorderkwartier (with the cities Alkmaar, Hoorn, Enkhuizen, Edam, Monnikendam, Medemblik, and Purmerend)
and Zuiderkwartier (with the cities Dordrecht, Haarlem, Delft, Leiden, Amsterdam, Gouda, Rotterdam, Gorichem,
Schiedam, Schoonhoven, and Brielle), with a total of eighteen cities between them. Although we find several
references to those records, ost of the records from these cities have however been lost (cf. J. G. van Dillen,
"Summiere staat van de in 1622 in de Provincie Holland gehouden volkstelling," Economisch-Historisch Jaarboek
21 (1940): 167-189; A. M. van der Woude, “Variations in the size and structure of the household in the United
Provinces of the Netherlands in the seventeenth and eighteenth centuries,” in Household and Family in Past
Times, ed. Peter Laslett (Cambridge University Press, 1972), 299-318. Van der Woude describes how the original
records were collected by the Dutch demographer Nicolas Struyck, of whom all original data are lost (cf. Nicolas
Struyck, Beschrijving der Staartsterren en nader ontdekkingen omtrent den staat van het menselijk geslagt
(Amsterdam, 1753).
24 Literature about European households generally assumes that there is just one household head in charge, even
if there is a couple present. The poll tax sources in the Netherlands confirm this idea: only the name of the first
individual in the tax registers is in most cases mentioned entirely. And only in the case of widowhood is marital
state added, while for married couples the spouse is mentioned secondly, sometimes even without their proper
name (‘the spouse of…’). John Hajnal considers the fact that married males are appointed household heads as a
specific rule of normal household formation in Northwest-European households; ‘After marriage a couple are in
charge of their household (the husband is head of household)’ (John Hajnal, ”Two Kinds of Preindustrial
Household Formation.” Population and Development Review 8 (1982): 452.
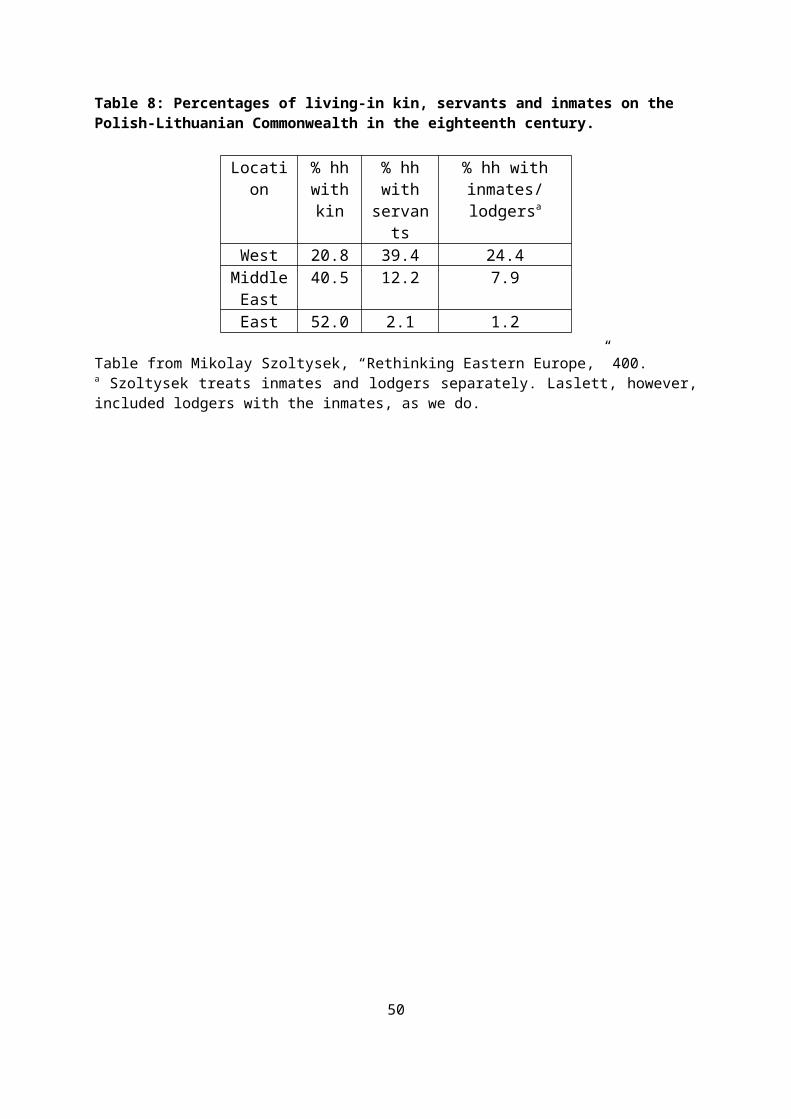
25 Whereas the different units within a dwelling might have been called a/b/c, we have not automatically
assumed household b to be living in with household a. We have only considered people to be living in if this can
be inferred from the source itself. However, we see an overlap that might implicate that the b/c/etc. units lived
in with households mentioned as a. This sometimes becomes clear if households could not have been completely
independent: their dwelling might be referred to as a room, a cellar, an attic, or even the kitchen itself.
26 To construct our database we have gratefully used the transcriptions provided by Hogenda, the Hollandse
Genealogische Databank, and more specifically the sources collected and transcribed by F.J.A.M van der Helm, as
well as their transcriptions of the Hoofdgeld data of Leiden.
27 Aarlanderveen, Achtienhoven, Benthoorn/Hoogeveen, Hoogmade, Vrije Bouchorst, Vrijenhoeff, Alphen,
Berkel en Rodenrijs, Stompwijk/Leidschendam/Wilsveen, Hazerswoude, beider Katwijken en ’t Sant, Leimuiden,
Rijnsaterwoude, Ter Aar, Voorschoten, Alkemade, Nieuwkoop, Esselijkerwoude, Lisse, Wassenaar, Zoeterwoude,
Calslagen, Koudekerk a/d Rijn, Cuijdelstaert, Nieuweveen/Uitterbuurt, Noorden, Noordwijkerhout, Oegstgeest,
Oudshoorn/Gnephoek, Swammerdam, Voorhout, Vriesecoop, Warmond, Zevenhoven/Noorden.
28 The source of Leiden might not be entirely complete, as is indicated by the people that transcribed it. This is
also clear from the list of students, who were accounted for in a separate registration or ‘bon’ that registered the
different areas of Leiden that they lived in. From this source it is clear that Noort Rapenburch, Burchstreng,
Overmaren Lantzijde, Hogemorsch, and Sevenhuysen might be missing. The Hoofdgeld sources from the
Ambachten have been added as far as their transcriptions were available and usable. Therefore the Hoofdgeld
sources from the Ambachten are by no means exhaustive, and await historians to take up the strenuous task of
making them as complete as possible. Since the sources of the Noorderkwartier have been lost, this is worth the
effort.
29 In the same period we find the term ‘haardstedengeld’, referring to a tax on fireplaces or chimneys. Although in
Drenthe this tax was eventually executed by counting horses, the original intention was to tax households not by
the roof they lived under, but by the number of fireplaces. Anthropological literature on nomads in Africa also
refers to the household with the term ‘hearthhold’, which indicates a group of people that shares food and not
necessarily a roof (cf. Mirjam de Bruijn, ”The Hearthhold in Pastoral Fulbe Society, Central Mali: Social Relations,
Milk and Drought,” Africa 67 (1997): 625-651.
30 Our database contains, apart from the numbers per source, household, and person, a number of useful
elements: the relationship between the head of household and the household member, described with the
anthropological notational system, his or her gender and his or her marital status (if known). For the purpose of
the research, additional labels have been created for the non-kin living in, depending on the categories

mentioned in the original data: servants, for instance, have been labeled ‘L’, lodgers ‘Lodger’, adopted children
‘A’, students ‘Student’, non-kin referred to as living in as ‘Living-in’, and unspecified non-kin living in ‘other’.
31 Cf. Laslett, “Introduction,” 88.
32 It is not always indicated if persons are single or widowed. Laslett assumes all heads of household with
children but without a spouse to be widowed, and classifies them as such. We need to ask ourselves if the label
single or widow(er) attributes to our understanding of household formation, if some labels are lacking and
attributed by interpretation. Therefore we decided to label them only as far as they are labelled in the original
source. Therefore our classification does not distinguish between singles and widow(ers). Cf. E. A. Hammel and P.
Laslett, “Comparing Household Structure over Time and between Cultures,” Comparative Studies in Society and
History 16 (1974): 73-109.
33 E.g. F-0-4 indicating a single female head of household, without a spouse but with four children, M-1-2 a couple
with two children, and M-0-0, a single male head of household without children. Both M and F with a spouse (M-
1-0 and F-1-0) thus depict couples.
34 The labels we have used should be followed by HH, indicating household composition (except in the case of
solitaries, since solitaries are in themselves solitary, not belonging to a family or a household). The terms
conjugal (a couple), nuclear (a couple, or a widow[er] with children), joint (siblings living together), and
extended (other family members that do not belong to the ‘nuclear core’ living in) can also be used when
referring to families. When we add HH, however, we indicate household composition. If we refer to families, we
should always add the word family (conjugal family, nuclear family, joint family, extended family) to avoid
confusion.
35 The category downward is split into grandchildren and great-grandchildren. However, the number of
necessary generations will differ per dataset: we had only two families with living-in great-grandchildren, and no
families with living-in great-grandparents.
36 Type E households would usually be considered ‘Joint Family Households’, but if we look at them as
households in which the parents died before all siblings were at the age to move out or marry, the household
might also be classified as a ‘Nuclear Household’. If one of the siblings would have married, then we would see
the household as a ‘Joint Household’. Robert Wheaton, who writes about joint family households, emphasizes the
importance of considering households as constantly changing and fluid: “For all their precision, the statistics on
mean household size and distribution of household types are only the beginning of an understanding of
household structures, an understanding which must recognize the fluidity of structure, the impermanence of
boundaries, and the existence of kin relations which continue beyond it” (Robert Wheaton, “Family and Kinship

in Western Europe: The problem of the Joint Family Household,”. Journal of Interdisciplinary History, 4: 601-628).
37 Van der Woude gives an overview of different works on Dutch demography (van der Woude, “Variations”).
38 Studies from England and Flanders suggest that servants might actually have very often been relatives. But
since family relationships are so securely mentioned in our sources, and servants often came from other villages,
we assume that in our case they were not per definition related (Di Cooper Di and Moira Donald, “Households
and ‘hidden’ kin in early-nineteenth-century England: four case studies in suburban Exeter, 1821-1861,”
Continuity and Change 10 (1995): 257-278; J. De Groot, “Strangers at home? Towards a re-assessment of
domestic servanthood in fifteenth-century Ghent,” (paper presented at the N.W. Posthumus Conference 2011,
University of Antwerp–Centre for Urban History, May 12-13, 2011; available online at:
http://webhost.ua.ac.be/nwpc2011/papers/RP3_DeGroot.pdf).
39 Van der Woude (“Variations”, 307); the figures van der Woude mentions are based on an article by Roessingh
(cf. H. K. Roessingh, “Beroep en bedrijf op de Veluwe in het midden van de 18e eeuw,” A.A.G. Bijdragen 13 (1965):
239-249).,
40 Van der Woude (“Variations”, 308). The figures van der Woude mentions are based on the data of Struyk’s
Beschryving der Staartsterren.
41 We counted Non-Kin extended and Double extended HH.
42P. P. Viazzo, “Family structures and the early phase in the individual life cycle. A southern European
perspective,” in Poor women and children in the European Past, eds. J. Henderson and R. Wall (London, 1994), 31-
50, citing (a.o.) D. I. Kertzer and C. Brettell,”Advances in Italian and Iberian family history,” Journal of Family
History 12 (1987): 87-120.
43 In which case we could – in the case those children are unmarried yet adult – not strictly speak of nuclear
hardship. It is, however, unlikely that adult children would not move out to find jobs of their own, and live in
households of their own.
44 Jona Schellekens, writing about eighteenth-century Brabant (situated south of Holland), describes the sexual
freedom of servants, which he supposes is not much different in other parts of Northwest- Europe. Servants
would be able to meet privately and engage in actual intercourse. The number of extra-marital pregnancies was
low, however, so some kind of birth control must have been practiced. His research reveals that 30% of the
brides in his villages must have been pregnant at marriage (Jona Schellekens, “Determinants of marriage
patterns among farmers and agricultural laborers in two eighteenth-century Dutch villages,” Journal of Family
History 16 (1991): 151.

45 Ariadne Schmidt, “Survival strategies of widows and their families in early modern Holland, c. 1580–1750,”
The History of the Family 12 (2007): 268-281.
46 The term ‘inmates’ in this case has nothing to do with people living in prisons. See for references to inmates
and household composition a.o. Sheilagh Ogilvie and Markus Cerman, “The Bohemian Census of 1651 and the
position of inmates,”, Histoire Sociale 28 (1995): 333-346; M. Szoltysek, “Rethinking Eastern Europe: household
formation patterns in the Polish-Lithuanian Commonwealth and European family systems,” Continuity and
Change 23 (2008): 389-427.
47 Da Molin gives us overviews of the numbers of servants in different southern Italian regions from the
seventeenth to the nineteenth centuries. She distinguishes three different regions: regions without living-in
servants, regions in which the number of households with servants ranged from 0.5 to 5.0%, and finally a region
(or rather some villages) in which 5.0 to 10.0% of the households had living-in servants, the middle category
being the most substantial. In another survey of six towns she looked at the distribution of servants categorized
according to the occupation of the employers. Of the 378 servants, 199 were employed by nobles (thus 52.7% of
all servants were employed by nobles), 55 (14.6%) by professionals, and 34 (9.0%) by the clergy. Agricultural
employers engaged but 14 servants (3.6%) (Giovanna Da Molin, “Family Forms and Domestic Service in
Southern Italy from the Seventeenth to the Nineteenth Centuries,” Journal of Family History 15 (1990): 517).
Italian society attached much more value to the concept of honor, which made it difficult for women to work in
households they were not related to. We see that only women without other options (poor widows with
children) became servants.
48 Christer Lundh describes similar processes in different parts of Sweden in the eighteenth century; whereas in
eastern Sweden extended families are prevalent, households in the western regions contained more servants
(Lundh, ” Households,” 43.
49 In his article, however, Szoltysek uses his cases to demonstrate there is no such thing as a rigid division in
household forms per region. By demonstrating that the different parts of the PLC had different household forms,
he contradicts himself. For although it seems that he finds three different forms in one region, the region itself is
so large that Hajnal’s line already divides the territory in two.
50 Ogilvie and Cerman, “The Bohemian Census”.
51 Ogilvie and Cerman, “The Bohemian Census,” 355.
52 Our figures are not comparable with the figures that Ariadne Schmidt presents, although she works with the
same original data on Leiden. For one, she presents a much larger set of households. Secondly, she classifies the
households differently, and does not mention whether or not non-kin is included in her classification. Thirdly,

her categories ‘children’ and ‘relatives’ are not clearly defined. We are not saying her figures are not correct, just
that the categories she uses are not defined clear enough to make comparisons, even though the labels seem to
suggest so.
Leiden # of hh Poor hh %
F Single/Wid no kids 1,216 315 25.9
M Single/Wid no kids 485 47 9.7
F Single/Wid kids 1,292 448 34.7
M Single/Wid kids 288 28 9.7
Couple no kids 2,689 221 8.2
Couple with kids 3,718 525 14.1
Source: Ariadne Schmidt, “Survival strategies of widows and their families in early modern Holland, c. 1580–
1750,” History of the Family 12 (2007): 270. Schellekens furthermore states that we do not know the exact
criteria used for exempting households from paying the poll tax (Schellekens, “Poverty and family size,” 210.
53 Bouman, Zuijderduijn, and De Moor, “From hardship to benefit”.