Embed Size (px)
Citation preview
Surprise Medical Billing in New Mexico
Results from the 2017 New Mexico Office of Superintendent of Insurance &
UNM RWJF Center for Health Policy Surprise Medical Billing Study
December 20, 2017
Barbara Gomez-Aguinaga
Gabriel R. Sanchez
Eric Griego
Sam Howarth
Robert Wood Johnson Foundation Center for Health Policy
University of New Mexico
A Publication of the RWJF Center for Health Policy
Preparation of this Research Brief was supported, in part, by a grant to the University of New Mexico from the Robert Wood Johnson Foundation. The views expressed in this report are those of the authors and do not necessarily represent those of the RWJF Center for Health Policy, the University of New Mexico, collaborating organizations, or funders. Editor-in-Chief, Gabriel R. Sanchez, Ph.D. Phone: 505-277-0130 Email [email protected] Location 1909 Las Lomas Road, Albuquerque 87131 Copyright @ University of New Mexico – December 2017.
OSI/RWJF: NM Surprise Medical Billing Study
2
1. Introduction In August through September 2017, the UNM RWJF Center for Health Policy surveyed a
total of 554 privately insured adults in New Mexico on behalf of the New Mexico Office
of Superintendent of Insurance (OSI). Participation in the online survey focused on
consumer experiences and was restricted to New Mexico residents who have privately
purchased health insurance through the marketplace or an employer. More specifically, the
survey assessed how frequently consumers received medical bills that they were not
expecting to have to pay.
This phenomenon, known as surprise billing, has been an area of increased concern across
the nation. In fact, recent articles published in both Health Affairs and the New England
Journal of Medicine have documented the growing national trend driven mainly by patients
not being able to avoid seeing a provider outside of their health plan’s contracted network.1
This research has suggested that surprise or unexpected billing tends to be higher among
consumers who have experienced a medical emergency or had major surgery.
Consequently, we explore the prevalence of surprise billing among these sub-groups of
New Mexico’s privately insured population. We also examine whether surprise billing
varies due to other demographic factors through both descriptive statistics and logistic
regression analyses.
The survey also includes information on whether or not privately insured New Mexicans
took any action when they experienced a surprise medical bill, and if so, whether they were
satisfied with the response they received. The survey queried respondents about their
satisfaction with their health insurance plan through a self-reported grade and their overall
experiences with their health care plan. The survey was designed to allow for comparisons
between New Mexico healthcare consumers and a national estimate from a 2015 study
conducted by the Consumer Report National Research Center.2 The results of the New
Mexico survey are timely and provide stakeholders with valuable information that can be
utilized to improve the experiences New Mexicans have with their privately purchased
health plan.
1 http://healthaffairs.org/blog/2017/02/01/stopping-surprise-medical-bills-federal-action-is-
needed/ 2 http://consumersunion.org/research/surprise-bills-survey/
OSI/RWJF: NM Surprise Medical Billing Study
3
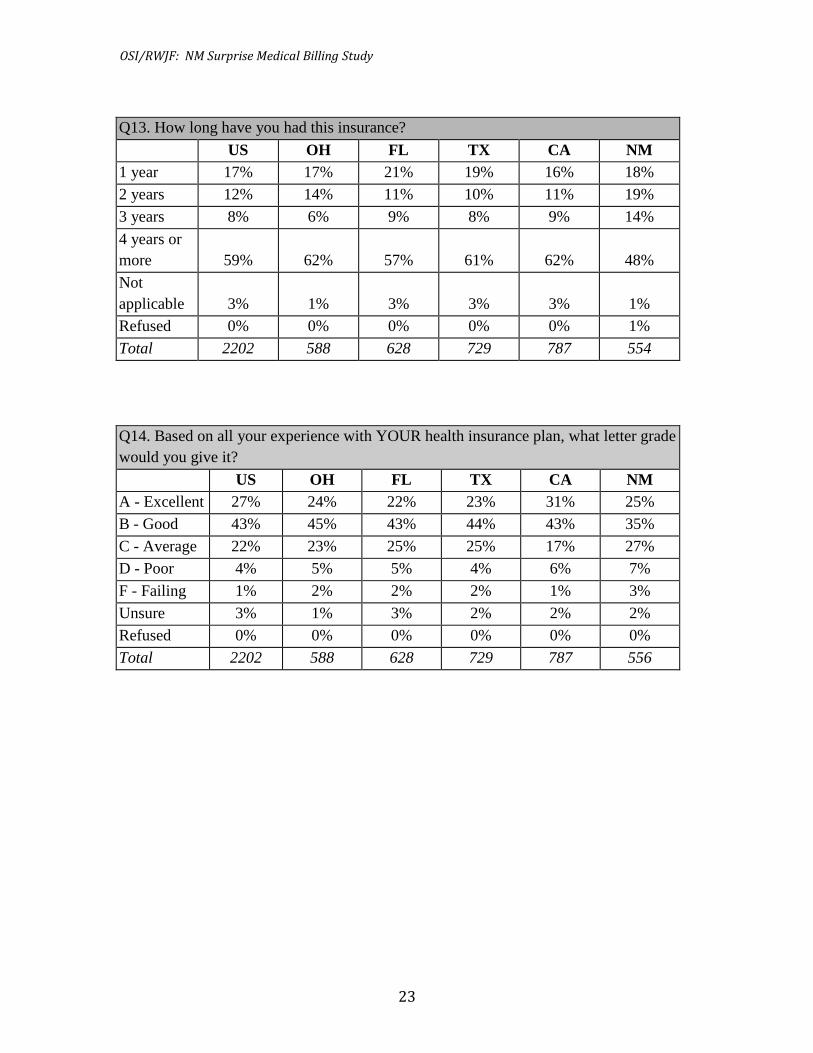
2. Summary of Major Findings Six out of 10 privately insured New Mexicans give their plan a grade of ‘B’ or higher.
We found that 35% gave their plan a “B” and 25% gave their plan a grade of “A.”
However, among respondents who received a surprise medical bill, few (12%)
would give their health plan an ‘A’ for its response; most (47%) gave their plan a
grade of ‘C’ or lower.
Twenty percent of privately insured New Mexicans received a surprise medical bill.
In the past two years, 20% of privately insured New Mexicans received a surprise
medical bill (a medical bill they were not expecting to pay / health plan paid less
than expected).
o This is higher for those who have had surgery (36%) or had to visit the
emergency room (55%).
Among those who received a surprise medical bill, 46% received a bill from a
doctor they did not expect to get a bill from; 26% indicated that they received
separate bills from multiple providers; 28% indicated that they were charged an
out-of-network rate when they thought that the provider was in-network.
While many (67%) took action to resolve their billing issue, nearly a third (31%)
did not.
Over three-quarters of privately insured New Mexicans had at least one problem with
their insurer.
In the past two years, over 3 in 4 (77%) privately insured New Mexicans had at
least one problem (e.g., billing issue, coverage denial, difficulty getting an
appointment with a doctor, delays in receiving care or treatment, etc.) with their
health insurer, with many having more than one problem.
The most commonly cited problem in the sample were issues related to billing or
payment for medical services at 36%, and another 25% noting they had a problem
with health services their plan does not cover.
OSI/RWJF: NM Surprise Medical Billing Study
4
3. Full Report
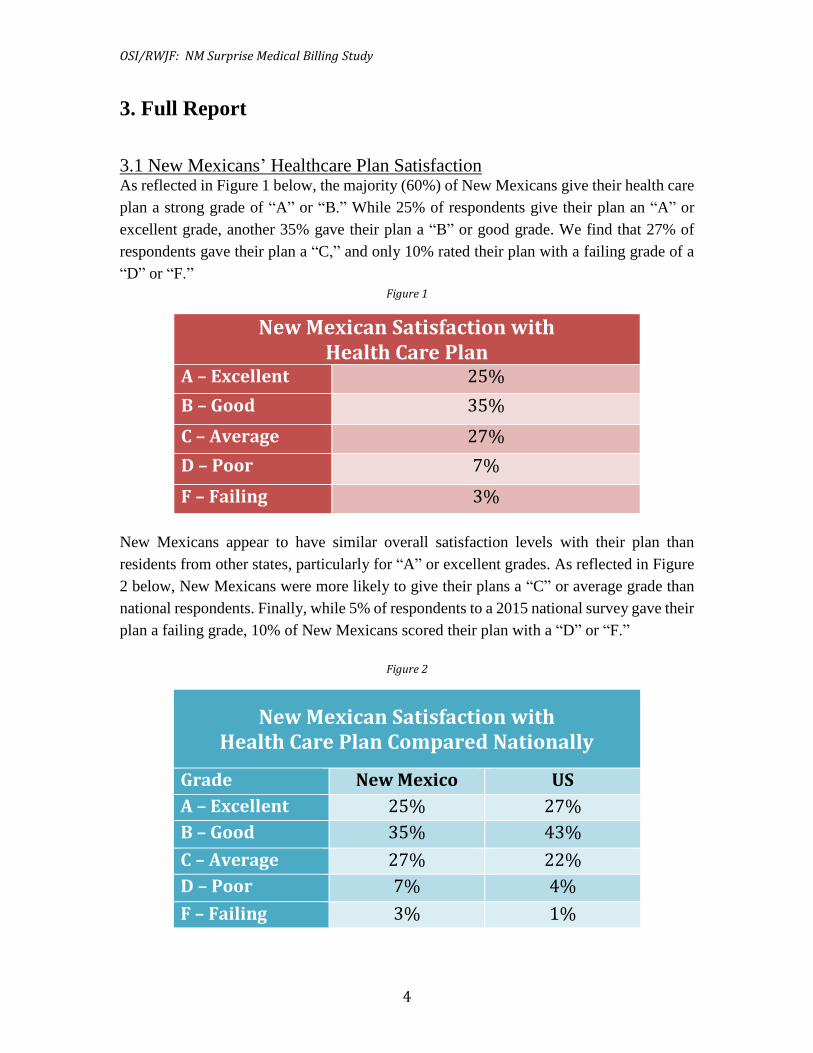
3.1 New Mexicans’ Healthcare Plan Satisfaction As reflected in Figure 1 below, the majority (60%) of New Mexicans give their health care
plan a strong grade of “A” or “B.” While 25% of respondents give their plan an “A” or
excellent grade, another 35% gave their plan a “B” or good grade. We find that 27% of
respondents gave their plan a “C,” and only 10% rated their plan with a failing grade of a
“D” or “F.”
Figure 1
New Mexican Satisfaction with Health Care Plan
A – Excellent 25%
B – Good 35%
C – Average 27%
D – Poor 7%
F – Failing 3%
New Mexicans appear to have similar overall satisfaction levels with their plan than
residents from other states, particularly for “A” or excellent grades. As reflected in Figure
2 below, New Mexicans were more likely to give their plans a “C” or average grade than
national respondents. Finally, while 5% of respondents to a 2015 national survey gave their
plan a failing grade, 10% of New Mexicans scored their plan with a “D” or “F.”
Figure 2
New Mexican Satisfaction with Health Care Plan Compared Nationally
Grade New Mexico US
A – Excellent 25% 27%
B – Good 35% 43%
C – Average 27% 22%
D – Poor 7% 4%
F – Failing 3% 1%
OSI/RWJF: NM Surprise Medical Billing Study
5
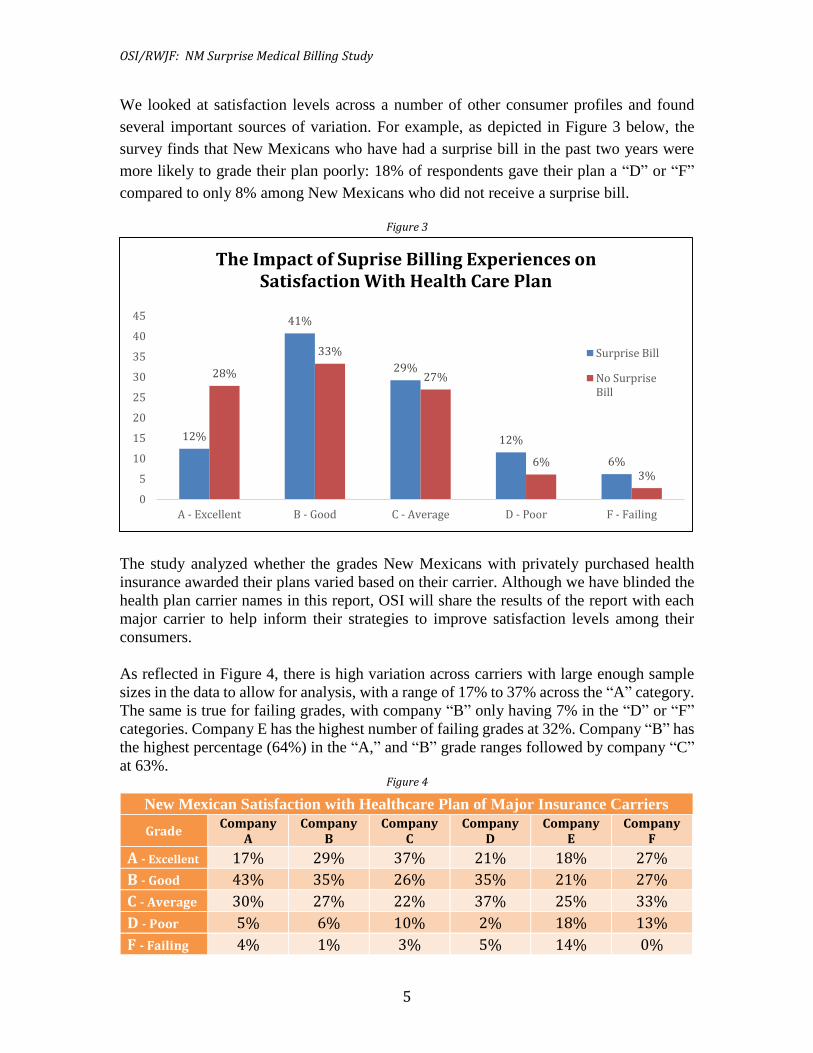
We looked at satisfaction levels across a number of other consumer profiles and found
several important sources of variation. For example, as depicted in Figure 3 below, the
survey finds that New Mexicans who have had a surprise bill in the past two years were
more likely to grade their plan poorly: 18% of respondents gave their plan a “D” or “F”
compared to only 8% among New Mexicans who did not receive a surprise bill.
Figure 3
The study analyzed whether the grades New Mexicans with privately purchased health
insurance awarded their plans varied based on their carrier. Although we have blinded the
health plan carrier names in this report, OSI will share the results of the report with each
major carrier to help inform their strategies to improve satisfaction levels among their
consumers.
As reflected in Figure 4, there is high variation across carriers with large enough sample
sizes in the data to allow for analysis, with a range of 17% to 37% across the “A” category.
The same is true for failing grades, with company “B” only having 7% in the “D” or “F”
categories. Company E has the highest number of failing grades at 32%. Company “B” has
the highest percentage (64%) in the “A,” and “B” grade ranges followed by company “C”
at 63%. Figure 4
New Mexican Satisfaction with Healthcare Plan of Major Insurance Carriers
Grade Company
A Company
B Company
C Company
D Company
E Company
F
A - Excellent 17% 29% 37% 21% 18% 27%
B - Good 43% 35% 26% 35% 21% 27%
C - Average 30% 27% 22% 37% 25% 33%
D - Poor 5% 6% 10% 2% 18% 13%
F - Failing 4% 1% 3% 5% 14% 0%
12%
41%
29%
12%
6%
28%
33%
27%
6%3%
0
5
10
15
20
25
30
35
40
45
A - Excellent B - Good C - Average D - Poor F - Failing
The Impact of Suprise Billing Experiences on Satisfaction With Health Care Plan
Surprise Bill
No SurpriseBill
OSI/RWJF: NM Surprise Medical Billing Study
6
3.2 New Mexicans’ Experiences with Surprise Billing The primary goal of this study was to identify the prevalence of surprise billing in New
Mexico among privately insured adults. There are two approaches commonly utilized to
define surprise billing. The approach taken in the national study we reference is to base
this measure on the following survey question: “In the past two years have you received a
medical bill where the health plan paid much less than you thought it would (or perhaps
not at all)?”
Another measure of surprise billing that we reference in our report is based on the following
response categories provided to respondents who indicated on the more general question
referenced above that they experienced surprise billing:
I got a bill from a doctor I did not expect to get a bill from.
I got separate bills from multiple providers.
I was charged at an out-of-network rate when I thought the provider was in
network.
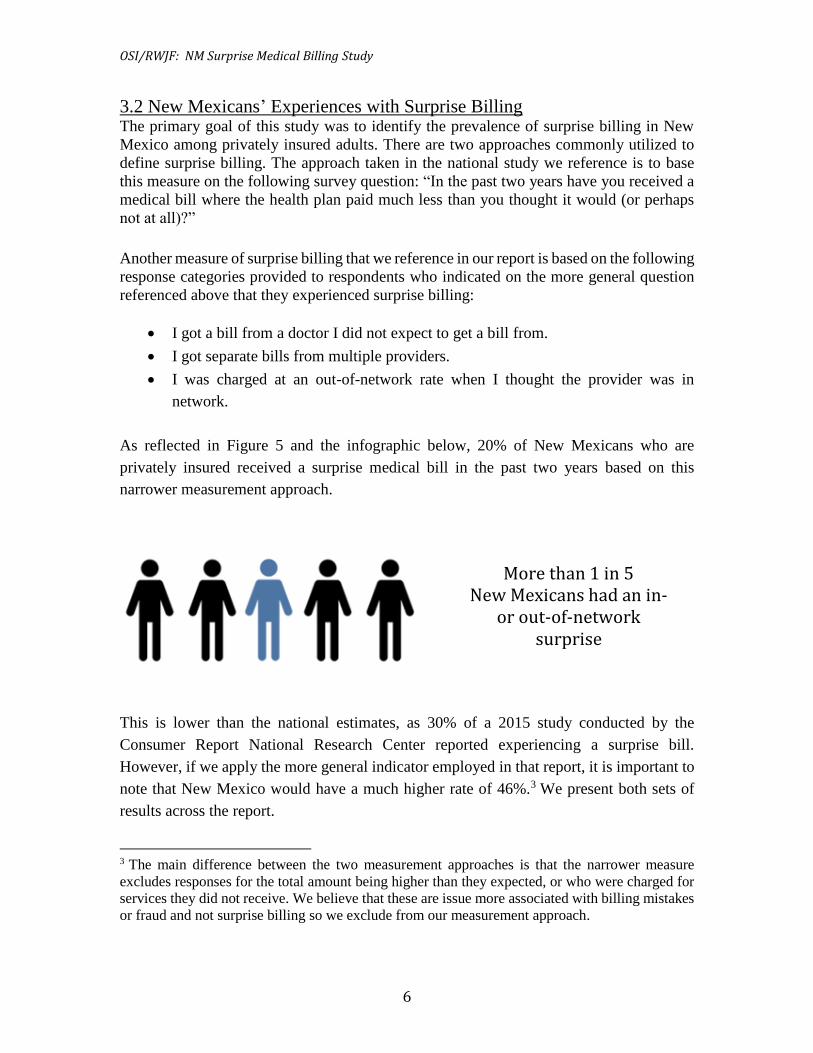
As reflected in Figure 5 and the infographic below, 20% of New Mexicans who are
privately insured received a surprise medical bill in the past two years based on this
narrower measurement approach.
This is lower than the national estimates, as 30% of a 2015 study conducted by the
Consumer Report National Research Center reported experiencing a surprise bill.
However, if we apply the more general indicator employed in that report, it is important to
note that New Mexico would have a much higher rate of 46%.3 We present both sets of
results across the report.
3 The main difference between the two measurement approaches is that the narrower measure
excludes responses for the total amount being higher than they expected, or who were charged for
services they did not receive. We believe that these are issue more associated with billing mistakes
or fraud and not surprise billing so we exclude from our measurement approach.
More than 1 in 5 New Mexicans had an in-
or out-of-network surprise
OSI/RWJF: NM Surprise Medical Billing Study
7
Figure 5
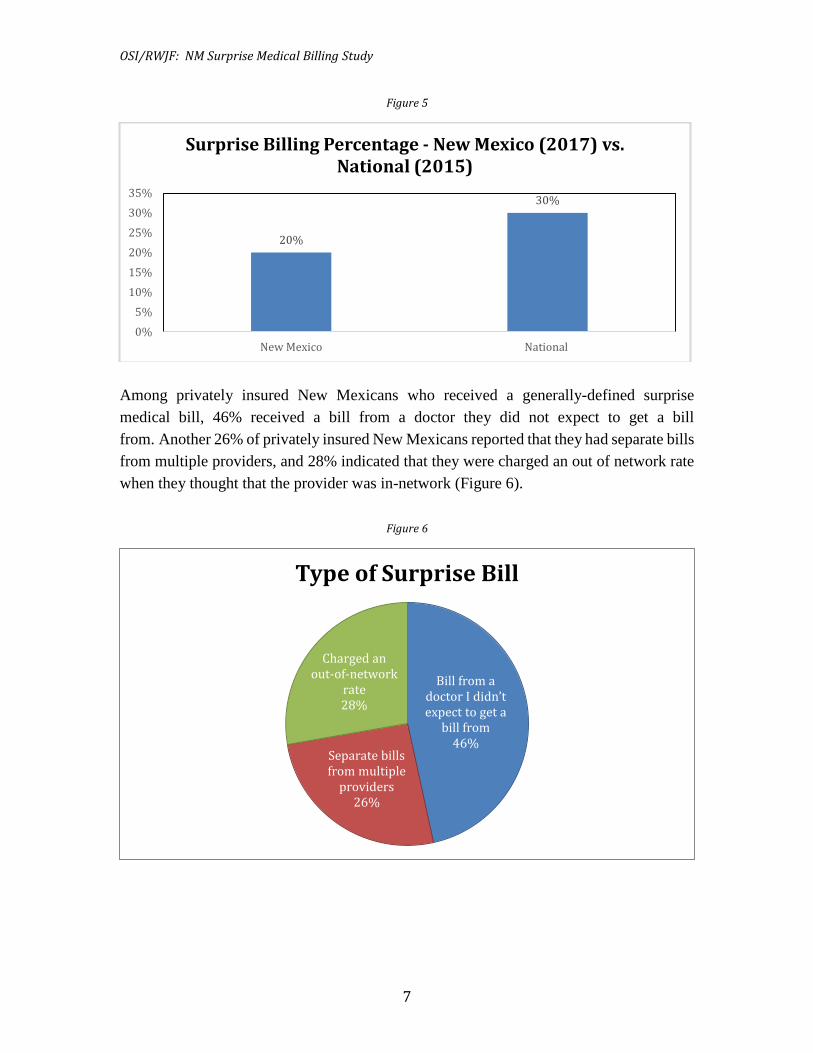
Among privately insured New Mexicans who received a generally-defined surprise
medical bill, 46% received a bill from a doctor they did not expect to get a bill
from. Another 26% of privately insured New Mexicans reported that they had separate bills
from multiple providers, and 28% indicated that they were charged an out of network rate
when they thought that the provider was in-network (Figure 6).
Figure 6
20%
30%
0%
5%
10%
15%
20%
25%
30%
35%
New Mexico National
Surprise Billing Percentage - New Mexico (2017) vs. National (2015)
Bill from a doctor I didn’t expect to get a
bill from46%
Separate bills from multiple
providers26%
Charged an out-of-network
rate28%
Type of Surprise Bill
OSI/RWJF: NM Surprise Medical Billing Study
8
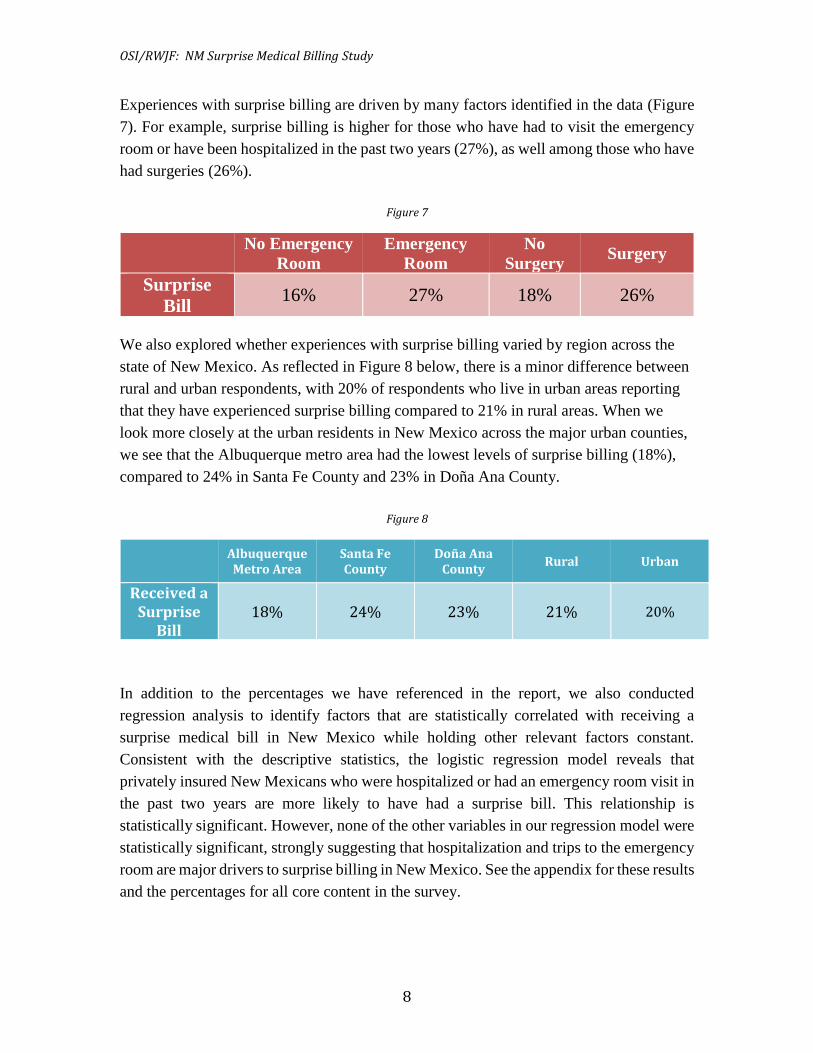
Experiences with surprise billing are driven by many factors identified in the data (Figure
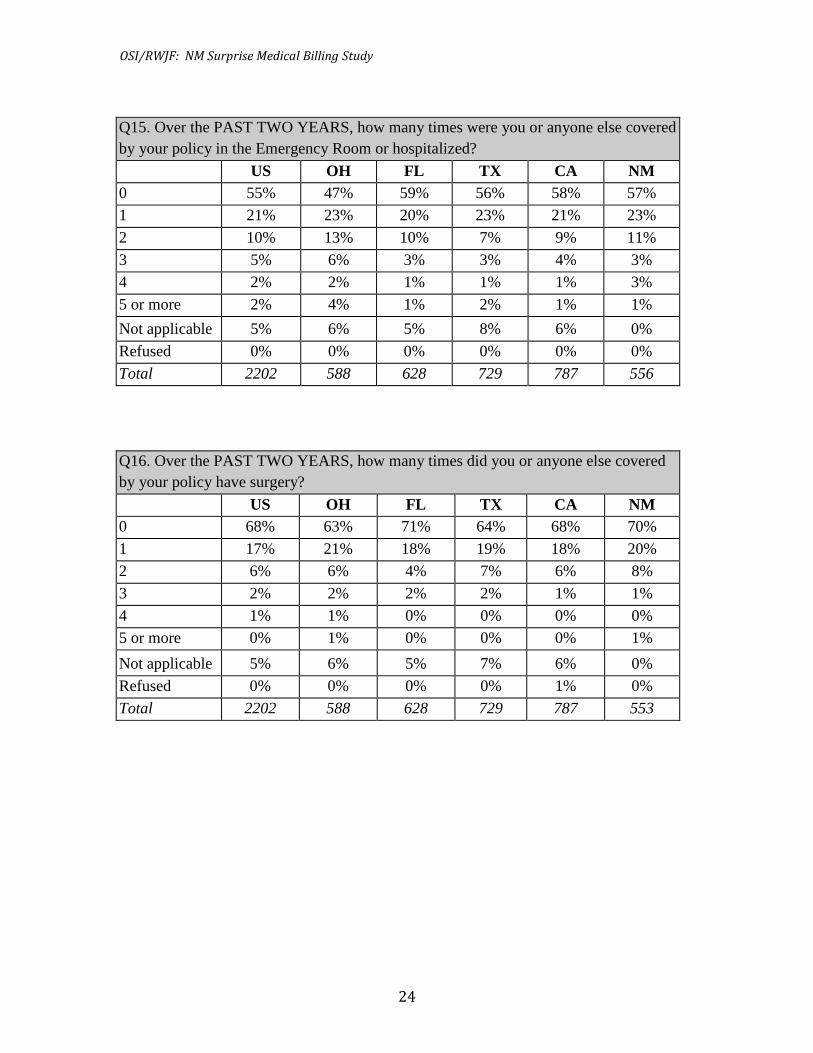
7). For example, surprise billing is higher for those who have had to visit the emergency
room or have been hospitalized in the past two years (27%), as well among those who have
had surgeries (26%).
Figure 7
No Emergency
Room
Emergency
Room
No
Surgery Surgery
Surprise
Bill 16% 27% 18% 26%
We also explored whether experiences with surprise billing varied by region across the
state of New Mexico. As reflected in Figure 8 below, there is a minor difference between
rural and urban respondents, with 20% of respondents who live in urban areas reporting
that they have experienced surprise billing compared to 21% in rural areas. When we
look more closely at the urban residents in New Mexico across the major urban counties,
we see that the Albuquerque metro area had the lowest levels of surprise billing (18%),
compared to 24% in Santa Fe County and 23% in Doña Ana County.
Figure 8
Albuquerque Metro Area
Santa Fe County
Doña Ana County
Rural Urban
Received a Surprise
Bill 18% 24% 23% 21% 20%
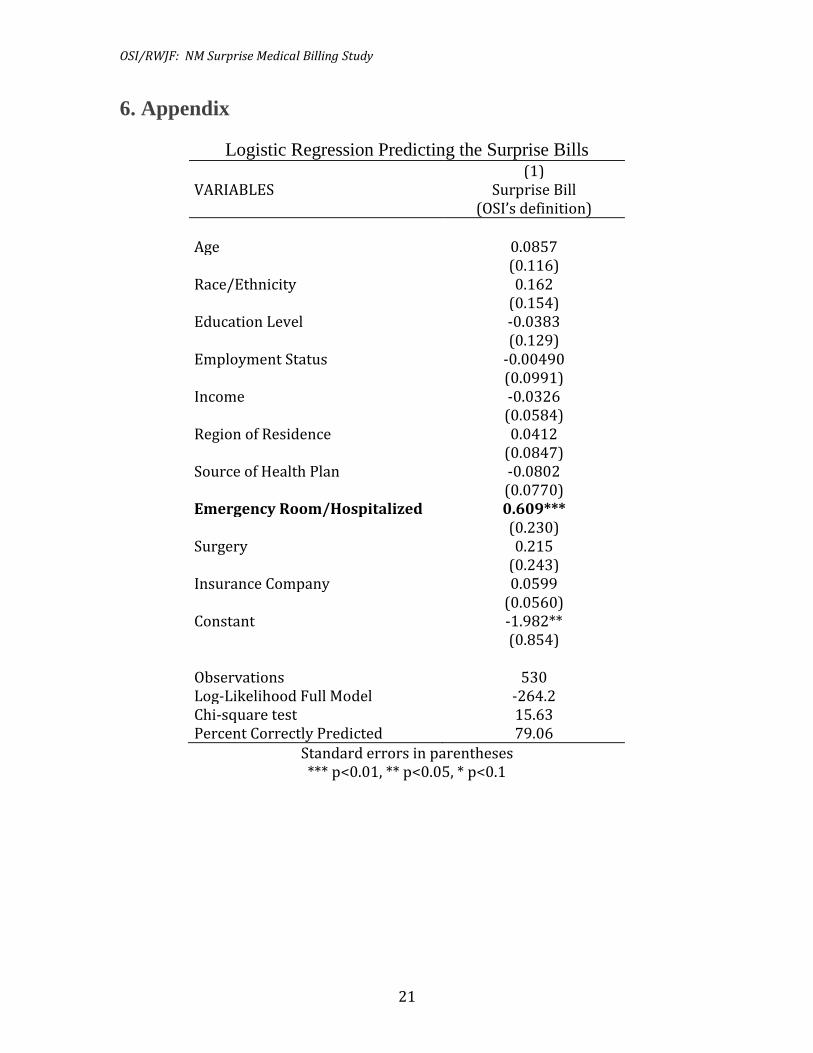
In addition to the percentages we have referenced in the report, we also conducted
regression analysis to identify factors that are statistically correlated with receiving a
surprise medical bill in New Mexico while holding other relevant factors constant.
Consistent with the descriptive statistics, the logistic regression model reveals that
privately insured New Mexicans who were hospitalized or had an emergency room visit in
the past two years are more likely to have had a surprise bill. This relationship is
statistically significant. However, none of the other variables in our regression model were
statistically significant, strongly suggesting that hospitalization and trips to the emergency
room are major drivers to surprise billing in New Mexico. See the appendix for these results
and the percentages for all core content in the survey.
OSI/RWJF: NM Surprise Medical Billing Study
9
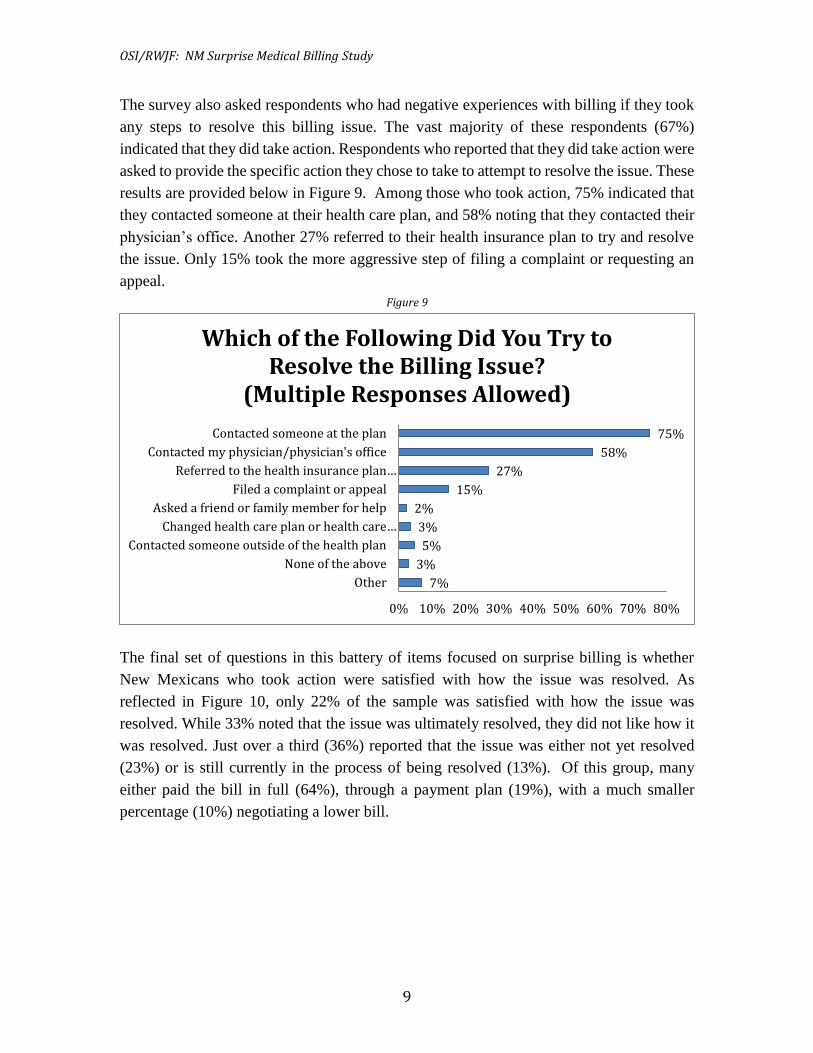
The survey also asked respondents who had negative experiences with billing if they took
any steps to resolve this billing issue. The vast majority of these respondents (67%)
indicated that they did take action. Respondents who reported that they did take action were
asked to provide the specific action they chose to take to attempt to resolve the issue. These
results are provided below in Figure 9. Among those who took action, 75% indicated that
they contacted someone at their health care plan, and 58% noting that they contacted their
physician’s office. Another 27% referred to their health insurance plan to try and resolve
the issue. Only 15% took the more aggressive step of filing a complaint or requesting an
appeal.
Figure 9
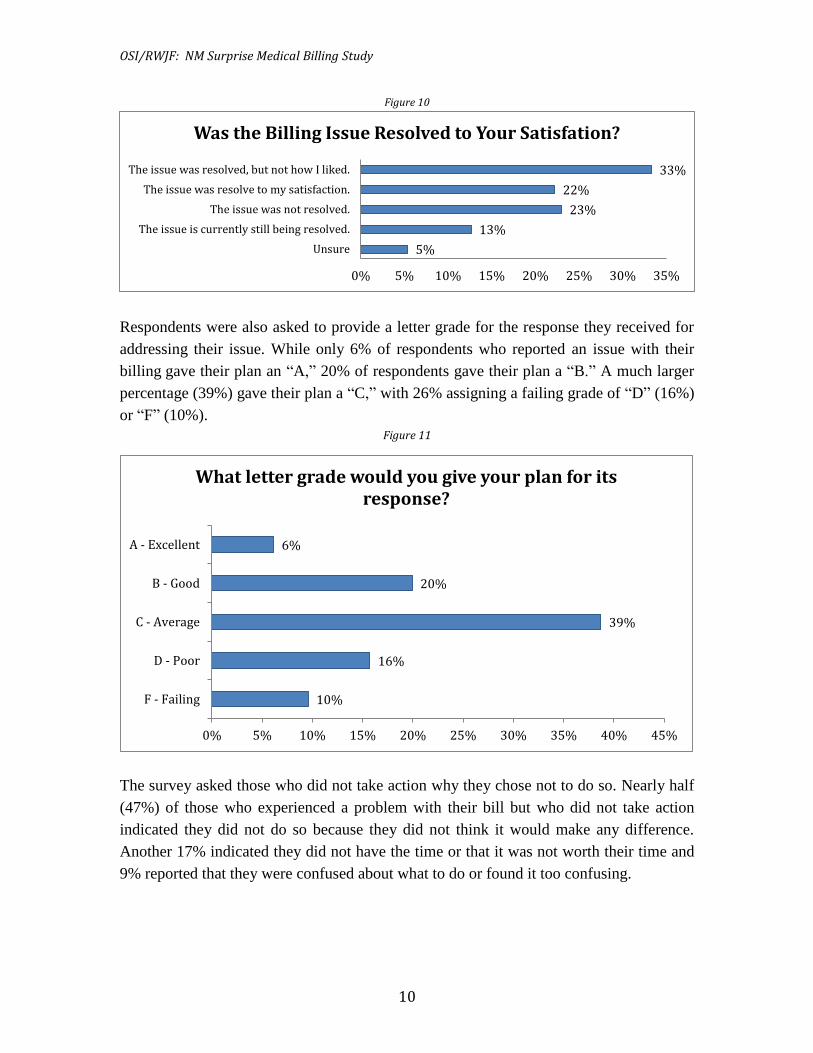
The final set of questions in this battery of items focused on surprise billing is whether
New Mexicans who took action were satisfied with how the issue was resolved. As
reflected in Figure 10, only 22% of the sample was satisfied with how the issue was
resolved. While 33% noted that the issue was ultimately resolved, they did not like how it
was resolved. Just over a third (36%) reported that the issue was either not yet resolved
(23%) or is still currently in the process of being resolved (13%). Of this group, many
either paid the bill in full (64%), through a payment plan (19%), with a much smaller
percentage (10%) negotiating a lower bill.
75%
58%
27%
15%
2%
3%
5%
3%
7%
0% 10% 20% 30% 40% 50% 60% 70% 80%
Contacted someone at the plan
Contacted my physician/physician's office
Referred to the health insurance plan…
Filed a complaint or appeal
Asked a friend or family member for help
Changed health care plan or health care…
Contacted someone outside of the health plan
None of the above
Other
Which of the Following Did You Try to Resolve the Billing Issue?
(Multiple Responses Allowed)
OSI/RWJF: NM Surprise Medical Billing Study
10
Figure 10
Respondents were also asked to provide a letter grade for the response they received for
addressing their issue. While only 6% of respondents who reported an issue with their
billing gave their plan an “A,” 20% of respondents gave their plan a “B.” A much larger
percentage (39%) gave their plan a “C,” with 26% assigning a failing grade of “D” (16%)
or “F” (10%).
Figure 11
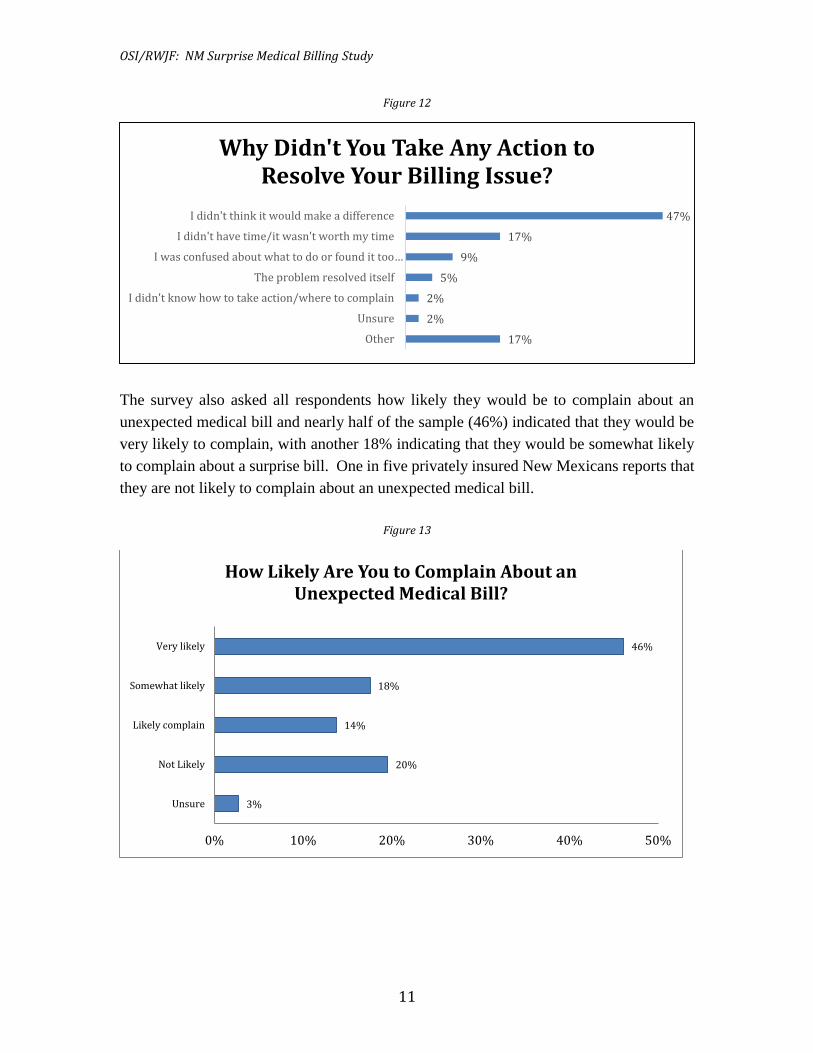
The survey asked those who did not take action why they chose not to do so. Nearly half
(47%) of those who experienced a problem with their bill but who did not take action
indicated they did not do so because they did not think it would make any difference.
Another 17% indicated they did not have the time or that it was not worth their time and
9% reported that they were confused about what to do or found it too confusing.
33%
22%
23%
13%
5%
0% 5% 10% 15% 20% 25% 30% 35%
The issue was resolved, but not how I liked.
The issue was resolve to my satisfaction.
The issue was not resolved.
The issue is currently still being resolved.
Unsure
Was the Billing Issue Resolved to Your Satisfation?
10%
16%
39%
20%
6%
0% 5% 10% 15% 20% 25% 30% 35% 40% 45%
F - Failing
D - Poor
C - Average
B - Good
A - Excellent
What letter grade would you give your plan for its response?
OSI/RWJF: NM Surprise Medical Billing Study
11
Figure 12
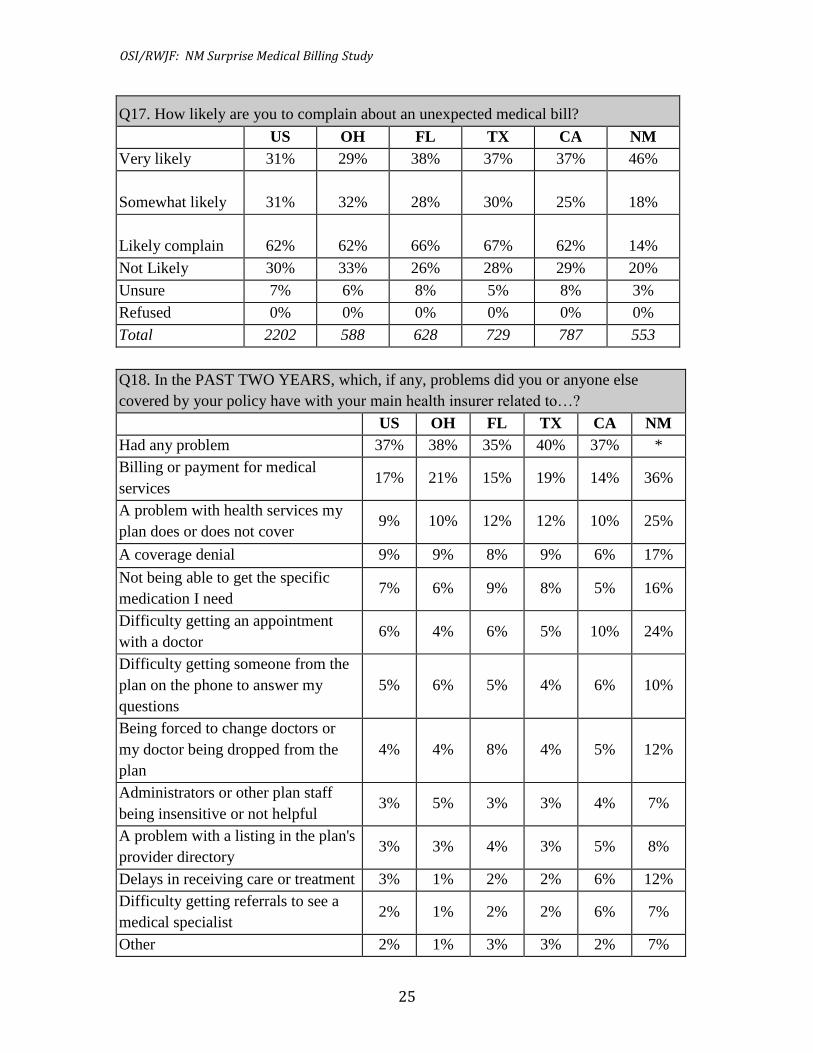
The survey also asked all respondents how likely they would be to complain about an
unexpected medical bill and nearly half of the sample (46%) indicated that they would be
very likely to complain, with another 18% indicating that they would be somewhat likely
to complain about a surprise bill. One in five privately insured New Mexicans reports that
they are not likely to complain about an unexpected medical bill.
Figure 13
47%
17%
9%
5%
2%
2%
17%
I didn't think it would make a difference
I didn't have time/it wasn't worth my time
I was confused about what to do or found it too…
The problem resolved itself
I didn't know how to take action/where to complain
Unsure
Other
Why Didn't You Take Any Action to Resolve Your Billing Issue?
46%
18%
14%
20%
3%
0% 10% 20% 30% 40% 50%
Very likely
Somewhat likely
Likely complain
Not Likely
Unsure
How Likely Are You to Complain About an Unexpected Medical Bill?
OSI/RWJF: NM Surprise Medical Billing Study
12
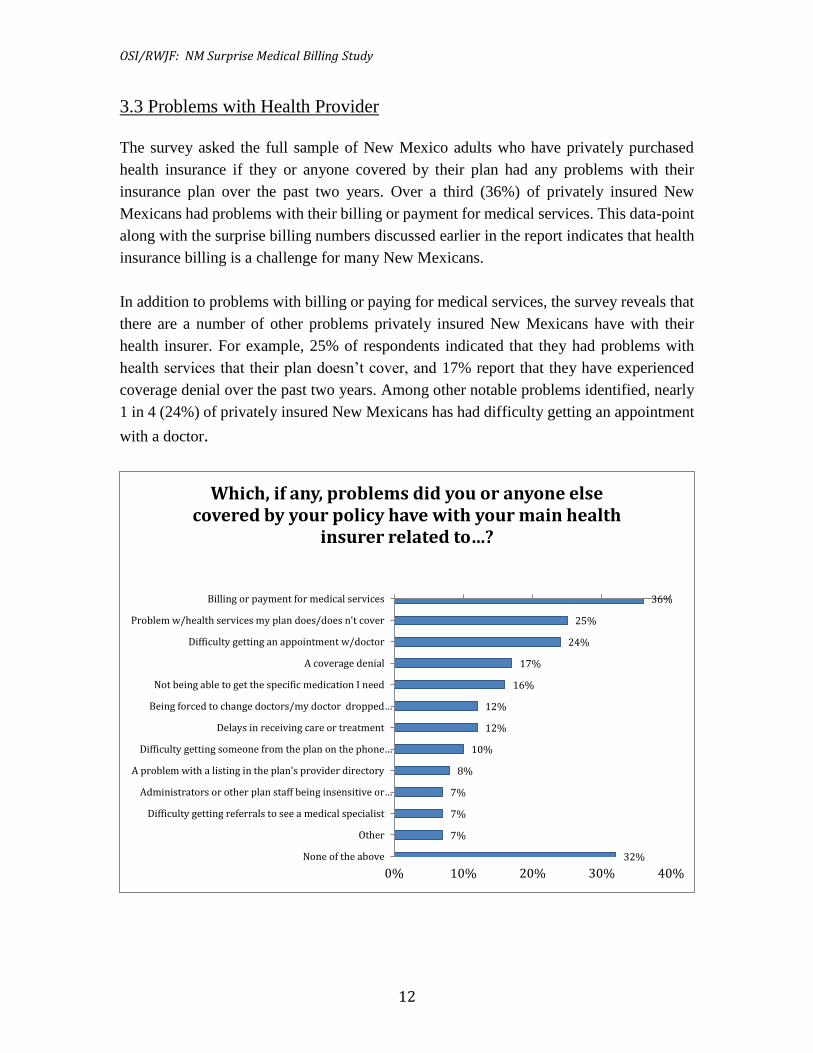
3.3 Problems with Health Provider
The survey asked the full sample of New Mexico adults who have privately purchased
health insurance if they or anyone covered by their plan had any problems with their
insurance plan over the past two years. Over a third (36%) of privately insured New
Mexicans had problems with their billing or payment for medical services. This data-point
along with the surprise billing numbers discussed earlier in the report indicates that health
insurance billing is a challenge for many New Mexicans.
In addition to problems with billing or paying for medical services, the survey reveals that
there are a number of other problems privately insured New Mexicans have with their
health insurer. For example, 25% of respondents indicated that they had problems with
health services that their plan doesn’t cover, and 17% report that they have experienced
coverage denial over the past two years. Among other notable problems identified, nearly
1 in 4 (24%) of privately insured New Mexicans has had difficulty getting an appointment
with a doctor.
36%
25%
24%
17%
16%
12%
12%
10%
8%
7%
7%
7%
32%
0% 10% 20% 30% 40%
Billing or payment for medical services
Problem w/health services my plan does/does n't cover
Difficulty getting an appointment w/doctor
A coverage denial
Not being able to get the specific medication I need
Being forced to change doctors/my doctor dropped…
Delays in receiving care or treatment
Difficulty getting someone from the plan on the phone…
A problem with a listing in the plan's provider directory
Administrators or other plan staff being insensitive or…
Difficulty getting referrals to see a medical specialist
Other
None of the above
Which, if any, problems did you or anyone else covered by your policy have with your main health
insurer related to…?
OSI/RWJF: NM Surprise Medical Billing Study
13
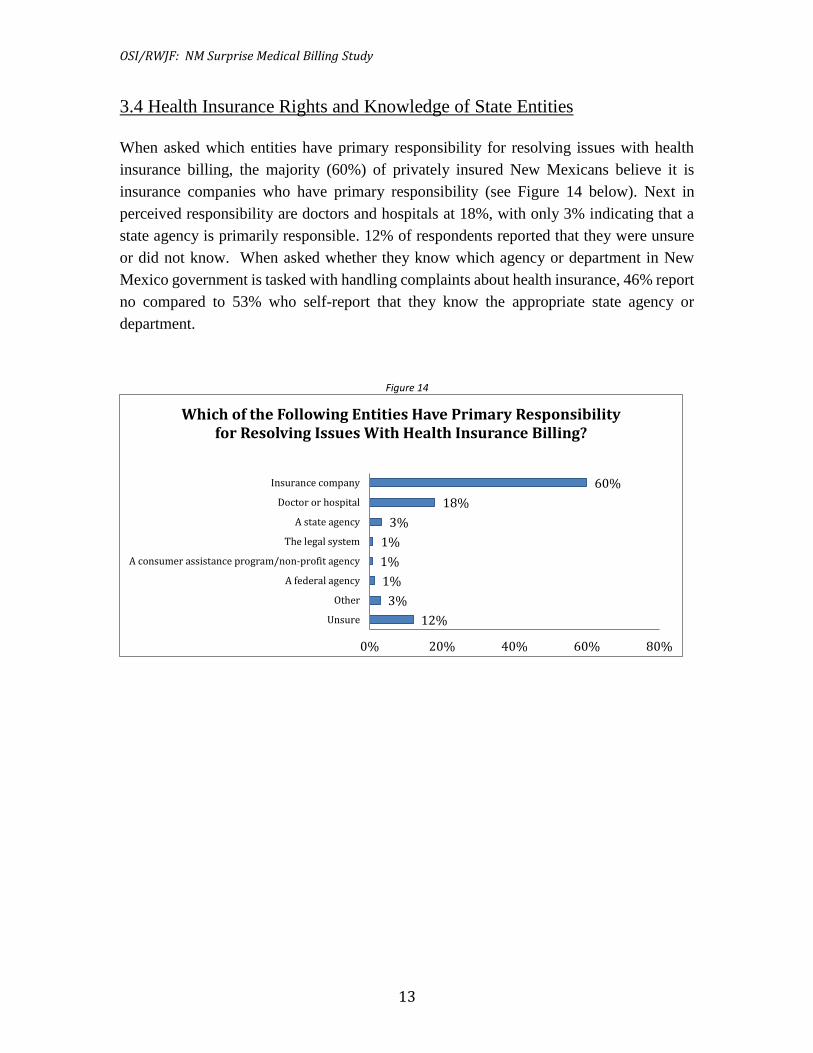
3.4 Health Insurance Rights and Knowledge of State Entities
When asked which entities have primary responsibility for resolving issues with health
insurance billing, the majority (60%) of privately insured New Mexicans believe it is
insurance companies who have primary responsibility (see Figure 14 below). Next in
perceived responsibility are doctors and hospitals at 18%, with only 3% indicating that a
state agency is primarily responsible. 12% of respondents reported that they were unsure
or did not know. When asked whether they know which agency or department in New
Mexico government is tasked with handling complaints about health insurance, 46% report
no compared to 53% who self-report that they know the appropriate state agency or
department.
Figure 14
60%
18%
3%
1%
1%
1%
3%
12%
0% 20% 40% 60% 80%
Insurance company
Doctor or hospital
A state agency
The legal system
A consumer assistance program/non-profit agency
A federal agency
Other
Unsure
Which of the Following Entities Have Primary Responsibility for Resolving Issues With Health Insurance Billing?
OSI/RWJF: NM Surprise Medical Billing Study
14
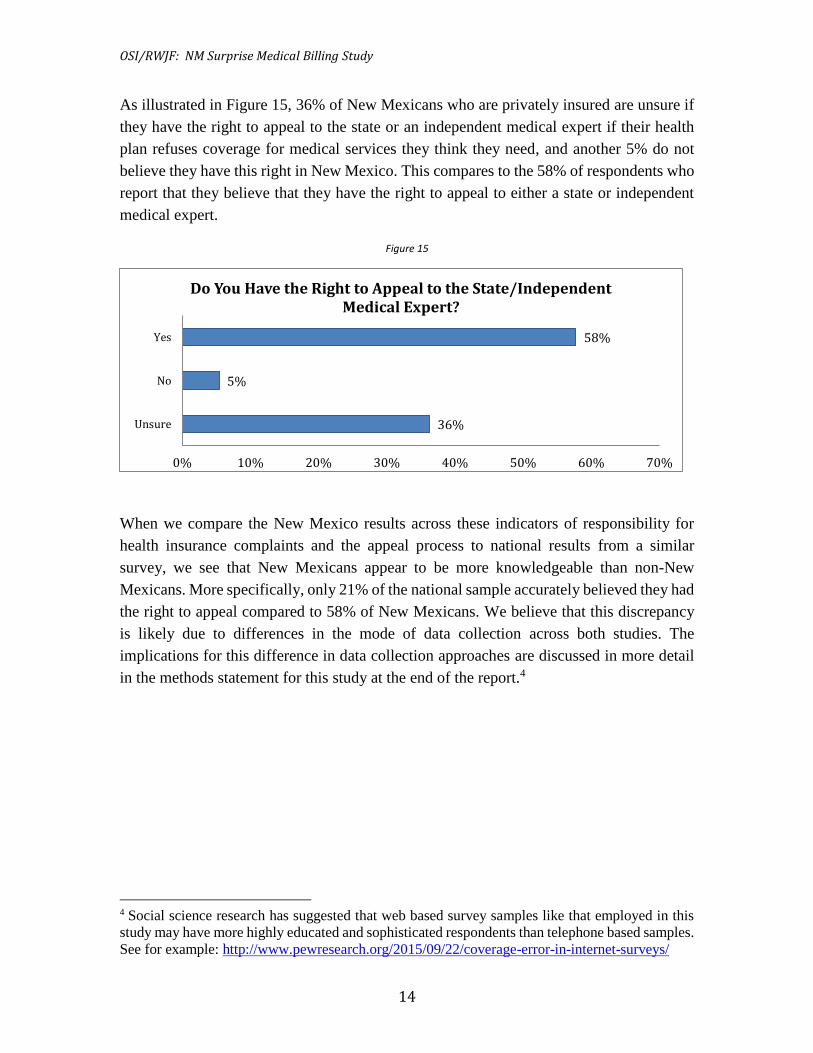
As illustrated in Figure 15, 36% of New Mexicans who are privately insured are unsure if
they have the right to appeal to the state or an independent medical expert if their health
plan refuses coverage for medical services they think they need, and another 5% do not
believe they have this right in New Mexico. This compares to the 58% of respondents who
report that they believe that they have the right to appeal to either a state or independent
medical expert.
Figure 15
When we compare the New Mexico results across these indicators of responsibility for
health insurance complaints and the appeal process to national results from a similar
survey, we see that New Mexicans appear to be more knowledgeable than non-New
Mexicans. More specifically, only 21% of the national sample accurately believed they had
the right to appeal compared to 58% of New Mexicans. We believe that this discrepancy
is likely due to differences in the mode of data collection across both studies. The
implications for this difference in data collection approaches are discussed in more detail
in the methods statement for this study at the end of the report.4
4 Social science research has suggested that web based survey samples like that employed in this
study may have more highly educated and sophisticated respondents than telephone based samples.
See for example: http://www.pewresearch.org/2015/09/22/coverage-error-in-internet-surveys/
58%
5%
36%
0% 10% 20% 30% 40% 50% 60% 70%
Yes
No
Unsure
Do You Have the Right to Appeal to the State/Independent Medical Expert?
OSI/RWJF: NM Surprise Medical Billing Study
15
3.5 Consumer Knowledge of In- and Out-of-Network Issues
In the past two years, 22% of privately insured New Mexicans have tried to use a
doctor/facility outside of their plan’s network. However, over this same period, 33% have
been surprised to find out that a doctor or lab/facility they thought was in-network, was
out-of-network. Many (70%) privately insured New Mexicans assume that doctors they
see in an in-network hospital are also in-network. Not surprisingly, nearly all respondents
(96%) believe that hospitals should have to notify patients if a doctor/technician involved
in a procedure performed at that hospital will be out-of-network.
While 44% of respondents believe they must pay the extra cost if an error in their plan’s
provider directory causes them to go to a doctor/hospital that is out-of-network, many
(31%) are uncertain about this, and 24% do not believe they are required to pay.
OSI/RWJF: NM Surprise Medical Billing Study
16
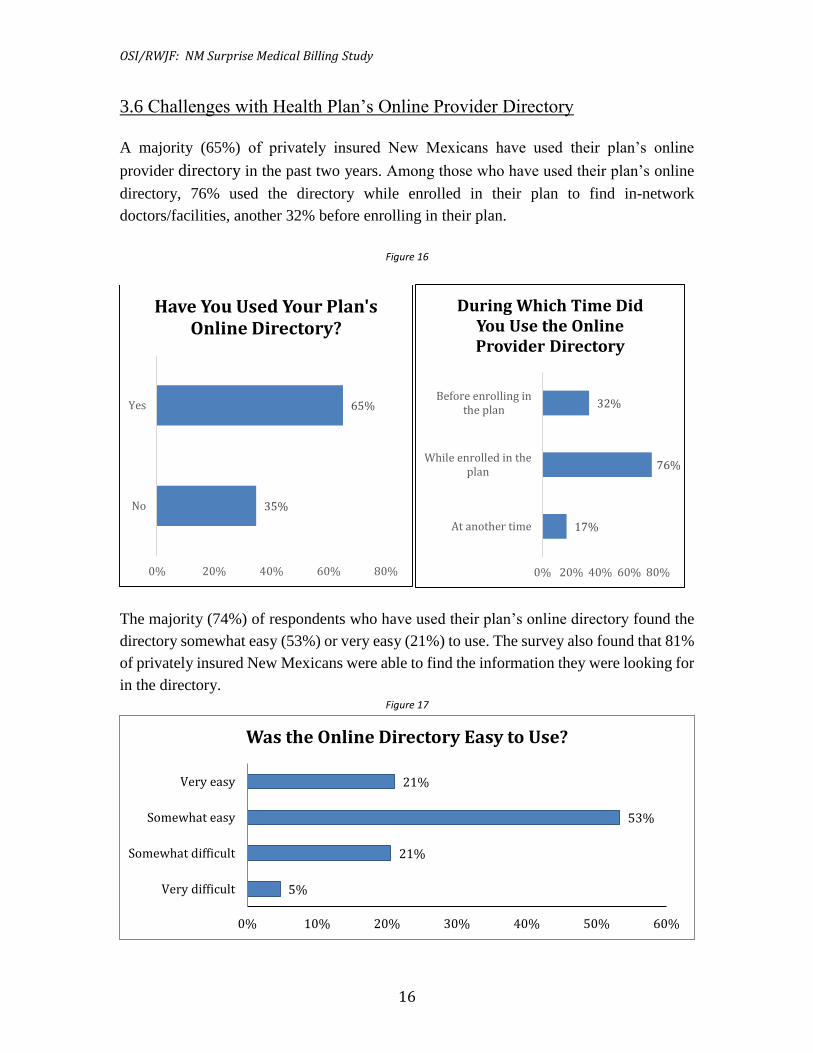
3.6 Challenges with Health Plan’s Online Provider Directory
A majority (65%) of privately insured New Mexicans have used their plan’s online
provider directory in the past two years. Among those who have used their plan’s online
directory, 76% used the directory while enrolled in their plan to find in-network
doctors/facilities, another 32% before enrolling in their plan.
Figure 16
The majority (74%) of respondents who have used their plan’s online directory found the
directory somewhat easy (53%) or very easy (21%) to use. The survey also found that 81%
of privately insured New Mexicans were able to find the information they were looking for
in the directory.
Figure 17
65%
35%
0% 20% 40% 60% 80%
Yes
No
Have You Used Your Plan's Online Directory?
32%
76%
17%
0% 20% 40% 60% 80%
Before enrolling inthe plan
While enrolled in theplan
At another time
During Which Time Did You Use the Online Provider Directory
21%
53%
21%
5%
0% 10% 20% 30% 40% 50% 60%
Very easy
Somewhat easy
Somewhat difficult
Very difficult
Was the Online Directory Easy to Use?
OSI/RWJF: NM Surprise Medical Billing Study
17
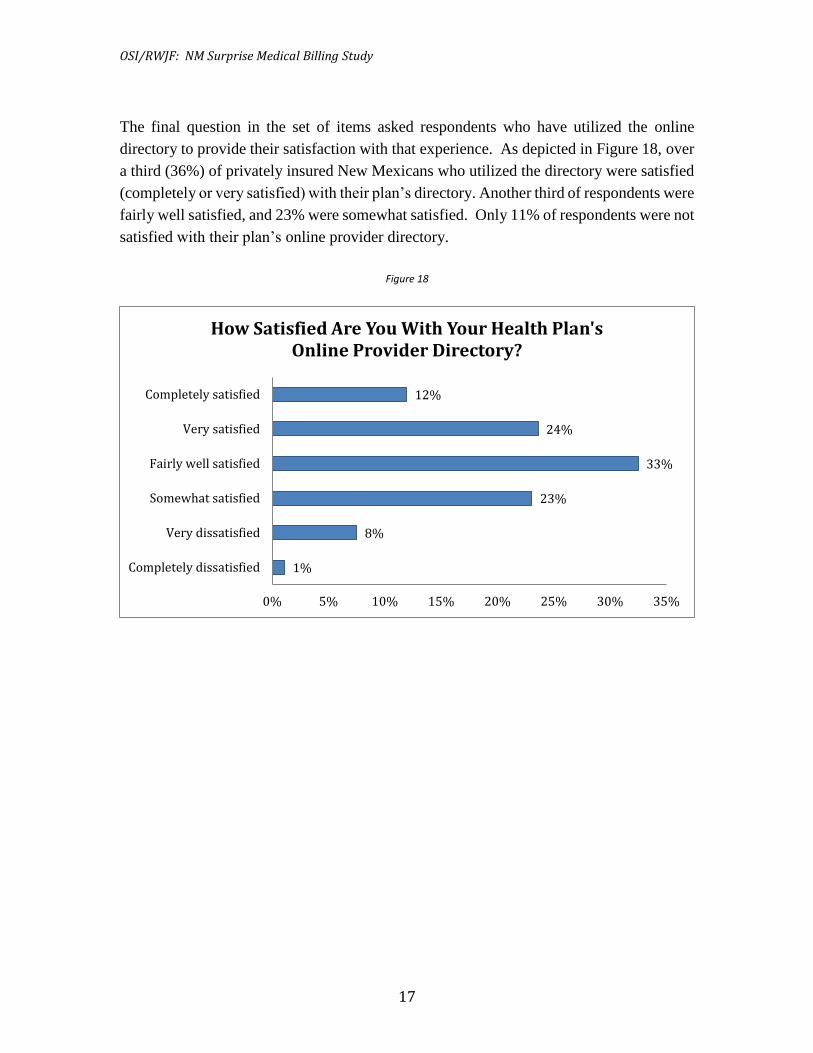
The final question in the set of items asked respondents who have utilized the online
directory to provide their satisfaction with that experience. As depicted in Figure 18, over
a third (36%) of privately insured New Mexicans who utilized the directory were satisfied
(completely or very satisfied) with their plan’s directory. Another third of respondents were
fairly well satisfied, and 23% were somewhat satisfied. Only 11% of respondents were not
satisfied with their plan’s online provider directory.
Figure 18
12%
24%
33%
23%
8%
1%
0% 5% 10% 15% 20% 25% 30% 35%
Completely satisfied
Very satisfied
Fairly well satisfied
Somewhat satisfied
Very dissatisfied
Completely dissatisfied
How Satisfied Are You With Your Health Plan'sOnline Provider Directory?
OSI/RWJF: NM Surprise Medical Billing Study
18
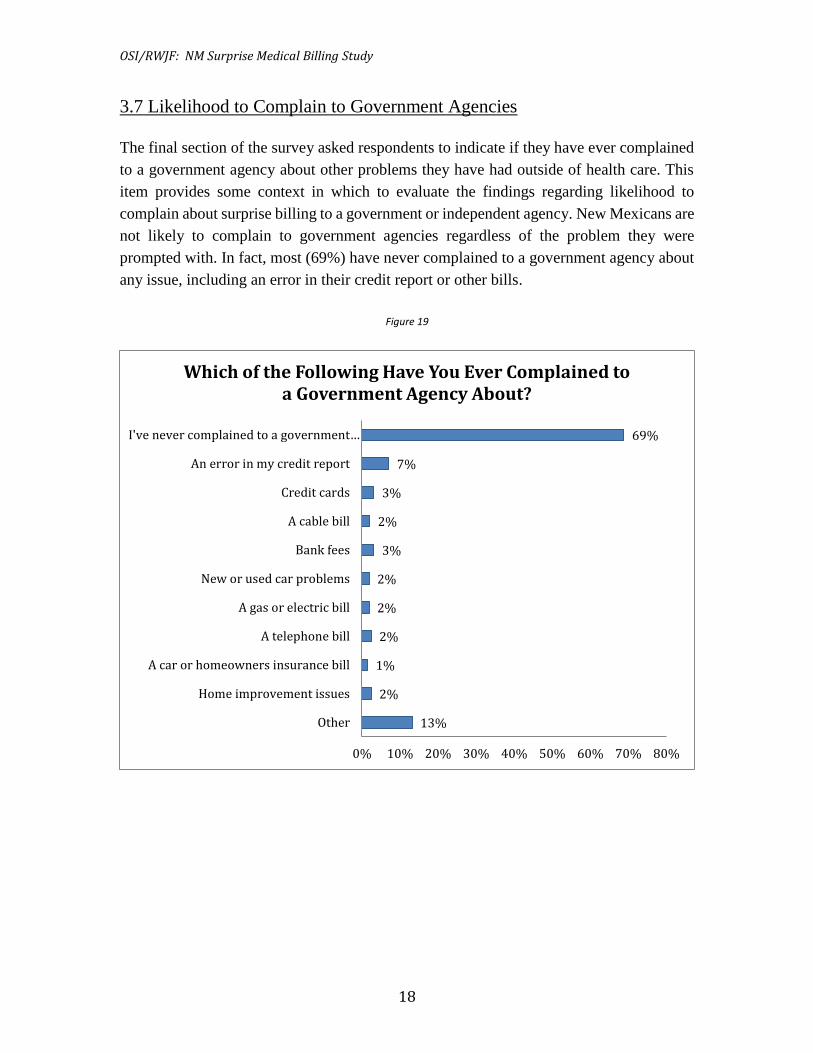
3.7 Likelihood to Complain to Government Agencies
The final section of the survey asked respondents to indicate if they have ever complained
to a government agency about other problems they have had outside of health care. This
item provides some context in which to evaluate the findings regarding likelihood to
complain about surprise billing to a government or independent agency. New Mexicans are
not likely to complain to government agencies regardless of the problem they were
prompted with. In fact, most (69%) have never complained to a government agency about
any issue, including an error in their credit report or other bills.
Figure 19
69%
7%
3%
2%
3%
2%
2%
2%
1%
2%
13%
0% 10% 20% 30% 40% 50% 60% 70% 80%
I've never complained to a government…
An error in my credit report
Credit cards
A cable bill
Bank fees
New or used car problems
A gas or electric bill
A telephone bill
A car or homeowners insurance bill
Home improvement issues
Other
Which of the Following Have You Ever Complained to a Government Agency About?
OSI/RWJF: NM Surprise Medical Billing Study
19
4. Summary of Results In the past two years, a notable amount of privately insured New Mexicans have received
a surprise medical bill. While many took action to resolve this issue, many more New
Mexicans did not choose to do so. A common reason for inaction was the consumer’s belief
that it wouldn’t make any difference, which is a widely-held perception among the
privately insured public. Many respondents expressed confusion about what to do when
they experience problems with their insurance bills. In fact, when we asked consumers
about health insurance policies and the state entities governing health insurers, we found
most consumers are not very well informed about these issues. These survey results suggest
surprise medical bills are a problem in New Mexico, and unfortunately many New
Mexicans are not clear on what to do to resolve these issues when they occur.
OSI/RWJF: NM Surprise Medical Billing Study
20
5. Survey Methodology – Demographics of Sample
The UNM RWJF Center for Health Policy interviewed a total of 554 adults in New Mexico
between June 12 and August 15, 2017, on behalf of the New Mexico Office of
Superintendent of Insurance (OSI). The survey was administrated through the internet with
respondents recruited through email messages sent to the address provided by healthcare
providers in the state, advocacy groups, and OSI distribution lists. To be eligible for
participation in the survey respondents had to be: 18+ of age, residents of the state of New
Mexico, and have privately purchased health insurance through the marketplace or an
employer (specifically excluding those enrolled in Centennial Care, Salud, Medicaid,
Medicaid, UNM Care or Tricare). Screening questions were used to ensure that only
respondents who fit those criteria completed the survey. The survey has a margin of error
of 4.3%.
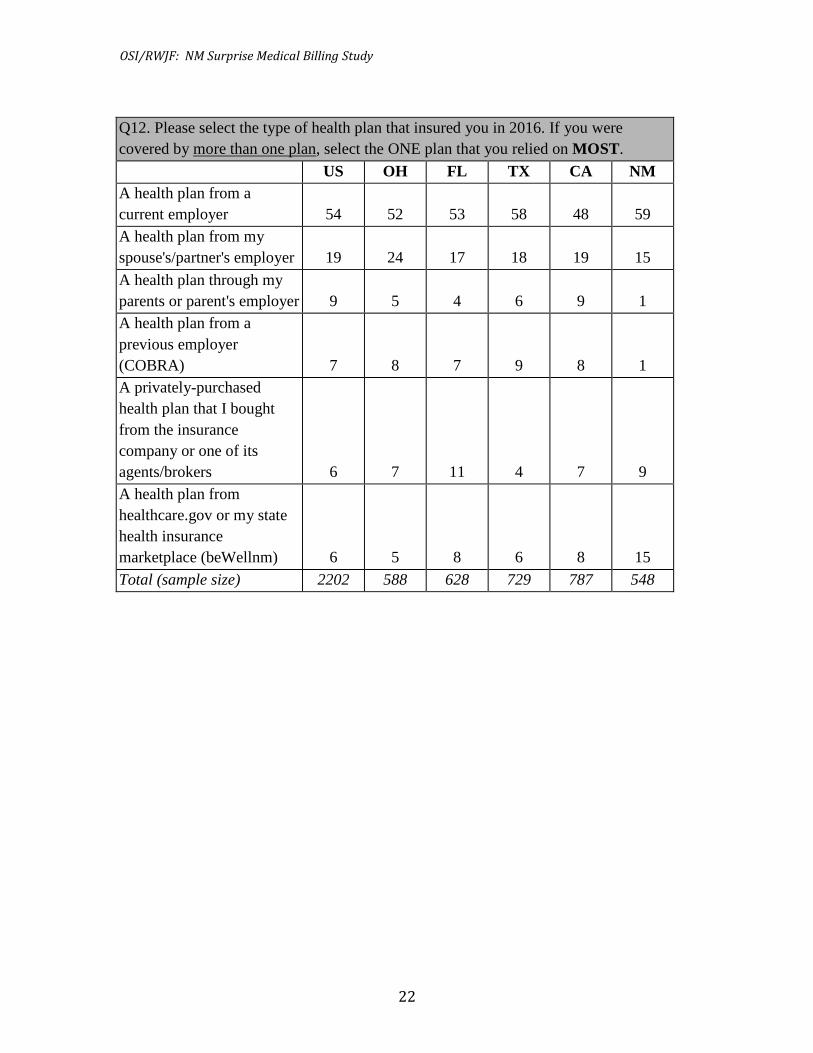
The majority (59%) of respondents indicated that they received their health insurance from
their employer, another 15% from their spouse or partner’s employer. 15% of the sample
indicated that they purchased health insurance through the state health insurance
marketplace (beWellnm.com or Healthcare.gov). The modal category for how long
respondents have had that insurance is four or more years at 48%, another 14% for three
years, 19% at two years, and 18% for one year. As noted in the report, we have attempted
to mirror the national survey conducted by the Consumer Report National Research Center
to make comparisons between New Mexico and the rest of the nation. It is important to
note that given the difference in fielding year (2015 for national study/2017 for New
Mexico) and mode of data collection (web-based for New Mexico/phone for national) the
results across the two studies are not directly comparable. For example, while web-based
surveys are becoming increasingly common in both industry and academic research, web-
only samples tend to have more highly educated respondents than phone or mail based
surveys. Therefore, while helpful for comparison purposes, we suggest that these
differences in methodology and fielding dates be considered when making these
comparisons.
For more information about the poll, please contact Gabriel R. Sanchez, Ph.D. at
OSI/RWJF: NM Surprise Medical Billing Study
21
6. Appendix
Logistic Regression Predicting the Surprise Bills (1) VARIABLES Surprise Bill
(OSI’s definition) Age 0.0857 (0.116) Race/Ethnicity 0.162 (0.154) Education Level -0.0383 (0.129) Employment Status -0.00490 (0.0991) Income -0.0326 (0.0584) Region of Residence 0.0412 (0.0847) Source of Health Plan -0.0802 (0.0770) Emergency Room/Hospitalized 0.609*** (0.230) Surgery 0.215 (0.243) Insurance Company 0.0599 (0.0560) Constant -1.982** (0.854) Observations 530 Log-Likelihood Full Model -264.2 Chi-square test 15.63 Percent Correctly Predicted 79.06
Standard errors in parentheses *** p<0.01, ** p<0.05, * p<0.1
OSI/RWJF: NM Surprise Medical Billing Study
22
Q12. Please select the type of health plan that insured you in 2016. If you were
covered by more than one plan, select the ONE plan that you relied on MOST.
US OH FL TX CA NM
A health plan from a
current employer 54 52 53 58 48 59
A health plan from my
spouse's/partner's employer 19 24 17 18 19 15
A health plan through my
parents or parent's employer 9 5 4 6 9 1
A health plan from a
previous employer
(COBRA) 7 8 7 9 8 1
A privately-purchased
health plan that I bought
from the insurance
company or one of its
agents/brokers 6 7 11 4 7 9
A health plan from
healthcare.gov or my state
health insurance
marketplace (beWellnm) 6 5 8 6 8 15
Total (sample size) 2202 588 628 729 787 548
OSI/RWJF: NM Surprise Medical Billing Study
23
Q13. How long have you had this insurance?
US OH FL TX CA NM
1 year 17% 17% 21% 19% 16% 18%
2 years 12% 14% 11% 10% 11% 19%
3 years 8% 6% 9% 8% 9% 14%
4 years or
more 59% 62% 57% 61% 62% 48%
Not
applicable 3% 1% 3% 3% 3% 1%
Refused 0% 0% 0% 0% 0% 1%
Total 2202 588 628 729 787 554
Q14. Based on all your experience with YOUR health insurance plan, what letter grade
would you give it?
US OH FL TX CA NM
A - Excellent 27% 24% 22% 23% 31% 25%
B - Good 43% 45% 43% 44% 43% 35%
C - Average 22% 23% 25% 25% 17% 27%
D - Poor 4% 5% 5% 4% 6% 7%
F - Failing 1% 2% 2% 2% 1% 3%
Unsure 3% 1% 3% 2% 2% 2%
Refused 0% 0% 0% 0% 0% 0%
Total 2202 588 628 729 787 556
OSI/RWJF: NM Surprise Medical Billing Study
24
Q15. Over the PAST TWO YEARS, how many times were you or anyone else covered
by your policy in the Emergency Room or hospitalized?
US OH FL TX CA NM
0 55% 47% 59% 56% 58% 57%
1 21% 23% 20% 23% 21% 23%
2 10% 13% 10% 7% 9% 11%
3 5% 6% 3% 3% 4% 3%
4 2% 2% 1% 1% 1% 3%
5 or more 2% 4% 1% 2% 1% 1%
Not applicable 5% 6% 5% 8% 6% 0%
Refused 0% 0% 0% 0% 0% 0%
Total 2202 588 628 729 787 556
Q16. Over the PAST TWO YEARS, how many times did you or anyone else covered
by your policy have surgery?
US OH FL TX CA NM
0 68% 63% 71% 64% 68% 70%
1 17% 21% 18% 19% 18% 20%
2 6% 6% 4% 7% 6% 8%
3 2% 2% 2% 2% 1% 1%
4 1% 1% 0% 0% 0% 0%
5 or more 0% 1% 0% 0% 0% 1%
Not applicable 5% 6% 5% 7% 6% 0%
Refused 0% 0% 0% 0% 1% 0%
Total 2202 588 628 729 787 553
OSI/RWJF: NM Surprise Medical Billing Study
25
Q17. How likely are you to complain about an unexpected medical bill?
US OH FL TX CA NM
Very likely 31% 29% 38% 37% 37% 46%
Somewhat likely 31% 32% 28% 30% 25% 18%
Likely complain 62% 62% 66% 67% 62% 14%
Not Likely 30% 33% 26% 28% 29% 20%
Unsure 7% 6% 8% 5% 8% 3%
Refused 0% 0% 0% 0% 0% 0%
Total 2202 588 628 729 787 553
Q18. In the PAST TWO YEARS, which, if any, problems did you or anyone else
covered by your policy have with your main health insurer related to…?
US OH FL TX CA NM
Had any problem 37% 38% 35% 40% 37% *
Billing or payment for medical
services 17% 21% 15% 19% 14% 36%
A problem with health services my
plan does or does not cover 9% 10% 12% 12% 10% 25%
A coverage denial 9% 9% 8% 9% 6% 17%
Not being able to get the specific
medication I need 7% 6% 9% 8% 5% 16%
Difficulty getting an appointment
with a doctor 6% 4% 6% 5% 10% 24%
Difficulty getting someone from the
plan on the phone to answer my
questions
5% 6% 5% 4% 6% 10%
Being forced to change doctors or
my doctor being dropped from the
plan
4% 4% 8% 4% 5% 12%
Administrators or other plan staff
being insensitive or not helpful 3% 5% 3% 3% 4% 7%
A problem with a listing in the plan's
provider directory 3% 3% 4% 3% 5% 8%
Delays in receiving care or treatment 3% 1% 2% 2% 6% 12%
Difficulty getting referrals to see a
medical specialist 2% 1% 2% 2% 6% 7%
Other 2% 1% 3% 3% 2% 7%
OSI/RWJF: NM Surprise Medical Billing Study
26
None of the above 63% 62% 65% 58% 61% 32%
Refused 1% 1% 0% 2% 2% 0%
Total 2202 588 628 729 787 1172
*Multiple responses allowed
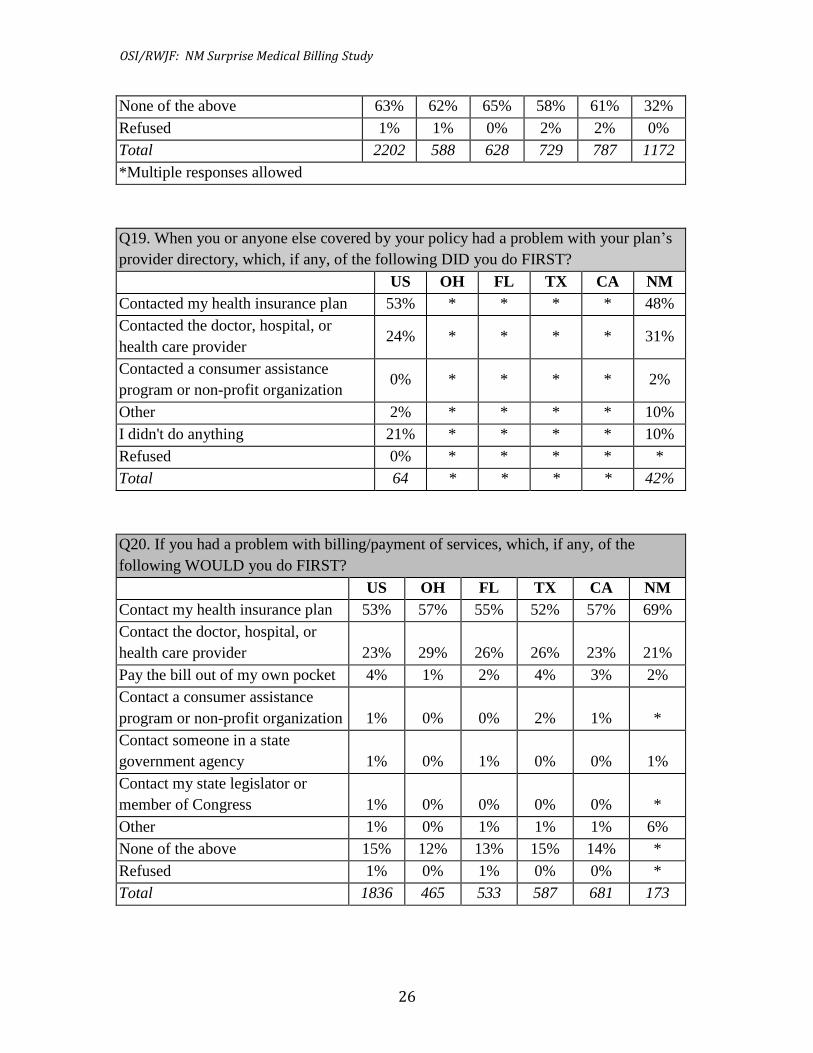
Q19. When you or anyone else covered by your policy had a problem with your plan’s
provider directory, which, if any, of the following DID you do FIRST?
US OH FL TX CA NM
Contacted my health insurance plan 53% * * * * 48%
Contacted the doctor, hospital, or
health care provider 24% * * * * 31%
Contacted a consumer assistance
program or non-profit organization 0% * * * * 2%
Other 2% * * * * 10%
I didn't do anything 21% * * * * 10%
Refused 0% * * * * *
Total 64 * * * * 42%
Q20. If you had a problem with billing/payment of services, which, if any, of the
following WOULD you do FIRST?
US OH FL TX CA NM
Contact my health insurance plan 53% 57% 55% 52% 57% 69%
Contact the doctor, hospital, or
health care provider 23% 29% 26% 26% 23% 21%
Pay the bill out of my own pocket 4% 1% 2% 4% 3% 2%
Contact a consumer assistance
program or non-profit organization 1% 0% 0% 2% 1% *
Contact someone in a state
government agency 1% 0% 1% 0% 0% 1%
Contact my state legislator or
member of Congress 1% 0% 0% 0% 0% *
Other 1% 0% 1% 1% 1% 6%
None of the above 15% 12% 13% 15% 14% *
Refused 1% 0% 1% 0% 0% *
Total 1836 465 533 587 681 173

OSI/RWJF: NM Surprise Medical Billing Study
27
Q21. When you (or anyone else covered by your policy) had a problem with
billing/payment of services, which, if any, of the following DID you do FIRST?
US OH FL TX CA NM
Contacted my health insurance
plan 46% 45% 43% 43% 52% 49%
Contacted the doctor, hospital, or
health care provider 31% 33% 39% 33% 25% 26%
Paid the bill out of my own pocket 14% 12% 8% 15% 10% 11%
Contacted a consumer assistance
program or non-profit
organization 1% 3% 0% 1% 3% 0%
Contacted someone in a state
government agency 0% 2% 0% 0% 0% 0%
Other 1% 0% 1% 2% 2% 2%
None of the above 7% 5% 8% 5% 6% 11%
Refused 0% 0% 0% 0% 0% 1%
Total 366 123 95 142 106 374
Q22. How often do you review your medical bills from visits to doctors, hospitals, or
other health care providers?
US OH FL TX CA NM
Review bills sometimes or more 87% 90% 91% 90% 81% 97%
Always 59% 66% 60% 61% 54% 74%
Often 15% 15% 17% 18% 14% 16%
Sometimes 12% 9% 14% 11% 13% 7%
Rarely 9% 7% 8% 7% 15% 3%
Unsure 4% 3% 1% 2% 3% 1%
Refused 0% 0% 0% 0% 1% 0%
Total 2202 588 628 729 787 555
OSI/RWJF: NM Surprise Medical Billing Study
28
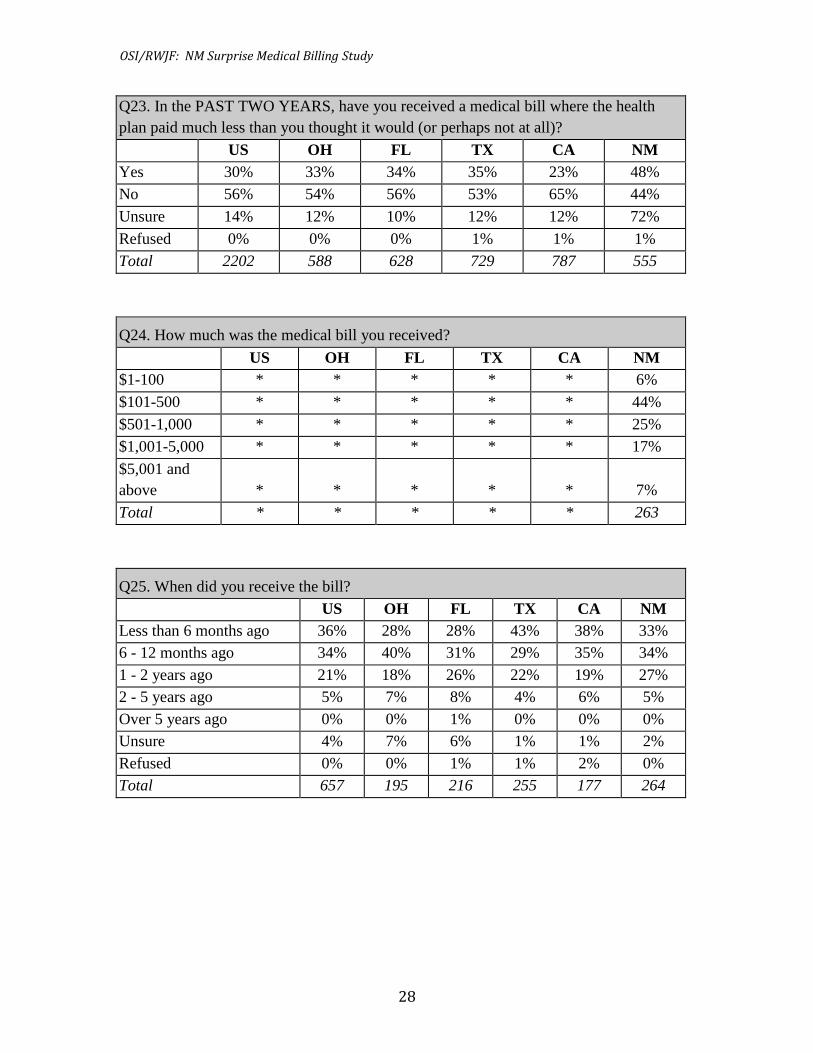
Q23. In the PAST TWO YEARS, have you received a medical bill where the health
plan paid much less than you thought it would (or perhaps not at all)?
US OH FL TX CA NM
Yes 30% 33% 34% 35% 23% 48%
No 56% 54% 56% 53% 65% 44%
Unsure 14% 12% 10% 12% 12% 72%
Refused 0% 0% 0% 1% 1% 1%
Total 2202 588 628 729 787 555
Q24. How much was the medical bill you received?
US OH FL TX CA NM
$1-100 * * * * * 6%
$101-500 * * * * * 44%
$501-1,000 * * * * * 25%
$1,001-5,000 * * * * * 17%
$5,001 and
above * * * * * 7%
Total * * * * * 263
Q25. When did you receive the bill?
US OH FL TX CA NM
Less than 6 months ago 36% 28% 28% 43% 38% 33%
6 - 12 months ago 34% 40% 31% 29% 35% 34%
1 - 2 years ago 21% 18% 26% 22% 19% 27%
2 - 5 years ago 5% 7% 8% 4% 6% 5%
Over 5 years ago 0% 0% 1% 0% 0% 0%
Unsure 4% 7% 6% 1% 1% 2%
Refused 0% 0% 1% 1% 2% 0%
Total 657 195 216 255 177 264
OSI/RWJF: NM Surprise Medical Billing Study
29
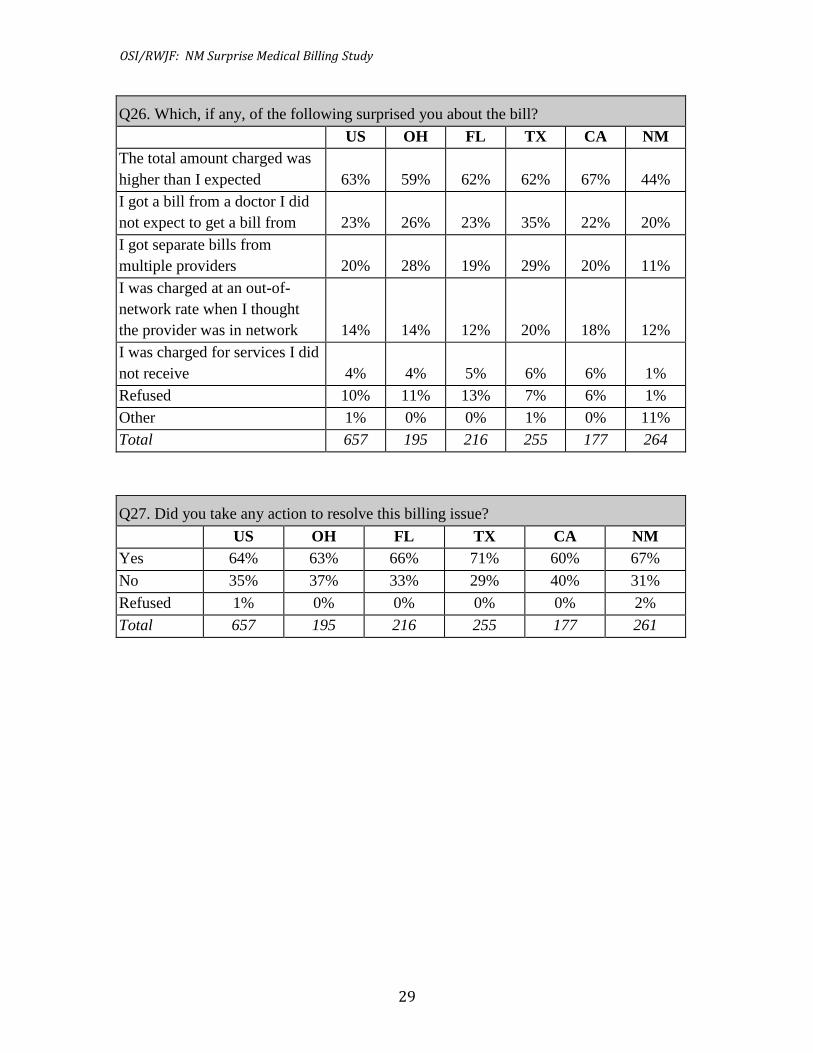
Q26. Which, if any, of the following surprised you about the bill?
US OH FL TX CA NM
The total amount charged was
higher than I expected 63% 59% 62% 62% 67% 44%
I got a bill from a doctor I did
not expect to get a bill from 23% 26% 23% 35% 22% 20%
I got separate bills from
multiple providers 20% 28% 19% 29% 20% 11%
I was charged at an out-of-
network rate when I thought
the provider was in network 14% 14% 12% 20% 18% 12%
I was charged for services I did
not receive 4% 4% 5% 6% 6% 1%
Refused 10% 11% 13% 7% 6% 1%
Other 1% 0% 0% 1% 0% 11%
Total 657 195 216 255 177 264
Q27. Did you take any action to resolve this billing issue?
US OH FL TX CA NM
Yes 64% 63% 66% 71% 60% 67%
No 35% 37% 33% 29% 40% 31%
Refused 1% 0% 0% 0% 0% 2%
Total 657 195 216 255 177 261
OSI/RWJF: NM Surprise Medical Billing Study
30
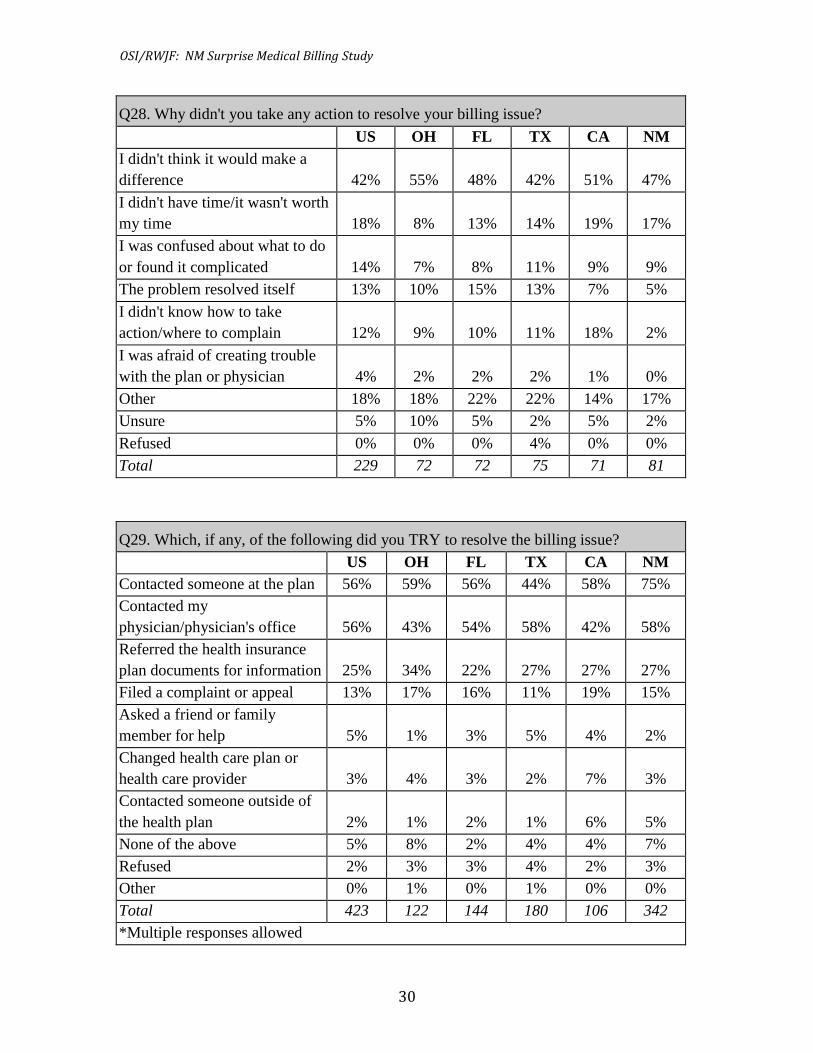
Q28. Why didn't you take any action to resolve your billing issue?
US OH FL TX CA NM
I didn't think it would make a
difference 42% 55% 48% 42% 51% 47%
I didn't have time/it wasn't worth
my time 18% 8% 13% 14% 19% 17%
I was confused about what to do
or found it complicated 14% 7% 8% 11% 9% 9%
The problem resolved itself 13% 10% 15% 13% 7% 5%
I didn't know how to take
action/where to complain 12% 9% 10% 11% 18% 2%
I was afraid of creating trouble
with the plan or physician 4% 2% 2% 2% 1% 0%
Other 18% 18% 22% 22% 14% 17%
Unsure 5% 10% 5% 2% 5% 2%
Refused 0% 0% 0% 4% 0% 0%
Total 229 72 72 75 71 81
Q29. Which, if any, of the following did you TRY to resolve the billing issue?
US OH FL TX CA NM
Contacted someone at the plan 56% 59% 56% 44% 58% 75%
Contacted my
physician/physician's office 56% 43% 54% 58% 42% 58%
Referred the health insurance
plan documents for information 25% 34% 22% 27% 27% 27%
Filed a complaint or appeal 13% 17% 16% 11% 19% 15%
Asked a friend or family
member for help 5% 1% 3% 5% 4% 2%
Changed health care plan or
health care provider 3% 4% 3% 2% 7% 3%
Contacted someone outside of
the health plan 2% 1% 2% 1% 6% 5%
None of the above 5% 8% 2% 4% 4% 7%
Refused 2% 3% 3% 4% 2% 3%
Other 0% 1% 0% 1% 0% 0%
Total 423 122 144 180 106 342
*Multiple responses allowed
OSI/RWJF: NM Surprise Medical Billing Study
31
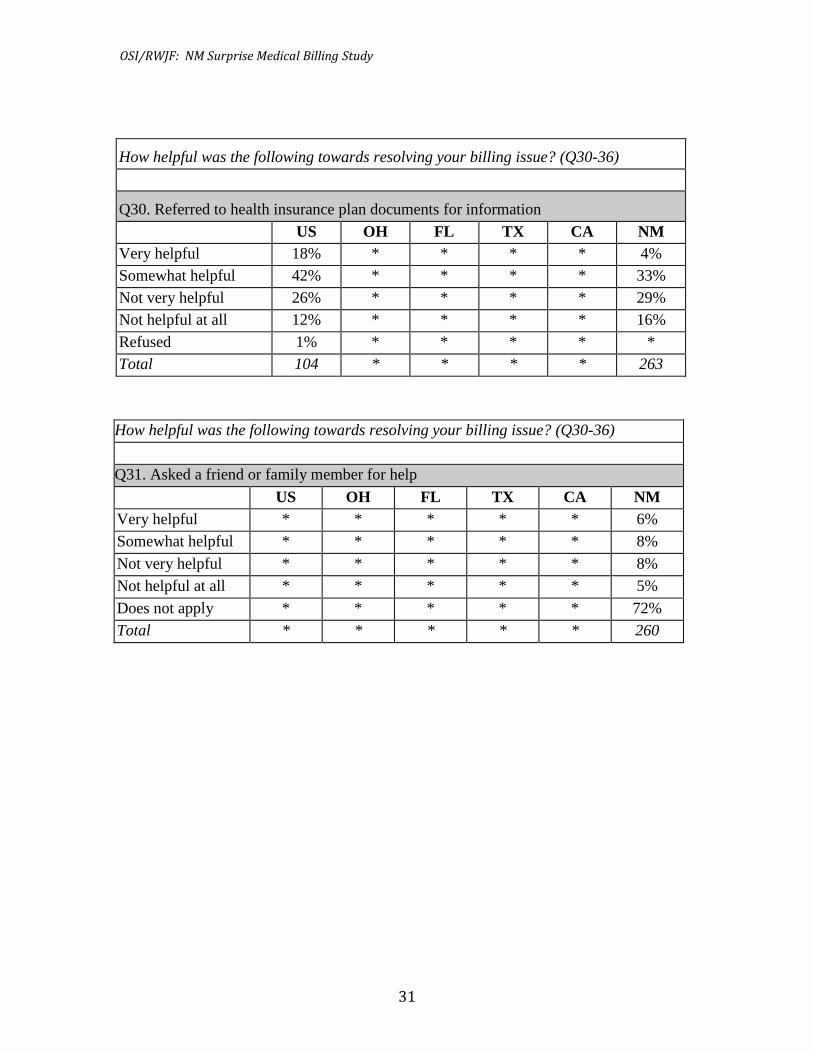
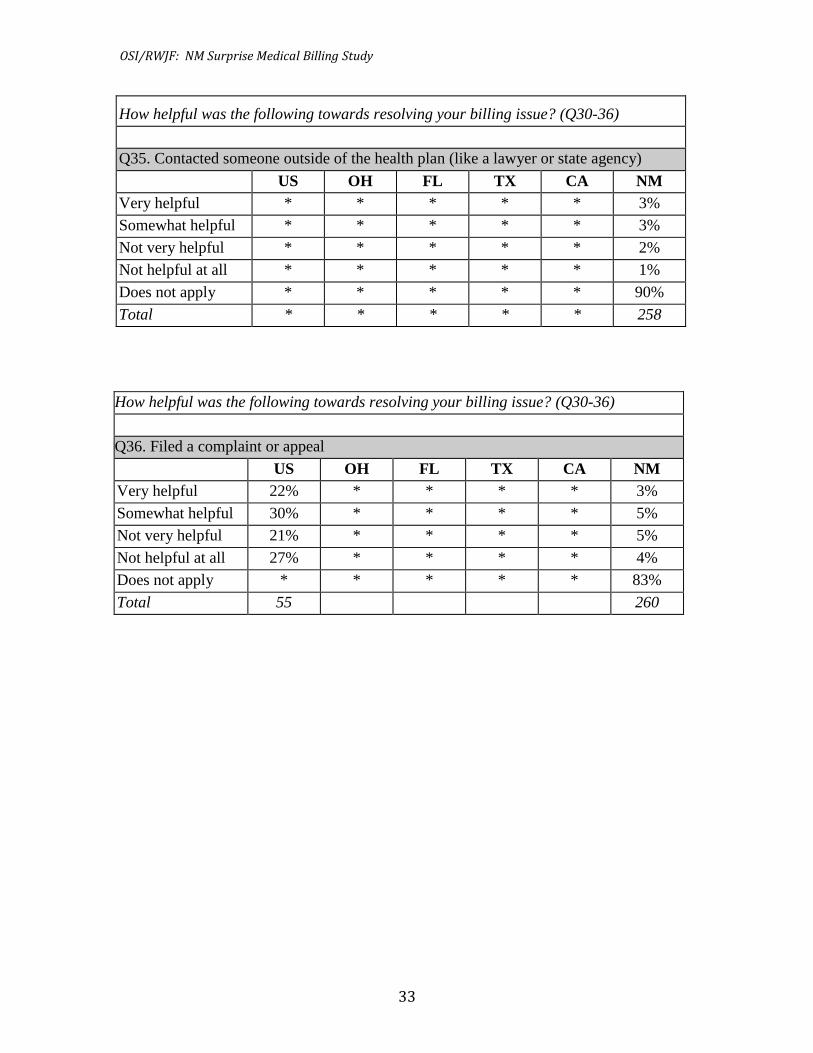
How helpful was the following towards resolving your billing issue? (Q30-36)
Q30. Referred to health insurance plan documents for information
US OH FL TX CA NM
Very helpful 18% * * * * 4%
Somewhat helpful 42% * * * * 33%
Not very helpful 26% * * * * 29%
Not helpful at all 12% * * * * 16%
Refused 1% * * * * *
Total 104 * * * * 263
How helpful was the following towards resolving your billing issue? (Q30-36)
Q31. Asked a friend or family member for help
US OH FL TX CA NM
Very helpful * * * * * 6%
Somewhat helpful * * * * * 8%
Not very helpful * * * * * 8%
Not helpful at all * * * * * 5%
Does not apply * * * * * 72%
Total * * * * * 260
OSI/RWJF: NM Surprise Medical Billing Study
32
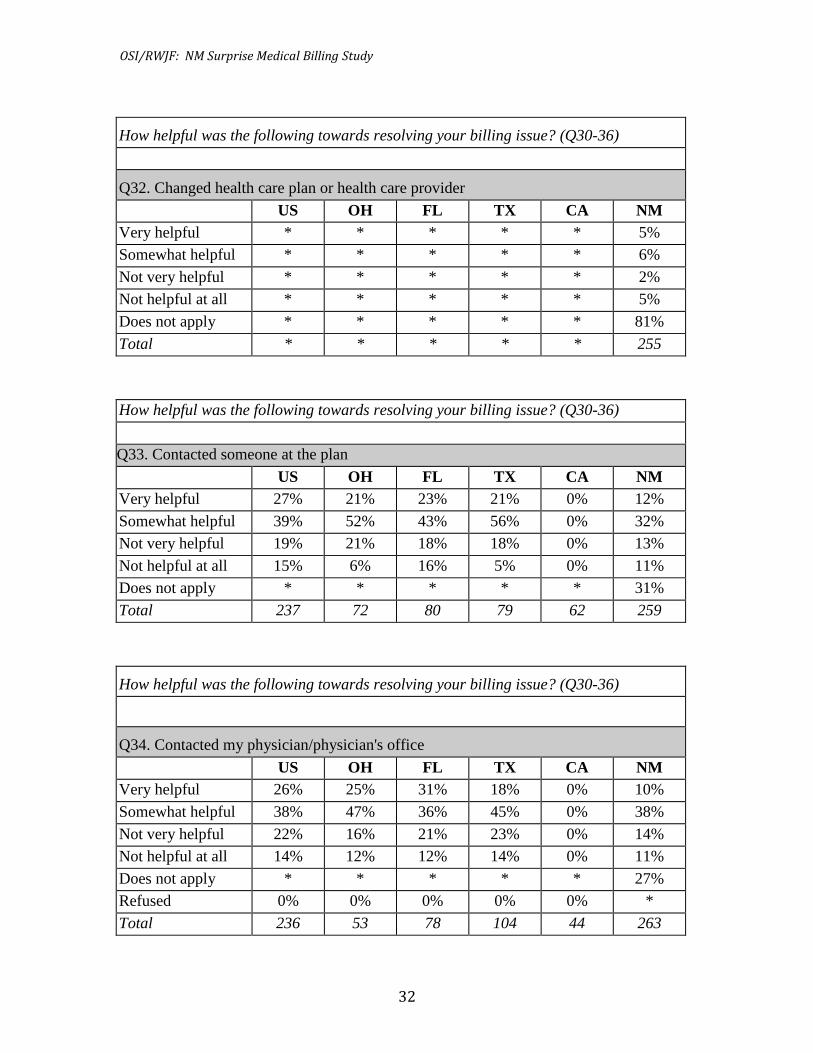
How helpful was the following towards resolving your billing issue? (Q30-36)
Q32. Changed health care plan or health care provider
US OH FL TX CA NM
Very helpful * * * * * 5%
Somewhat helpful * * * * * 6%
Not very helpful * * * * * 2%
Not helpful at all * * * * * 5%
Does not apply * * * * * 81%
Total * * * * * 255
How helpful was the following towards resolving your billing issue? (Q30-36)
Q33. Contacted someone at the plan
US OH FL TX CA NM
Very helpful 27% 21% 23% 21% 0% 12%
Somewhat helpful 39% 52% 43% 56% 0% 32%
Not very helpful 19% 21% 18% 18% 0% 13%
Not helpful at all 15% 6% 16% 5% 0% 11%
Does not apply * * * * * 31%
Total 237 72 80 79 62 259
How helpful was the following towards resolving your billing issue? (Q30-36)
Q34. Contacted my physician/physician's office
US OH FL TX CA NM
Very helpful 26% 25% 31% 18% 0% 10%
Somewhat helpful 38% 47% 36% 45% 0% 38%
Not very helpful 22% 16% 21% 23% 0% 14%
Not helpful at all 14% 12% 12% 14% 0% 11%
Does not apply * * * * * 27%
Refused 0% 0% 0% 0% 0% *
Total 236 53 78 104 44 263
OSI/RWJF: NM Surprise Medical Billing Study
33
How helpful was the following towards resolving your billing issue? (Q30-36)
Q35. Contacted someone outside of the health plan (like a lawyer or state agency)
US OH FL TX CA NM
Very helpful * * * * * 3%
Somewhat helpful * * * * * 3%
Not very helpful * * * * * 2%
Not helpful at all * * * * * 1%
Does not apply * * * * * 90%
Total * * * * * 258
How helpful was the following towards resolving your billing issue? (Q30-36)
Q36. Filed a complaint or appeal
US OH FL TX CA NM
Very helpful 22% * * * * 3%
Somewhat helpful 30% * * * * 5%
Not very helpful 21% * * * * 5%
Not helpful at all 27% * * * * 4%
Does not apply * * * * * 83%
Total 55 260
OSI/RWJF: NM Surprise Medical Billing Study
34
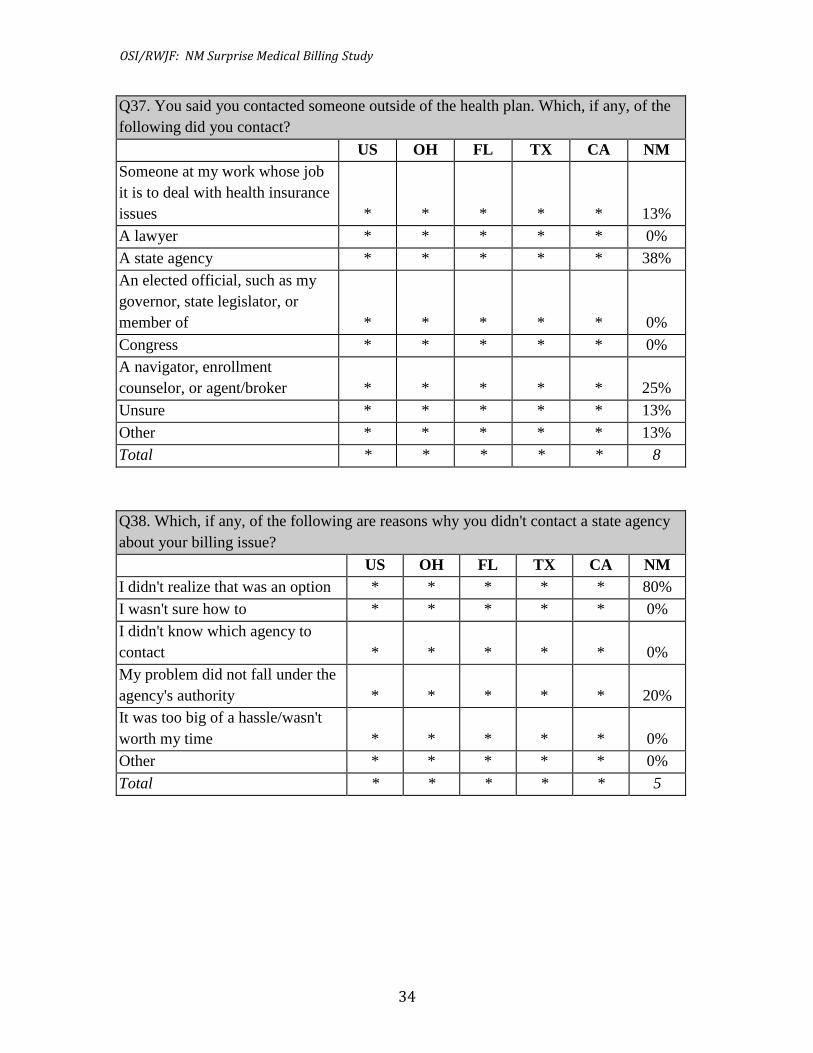
Q37. You said you contacted someone outside of the health plan. Which, if any, of the
following did you contact?
US OH FL TX CA NM
Someone at my work whose job
it is to deal with health insurance
issues * * * * * 13%
A lawyer * * * * * 0%
A state agency * * * * * 38%
An elected official, such as my
governor, state legislator, or
member of * * * * * 0%
Congress * * * * * 0%
A navigator, enrollment
counselor, or agent/broker * * * * * 25%
Unsure * * * * * 13%
Other * * * * * 13%
Total * * * * * 8
Q38. Which, if any, of the following are reasons why you didn't contact a state agency
about your billing issue?
US OH FL TX CA NM
I didn't realize that was an option * * * * * 80%
I wasn't sure how to * * * * * 0%
I didn't know which agency to
contact * * * * * 0%
My problem did not fall under the
agency's authority * * * * * 20%
It was too big of a hassle/wasn't
worth my time * * * * * 0%
Other * * * * * 0%
Total * * * * * 5
OSI/RWJF: NM Surprise Medical Billing Study
35
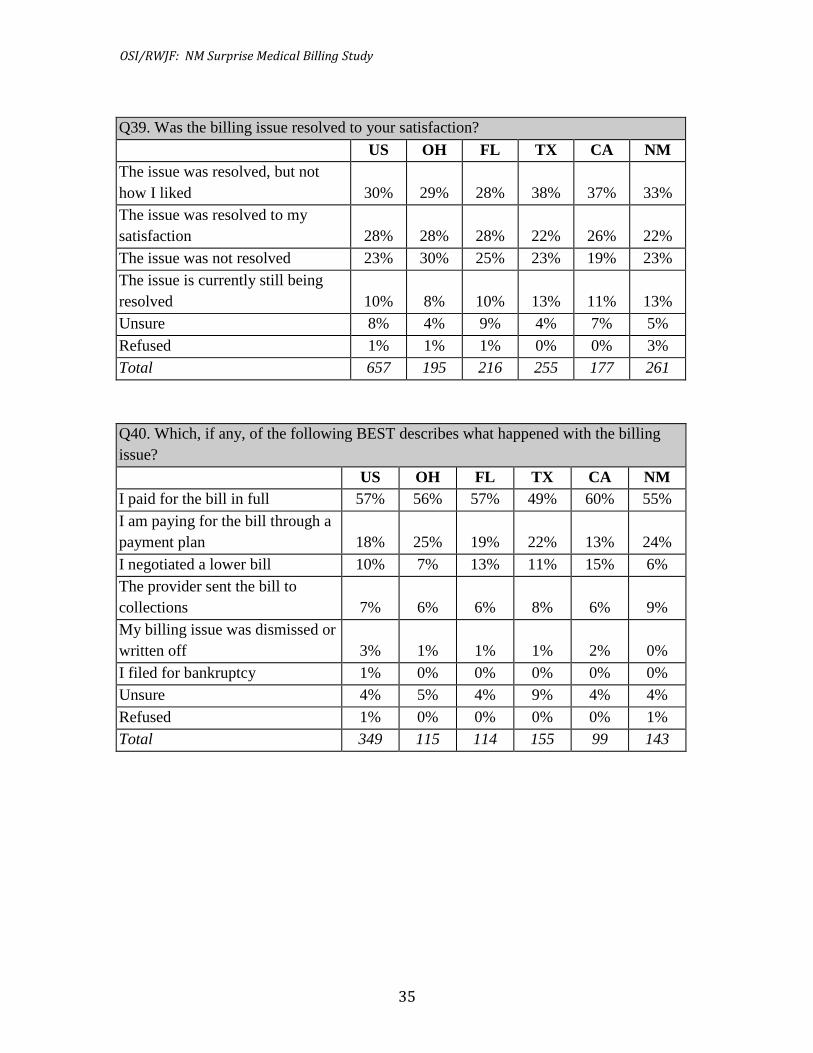
Q39. Was the billing issue resolved to your satisfaction?
US OH FL TX CA NM
The issue was resolved, but not
how I liked 30% 29% 28% 38% 37% 33%
The issue was resolved to my
satisfaction 28% 28% 28% 22% 26% 22%
The issue was not resolved 23% 30% 25% 23% 19% 23%
The issue is currently still being
resolved 10% 8% 10% 13% 11% 13%
Unsure 8% 4% 9% 4% 7% 5%
Refused 1% 1% 1% 0% 0% 3%
Total 657 195 216 255 177 261
Q40. Which, if any, of the following BEST describes what happened with the billing
issue?
US OH FL TX CA NM
I paid for the bill in full 57% 56% 57% 49% 60% 55%
I am paying for the bill through a
payment plan 18% 25% 19% 22% 13% 24%
I negotiated a lower bill 10% 7% 13% 11% 15% 6%
The provider sent the bill to
collections 7% 6% 6% 8% 6% 9%
My billing issue was dismissed or
written off 3% 1% 1% 1% 2% 0%
I filed for bankruptcy 1% 0% 0% 0% 0% 0%
Unsure 4% 5% 4% 9% 4% 4%
Refused 1% 0% 0% 0% 0% 1%
Total 349 115 114 155 99 143
OSI/RWJF: NM Surprise Medical Billing Study
36
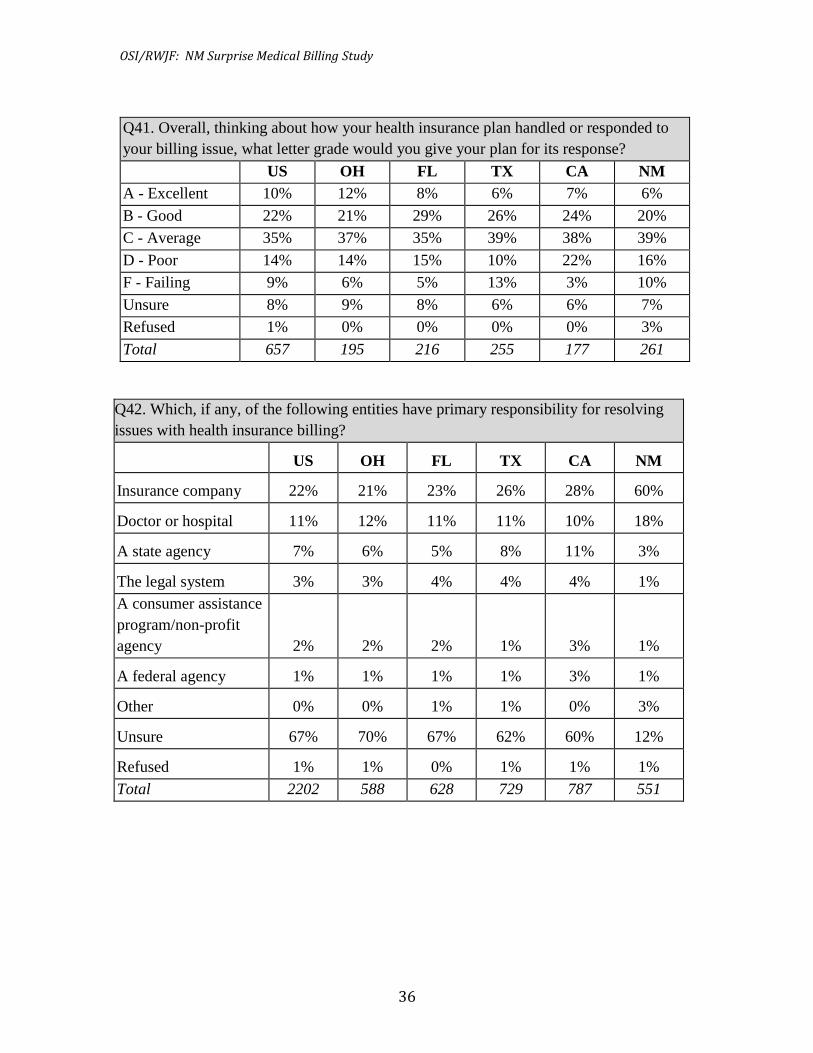
Q41. Overall, thinking about how your health insurance plan handled or responded to
your billing issue, what letter grade would you give your plan for its response?
US OH FL TX CA NM
A - Excellent 10% 12% 8% 6% 7% 6%
B - Good 22% 21% 29% 26% 24% 20%
C - Average 35% 37% 35% 39% 38% 39%
D - Poor 14% 14% 15% 10% 22% 16%
F - Failing 9% 6% 5% 13% 3% 10%
Unsure 8% 9% 8% 6% 6% 7%
Refused 1% 0% 0% 0% 0% 3%
Total 657 195 216 255 177 261
Q42. Which, if any, of the following entities have primary responsibility for resolving
issues with health insurance billing?
US OH FL TX CA NM
Insurance company 22% 21% 23% 26% 28% 60%
Doctor or hospital 11% 12% 11% 11% 10% 18%
A state agency 7% 6% 5% 8% 11% 3%
The legal system 3% 3% 4% 4% 4% 1%
A consumer assistance
program/non-profit
agency 2% 2% 2% 1% 3% 1%
A federal agency 1% 1% 1% 1% 3% 1%
Other 0% 0% 1% 1% 0% 3%
Unsure 67% 70% 67% 62% 60% 12%
Refused 1% 1% 0% 1% 1% 1%
Total 2202 588 628 729 787 551
OSI/RWJF: NM Surprise Medical Billing Study
37
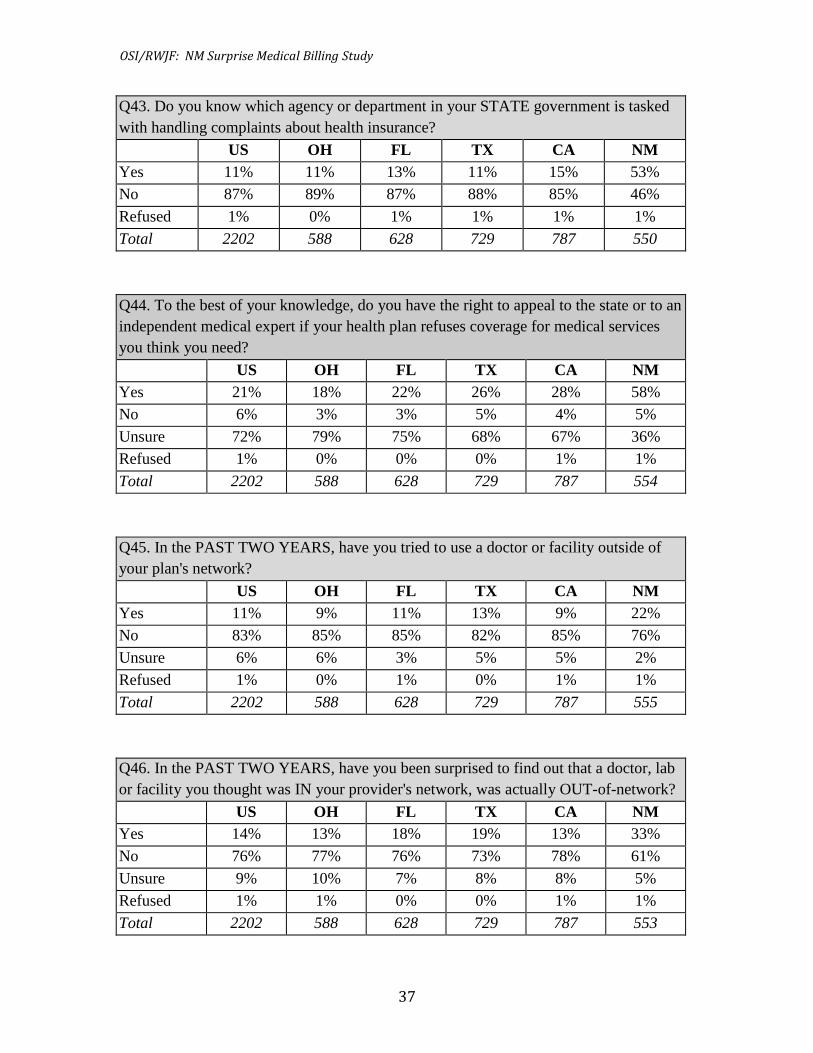
Q43. Do you know which agency or department in your STATE government is tasked
with handling complaints about health insurance?
US OH FL TX CA NM
Yes 11% 11% 13% 11% 15% 53%
No 87% 89% 87% 88% 85% 46%
Refused 1% 0% 1% 1% 1% 1%
Total 2202 588 628 729 787 550
Q44. To the best of your knowledge, do you have the right to appeal to the state or to an
independent medical expert if your health plan refuses coverage for medical services
you think you need?
US OH FL TX CA NM
Yes 21% 18% 22% 26% 28% 58%
No 6% 3% 3% 5% 4% 5%
Unsure 72% 79% 75% 68% 67% 36%
Refused 1% 0% 0% 0% 1% 1%
Total 2202 588 628 729 787 554
Q45. In the PAST TWO YEARS, have you tried to use a doctor or facility outside of
your plan's network?
US OH FL TX CA NM
Yes 11% 9% 11% 13% 9% 22%
No 83% 85% 85% 82% 85% 76%
Unsure 6% 6% 3% 5% 5% 2%
Refused 1% 0% 1% 0% 1% 1%
Total 2202 588 628 729 787 555
Q46. In the PAST TWO YEARS, have you been surprised to find out that a doctor, lab
or facility you thought was IN your provider's network, was actually OUT-of-network?
US OH FL TX CA NM
Yes 14% 13% 18% 19% 13% 33%
No 76% 77% 76% 73% 78% 61%
Unsure 9% 10% 7% 8% 8% 5%
Refused 1% 1% 0% 0% 1% 1%
Total 2202 588 628 729 787 553
OSI/RWJF: NM Surprise Medical Billing Study
38
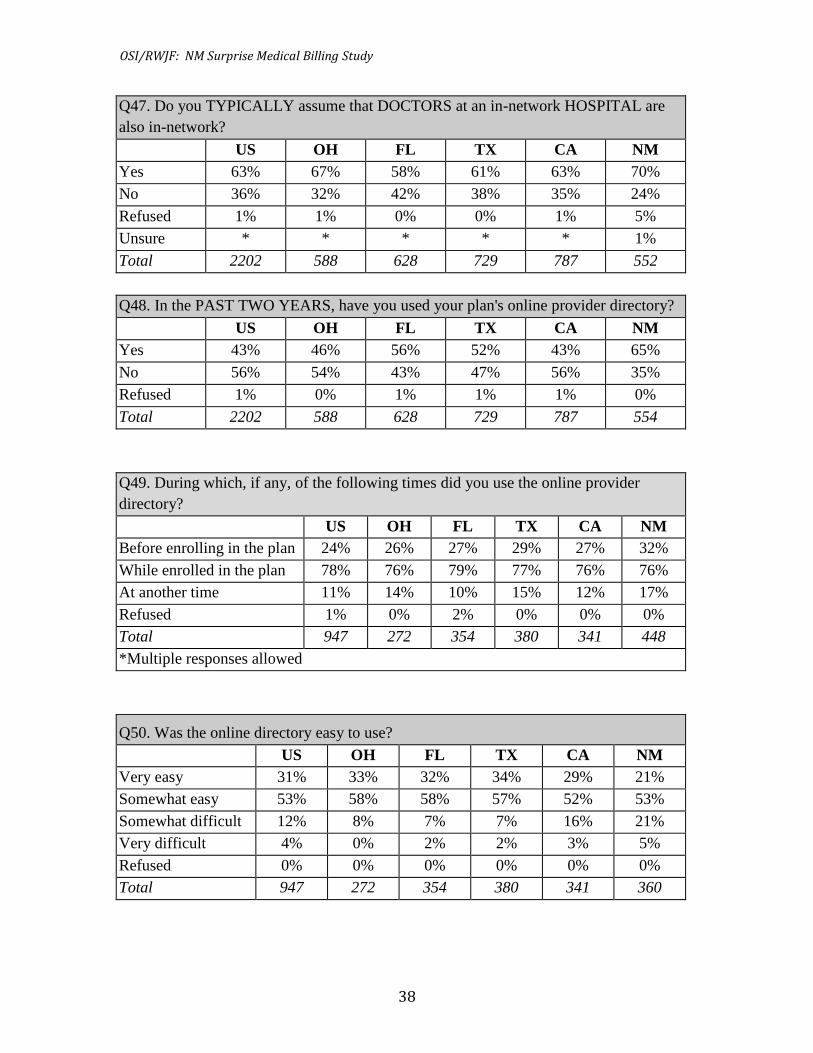
Q47. Do you TYPICALLY assume that DOCTORS at an in-network HOSPITAL are
also in-network?
US OH FL TX CA NM
Yes 63% 67% 58% 61% 63% 70%
No 36% 32% 42% 38% 35% 24%
Refused 1% 1% 0% 0% 1% 5%
Unsure * * * * * 1%
Total 2202 588 628 729 787 552
Q48. In the PAST TWO YEARS, have you used your plan's online provider directory?
US OH FL TX CA NM
Yes 43% 46% 56% 52% 43% 65%
No 56% 54% 43% 47% 56% 35%
Refused 1% 0% 1% 1% 1% 0%
Total 2202 588 628 729 787 554
Q49. During which, if any, of the following times did you use the online provider
directory?
US OH FL TX CA NM
Before enrolling in the plan 24% 26% 27% 29% 27% 32%
While enrolled in the plan 78% 76% 79% 77% 76% 76%
At another time 11% 14% 10% 15% 12% 17%
Refused 1% 0% 2% 0% 0% 0%
Total 947 272 354 380 341 448
*Multiple responses allowed
Q50. Was the online directory easy to use?
US OH FL TX CA NM
Very easy 31% 33% 32% 34% 29% 21%
Somewhat easy 53% 58% 58% 57% 52% 53%
Somewhat difficult 12% 8% 7% 7% 16% 21%
Very difficult 4% 0% 2% 2% 3% 5%
Refused 0% 0% 0% 0% 0% 0%
Total 947 272 354 380 341 360
OSI/RWJF: NM Surprise Medical Billing Study
39
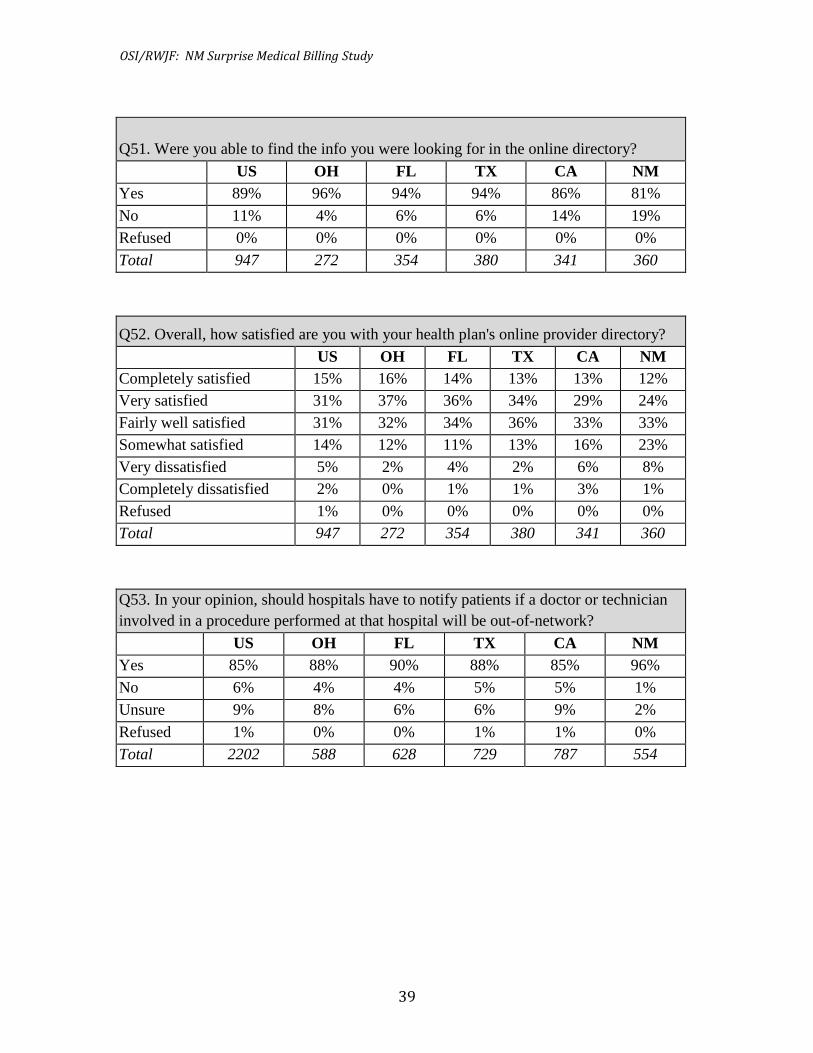
Q51. Were you able to find the info you were looking for in the online directory?
US OH FL TX CA NM
Yes 89% 96% 94% 94% 86% 81%
No 11% 4% 6% 6% 14% 19%
Refused 0% 0% 0% 0% 0% 0%
Total 947 272 354 380 341 360
Q52. Overall, how satisfied are you with your health plan's online provider directory?
US OH FL TX CA NM
Completely satisfied 15% 16% 14% 13% 13% 12%
Very satisfied 31% 37% 36% 34% 29% 24%
Fairly well satisfied 31% 32% 34% 36% 33% 33%
Somewhat satisfied 14% 12% 11% 13% 16% 23%
Very dissatisfied 5% 2% 4% 2% 6% 8%
Completely dissatisfied 2% 0% 1% 1% 3% 1%
Refused 1% 0% 0% 0% 0% 0%
Total 947 272 354 380 341 360
Q53. In your opinion, should hospitals have to notify patients if a doctor or technician
involved in a procedure performed at that hospital will be out-of-network?
US OH FL TX CA NM
Yes 85% 88% 90% 88% 85% 96%
No 6% 4% 4% 5% 5% 1%
Unsure 9% 8% 6% 6% 9% 2%
Refused 1% 0% 0% 1% 1% 0%
Total 2202 588 628 729 787 554
OSI/RWJF: NM Surprise Medical Billing Study
40
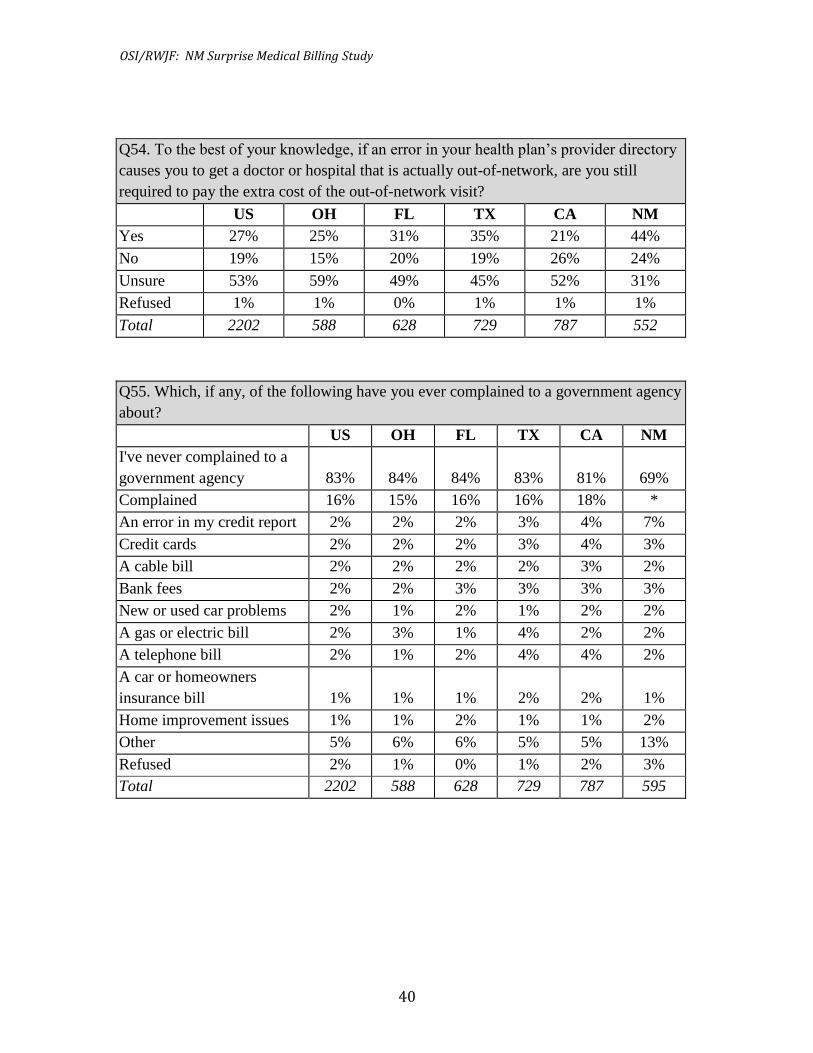
Q54. To the best of your knowledge, if an error in your health plan’s provider directory
causes you to get a doctor or hospital that is actually out-of-network, are you still
required to pay the extra cost of the out-of-network visit?
US OH FL TX CA NM
Yes 27% 25% 31% 35% 21% 44%
No 19% 15% 20% 19% 26% 24%
Unsure 53% 59% 49% 45% 52% 31%
Refused 1% 1% 0% 1% 1% 1%
Total 2202 588 628 729 787 552
Q55. Which, if any, of the following have you ever complained to a government agency
about?
US OH FL TX CA NM
I've never complained to a
government agency 83% 84% 84% 83% 81% 69%
Complained 16% 15% 16% 16% 18% *
An error in my credit report 2% 2% 2% 3% 4% 7%
Credit cards 2% 2% 2% 3% 4% 3%
A cable bill 2% 2% 2% 2% 3% 2%
Bank fees 2% 2% 3% 3% 3% 3%
New or used car problems 2% 1% 2% 1% 2% 2%
A gas or electric bill 2% 3% 1% 4% 2% 2%
A telephone bill 2% 1% 2% 4% 4% 2%
A car or homeowners
insurance bill 1% 1% 1% 2% 2% 1%
Home improvement issues 1% 1% 2% 1% 1% 2%
Other 5% 6% 6% 5% 5% 13%
Refused 2% 1% 0% 1% 2% 3%
Total 2202 588 628 729 787 595