Embed Size (px)
Citation preview
1
SURPLUS ENERGY ECONOMICS
Interpreting the post-growth economy
Tim Morgan
March 2018
2
Note
This report presents an examination of the world economy undertaken using the principles of Surplus Energy
Economics (SEE), as applied by the Surplus Energy Economics Data System (SEEDS).
Part One is a review of the current situation and outlook.
Part Two explains some of the methods used, including a brief description of the principles of Surplus Energy
Economics
Disclaimer and copyright
This report is intended for those interested in economics and related issues. It does not constitute investment advice,
and must not be used for this purpose.
Though information contained here is believed to be accurate, its accuracy is not guaranteed. No liability of any kind
can be accepted for any consequences arising from use of material contained in this document.
This document is copyright, but permission is given for brief quotation from it, provided that attribution is given.
Further information can be obtained at https://surplusenergyeconomics.wordpress.com/

3
Interpreting the post-growth economy A SURPLUS ENERGY ECONOMICS ANALYSIS
Part One – review
This report uses Surplus Energy Economics (SEE) to explore the outlook for the world
economy. Part One sets out an overview, and some of the methods used are discussed
in more detail in Part Two. Data is sourced from SEEDS (the Surplus Energy Economics
Data System).
It concludes that, worldwide, the long years of growing prosperity are over, a change
which invalidates many things that government, business and the public have always
taken for granted.
The reason why growth in prosperity is over is that we no longer have access to
abundant cheap energy. Where geographical expansion and economies of scale once
drove down the cost of accessing energy, the driving factor now is depletion, which is
pushing costs upwards, and is doing so exponentially. The relevant cost here is the
amount of energy consumed in the process of accessing any given quantity of energy.
This cost is known as the Energy Cost of Energy (ECoE).
Though no abrupt plunge in global prosperity is on the cards, there is scant comfort in
that. Prosperity in most Western developed economies has already passed its peak.
Economic and financial systems are extremely vulnerable to shocks, because they are
predicated on perpetual growth.
Thus far, and in spite of all the accumulating evidence, we have failed to recognise that
growth in prosperity is over. Rather, we’ve tried to delude ourselves, by using debt – and,
latterly, ultra-cheap money as well - to pretend that perpetual growth remains alive and
well. In themselves, these expedients are harmful in ways that can be managed.
Efficiency is being undermined by keeping sub-viable entities afloat, and a major crash in
asset values has become an inevitably.
Neither of these problems is existential in itself. But changes are happening, too, in ways
that are fundamental. A system dependent on ever-growing consumption and ever-
increasing profitability is becoming invalidated. The very concept of debt is becoming
untenable, because the process depends on growth in borrowers’ prosperity, something
which is no longer happening.
These effects have profound political and social as well as economic and financial
implications. As growth unwinds, so does tolerance of inequality. That’s a major reason
why “populists” have enjoyed an ascendancy, at the expense of incumbencies unaware
of the profound changes being caused by the deterioration of prosperity. Trends currently
favouring political outsiders may next prompt a renaissance of the collectivist Left.
The dangers of complacency
Anyone already familiar with the concept of the surplus energy economy will know that
world prosperity, as measured by SEEDS, is projected broadly flat out to 2030. To put
some numbers on this, global average prosperity per person is estimated at $11,050 in
2016, and is expected to be very little changed in 2030, at $11,360 (in 2016 PPP dollars).

4
There are a lot of reasons, however, not to be lured into any form of complacency by this
flat trajectory. First, our economic system isn’t geared to stable-state, but is predicated on
perpetual expansion. That’s a huge structural problem, now that the conditions which
favoured growth in the past are breaking down. Though we can be pretty sure that the
era of meaningful growth in prosperity has ended, we cannot know how much collateral
damage will result from the challenge of trying to adapt to that change.
Second, the projected global figure for 2030 disguises a wide regional divergence of
experience. China, for example, is on the positive side of the equation. Prosperity may
not be growing at anything like the rate depicted by GDP per capita, but Chinese citizens
are continuing to become better off (see first chart below). For 2016, prosperity is
estimated at 30,800 RMB per person - roughly double the equivalent number for 2003 –
and the SEEDS projection for 2030 is 42,225 RMB, an improvement of 37%. Progress is
likely, too, in India.
But prosperity in the developed West, already in decline, is set to deteriorate steadily.
Comparing 2030 with 2016, prosperity is likely to be 7% lower in the United States, for
example, and 10% lower in Britain.
These projected declines are in addition to the deterioration that has already happened.
Prosperity has already peaked in the US (see second chart), Canada, Australia and most
European countries.
Third, and even in countries where prosperity trends are positive, current economic
policies suggest that debt, and serious deficiencies in pension provision, will both go on
growing a lot more rapidly than prosperity.
Worldwide, we’re subsidising an illusory present by cannibalising an already-uncertain
future. We’re doing this (a) by creating debt that we can’t repay, and (b) by making
ourselves pension promises that we can’t honour. So acute is this problem that our
chances of getting to 2030 without some kind of financial crash have become almost
vanishingly small.
GDP and prosperity: China GDP and prosperity: United States
5
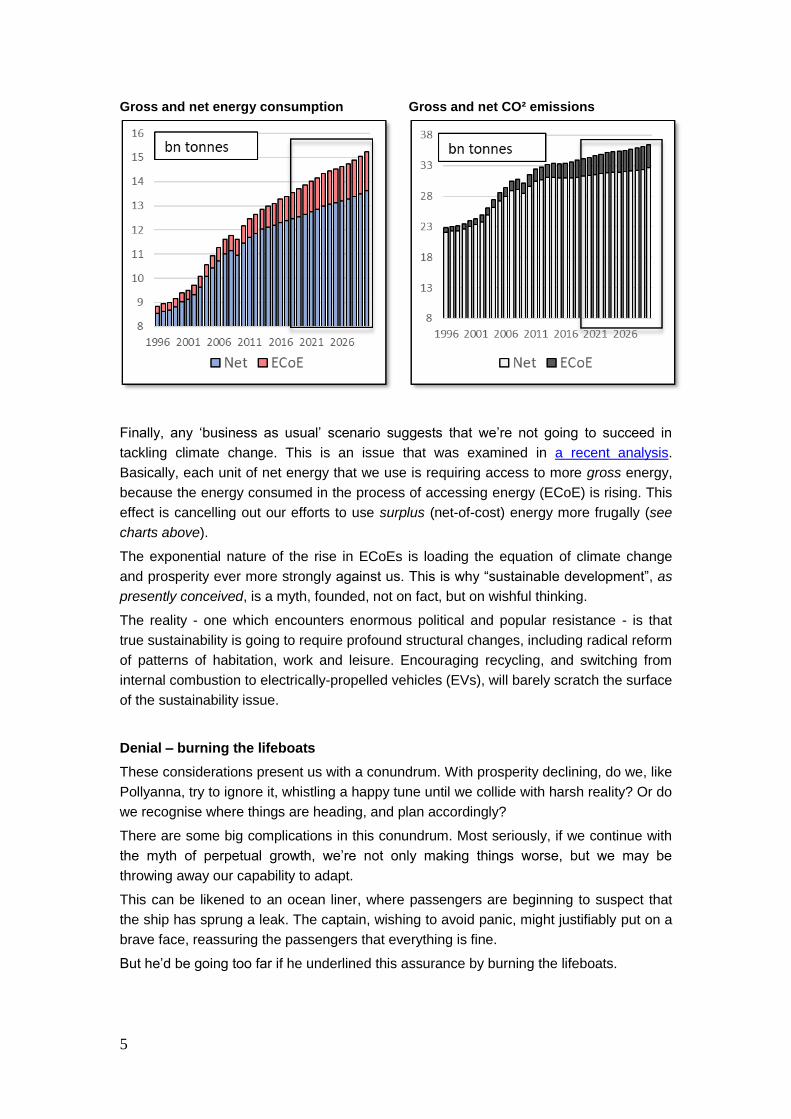
Gross and net energy consumption Gross and net CO² emissions
Finally, any ‘business as usual’ scenario suggests that we’re not going to succeed in
tackling climate change. This is an issue that was examined in a recent analysis.
Basically, each unit of net energy that we use is requiring access to more gross energy,
because the energy consumed in the process of accessing energy (ECoE) is rising. This
effect is cancelling out our efforts to use surplus (net-of-cost) energy more frugally (see
charts above).
The exponential nature of the rise in ECoEs is loading the equation of climate change
and prosperity ever more strongly against us. This is why “sustainable development”, as
presently conceived, is a myth, founded, not on fact, but on wishful thinking.
The reality - one which encounters enormous political and popular resistance - is that
true sustainability is going to require profound structural changes, including radical reform
of patterns of habitation, work and leisure. Encouraging recycling, and switching from
internal combustion to electrically-propelled vehicles (EVs), will barely scratch the surface
of the sustainability issue.
Denial – burning the lifeboats
These considerations present us with a conundrum. With prosperity declining, do we, like
Pollyanna, try to ignore it, whistling a happy tune until we collide with harsh reality? Or do
we recognise where things are heading, and plan accordingly?
There are some big complications in this conundrum. Most seriously, if we continue with
the myth of perpetual growth, we’re not only making things worse, but we may be
throwing away our capability to adapt.
This can be likened to an ocean liner, where passengers are beginning to suspect that
the ship has sprung a leak. The captain, wishing to avoid panic, might justifiably put on a
brave face, reassuring the passengers that everything is fine.
But he’d be going too far if he underlined this assurance by burning the lifeboats.

6
Electricity demand, with/without EV, TWH Electricity sources, with/without EV, TWH
The push for electric vehicles threatens to become a classic instance of burning the
lifeboats. Here’s why.
We know that supplies of petroleum are tightening; that the trend in costs is against us;
and that burning oil in cars isn’t a good idea in climate terms. Faced with this, the
powers-that-be could do one of two things.
They could start to wean us off cars, by changing work and habitation patterns, and
investing in public transport.
Alternatively, they can promise us electric vehicles, conveniently ignoring that we don’t,
and won’t, have enough electricity generating capacity to make this plan viable, and that
we’d certainly need to burn in power stations at least as much oil as we’d take out of fuel
tanks (see charts above).
As things stand, the world is likely to need 40% more power generating capacity in 2030
than it had in 2016. Adding an EV switchover into the mix raises that required increase to
70%.
This mistake would be compounded were governments persuaded to subsidise a
switchover to EVs. Doing this would divert resources that could otherwise be invested in
the housing, transport and lifestyle changes that would be a much more efficacious
contribution to sustainability.
At the moment, every indication is that they’re going to opt for the easy answer - not the
right one. This is just one example, amongst many, of our tendency to avoid unpalatable
issues until they are forced upon us. The classic instance of this, perhaps, is the attitude
of the democracies during the 1930s, who must have known that appeasement was
worse than a cop-out, because it enabled Germany, Italy and Japan to build up their
armed forces, becoming a bigger threat with every passing month. Hitler came to power
in 1933, and could probably have been squashed like a bug at any time up to 1936. By
1938, though, German rearmament reduced us to buying ourselves time.
Burying one’s head in the sand is actually a very much older phenomenon than that. The
English happily paid Danegeld without, it seems, realising that each such bribe made the
7
invaders stronger. It’s quite possible that the French court could have defused the risk of
revolution by granting the masses a better deal well before 1789. The Tsars compounded
this mistake when they started a reform process and then slammed it into reverse.
History never repeats itself, but human beings do repeat the same mistakes, and then
repeat their surprise at how things turn out.
Needed – understanding, vision and planning
Given the situation described here, there is an overwhelming case for preparation. But
there is no widespread recognition of the problem, let alone a sensible plan for
responding to it. The context is one of ignorance, denial and wishful thinking.
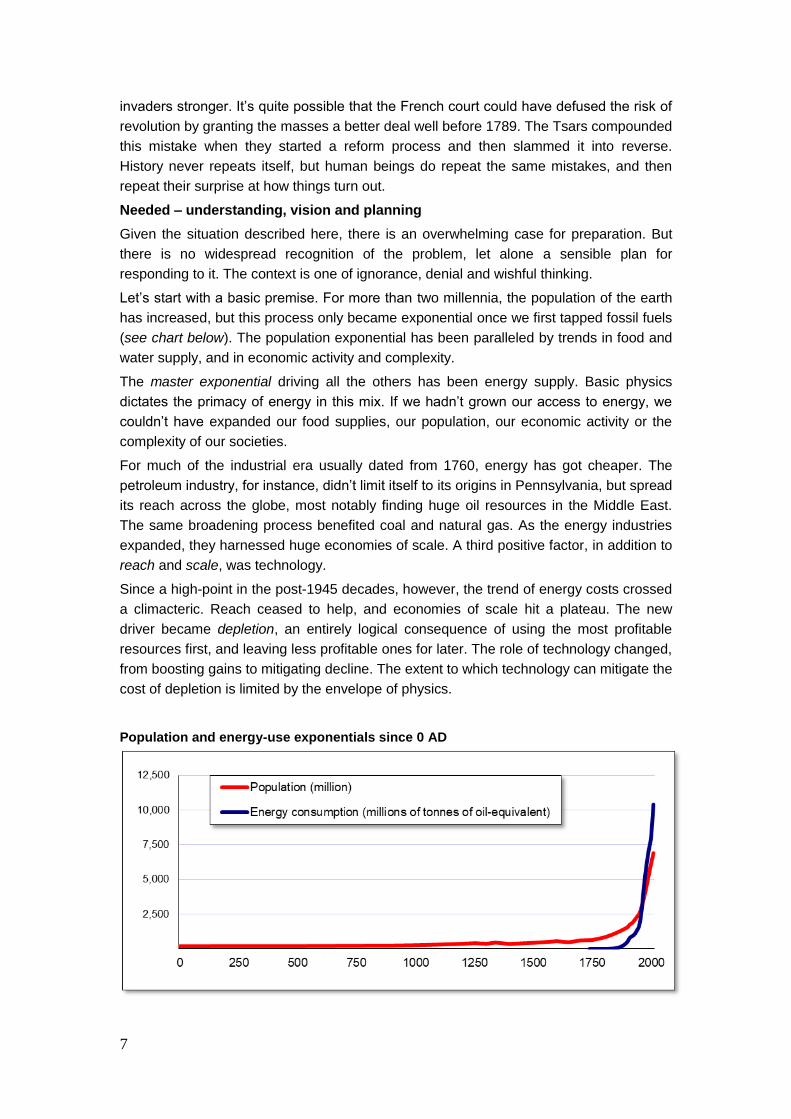
Let’s start with a basic premise. For more than two millennia, the population of the earth
has increased, but this process only became exponential once we first tapped fossil fuels
(see chart below). The population exponential has been paralleled by trends in food and
water supply, and in economic activity and complexity.
The master exponential driving all the others has been energy supply. Basic physics
dictates the primacy of energy in this mix. If we hadn’t grown our access to energy, we
couldn’t have expanded our food supplies, our population, our economic activity or the
complexity of our societies.
For much of the industrial era usually dated from 1760, energy has got cheaper. The
petroleum industry, for instance, didn’t limit itself to its origins in Pennsylvania, but spread
its reach across the globe, most notably finding huge oil resources in the Middle East.
The same broadening process benefited coal and natural gas. As the energy industries
expanded, they harnessed huge economies of scale. A third positive factor, in addition to
reach and scale, was technology.
Since a high-point in the post-1945 decades, however, the trend of energy costs crossed
a climacteric. Reach ceased to help, and economies of scale hit a plateau. The new
driver became depletion, an entirely logical consequence of using the most profitable
resources first, and leaving less profitable ones for later. The role of technology changed,
from boosting gains to mitigating decline. The extent to which technology can mitigate the
cost of depletion is limited by the envelope of physics.
Population and energy-use exponentials since 0 AD
8
Only in science fiction, or in wishful thinking, can we get a quart of energy out of a pint
pot.
The cost uptrend (and by ‘cost’, of course, is meant the energy consumed in accessing
energy) hasn’t stopped growth in aggregate access to primary energy - yet. This means
that we’ve been able to offset worsening cost ratios by using more gross energy. This
said, cost is likely to make it harder to grow total supplies in the future. Fundamentally, as
the energy consumed in the energy supply process rises, the amount of value that we get
from each unit of energy diminishes, just as we hit limits to our ability to use greater
volume to offset reduced value.
In petroleum, at least, we are now scraping the bottom of the barrel. If there were lots of
gigantic, technically-easy fields still to be developed, we simply wouldn’t be bothering
with shales, or crudes so heavy that they have to be mined rather than pumped. It’s
become difficult to find a price that is high enough for producers without being too high
for customers. This factor could squeeze oil supplies within a comparatively short time.
Cost, rather than quantity of reserves, is the factor that’s going to cause “peak oil”.
Renewable energies, though desirable, don’t offer an instant escape, not least because
we have to use legacy fossil fuel energy to build wind turbines, solar panels and the
infrastructure that renewables require. We once believed that nuclear energy would be
“too cheap to meter”, and would free us from dependency on oil, gas and coal. We’re in
danger of repeating that complacency with renewables. We need to assume that energy
will get costlier, just as growing the absolute quantities available to us is getting tougher.
Growth – the bar keeps rising
As the cost of energy rises, economic growth gets harder. We’ve come up against this
constraint since about 2000, and our response to it, thus far, has been gravely mistaken,
almost to the point of childish petulance. We seem incapable of thinking or planning in
any terms that aren’t predicated on perpetual growth. We resort to self-delusion instead.
First, we thought that we could create growth by making debt ever cheaper, and ever
easier to obtain. Even after 2008, we seem to have learned nothing from this exercise in
credit adventurism.
Since the global financial crisis (GFC), we’ve added monetary adventurism to the mix. In
the process, we’ve crushed returns on investment, crippling our ability to provide
pensions. We’ve accepted the bizarre idea that we can run a “capitalist” economic
system without returns on capital.
We’ve also accepted value dilution, increasingly resorting to selling each other services
that are priced locally, that add little value, and that, in reality, are conduits for the
borrowed money that we’ve been pouring into the economy.
We seem oblivious of the obvious, which is that money, having no intrinsic worth,
commands value only as a claim on the output of a real economy driven by energy.
When someone hands in his hat and coat at a reception, he receives a receipt which
enables him to reclaim them later. But the receipt itself won’t keep him warm and dry. For
that, he needs to exchange the receipt for the hat and coat. Money is analogous to that
receipt.
9
The first imperative, then, is recognition that the economy is an energy system, not a
financial one, in which money plays a proxy role as a claim on output. In this sense,
money is like a map of the territory, whereas energy is the territory itself – and
geographical features cannot be changed by altering lines on a map.
It’s fair to assume that the reality of this relationship will gain recognition in due course,
because there are limits to how long we can delude ourselves that prosperity is
increasing, in the face of growing evidence that it is not. The most probable catalyst for
recognition is a financial crisis caused by escalating debt, dwindling provision for the
future, and a puncturing of bubbles in asset prices.
The really important question is how many mistakes and how much damage has to
happen before the situation is recognised. No amount of orthodoxy can defy fundamental
reality, just as no amount of orthodoxy could turn flat earth theories into the truth.
With the energy dynamic recognised, we’ll need to come to terms with the fact that
growth cannot continue indefinitely. Rather, growth has been a chapter, made possible
by the bounty of fossil fuels, and that bounty is losing its largesse as the relationship
between energy value and the cost of access tilts against us.
In one sense, it’s almost a good thing that this is happening. If we suddenly discovered,
for example, vast, low-cost oil reserves on the scale of another Saudi Arabia, we would
probably use them to destroy the environment.
Undercutting the rationale – consumption, profit and debt
With growth in prosperity no longer guaranteed, a lot of other assumptions lose their
validity. One of the first will be the nexus of consumerism and corporate profit, where we
assume that consumption by the public must always increase, and, over time, profits
must always grow.
We’ll find ourselves in a situation where consumption doesn’t keep growing, and will
decrease in per capita terms at a pace which at least matches the rate at which
population numbers are growing. In this situation, expecting suppliers to keep on
expanding, and carry on increasing their profits, becomes unreasonable. Businesses
which insist on trying to maintain profits growth in this context may resort to cheating,
both exploiting consumers and falsifying information. It might well be that this process
has already started.
Meanwhile, the invalidation of the growth assumption will have profound implications for
debt, and may indeed make the whole concept unworkable. If borrowing and lending
ceased to be a viable activity, the consequences would be profound.
To understand this, we need to recognise that debt only works when prosperity is
growing. For A to borrow from B today, and at a future date repay both capital and
interest, A’s income must have increased over that period. Without that growth, debt
cannot be repaid.
By income, of course, is meant prosperity. An increase in nominal income is of no
assistance in servicing or repaying debt if essential deductions have increased by more
than income itself.
There are two routes to the repayment of capital and the payment of interest, and both
depend on growth. First, if A has put borrowed capital to work, the return on that
10
investment both pays the interest, and also, hopefully, leaves A with a profit.
Alternatively, if A has spent the borrowed money on consumption, A’s income has to
increase by at least enough to for him to repay the debt, and pay interest on it.
In an ex-growth situation, both repayment routes break down. Invested debt isn’t going to
yield a sufficient return, because purchases by consumers have ceased to expand. A’s
income, on the other hand, won’t have increased, because prosperity has stopped
growing.
This scenario - in which repayment of debt becomes impossible - isn’t a future prediction,
but a current reality, and a reality that is already in plain sight. The slashing of rates to
almost zero after 2008 informed us that earning enough on capital to be able to pay real
rates of interest had become impossible. Though central banks are in the process of
raising rates, this is most unlikely to restore rates to meaningfully positive (above-
inflation) territory.
Businesses which aren’t growing cannot – ever - pay off their debts, and neither, without
increases in prosperity, can individuals or households which have borrowed to finance
consumption.
Critically, prosperity, which drives both profits and incomes, is declining. This is evident,
not just in real wages (which, in many developed economies, haven’t grown since 2008),
but also in the adverse relationship between nominal incomes and the cost of essentials.
To reiterate, if borrowers’ discretionary incomes don’t grow, they cannot pay off their
debts, and are likely to go under because they cannot carry indefinitely the burden of
compounding interest.
The politics of inequality
Financial exercises in denial (including escalating debt, ultra-cheap money and the
impairment of pension provision) have already created a stark division between “haves”
and “have-nots”. Essentially, the “haves” are those who already owned assets before the
value of those assets was driven upwards by monetary policy. The “have-nots” are
almost everyone else, especially the young.
In this context, established paradigms are crumbling. Critically, the cessation of growth in
prosperity creates a fundamental change in attitudes towards inequality. Someone whose
prosperity is increasing is likely to be pretty tolerant towards a richer neighbour. Put
prosperity into reverse, though, and that tolerance evaporates.
Again, this isn’t forecast, but observable fact. Established elites have suffered successive
reverses across the developed world. Deteriorating prosperity is one of the main reasons
why “populist” politicians are doing so well, and also lays the foundations for a return to
ascendancy by the collectivist Left. For this to happen, left-of-centre parties need to
purge themselves of the centrists whose logic ceased to function when prosperity
stopped growing.
Their need to do this isn’t exactly rocket-science, and it’s already happening. We know
that Hillary Clinton failed to see off Donald Trump, but we can’t know whether Bernie
Sanders might have succeeded. We cannot know whether Labour under Jeremy Corbyn
can win power in Britain, but we can be pretty sure that a Labour party led by a returning
Tony Blair, or by someone else with the same “New” Labour policies, could not.
11
This stacks up to the return of division. The reason for this is that deteriorating prosperity,
and perceptions of inequality, are making it impossible for parties of opposition to accept
big chunks of the incumbency’s economic agenda. As ordinary people become poorer,
and as their ability to carry their debt burdens diminishes, the focus on inequality will
intensify. The “politics of envy” will become “the politics of indignation”. Questions will
start to be asked about how much money any one individual actually needs. The
deterioration in the ability of the state to provide public services will intensify the politics
of division.
To be clear about this, collectivism won’t solve our fundamental economic problems, and
neither will a system which mutates Adam Smith’s free and fair competition into
“junglenomics”, something akin to the law of the jungle. Financialised corporatist
capitalism is failing now, just as emphatically as Marxist collectivism failed in the past.
A logical conclusion, then, is that we need a new form of politics, just as much as we
need a new understanding of economics, new models for business and a new role for
finance. Co-operative systems might succeed where corporatism (both the state-
controlled and the privately-owned variants) have failed.
All of these new ideas need to be grounded in reality, not in wishful thinking, denial or
ideological myopia.
But reality becomes a hard sell when it challenges preconceived notions – and no such
notion is more rooted in our psyche than perpetual growth.
12
Part Two – background
The essence of Surplus Energy Economics is that the economy should be seen as an
energy system, not a financial one. The supply of all goods and services depends
entirely on energy.
Having no intrinsic worth, money has value only as a “claim” on the output of the energy
economy. The financial system acts as a proxy for the economy of goods and services. If
the aggregate claims embodied in money and credit exceed the deliverability of the
energy economy, they cannot be honoured. They must instead be destroyed, either by
hard default, or by the ‘soft default’ of inflation.
Not all of the energy that we access can be put to productive uses at our discretion.
Whenever energy is accessed, some energy is always consumed in the access process.
This distinction divides energy supply into two streams – the energy used in the energy
supply system, and the remainder, or surplus, which is available for all other purposes.
This sets two determinants for the value that the economy supplies.
The first is the gross quantity of energy to which we have access.
The second is the energy cost of accessing energy. In SEE, this cost is known as the
Energy Cost of Energy, or ECoE. It is expressed as a percentage of gross energy.
ECoE is not a conventional ‘cost’ in the sense of value being paid out. The world
economy is a closed system. Rather, ECoE functions as an economic rent. It can be
thought of as a charge levied on our activity by the physical characteristics of the
resource set. If 100 units of energy are accessed, and ECoE is 5%, we exercise choice
over how 95 units are used. If ECoE rises to 10%, the gross number of 100 units remains
the same, but the units over which we exercise choice (or discretion) falls to 90.
There is an analogy with a household budget. If a person earns $1000, and has to spend
$100 on essential costs (such as shelter, food and travel), his or her discretionary income
is $900. If the cost of essentials rises to $200, then discretionary income falls to $800,
even though income itself is unchanged at $1000.
Likewise, an economy with GDP of $1000m, having an ECoE of 5%, spends $50m on
energy supplies, and is left with $950m for all other purposes. At an ECoE of 10%, GDP
remains $1000m, but energy supply now demands $100m, leaving only $900m for all
purposes other than the supply of energy.
SEE calculates the energy economy by deducting ECoE from a ‘clean’ GDP number,
discussed later. Prosperity is defined as the per capita equivalent of the energy
economy. Again, this has an analogy to a household. A person’s sense of prosperity is
not determined by income. A household whose income rises from $1000 to $1200 is less
prosperous, not more, if essential costs also rise, from $300 (leaving $700) to $600
(leaving only $600).
Prosperity, for a household or a national economy, can be defined as ‘discretionary’
resources after essentials. For the household, these essentials include housing, food,
medical expenses, electricity, gas, fuel and travel fares. For an economy, the essentials
are the supply of energy, without which no economic activity can take place.

13
This definition of the economic essentials as energy recognises that energy inputs are
critical to everything that the economy produces. Minerals are available only through the
use of energy to extract, refine and deliver them. Agricultural produce is equally energy-
dependent. So are manufacturing, construction and the provision of services. Without
energy, there is no economy.
This is evident in human history. As hunter-gatherers, energy consumed as nutrition was
matched by the energy expended obtaining food, so there was no surplus, no economy
and no society. The greater efficiency of agriculture created the first energy surplus. This
surplus was modest, so the economy and society were rudimentary, with most people
still engaged in food production.
Accessing fossil fuels leveraged the surplus massively, facilitating a complex economy in
which few people are engaged in farming. The human population has followed an
exponential trajectory since the Industrial Revolution, which began in about 1760. More
specifically, the world’s population has tracked the aggregate availability of surplus
energy.
Four main factors determine ECoE. These are illustrated in the diagram below. Though
broadly applicable, this can best be described by considering petroleum.
The oil industry began in Pennsylvania in the 1850s. The industry then expanded, first to
other parts of the United States, and then worldwide. This geographical reach gave the
industry access to new, lower-cost sources of oil, driving costs downwards. Most
obviously, oil became cheaper to produce when huge reserves were found in the Middle
East.
As the industry grew, it harvested economies of scale, which further reduced costs.
Meanwhile, improvements in technology accelerated the reduction in costs.
In the decades immediately after the Second World War, the petroleum industry reached
the trough of the cost parabola. The new factor driving costs now was depletion, which
reflects the natural process of accessing the most profitable resources first, and leaving
costlier resources for later. At the same time, geographical reach could no longer reduce
costs, whilst economies of scale had reached a plateau.
The ECoE parabola

14
ECoE by fuel group, 1980-2030F Gross & net energy, 1980-2030F
Technology remained important, but its role had changed. Instead of amplifying the
benefits of reach and scale, technology became a way of mitigating the effects of
depletion.
The role of technology is often over-stated, because technology works within the
envelope set by the physical properties of the energy source. Thus, technology applied to
shale oil has made shales cheaper to produce than the same resources would have been
at an earlier time. But technology has not transformed the economics of shales into those
of a giant straightforward oil field in the Middle East. This is something that the laws of
physics do not permit.
Because depletion has displaced reach and scale as the driver of ECoEs, the energy
cost of fossil fuels has been rising exponentially. According to SEEDS estimates, the
overall ECoE of fossil fuels has increased from 1.7% in 1980 to 2.5% in 1990, 4% in
2000 and 6.6% in 2010. Fossil fuel ECoEs are projected at 10.4% in 2020, and 13.6% in
2030.
It will be noted that these increases are exponential. It will also be noted that changes in
ECoE are gradual, reflecting the evolutionary character of the factors driving ECoE, so
it’s the trend in ECoEs that really matters.
Despite the harnessing of renewable sources of energy, and the use of nuclear and
hydroelectric power, fossil fuels continue to dominate the world’s supply of primary
energy, accounting for 86% of all energy use in 2016. This share has declined, but only
very slowly, and was just under 89% as long ago as 1986. For this reason, the overall
ECoE of global energy supply is tied closely to that of fossil fuels.
The ECoEs of renewables such as wind and solar power are still on the positive
(downwards) curve of the ECoE parabola. The ECoE of renewables, taken in aggregate,
may become lower than that of fossil fuels by the early 2020s. Cost equivalency will not,
however, cancel out the unique applicability of fossil fuels, with oil (in particular)
supplying a remarkably positive ratio of power-to-weight.

15
Because of rapid expansion, technical improvement and declining ECoEs, over-sanguine
expectations are sometimes attached to the potential of renewables for replacing fossil
fuels. Extrapolation is sometimes made from growth rates which are unrepresentative
because they reflect a very low starting base (renewables still account for just 3% of
world energy supply).
Moreover, renewables are to a significant extent derivative of fossil fuels. The energy
used to build wind turbines, solar panels and associated infrastructure remains sourced
from ‘legacy’ fossil fuels. Therefore, the rising ECoEs of these inputs may blunt scope for
further reductions in the ECoEs of renewables.
This is not, in any way, intended to downplay the importance of renewables. An economy
wedded to fossil fuels would have a very bleak economic future. But it is necessary to
frame expectations realistically, and not apply the “fool’s guideline” of extrapolation either
to scale or cost. Back in the 1960s, it was widely believed that nuclear power would
transform the energy situation, delivering electricity “too cheap to meter”. We are in
danger of making the same mistake about renewables.
This consideration makes the assumed rapidity of switchover to electric vehicles (EVs)
look ill-thought-out. Baseload electricity demand is growing at a rate of around 2.5%
annually, which means that an increase of over 40% will be required by 2030, even
without EVs. Switching two-thirds of vehicles to EV by that date would require an
expansion of 70%, rather than 40%, in electricity capacity. This cannot all come from
renewables, realistically assessed, and neither can much of it come from expanding
nuclear or hydroelectric generation.
Even without EV, we will be hard pressed to prevent growth in the need for fossil fuels in
power generation. The danger with EV is that investment might be put into this at the
expense of projects with greater resilience. Resources might be better invested in
planning ahead for a society less dependent on cars, such investment in denser
habitation, urban regeneration, shorter journeys, public transport and different patterns of
work and leisure. The resources invested in renewables, and the implicit transference of
petroleum from vehicle fuel tanks into power generation, suggest that EVs offer little if
any scope for assisting efforts to combat climate change.
Rising ECoEs are already hampering efforts to stem climate change. Whilst we
endeavour to use net or surplus energy more efficiently, the quantity of gross energy
required for each unit of net energy is cancelling out these efforts. Back in 1990, having
100 units of net energy required accessing 102.6 units at the gross level. By 2016, this
number had risen to 107.7 units, and it may increase to 110.9 units by 2030.
These considerations make claims for the viability of “sustainable development” – as
currently framed – look extremely questionable. To attain sustainability, we will need to
make changes to habitation, work and leisure which far exceed anything yet
contemplated in mainstream debate.
Assertions about sustainable development are often based on faulty economic
interpretation – put simply, we may be deriving false comfort by comparing emissions of
CO² with output numbers which are misleading.

16
World growth and the balance sheet ($tn) National prosperity (000s local currency)
Between 2001 and 2016, and expressed in PPP-converted international dollars at
constant (2016) values, world GDP expanded by $49.6 trillion. But, over the same period,
global debt increased by $141tn, meaning that each $1 of growth was accompanied by
$2.84 of net new borrowing.
This ratio has been worsening markedly. The ratio of borrowing to growth was 3.51:1
between 2008 and 2016, compared with 2.23:1 between 2000 and 2008. The main
difference between those periods is that emerging economies, too, now borrow at rates
exceeding growth, a practice previously confined largely to the developed West.
Between 2000 and 2008, annual borrowing worldwide averaged 8.5% of GDP, compared
with growth of 3.8%. Since 2008, the rate of growth has slowed, from 3.8% to 2.8%,
whilst that rate of borrowing has increased, from 8.5% to 9.7% of GDP.
A further complication has emerged since the global financial crisis (GFC). The
authorities’ response to 2008 was to slash interest rates, in order to avoid mass defaults
from borrowers unable to service what had already become a mountain of debt. But this
also slashed returns on invested capital. As a result, global pension provision is now
deficient, probably to the tune of about $124tn. Most of that shortfall has arisen since
2008.
The resulting numbers are stark (see first chart above). Comparing 2016 with 2008, GDP
expanded by $24tn, but debt increased by $84tn, and it is likely that pension deficits
worsened by about $91tn. This means that the aggregate balance sheet has deteriorated
by $7.33 for each dollar of growth, of which $3.51 is attributable to increased debt, and
$3.82 to pension impairment.
A further factor to be considered here is the nature of growth in recent years. Between
2008 and 2016, for example, American GDP increased by $2.1tn (at 2016 values). Taken
together, however, output from manufacturing, construction, agriculture and the
extractive industries increased by only $20bn, or just 0.9% of all growth.
A further 5% came from increased net exports of services. But the remaining 94% of all
growth came from services which Americans can sell only to each other, including big

17
increases in the FIRE (finance, insurance and real estate) sectors, from government, and
from non-cash “imputations”. This pattern has been reflected elsewhere across the
developed world.
The distinction between these activities is by no means an academic one. The output of
manufacturing and construction, for example, is priced on the basis of internationally
competition, even when sold at home. This makes globally marketable output (GMO)
hard priced. Internally consumed services (ICS), on the other hand, are priced locally.
Not only is ICS soft priced, but it is residual, being output on which people spend money
only after their primary needs are met. Not surprisingly, ICS tends to be much less value-
additive than GMO. That is one reason why, say, moving government administrative
activities to a location damaged by the closure of a major manufacturing plant is seldom
a fully effective solution, even where absolute turnover is equivalent.
The overwhelming preponderance of ICS in Western ‘growth’ makes the real value of
that growth questionable. It supports the assertion that growth is being created by using
ICS activities as a conduit for feeding borrowed money into the economy, thereby
boosting value creation by a lot less than the consumption increment to reported GDP.
Patterns in emerging economies are different, because borrowed funds are often (and
most noticeably in China) channelled into building excess capacity. The result is similar,
however, because the investment of borrowed funds into surplus capacity acts as a
conduit to consumption by those employed in capacity-building. Moreover, the creation of
excess capacity depresses returns on investment, often to levels lower than the real cost
of capital.
These considerations explain why SEE uses a ‘clean’ GDP number as the basis from
which ECoE is deducted in the calculation of prosperity. Conventional economics treats
output (flow) and debt (stock) as separate issues, not examining the nexus between
them. But this risks accepting the validity of economic activity which, as well as adding
little value, comes at the direct expense of the future. Instead, SEEDS uses an algorithm
to calculate what growth would have been in any given year had cheap money and credit
not been channelled into inflating consumption.
Composition of American GDP growth, 2008-16
18
There is a disturbing tendency to draw unjustified comfort from the values of assets (such
as stocks, bonds and property) inflated by ultra-cheap money. In reality, these inflated
asset values are not a meaningful offset to escalating debt and worsening pension
impairment. The reason for this is that these values cannot be monetised – for example,
the only potential buyers of a nation’s housing stock are the same people to whom that
stock already belongs.
In short, using marginal transaction prices to impute a value to an aggregate stock of
assets is misleading. The danger with this approach is that it can generate misplaced
comfort, both at the macroeconomic and the microeconomic level.
Finally, it is worth noting that SEE provides an effective way of measuring vulnerability to
shocks. Three components are required for this calibration.
The first of these is financial exposure, including debt levels, pension deficiencies and
banking systems assets.
The second is the trend in prosperity. As the prosperity of an economy weakens, its
ability to support any given level of financial exposure decreases.
The third factor is dependency. When GDP depends heavily on infusions of debt (and
on capital injections offsetting current account deficits), the risk of a shock is elevated if
these sources of support are undermined.

19
Appendix – selected data
Prosperity calculation example: United Kingdom, 1980-2030F
£bn 2016 1980 1990 2000
Peak
2003 2010 2020F 2030F
GDP £872 £1,164 £1,475 £1,605 £1,726
Adjustment - - -£39 -£130 -£213
Clean GDP £872 £1,164 £1,436 £1,475 £1,513 £1,557 £1,588
ECoE % 1.7% 2.5% 2.7% 3.3% 5.9% 10.0% 12.2%
ECoE -£15 -£30 -£39 -£49 -£90 -£156 -£194
Energy economy £857 £1,135 £1,396 £1,425 £1,423 £1,401 £1,394
Population 56.3 57.2 58.9 59.6 62.8 67.4 71.7
Prosperity (£000) £15.2 £19.8 £23.7 £23.9 £22.7 £20.8 £19.4
Memo: debt - - £2,542 £3,042 £4,431
Prosperity, world and selected economies, 1998-2030F
000s per person peak year 2016 2030 2030 vs 2016 2030 vs peak
Japan 3,525 1998 3,431 3,267 -4.8% -7.3%
Netherlands € 33.8 1999 € 31.5 € 31.0 -1.5% -8.4%
France € 29.3 2000 € 27.1 € 25.2 -6.9% -13.9%
Spain € 19.8 2000 € 17.8 € 18.4 +3.2% -7.0%
Italy € 27.2 2001 € 23.9 € 23.2 -3.1% -14.8%
Australia 53.4 2003 48.8 46.7 -4.4% -12.6%
United Kingdom £23.9 2003 £21.6 £19.4 -10.0% -18.6%
New Zealand 42.3 2004 40.2 39.5 -1.7% -6.7%
Norway 566.6 2004 517.3 520.9 +0.7% -8.1%
United States $47.1 2005 $43.7 $40.7 -6.8% -13.6%
Canada 51.8 2007 48.2 46.5 -3.4% -10.2%
Greece € 15.8 2007 € 13.7 € 13.4 -2.4% -15.3%
Saudi Arabia 71.7 2015 71.2 66.5 -6.6% -7.3%
Germany - - € 30.9 € 31.0 +0.1% -
China - - 30.8 42.2 +37% -
India - - 84.7 123.8 +46% -
World - - $11.05 $11.36 +2.8%
20
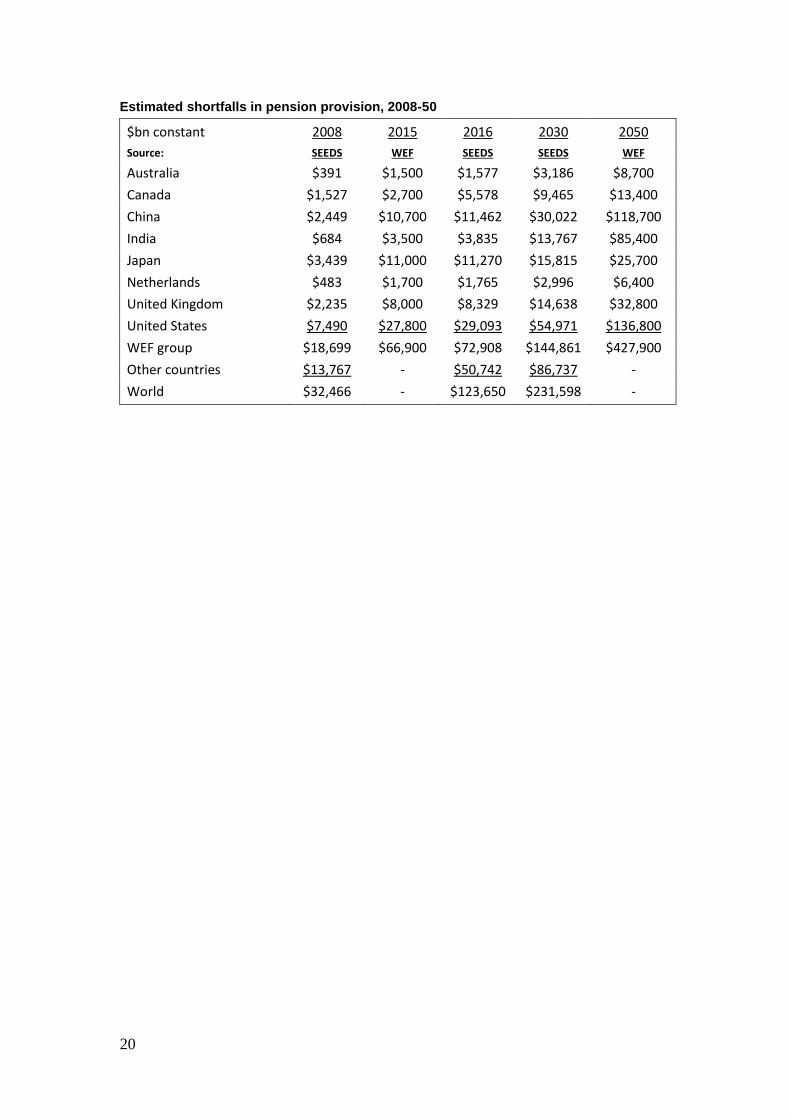
Estimated shortfalls in pension provision, 2008-50
$bn constant 2008 2015 2016 2030 2050
Source: SEEDS WEF SEEDS SEEDS WEF
Australia $391 $1,500 $1,577 $3,186 $8,700
Canada $1,527 $2,700 $5,578 $9,465 $13,400
China $2,449 $10,700 $11,462 $30,022 $118,700
India $684 $3,500 $3,835 $13,767 $85,400
Japan $3,439 $11,000 $11,270 $15,815 $25,700
Netherlands $483 $1,700 $1,765 $2,996 $6,400
United Kingdom $2,235 $8,000 $8,329 $14,638 $32,800
United States $7,490 $27,800 $29,093 $54,971 $136,800
WEF group $18,699 $66,900 $72,908 $144,861 $427,900
Other countries $13,767 - $50,742 $86,737 -
World $32,466 - $123,650 $231,598 -