Embed Size (px)
Citation preview
Heriot-Watt University Research Gateway
Heriot-Watt University
Surfactants from Itaconic Acid: Toxicity to HaCaT keratinocytes in vitro, MicellarSolubilization, and Skin Permeation Enhancement of HydrocortisoneAbruzzo, Angela; Armenise, Nicola; Bigucci, Federica; Cerchiara, Teresa; Gösser, MireiaBroch; Samori, Chiara; Galletti, Paola; Tagliavini, Emilio; Brown, David McAllister; Johnston,Helinor Jane; Fernandes, Teresa F.; Luppi, BarbaraPublished in:International Journal of Pharmaceutics
DOI:10.1016/j.ijpharm.2017.03.056
Publication date:2017
Document VersionPeer reviewed version
Link to publication in Heriot-Watt University Research Portal
Citation for published version (APA):Abruzzo, A., Armenise, N., Bigucci, F., Cerchiara, T., Gösser, M. B., Samori, C., ... Luppi, B. (2017). Surfactantsfrom Itaconic Acid: Toxicity to HaCaT keratinocytes in vitro, Micellar Solubilization, and Skin PermeationEnhancement of Hydrocortisone. International Journal of Pharmaceutics, 524(1-2), 9–15. DOI:10.1016/j.ijpharm.2017.03.056
1
Surfactants from Itaconic Acid: Toxicity to HaCaT keratinocytes in vitro,
Micellar Solubilization, and Skin Permeation Enhancement of Hydrocortisone
5
Angela Abruzzo1*, Nicola Armenise2, Federica Bigucci1, Teresa Cerchiara1, Mireia Broch
Gösser2,3, Chiara Samorì2, Paola Galletti2, Emilio Tagliavini2, David M Brown3, Helinor J
Johnston3, Teresa F Fernandes3, Barbara Luppi1.
1Department of Pharmacy and Biotechnology, Via San Donato 19/2, University of Bologna, 40127 10
Bologna, Italy; E-Mails: [email protected]; [email protected];
[email protected]; [email protected];
2 Department of Chemistry “G. Ciamician”, Via Selmi 2, University of Bologna, 40126 Bologna,
Italy and CIRI EA (Interdepartmental Center of Industrial Research Energy and Environment); E-
Mails: [email protected]; [email protected]; [email protected], 15
[email protected], [email protected];
3 Nano Safety Research Group, Heriot-Watt University, Edinburgh, EH14 4AS, UK; Emails:
[email protected]; [email protected]; [email protected]
*Correspondence to Angela Abruzzo 20
Department of Pharmacy and Biotechnology, Via San Donato 19/2, University of Bologna, 40127
Bologna, Italy; E-Mail: [email protected]
2
Abstract 25
One of the most widely used approaches for improving drug permeation across the stratum corneum
barrier of the skin is the use of chemical penetration enhancers, such as surfactants. In this study,
two anionic surfactants, named C12-OPK and C18-OPK, were synthesized via condensation of
itaconic acid and fatty amines, with C12 and C18 alkyl chains, respectively. Assessment of impacts
on HaCaT keratinocyte cell viability was used as indicator of their potential to cause skin irritation 30
24 h post exposure (Alamar Blue assay). The LC50 values of C12-OPK and C18-OPK (144 and 85
mg/L, respectively) were lower than LC50 values of the most used commercial surfactants (e.g.
SDS). The effect of different surfactant concentrations (up to ten times the critical micellar
concentration, CMC) on hydrocortisone (HC) solubility and permeation through porcine skin was
also evaluated. Results showed that drug solubility increased linearly with increasing concentrations 35
of both surfactants, as a consequence of the association between drug and micelles. In vitro
permeation results showed that the permeability coefficient increased at surfactant concentrations
lower than the CMC. In particular, a higher enhancement effect on drug permeation was obtained
with C18-OPK, due to its hydrophobic properties that ensured a more effective HC permeation in
comparison to C12-OPK. 40
45
Keywords: surfactants, hydrocortisone, cytotoxicity, keratinocyte, micellar solubilization, skin
permeation enhancement.

3
1. Introduction 50
Transdermal drug delivery offers many advantages over other traditional routes of drug delivery,
such as a better control of blood levels, a reduced incidence of systemic toxicity, and the absence of
hepatic first-pass metabolism (Nokhodchi et al., 2003). Unfortunately, the transdermal route is
associated with a delayed onset of action due to the time required to reach the optimal drug
concentration in the skin or blood and the variation of absorption rate based on site of application, 55
skin type and patient age (Barrichello et al., 2006). Moreover, the outermost layer of the skin, the
stratum corneum (SC), represents a barrier for most drugs to be delivered into and through it (Barry,
1983), due to the presence of keratin-rich cells embedded in multiple lipid bilayers. One of the most
useful strategies to improve transdermal delivery is the use of chemical penetration enhancers
(Williams and Barry, 2004), such as surfactants, which enhance the permeability of the SC barrier 60
(Barry, 1983). Surfactants are amphiphilic molecules, consisting of both hydrophilic (head) groups
and hydrophobic (tail) groups. Their ability to increase water solubility of drugs and to enhance skin
permeability has been widely exploited in the field of transdermal drug delivery (Ghafourian et al.,
2015; Pandey et al., 2014; Som et al., 2012). The effect of surfactant molecules on drug availability
at the site of application (Rangel-Yagui et al., 2005) and on drug transport across the skin barrier 65
(Pandey et al., 2014) depends on their ability to self-associate in micellar structures as well as to
interact with the stratum corneum. The physico-chemical characteristics and the concentration of
surfactants have been shown to play an important role in the achievement of these phenomena. In
fact, below the critical micellar concentration (CMC), surfactants are present as single molecules,
while above the CMC surfactants exist as micelles. Usually, single surfactant molecules do not 70
improve drug solubilization, but they can interact with the dead cornified cells and the matrix of
intercellular lipids in the SC to modify barrier permeability and improve drug permeation. In the
presence of a micellar solution (i.e. at surfactant concentrations above the CMC), the drug can be
efficiently solubilized in the core of the micelles resulting in higher concentration at the site of
application with respect to the pure drug. At the same time, the release of the encapsulated drug 75
from the core of the surfactants or the direct transfer of the drug from the micelles towards the
membrane, can influence its permeation across the stratum corneum (di Cagno and Luppi, 2013).
Therefore, in this situation (surfactant concentration above the CMC) drug permeation is the result
of multiple mechanisms. Among the different types of surfactants (anionic, cationic, nonionic,
amphoteric), anionic surfactants interact strongly with both keratin and lipids and alter the 80
permeability of the skin by acting on the helical filaments of the stratum corneum; however, the use
of anionic surfactants is often accompanied by irritation which limits their applications (Pandey et
al., 2014; Karande et al., 2006).
4
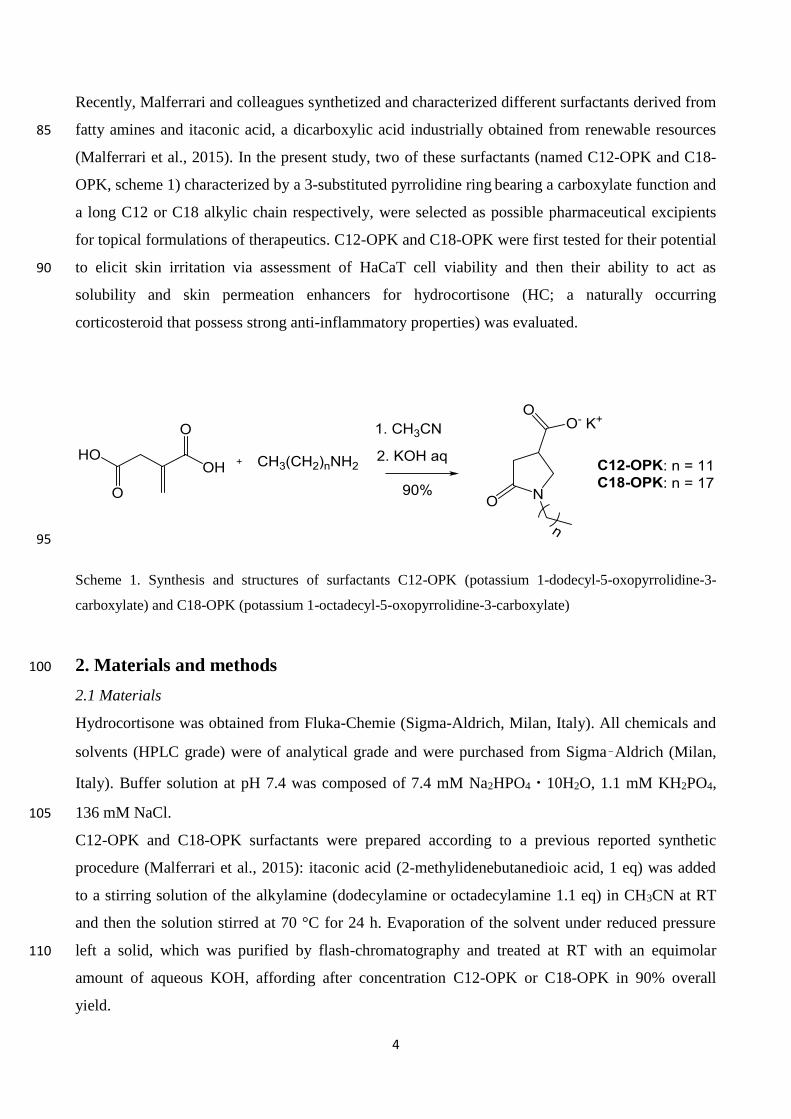
Recently, Malferrari and colleagues synthetized and characterized different surfactants derived from
fatty amines and itaconic acid, a dicarboxylic acid industrially obtained from renewable resources 85
(Malferrari et al., 2015). In the present study, two of these surfactants (named C12-OPK and C18-
OPK, scheme 1) characterized by a 3-substituted pyrrolidine ring bearing a carboxylate function and
a long C12 or C18 alkylic chain respectively, were selected as possible pharmaceutical excipients
for topical formulations of therapeutics. C12-OPK and C18-OPK were first tested for their potential
to elicit skin irritation via assessment of HaCaT cell viability and then their ability to act as 90
solubility and skin permeation enhancers for hydrocortisone (HC; a naturally occurring
corticosteroid that possess strong anti-inflammatory properties) was evaluated.
95
Scheme 1. Synthesis and structures of surfactants C12-OPK (potassium 1-dodecyl-5-oxopyrrolidine-3-
carboxylate) and C18-OPK (potassium 1-octadecyl-5-oxopyrrolidine-3-carboxylate)
2. Materials and methods 100
2.1 Materials
Hydrocortisone was obtained from Fluka-Chemie (Sigma-Aldrich, Milan, Italy). All chemicals and
solvents (HPLC grade) were of analytical grade and were purchased from Sigma–Aldrich (Milan,
Italy). Buffer solution at pH 7.4 was composed of 7.4 mM Na2HPO4・10H2O, 1.1 mM KH2PO4,
136 mM NaCl. 105
C12-OPK and C18-OPK surfactants were prepared according to a previous reported synthetic
procedure (Malferrari et al., 2015): itaconic acid (2-methylidenebutanedioic acid, 1 eq) was added
to a stirring solution of the alkylamine (dodecylamine or octadecylamine 1.1 eq) in CH3CN at RT
and then the solution stirred at 70 °C for 24 h. Evaporation of the solvent under reduced pressure
left a solid, which was purified by flash-chromatography and treated at RT with an equimolar 110
amount of aqueous KOH, affording after concentration C12-OPK or C18-OPK in 90% overall
yield.
5
2.2 Cytotoxicity evaluation on HaCaT cells
2.2.1 Cell culture 115
The HaCaT cell line, a nontumorigenic immortalized human keratinocyte cell line, was obtained
from Cell Lines Services (Eppelheim, Germany). Cells were grown in Dulbecco’s modified Eagle’s
medium, supplemented with 10% fetal bovine serum (FBS), 2 mM L-glutamine, 100 U/mL
penicillin, 100 mg/mL streptomycin and 250 mg/mL fungizone (termed complete cell culture
medium) at 37ºC in a 5% CO2 humidified atmosphere. For each experiment, cells were seeded at a 120
concentration 2x10⁵ cells/mL (100 µL) in 96 well plates, and allowed to adhere for 24 h.
Stock solutions of C12-OPK and C18-OPK compounds were suspended in complete cell culture
medium. The concentration range in which the surfactants were tested was 0.5-1000 mg/L, with 14
intermediate concentrations.
2.2.2 Exposure and viability assay 125
Cells were treated (100 µL) with the surfactants (suspended in complete cell culture medium) at
concentrations ranging from 0.5 to 1000 mg/L, in triplicate, and incubated at 37 °C for 24 h. A
positive control (0.2% triton X 100 (v/v)) and a negative control (complete cell culture medium)
were also included. For comparative purposes, cells were exposed to SDS at concentrations ranging
from 9.77 to 1250 uM (equivalent to 2.81 to 360 mg/L). 130
Cell viability was assessed using the alamar blue assay (resazurin sodium salt 0.01 mg/mL, in
complete cell culture medium). Cells were incubated with the alamar blue reagent for 2 hours and
fluorescence measured at 560/590 nm (excitation/emission) using a fluorescence plate reader. Data
are expressed as a percentage of the negative control (i.e. % viability).
135
2.3 HC solubility
A homogeneous suspension of HC was prepared by dispersing an excess amount of drug in water
and keeping the suspension under agitation for 48 h at 25°C. Undissolved HC was removed by
centrifugation (GS-15R Centrifuge, Beckman Coulter, Milan, Italy) at 10,000 rpm for 15 min and
subsequent filtration of the dispersion through a 0.2 µm pore-size cellulose acetate filter. 140
Subsequently, an exact volume was rationally diluted with ethanol and drug concentration was
detected by high-performance liquid chromatography (HPLC).
2.4 HPLC analytical assay
Chromatographic separations were performed using a Shimadzu (Milan, Italy) LC-10ATVP 145
chromatographic pump and a Shimadzu SPD-10AVP UV–Vis detector set at 244 nm. Separation
6
was obtained on a Phenomenex (Torrance, California) Sinergy Fusion-RP 80A (150 × 4.6 mm2
i.d., 5 µm) coupled to a Phenomenex Security Guard C18 guard cartridge (4 × 3.0 mm2 i.d., 5 µm).
The mobile phase was composed of a mixture of acetonitrile/ethanol/phophate buffer at pH 7.4
50:10:40 (v/v). The flow rate was 0.4 mL/min and manual injections were made using a Rheodyne 150
7125 injector with a 20 µL sample loop. Data processing was carried out by means of a
CromatoPlus computerized integration system (Shimadzu Italia, Milan, Italy). A calibration curve
was set up in the 6-121 µg/mL range (ethanol/water 9:1, v/v) and good linearity was found (r2 =
0.999). Each analysis was repeated three times (n = 3). For permeations studies, a calibration curve
was obtained with a drug concentration range of 0.54-5.4 µg/mL (PBS and ethanol, 80:20 v/v) and 155
good linearity was found (r2 = 0.999). LOD and LOQ were 0.15 μg/ml 0.50 μg/ml, respectively.
The methodology granted good precision, with RSD values always lower than 5.0%.
2.5 Influence of surfactants on HC solubility
HC solubility was determined in the presence of C12-OPK and C18-OPK surfactants. Table 1 160
reports the relative molecular weight and CMC of C12-OPK and C18-OPK.
For this study, an excess amount of drug was dispersed in water at 25°C, in the presence of different
surfactant concentrations until 10-fold the respective CMC. In particular, the tested range of
surfactant concentrations was 0.5-10 mM and 0.15-3 mM for C12-OPK and C18-OPK,
respectively. After 48 h, undissolved HC was removed by centrifugation and subsequent filtration 165
(conditions as above) and the drug concentration was determined by HPLC. Each analysis was
repeated in three replicates (n = 3).
In order to characterize the solubilizing effect of the two surfactants, the molar solubilization
capacity (χ) and the molar micelle-water partition coefficient (KM) were determined (Attwood and
Florence, 1983; Alvarez-Nunez and Yalkowsky, 2000). χ is defined as the number of moles of the 170
drug that can be solubilized by one mole of micellar surfactant and it characterizes the ability of the
surfactant to solubilize the solute. Its value is obtained from the slope of the line that results when
drug concentration is plotted against surfactant concentration. The general equation for micellar
solubilization is:
χ = (Stot - Sw)/(Csurf - CMC) (1) 175
where Stot is the total drug solubility, SW is the water drug solubility, Csurf is the molar concentration
of surfactant in solution and CMC is the critical micelle concentration.
The micelle-water partition coefficient (K) represents the ratio of the drug concentration in the
micelles to the drug concentration in water for a particular concentration of surfactant and it is
calculated according to the following equation: 180
7
K = χ (Csurf -CMC)/Sw (2)
Since K is restricted by the surfactant concentration, a molar micelle-water partition coefficient
(KM) is generally defined as the micelle-water partition coefficient in a one molar (1M) surfactant
solution, i.e.:
KM = χ (1-CMC)/Sw (3) 185
From the thermodynamic point of view, the solubilization can be considered as the partitioning of
the drug between micelles and aqueous phase and the standard free energy of solubilization (ΔG0S)
can be represented as:
ΔG0S =-RTlnKM (4)
where R, T and KM are the universal gas constant, temperature and molar partition coefficient 190
between micelle and aqueous phase, respectively.
2.6 Preparation of the tissue
Pig ear skin is a widely used model due to its similarity to the human skin in terms of behaviour,
composition and permeability (Meyer et al., 1978; Simon and Maibach, 2000). Skin was excised 195
from domestic pig ears, obtained from a local commercial supplier and cleaned with saline solution
(0.9 % w/v NaCl). The skin was carefully separated from cartilage using a scalpel, the adipose
subcutaneous tissue and the excess of hair were removed. The integrity of the skin was assessed by
microscopic observation and any skin that was not completely uniform in appearance was rejected.
The skin was frozen at -20 °C for a maximum period of 2 days (Bigucci et al., 2015). 200
2.7 Influence of surfactants on HC permeation
Permeation of HC through the skin was investigated using a Franz-type static glass diffusion cell
(15 mm jacketed cell with a flatground joint and clear glass with a 12 mL receptor volume;
diffusion surface area = 1.77 cm2), equipped with a V6A Stirrer (PermeGearInc., Hellertown, PA, 205
USA). Skin was mounted in the diffusion cell, stratum corneum uppermost, with the dermal side
facing the receptor compartment. The receptor compartment was filled with a mixture of PBS and
ethanol (80:20 v/v), maintained at 32 ± 1 °C by means of a surrounding jacket and constantly
stirred. Samples consist of drug in the presence of different surfactant concentrations. For each
surfactant, we selected one concentration below the CMC (0.15 mM) and another one 10-fold 210
higher the CMC (3 mM for C18-OPK and 10 mM for C12-OPK). Moreover, the 3 mM
concentration was also tested for C12-OPK in order to study the solubilizing effect on drug
permeation at the same surfactant concentration above the CMC. Samples were prepared as
described above, including centrifugation and filtration in order to remove undissolved HC; samples

8
contained different HC amount accordingly to the solubilizing effect of the different surfactants. At 215
the starting point of the experiment, 200 μL of the of each liquid formulation were applied as donor
phases. The permeation of drug from a control sample, based on HC suspension without surfactants,
was also measured. At predetermined time intervals (1 hour) until 9 hours, 200 μL of the receiver
phase were collected and replaced by fresh receptor medium. Cumulative amounts of drug
permeated per unit area of porcine skin (µg/cm2) was evaluated through HPLC and plotted against 220
time (s). The concentration of HC in the receptor compartment during the experiment did not
exceed 10% of the saturation solubility (sink condition). Skin components did not interfere with the
reported chromatographic method.
The in vitro permeation rate or flux (J) was generated from the slope of the linear portion of the
curve. Taking into account the starting drug concentration (C0) within different vehicles, 225
permeability coefficient (Kp) was calculated according to the following equation:
Kp = (dm/ dt)/(A⋅C0) (5)
where dm is the cumulative amount of drug permeated by the time dt, A is the area of the skin used
and C0 is the initial donor concentration (Abruzzo et al., 2015).
Enhancement ratio (ER) was used to evaluate the effect of surfactant on HC permeation. It is 230
calculated according to the following equation (Kim et al., 2008):
ER= Permeation rate in the presence of surfactant/ Permeation rate whithout surfactant (6)
Each analysis was repeated in four replicates (n = 4).
2.8 Statistical Analysis 235
All results are shown as mean ± standard deviation (SD) or mean ± standard error of the mean
(SEM). SD and SEM were calculated from the values of at least 3 independent experiments, each
with 3 replicates, except for permeation results which were calculated from the values of at least 4
independent experiments. Data from cytotoxicity assessment were analysed using the Minitab
statistical package using a general linear model with subsequent analysis of variance and post-hoc 240
Tukey’s test. Data from all the other experiments were analyzed using t-test.
3. Results and discussion
3.1 Cytotoxicity induced by surfactants to HaCaT keratinocytes 245
The cytotoxic effects of the surfactants to HaCaT cells was evaluated as an indicator of their
potential to elicit skin irritation (Choi et al., 2013; Park et al., 2010; Lawrence et al., 1996).
Keratinocytes are a biologically relevant target for skin irritants because they are the first living
9
cells that contact externally applied compounds. Cell viability of keratinocytes decreased in a
concentration dependent manner following exposure to the surfactants in the tested concentration 250
range 0.5-1000 mg/L, 24 hours post exposure (Figures 1 and 2). For both surfactants there was a
significant effect of concentration, with toxicity increasing, with increasing surfactant concentration
(p < 0.001). For surfactant C12-OPK there was a significant reduction in cell viability observed at
concentrations >125 mg/L (p < 0.001). At a concentration of 125 mg/L C12-OPK reduced cell
viability to 59.3 % and at concentrations > 250 mg/L cell viability was lower than 20 %. In the case 255
of C18-OPK, cell viability significantly decreased to 22.7 % (p < 0.001) at a concentration of 125
mg/L. At concentrations > 250 mg/L viability was < 20%. A significant difference between both
surfactants was observed (p < 0.05), with C18-OPK exhibiting greater toxicity than C12-OPK.
In order to assess the potency of the surfactants, median lethal concentrations (LC50; concentration
required to kill 50% of cells) for each surfactant were calculated applying a 4 parameter logistic 260
curve. The surfactant with the shortest chain, C12 chain, had an LC50 value of 144 ± 27 mg/L,
eliciting a less toxic effect on the HaCaT cell line than the surfactant with the C18 chain, which
gave a LC50 value of 85 ± 14 mg/L.
SDS is the most widely used anionic surfactant in gels and shampoos (Bondi et al., 2015). We
identified that the LC50 value for SDS to keratinocytes was 50.4 mg/L (equivalent to 175 µM), 24 h 265
post exposure (data not shown). The cytotoxicity of the C18-OPK and C12-OPK surfactants to
HaCaT cells was compared to the SDS LC50 value calculated in our study, and those identified in
the existing literature. LC50 (24 h) values of 47.6 ± 5.6 mg/L (NRU assay) and 31.4 ± 2.9 mg/L
(MTT assay) were reported for SDS (Sanchez et al., 2006). These values are lower than the LC50
value we calculated but this is likely to be due to differences in sensitivity in the cytotoxicity assays 270
employed in the different studies. Taken together these data suggest that the surfactants tested in
this study are less toxic to this cell type than other commonly available surfactants. The relatively
lower toxicity of our surfactants makes them promising on the field of cosmetics and
pharmaceutical applications, however a more comprehensive assessment of skin irritation and
sensitization potential (according to OECD protocols) is required in future studies as well as 275
assessment of toxicity at other target sites (e.g. liver).
3.2 HC solubility
HC solubility was detected by HPLC analysis of the clear solution obtained after centrifugation and
subsequent filtration of a drug suspension. The solubility of the drug in water at 25 °C was found to 280
be 0.295 ± 0.003 mg/mL (0.814 ± 0.009 mM) following Bergstrom et al. (2002).
10
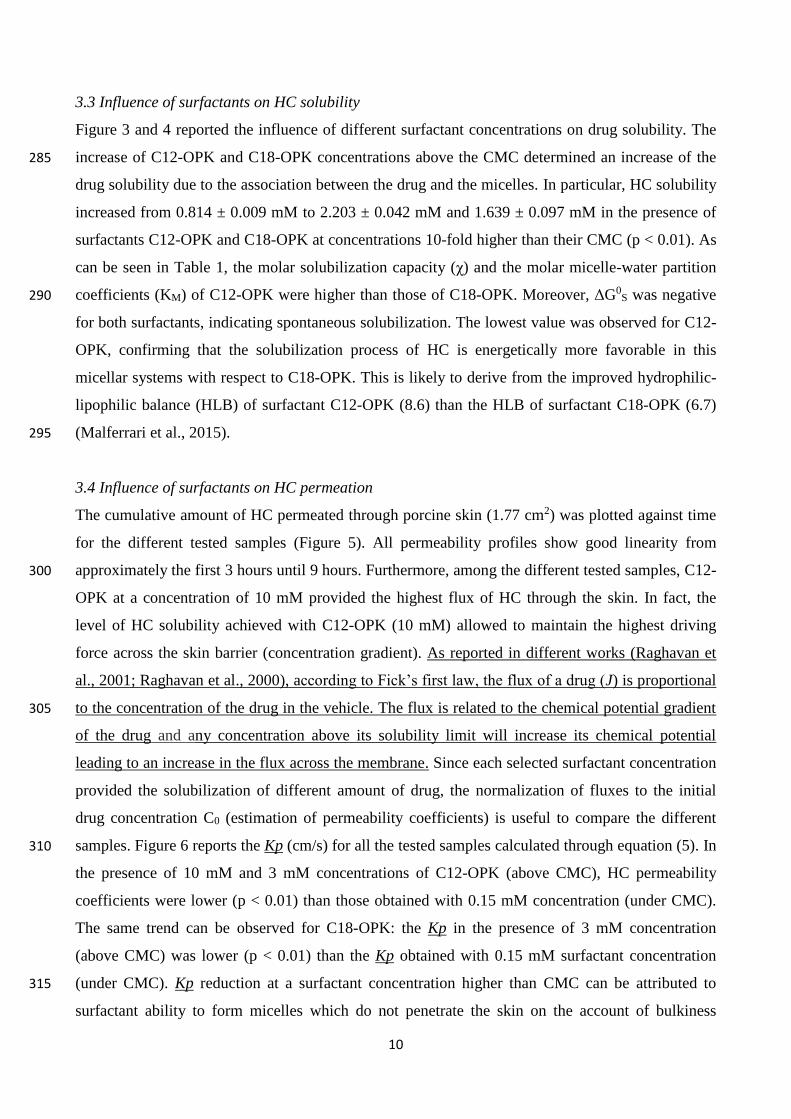
3.3 Influence of surfactants on HC solubility
Figure 3 and 4 reported the influence of different surfactant concentrations on drug solubility. The
increase of C12-OPK and C18-OPK concentrations above the CMC determined an increase of the 285
drug solubility due to the association between the drug and the micelles. In particular, HC solubility
increased from 0.814 ± 0.009 mM to 2.203 ± 0.042 mM and 1.639 ± 0.097 mM in the presence of
surfactants C12-OPK and C18-OPK at concentrations 10-fold higher than their CMC (p < 0.01). As
can be seen in Table 1, the molar solubilization capacity (χ) and the molar micelle-water partition
coefficients (KM) of C12-OPK were higher than those of C18-OPK. Moreover, ΔG0S was negative 290
for both surfactants, indicating spontaneous solubilization. The lowest value was observed for C12-
OPK, confirming that the solubilization process of HC is energetically more favorable in this
micellar systems with respect to C18-OPK. This is likely to derive from the improved hydrophilic-
lipophilic balance (HLB) of surfactant C12-OPK (8.6) than the HLB of surfactant C18-OPK (6.7)
(Malferrari et al., 2015). 295
3.4 Influence of surfactants on HC permeation
The cumulative amount of HC permeated through porcine skin (1.77 cm2) was plotted against time
for the different tested samples (Figure 5). All permeability profiles show good linearity from
approximately the first 3 hours until 9 hours. Furthermore, among the different tested samples, C12-300
OPK at a concentration of 10 mM provided the highest flux of HC through the skin. In fact, the
level of HC solubility achieved with C12-OPK (10 mM) allowed to maintain the highest driving
force across the skin barrier (concentration gradient). As reported in different works (Raghavan et
al., 2001; Raghavan et al., 2000), according to Fick’s first law, the flux of a drug (J) is proportional
to the concentration of the drug in the vehicle. The flux is related to the chemical potential gradient 305
of the drug and any concentration above its solubility limit will increase its chemical potential
leading to an increase in the flux across the membrane. Since each selected surfactant concentration
provided the solubilization of different amount of drug, the normalization of fluxes to the initial
drug concentration C0 (estimation of permeability coefficients) is useful to compare the different
samples. Figure 6 reports the Kp (cm/s) for all the tested samples calculated through equation (5). In 310
the presence of 10 mM and 3 mM concentrations of C12-OPK (above CMC), HC permeability
coefficients were lower (p < 0.01) than those obtained with 0.15 mM concentration (under CMC).
The same trend can be observed for C18-OPK: the Kp in the presence of 3 mM concentration
(above CMC) was lower (p < 0.01) than the Kp obtained with 0.15 mM surfactant concentration
(under CMC). Kp reduction at a surfactant concentration higher than CMC can be attributed to 315
surfactant ability to form micelles which do not penetrate the skin on the account of bulkiness
11
(Nokhodchi et al., 2003). Moreover, micellar aggregates appeared to be unable to interact with the
skin barrier and modify drug diffusivity, unlike single surfactant molecules. In fact, Kp increase at a
surfactant concentration lower than CMC is normally attributed to the ability of the surfactant
molecules to penetrate the skin and provide environmental changes capable of improving drug 320
diffusivity. Finally, a higher (p < 0.05) enhancing effect on drug permeation with C18 derivative
can be observed by comparing the Kp obtained in the presence of the two compounds at the same
concentration below their respective CMC (0.15 mM). This behaviour can be attributed to the
different physical-chemical properties of the two surfactants. In fact, as reported in Malferrari et al.
(2015) C12-OPK is more hydrophilic (logP = 4.8) than C18-OPK (logP = 7.0) and consequently 325
less effective in enhancing skin penetration of a poorly soluble and lipophilic drug such as HC
(Pandey et al., 2014). At surfactant concentration of 0.15 mM, the ER was 1.62 and 1.33 for C18-
OPK and C12-OPK, respectively. The only study reported in literature with experimental conditions
similar to those used in our study is the work of Sarheed (Sarheed., 2013). In this study, the author
described the use of different enhancers and determined the ER. Among these permeation 330
enhancers, SDS is the only surfactant employed. ER calculated for two different concentrations of
SDS (0.25 and 1%) were higher than the ER measured for C12-OPK and C18-OPK. Despite these
results, our study demonstrated that C12-OPK and C18-OPK surfactants are less irritant with
respect to SDS.
Godwin and colleagues (Godwin et al., 1998) synthesized twelve urea and thiourea compounds and 335
examined them for their transdermal penetration enhancing properties using hairless mouse skin and
hydrocortisone as a model drug. They observed an increase of drug permeation in the presence of
these enhancers (ER from 1.1 to 6.6). Although these compounds showed promising properties as
penetration enhancers, the authors concluded that the investigation of their irritation potential is
needed for a future application. 340
Considering the same concentration above the CMC of C12-OPK and C18-OPK (3 mM), no
significant differences between the Kp values of HC and each surfactant can be observed (p > 0.05),
thus suggesting that no enhancing effect was reached in the presence of micelles for C12-OPK as
well as for C18-OPK.
345
4. Conclusion
The present work synthesised C12-OPK and C18-OPK surfactants from renewable resources, and
investigated the influence of their tail length on the extent of HC solubilization and skin permeation.
Accordingly to the HLB and logP values of the two surfactants, that are strictly linked to the tail 350
12
length of the molecules, the micellar system based on surfactant C12-OPK presented the best
solubilization profile of HC, with respect to the system based on C18-OPK. The toxicity of C12-
OPK to HaCaT keratinocytes was less than that of C18-OPK, although a more comprehensive
assessment of their safety is required prior to their widespread use. At the same time, the higher
hydrophilicity of C12-OPK determines a less effectiveness in enhancing skin penetration of the 355
lipophilic drug HC with respect to C18-OPK. In vitro permeation results showed that, in the
presence of surfactant concentrations above CMC, HC permeability coefficients were lower than
those obtained with surfactant concentration under CMC. Moreover, comparing the enhancement
ratio values with data in literature and considering the low toxicity on HaCaT cell line, we can
conclude that these surfactants can be promising enhancers for transdermal delivery of HC. On the 360
base of these considerations, the choice of the suitable surfactant and its concentration should be
evaluated depending on the formulation purpose. These results also suggest the possible
concomitant use of the two surfactants (C12-OPK at concentrations above its CMC and C18-OPK
at concentrations below its CMC) for HC solubilization and the transdermal delivery.
365
13
References
Abruzzo, A., Cerchiara, T., Bigucci, F., Gallucci, M.C., Luppi, B., 2015. Mucoadhesive Buccal
Tablets Based on Chitosan/Gelatin Microparticles for Delivery of Propranolol Hydrochloride. J.
Pharm. Sci. 104, 4365-72.
370
Alvarez-nunez, F.A, Yalkowsky, S.H., 2000. Relationship between polysorbate 80 solubilization
descriptors and octanol-water partition coefficient of drugs. Int. J. Pharm. 200, 217-222.
Attwood, D., Florence, A.T., 1983. Chapman & Hall, London EC4P 4EE, United Kingdom.
375
Barichello, J.M., Handa, H., Kisyuku, M., Shibata, T., Ishida, T., Kiwada, H., 2006. Inducing effect
of liposomalization on the transdermal delivery of hydrocortisone: Creation of a drug supersaturated
state. J. Control. Release. 115, 94-102.
Barry, B.W., 1983. Dermatological Formulations; Percutaneous Absorption. Marcel Dekker, New 380
York.
Bergstrom, C.A.S., Norinder, U., Luthman, K., Artursson, P., 2002. Experimental and
Computational Screening Models for Prediction of Aqueous Drug Solubility. Pharm. Res. 19, 182-
188. 385
Bigucci, F., Abruzzo, A., Saladini, B., Gallucci, M.C., Cerchiara, T., Luppi, B., 2015. Development
and characterization of chitosan/hyaluronan film for transdermal delivery of thiocolchicoside.
Carbohydr. Polym. 130, 32-40.
390
Bondi, C.A., Marks, J.L., Wroblewski, L.B., Raatikainen, H.S., Lenox, S.R., Gebhardt, K.E., 2015.
Human and Environmental Toxicity of Sodium Lauryl Sulfate (SLS): Evidence for Safe Use in
Household Cleaning Products. Environ. Health. Insights. 17, 27-32.
Choi, S.Y., Seop, S.Y., Hyun, M.Y., Yoo, K.H., Kim, B.J., Kim, M.N., Ch, J.W., 2013. Safety 395
evaluation of topical valproate application. Toxicol Res. Jun. 29, 87-90.
14
Di Cagno, M., Luppi, B., 2013. Drug “supersaturation” states induced by polymeric micelles and
liposomes: A mechanistic investigation into permeability enhancements. Eur. J. Pharm. Sci. 48,
775-780. 400
Ghafourian, T., Nokhodchi, A., Kaialy, W., 2015. Surfactants as Penetration Enhancers for Dermal
and Transdermal Drug Delivery. In: Percutaneous Penetration Enhancers Chemical Methods in
Penetration Enhancement. Dragicevic-Curic and Mainbach Eds., Springer, 207-230.
405
Godwin D.A., Player M.R., Sowell J.W., Michniak B.B. Synthesis and investigation of urea
compounds as transdermal penetration enhancers. International Journal of Pharmaceutics. 1998, 167
165–175.
Karande, P., Jain, A., Mitragotri, S., 2006. Relationships between skin’s electrical impedance and 410
permeability in the presence of chemical enhancers. J. Control. Release. 110, 307-313.
Kim, M.J., Doh, H.J., Choi, M.K., Chung, S.J., Shim, C.K., Kim, D.D., Kim, J.S., Yong, C.S., Choi,
H.G., 2008. Skin permeation enhancement of diclofenac by fatty acids. Drug Deliv. 15, 373-379.
415
Lawrence, J.N., Starkey, S., Dickson, F.M., Benford, D.J., 1996. Use of human and rat keratinocyte
cultures to assess skin irritation potential. Toxicol in Vitro, 10, 331–340.
Malferrari, D., Armenise, N., Decesari, S., Galletti, P., Tagliavini, E., 2015. Surfactants from
Itaconic Acid: Physicochemical Properties and Assessment of the Synthetic Strategies. ACS 420
Sustainable Chem. Eng. 3, 1579-1588.
Meyer, W., Schwarz, R., Neurand, K., 1978. The skin of domestic mammals as a model for the
human skin, with special reference to the domestic pig. Curr. Probl. Dermatol. 7, 39-52.
Nokhodchi, A., Shokri, J., Dashbolaghi, A., Hassan-Zadeh, D., 2003. The enhancement effect of 425
surfactants on the penetration of lorazepam through rat skin. Int. J. Pharm. 250, 359-369.
Pandey, A., Mittal, A., Chauhan, N., Alam, S., 2014. Role of Surfactants as Penetration Enhancer in
Transdermal Drug Delivery System. J Mol Pharm Org Process Res. 2 (2), 113.
430

15
Park, Y.H., Kim, J.N., Jeong, S.H., Choi, J.E., Lee, S.H., Choi, B.H., Lee, J.P., Sohn, K.H., Park,
K.L, Kim, M.K., Son, S.W., 2010. Assessment of dermal toxicity of nanosilica using cultured
keratinocytes, a human skin equivalent model and an in vivo model. Toxicology. 267, 178-81
Rangel-Yagui, C.O., Pessoa, Jr.A., Tavares, L.C., 2005. Micellar solubilization of drugs. J. Pharm. 435
Pharm. Sci. 8(2),147-163.
Raghavan, S.L., Kiepfer, B., Davis, A.F., Kazarian, S.G., Hadgraft, J., 2001. Membrane transport of
hydrocortisone acetate from supersaturated solutions; the role of polymers. Int J Pharm. 19, 221(1-
2): 95-105. 440
Raghavan, S.L., Trividic, A., Davis, A.F., Hadgraft, J., 2000. Effect of cellulose polymers on
supersaturation and in vitro membrane transport of hydrocortisone acetate. Int. J. Pharm. 193, 231–
237.
445
Sanchez, L., Mitjans, M., Infante, M.R., Vinardell, M.P., 2006. Potential irritation of lysine
derivative surfactants by hemolysis and HaCaT cell viability. Toxicol. Lett. 161(1), 53-60.
Sarheed, O., 2013. Combination treatments of chemical enhancers with low frequency ultrasound
for the transdermal delivery of hydorcortisone, SENRA Academic Publishers, British Columbia, 450
Canadian Journal of Pure and Applied Sciences. 7, 2463-2473.
Simon, G.A., Maibach, H.I., 2000. The pig as an experimental animal model of percutaneous
permeation in man: qualitative and quantitative observations-an overview. Skin Pharmacol. Appl.
Skin Physiol. 13, 229-234. 455
Som, I., Bhatia, K., Yasir, M., 2012. Status of surfactants as penetration enhancers in transdermal
drug delivery. J. Pharm. Bioallied. Sci. 4(1): 2-9.
Williams, A.C., Barry, B.W., 2004. Penetration enhancers. Adv. Drug Del. Rev. 56, 603-618. 460
16
Figure captions 465
Figure 1. Cytotoxicity exhibited by C12-OPK surfactant to HaCaT keratinocytes in vitro. HaCaT
cells were exposed to complete cell culture medium (control), or surfactants at concentrations
ranging from 0.5-1000 mg/L for 24 h and cell viability assessed using the Alamar Blue assay. Data
are expressed as % viability (% of control), (means ± SEM, n= 3). Significance indicated by = p 470
< 0.001, compared to the control.
Figure 2. Cytotoxicity exhibited by C18-OPK surfactant to HaCaT keratinocytes in vitro. HaCaT
cells were exposed to complete cell culture medium (control), or surfactants at concentrations
ranging from 0.5-1000 mg/L for 24 h and cell viability assessed using the Alamar Blue assay. Data 475
are expressed as % viability (% of control), (means ± SEM, n= 3). Significance indicated by = p
< 0.001, compared to the control.
Figure 3. Solubility curve of HC as a function of C12-OPK concentration in water at 25 °C. Data
are expressed as means ± SD, n= 3. Significance indicated by ** = p < 0.01, compared to HC 480
solubility.
Figure 4. Solubility curve of HC as a function of C18-OPK concentration in water at 25 °C. Data
are expressed as means ± SD, n= 3. Significance indicated by **= p < 0.01 and †= p > 0.05
compared to HC solubility. 485
Figure 5. Permeation profiles of HC and fluxes (J) in the absence and presence of different
concentrations of C12-OPK and C18-OPK through porcine skin. Data are expressed as means ± SD,
n= 4. Significance indicated by = p < 0.001, **= p < 0.01 and †= p > 0.05 compared to JHC.
490
Figure 6. HC permeability coefficients (Kp) in the absence and presence of various surfactant
concentrations. Data are expressed as means ± SD, n= 4. Significance indicated by **= p < 0.01 and
by *= p < 0.05 and †= p > 0.05 compared to Kp of HC.
495
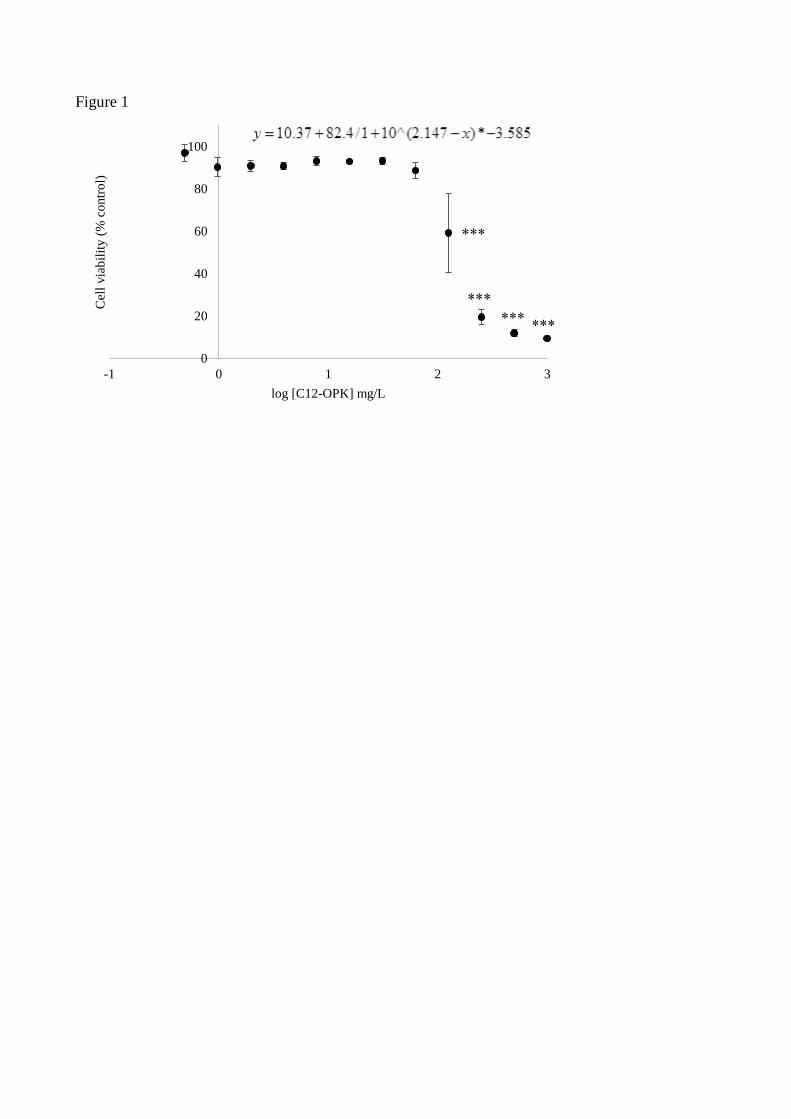
Figure 1
0
20
40
60
80
100
-1 0 1 2 3
Cel
l via
bil
ity (
% c
ontr
ol)
log [C12-OPK] mg/L
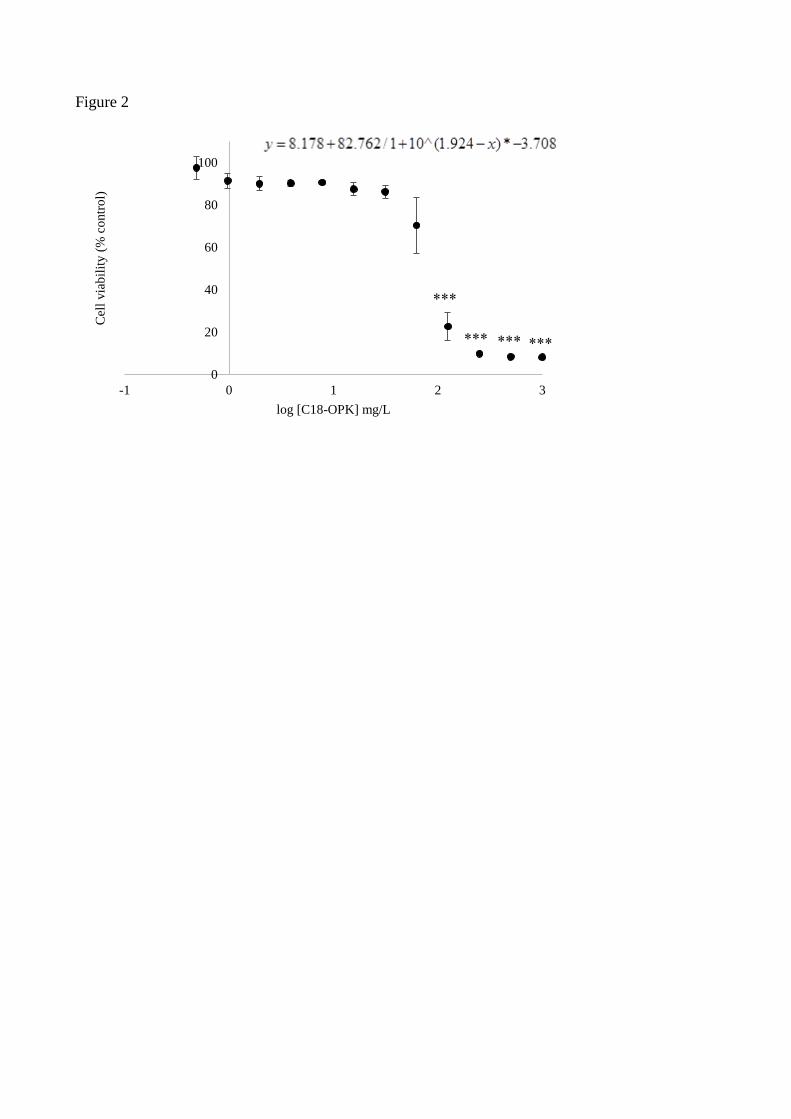
Figure 2
0
20
40
60
80
100
-1 0 1 2 3
Cel
l via
bil
ity (
% c
ontr
ol)
log [C18-OPK] mg/L
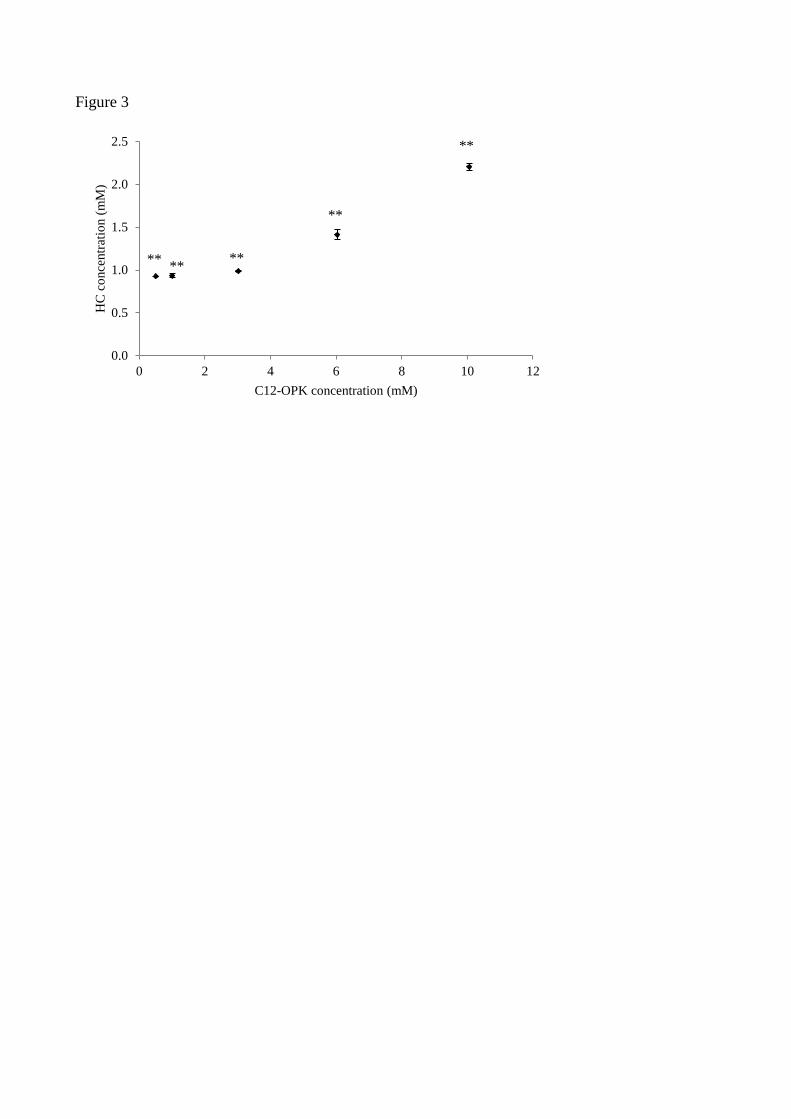
Figure 3
0.0
0.5
1.0
1.5
2.0
2.5
0 2 4 6 8 10 12
HC
co
nce
ntr
atio
n (
mM
)
C12-OPK concentration (mM)
** **
**
**
**
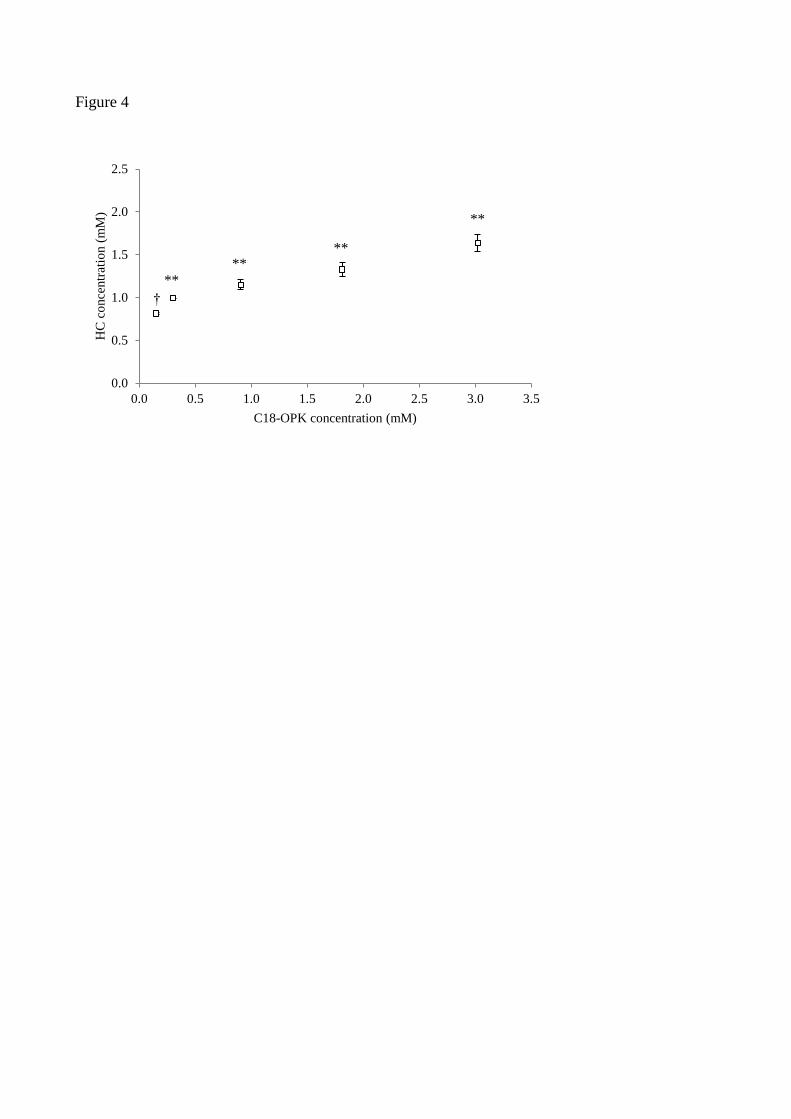
Figure 4
0.0
0.5
1.0
1.5
2.0
2.5
0.0 0.5 1.0 1.5 2.0 2.5 3.0 3.5
HC
co
nce
ntr
atio
n (
mM
)
C18-OPK concentration (mM)
**
** **
**
†
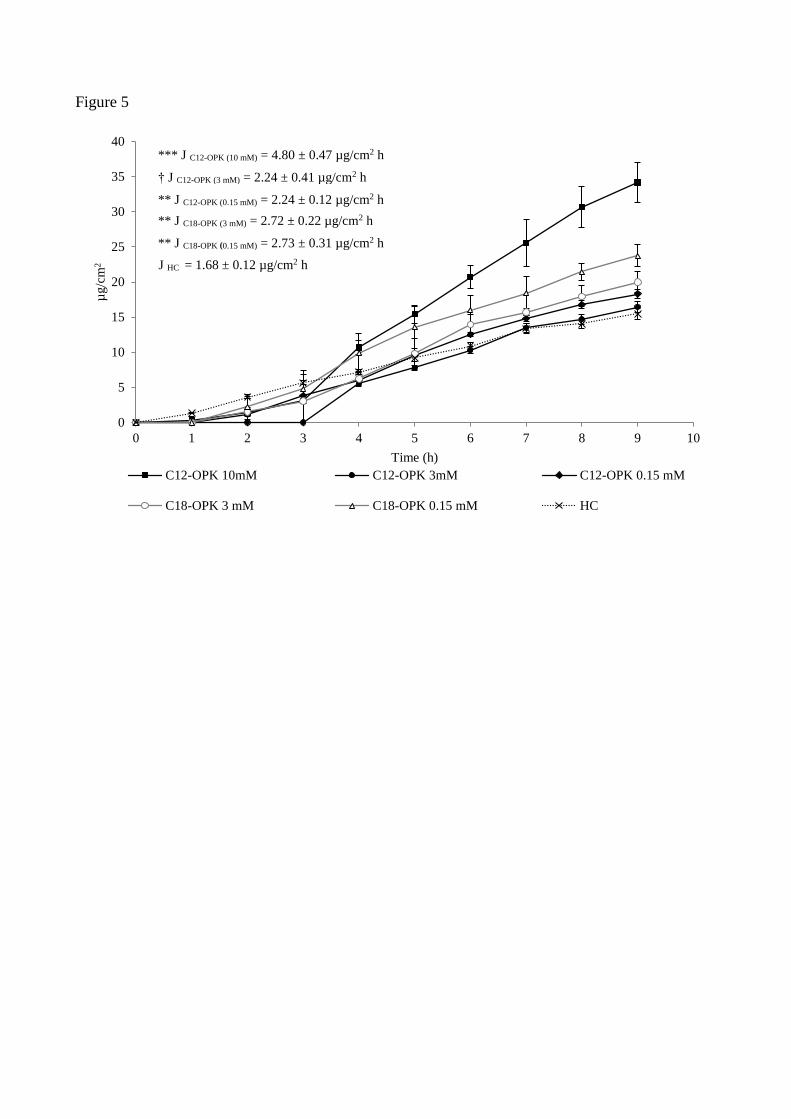
Figure 5
0
5
10
15
20
25
30
35
40
0 1 2 3 4 5 6 7 8 9 10
µg/c
m2
Time (h)
C12-OPK 10mM C12-OPK 3mM C12-OPK 0.15 mM
C18-OPK 3 mM C18-OPK 0.15 mM HC
*** J C12-OPK (10 mM) = 4.80 ± 0.47 µg/cm2 h
† J C12-OPK (3 mM) = 2.24 ± 0.41 µg/cm2 h
** J C12-OPK (0.15 mM) = 2.24 ± 0.12 µg/cm2 h
** J C18-OPK (3 mM) = 2.72 ± 0.22 µg/cm2 h
** J C18-OPK (0.15 mM) = 2.73 ± 0.31 µg/cm2 h
J HC = 1.68 ± 0.12 µg/cm2 h
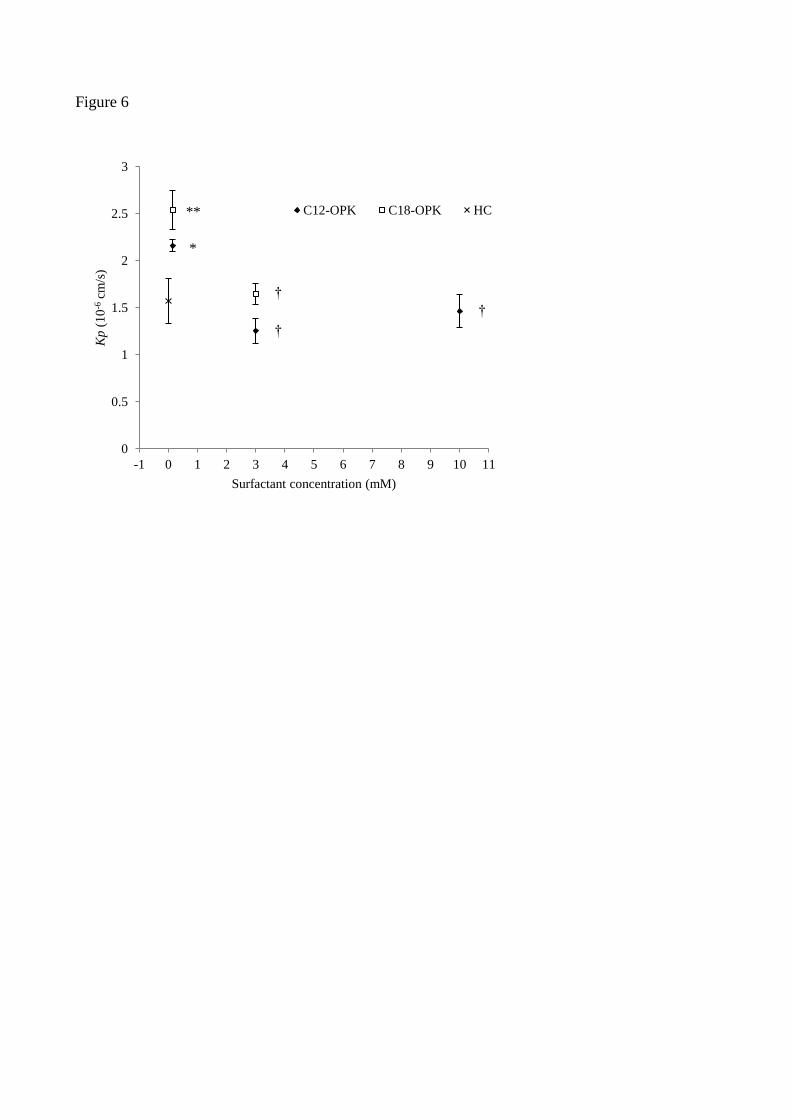
Figure 6
0
0.5
1
1.5
2
2.5
3
-1 0 1 2 3 4 5 6 7 8 9 10 11
Kp
(10
-6cm
/s)
Surfactant concentration (mM)
C12-OPK C18-OPK HC
*
**
†
†
†