Embed Size (px)
Citation preview
Surfactant Flushing
2009 Pilot Study2009 Pilot StudyFueling Point – Military SiteFueling Point – Military Site
Northeastern USANortheastern USA
Jeffrey H. HarwellAsahi Glass Chair of Chemical EngineeringThe University of OklahomaPrincipalSurbec Environmental, LLC
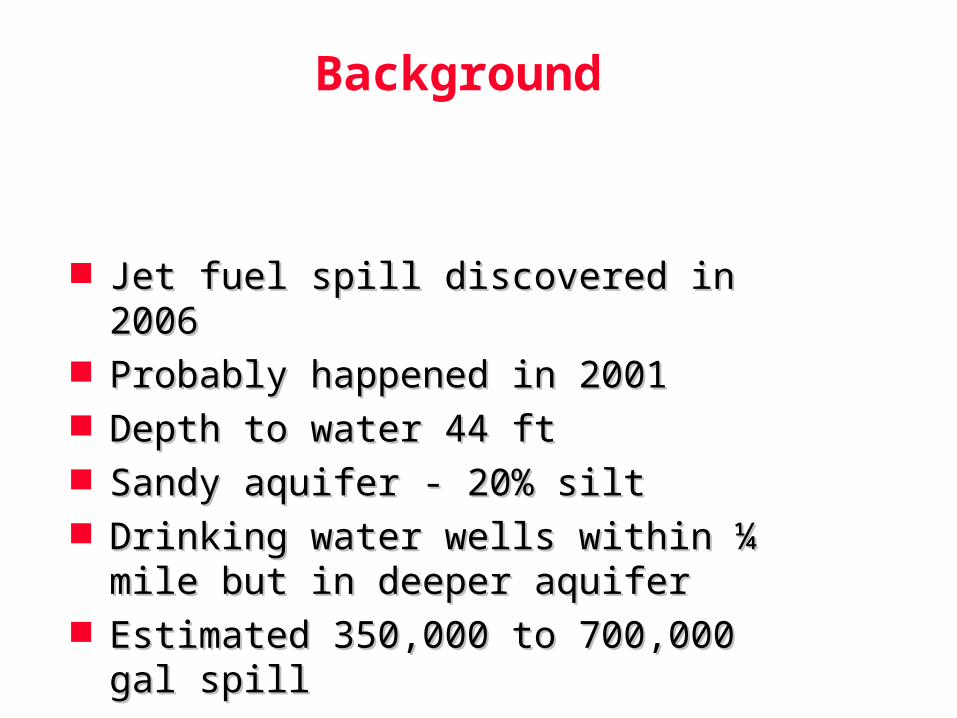
Background
Jet fuel spill discovered in 2006Jet fuel spill discovered in 2006 Probably happened in 2001Probably happened in 2001 Depth to water 44 ftDepth to water 44 ft Sandy aquifer - 20% siltSandy aquifer - 20% silt Drinking water wells within ¼ mile but in Drinking water wells within ¼ mile but in
deeper aquiferdeeper aquifer Estimated 350,000 to 700,000 gal spillEstimated 350,000 to 700,000 gal spill
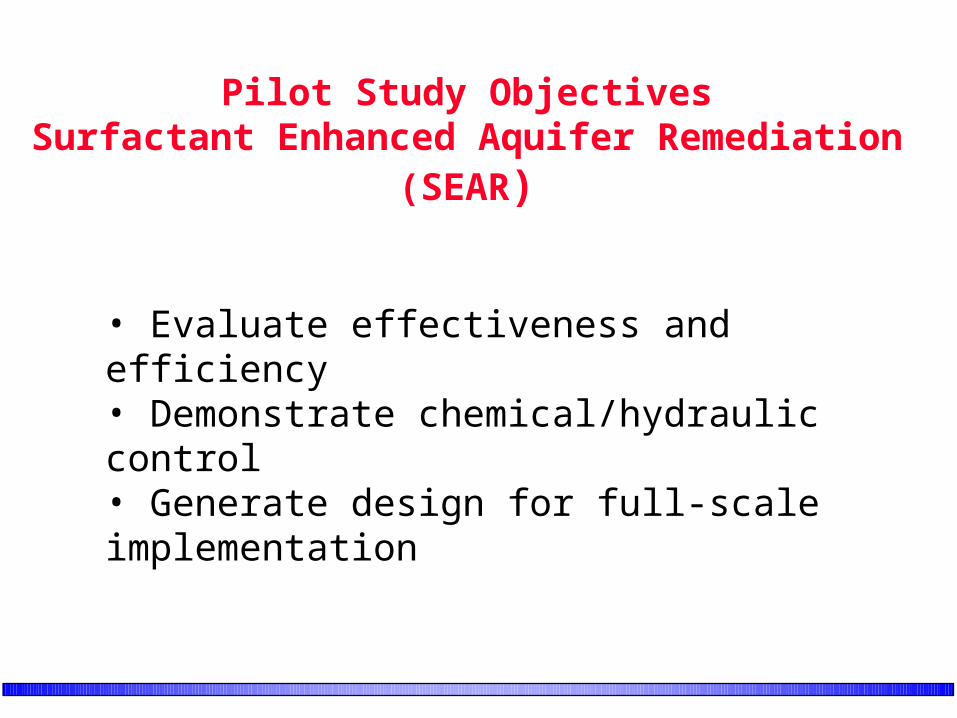
Pilot Study ObjectivesSurfactant Enhanced Aquifer Remediation (SEAR)
• Evaluate effectiveness and efficiency• Demonstrate chemical/hydraulic control• Generate design for full-scale implementation
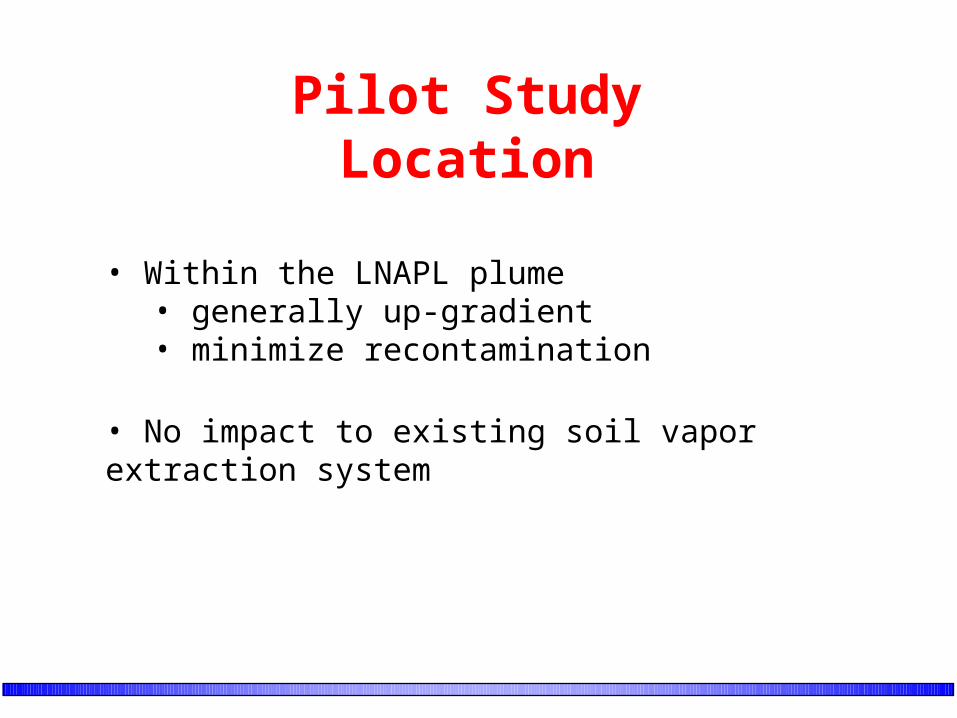
• Within the LNAPL plume • generally up-gradient• minimize recontamination
• No impact to existing soil vapor extraction system
Pilot Study Location

Treatability Study
• Surfactant system designSurfactant system design• Provide proof of concept Provide proof of concept
• Geochemistry considerationsGeochemistry considerations• Heterogeneity issuesHeterogeneity issues
• Optimization of injection strategyOptimization of injection strategy
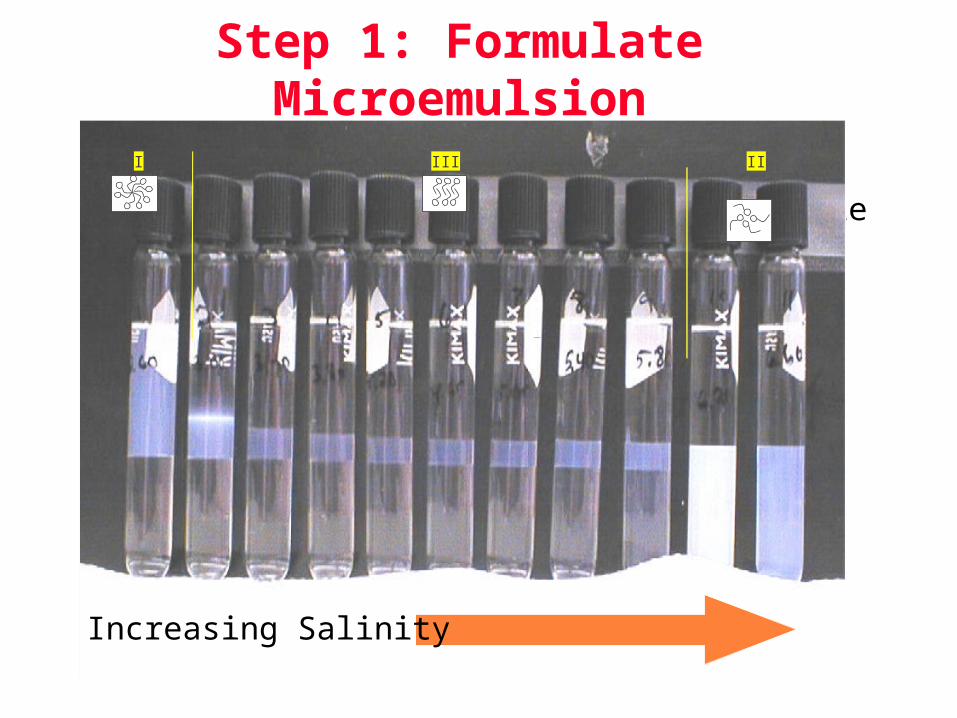
Step 1: Formulate Microemulsion
MonomerMonomer
OrganicContaminant
Micelle
Increasing Salinity
I III II
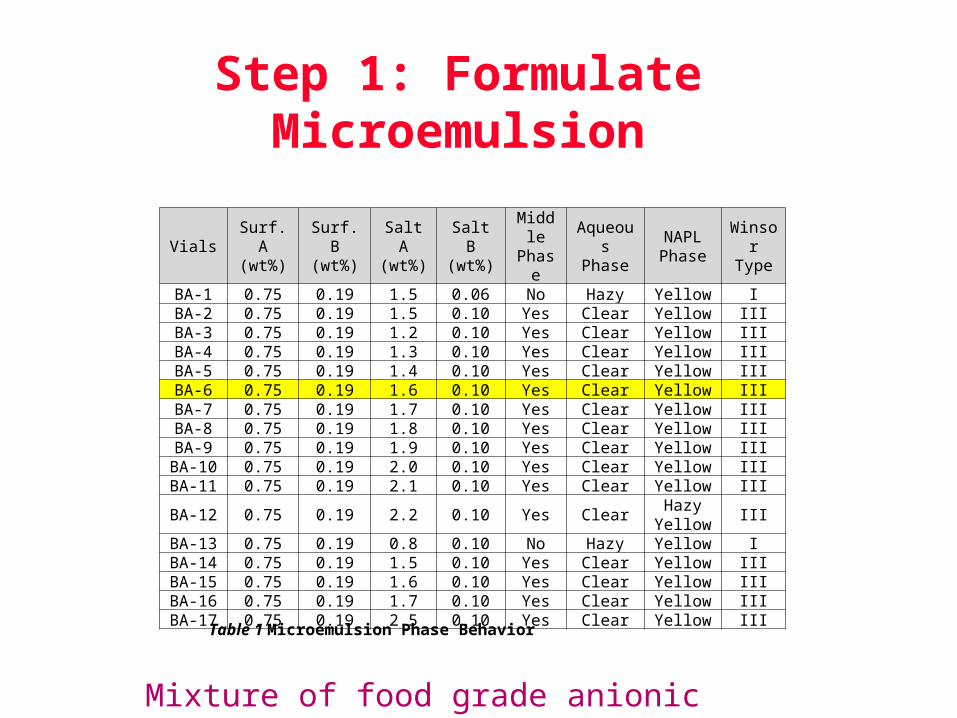
VialsSurf. A(wt%)
Surf. B(wt%)
Salt A(wt%)
Salt B(wt%)
Middle
Phase
Aqueous
Phase
NAPLPhase
Winsor
TypeBA-1 0.75 0.19 1.5 0.06 No Hazy Yellow IBA-2 0.75 0.19 1.5 0.10 Yes Clear Yellow IIIBA-3 0.75 0.19 1.2 0.10 Yes Clear Yellow IIIBA-4 0.75 0.19 1.3 0.10 Yes Clear Yellow IIIBA-5 0.75 0.19 1.4 0.10 Yes Clear Yellow IIIBA-6 0.75 0.19 1.6 0.10 Yes Clear Yellow IIIBA-7 0.75 0.19 1.7 0.10 Yes Clear Yellow IIIBA-8 0.75 0.19 1.8 0.10 Yes Clear Yellow IIIBA-9 0.75 0.19 1.9 0.10 Yes Clear Yellow III
BA-10 0.75 0.19 2.0 0.10 Yes Clear Yellow IIIBA-11 0.75 0.19 2.1 0.10 Yes Clear Yellow III
BA-12 0.75 0.19 2.2 0.10 Yes ClearHazy
YellowIII
BA-13 0.75 0.19 0.8 0.10 No Hazy Yellow IBA-14 0.75 0.19 1.5 0.10 Yes Clear Yellow IIIBA-15 0.75 0.19 1.6 0.10 Yes Clear Yellow IIIBA-16 0.75 0.19 1.7 0.10 Yes Clear Yellow IIIBA-17 0.75 0.19 2.5 0.10 Yes Clear Yellow III
Table 1 Microemulsion Phase Behavior
Step 1: Formulate Microemulsion
Mixture of food grade anionic surfactants
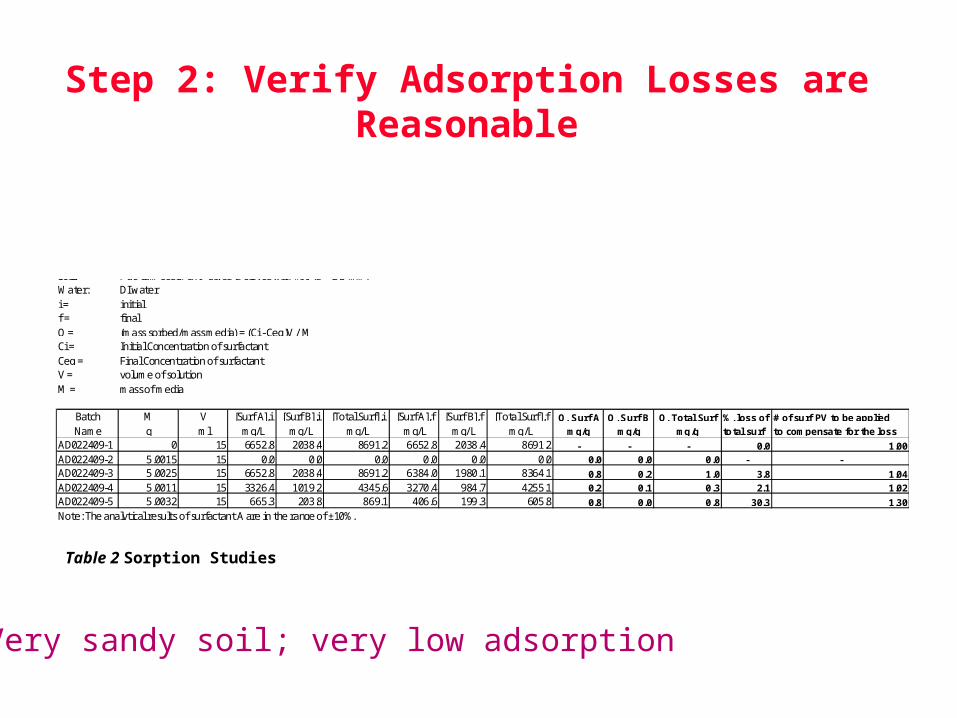
Table 2 Sorption Studies
Summary of Sorption Test Ft. Drum
Soil: Ft. Drum sediment - dryed & sieved with #10 (d < 2.0 mm)Water: DI wateri = initialf = finalQ = (mass sorbed/mass media) = (Ci - Ceq)V / MCi = Initial Concentration of surfactantCeq = Final Concentration of surfactantV = volume of solutionM = mass of media
Batch M V [Surf A],i [Surf B],i [Total Surf],i [Surf A],f [Surf B],f [Total Surf],f Q, Surf A Q, Surf B Q, Total Surf %, loss of # of surf PV to be applied Name g ml mg/L mg/L mg/L mg/L mg/L mg/L mg/g mg/g mg/g total surf to compensate for the loss
AD022409-1 0 15 6652.8 2038.4 8691.2 6652.8 2038.4 8691.2 - - - 0.0 1.00AD022409-2 5.0015 15 0.0 0.0 0.0 0.0 0.0 0.0 0.0 0.0 0.0 - -AD022409-3 5.0025 15 6652.8 2038.4 8691.2 6384.0 1980.1 8364.1 0.8 0.2 1.0 3.8 1.04AD022409-4 5.0011 15 3326.4 1019.2 4345.6 3270.4 984.7 4255.1 0.2 0.1 0.3 2.1 1.02AD022409-5 5.0032 15 665.3 203.8 869.1 406.6 199.3 605.8 0.8 0.0 0.8 30.3 1.30Note: The analytical results of surfactant A are in the range of ±10%.
Step 2: Verify Adsorption Losses are Reasonable
Very sandy soil; very low adsorption
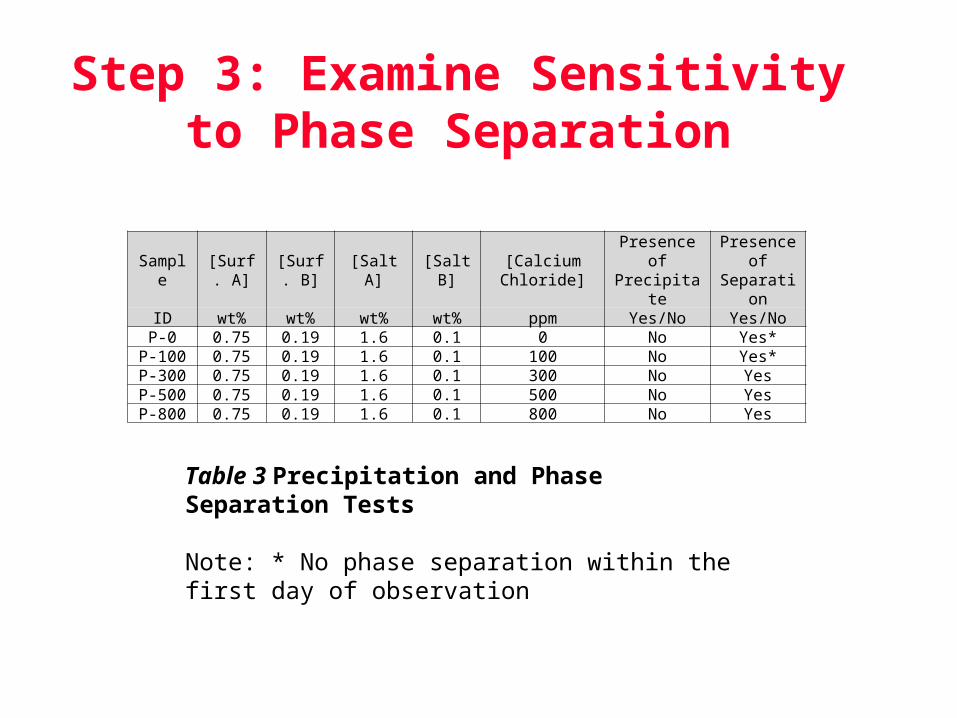
Sample[Surf.
A][Surf.
B][Salt A] [Salt B]
[Calcium Chloride]
Presence of Precipitate
Presence of
SeparationID wt% wt% wt% wt% ppm Yes/No Yes/No
P-0 0.75 0.19 1.6 0.1 0 No Yes*P-100 0.75 0.19 1.6 0.1 100 No Yes*P-300 0.75 0.19 1.6 0.1 300 No YesP-500 0.75 0.19 1.6 0.1 500 No YesP-800 0.75 0.19 1.6 0.1 800 No Yes
Table 3 Precipitation and Phase Separation Tests
Note: * No phase separation within the first day of observation
Step 3: Examine Sensitivity to Phase Separation
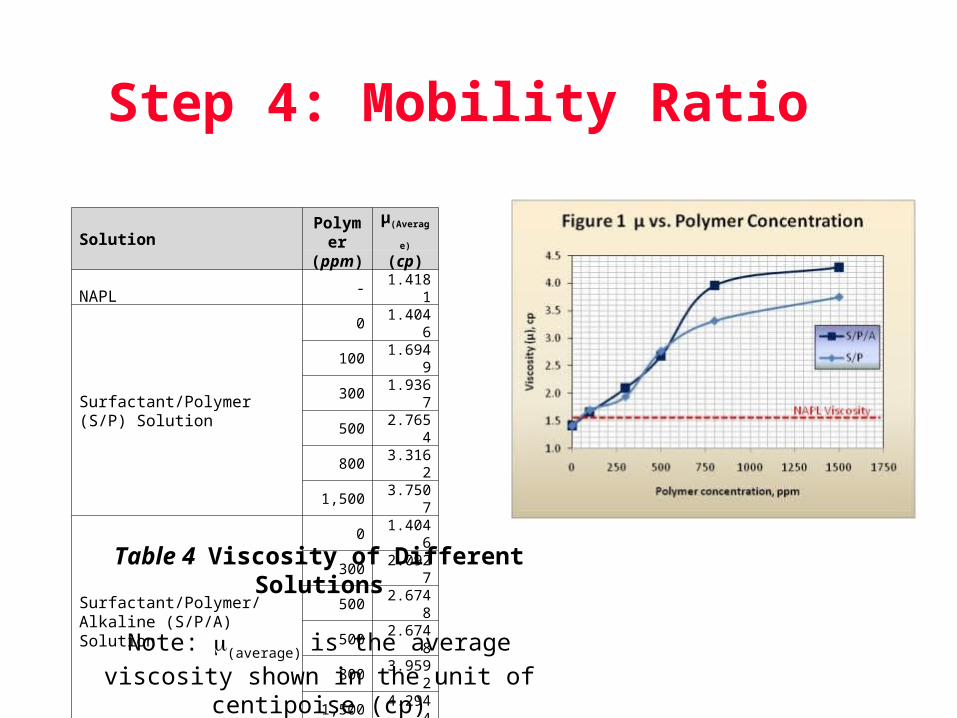
SolutionPolyme
r μ(Average)
(ppm) (cp)NAPL - 1.4181
Surfactant/Polymer (S/P) Solution
0 1.4046100 1.6949300 1.9367500 2.7654800 3.3162
1,500 3.7507
Surfactant/Polymer/Alkaline (S/P/A) Solution
0 1.4046300 2.0927500 2.6748500 2.6748800 3.9592
1,500 4.2944
Table 4 Viscosity of Different Solutions
Note: (average) is the average viscosity shown in the
unit of centipoise (cp)
Step 4: Mobility Ratio
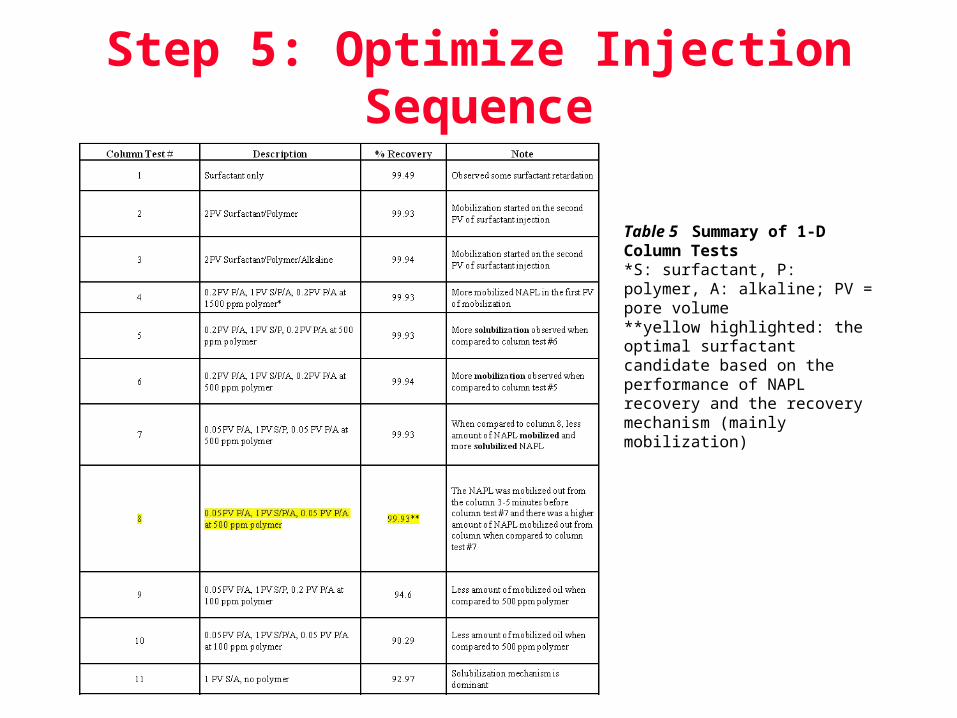
Table 5 Summary of 1-D Column Tests*S: surfactant, P: polymer, A: alkaline; PV = pore volume**yellow highlighted: the optimal surfactant candidate based on the performance of NAPL recovery and the recovery mechanism (mainly mobilization)
Step 5: Optimize Injection Sequence
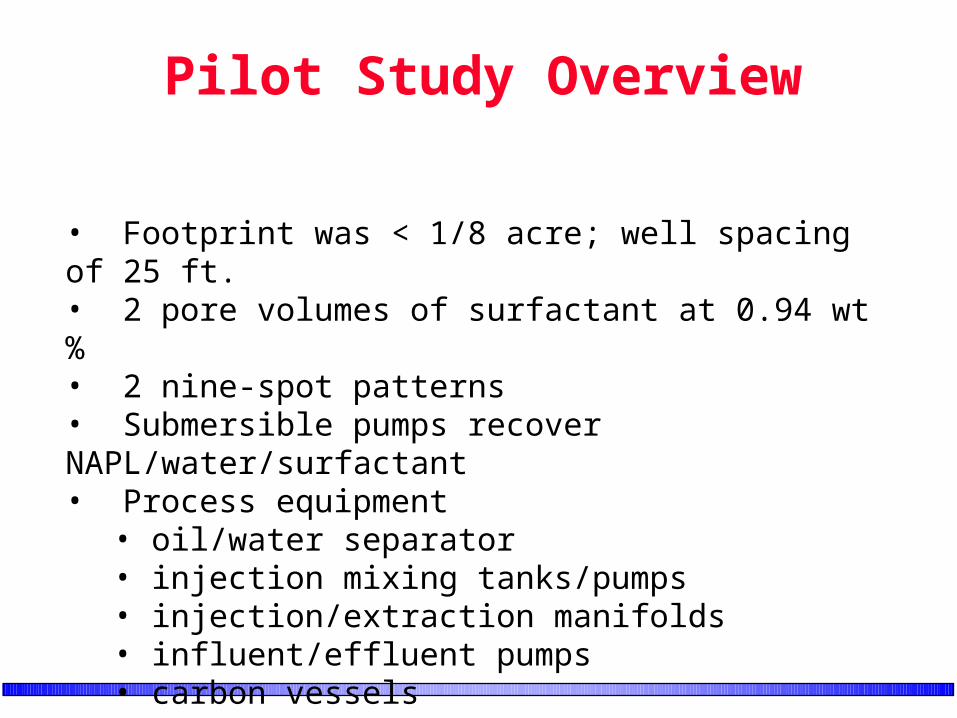
Pilot Study Overview
• Footprint was < 1/8 acre; well spacing of 25 ft.• 2 pore volumes of surfactant at 0.94 wt %• 2 nine-spot patterns• Submersible pumps recover NAPL/water/surfactant• Process equipment
• oil/water separator• injection mixing tanks/pumps • injection/extraction manifolds• influent/effluent pumps• carbon vessels
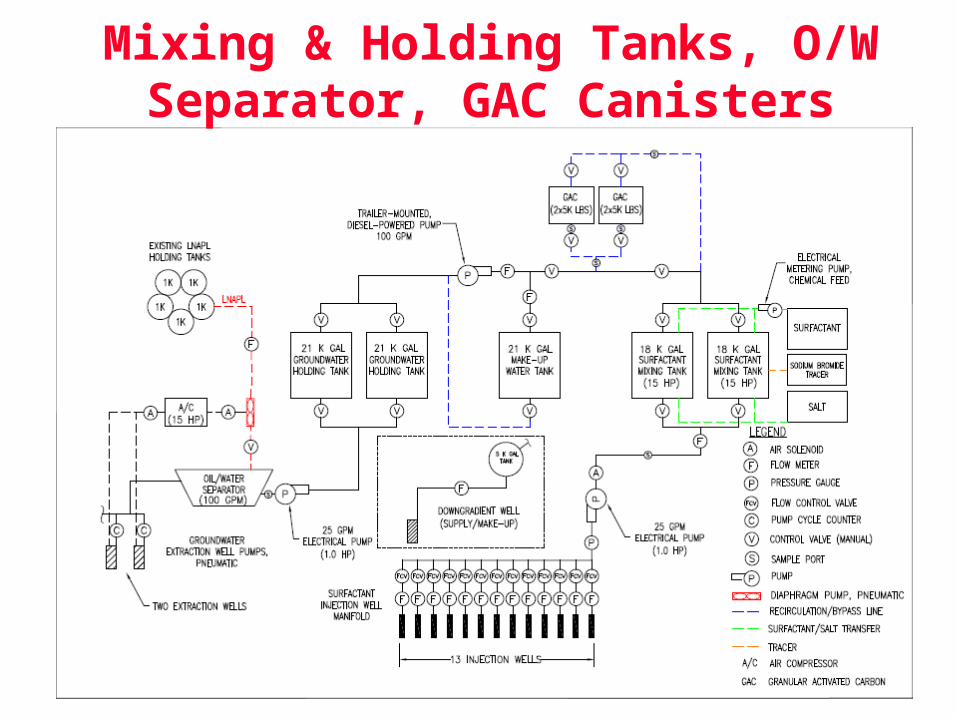
Mixing & Holding Tanks, O/W Separator, GAC Canisters
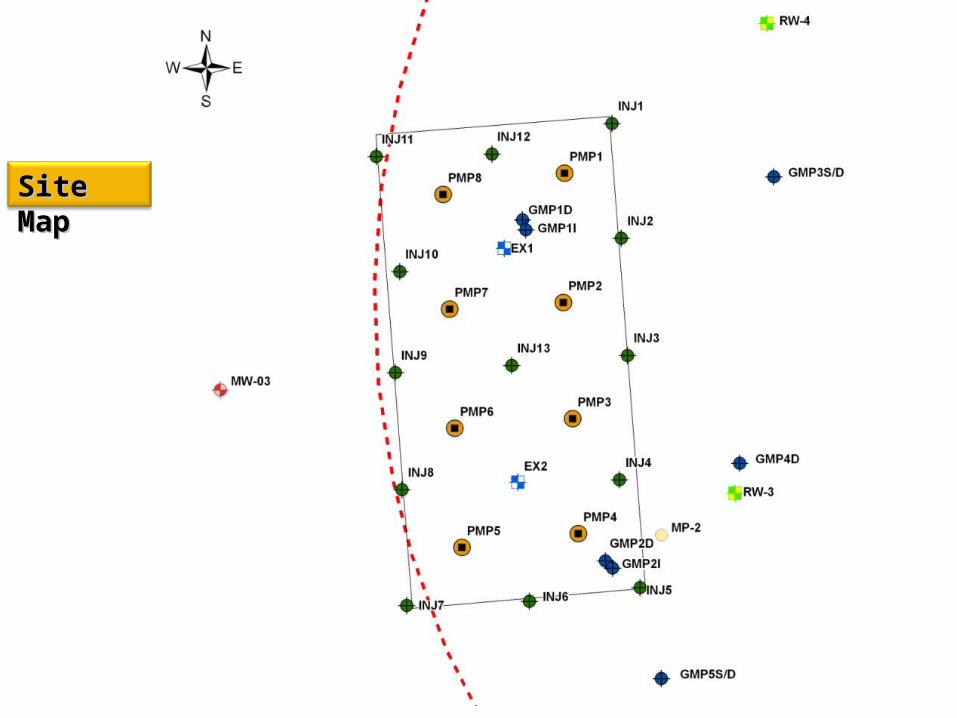
Site Site MapMap
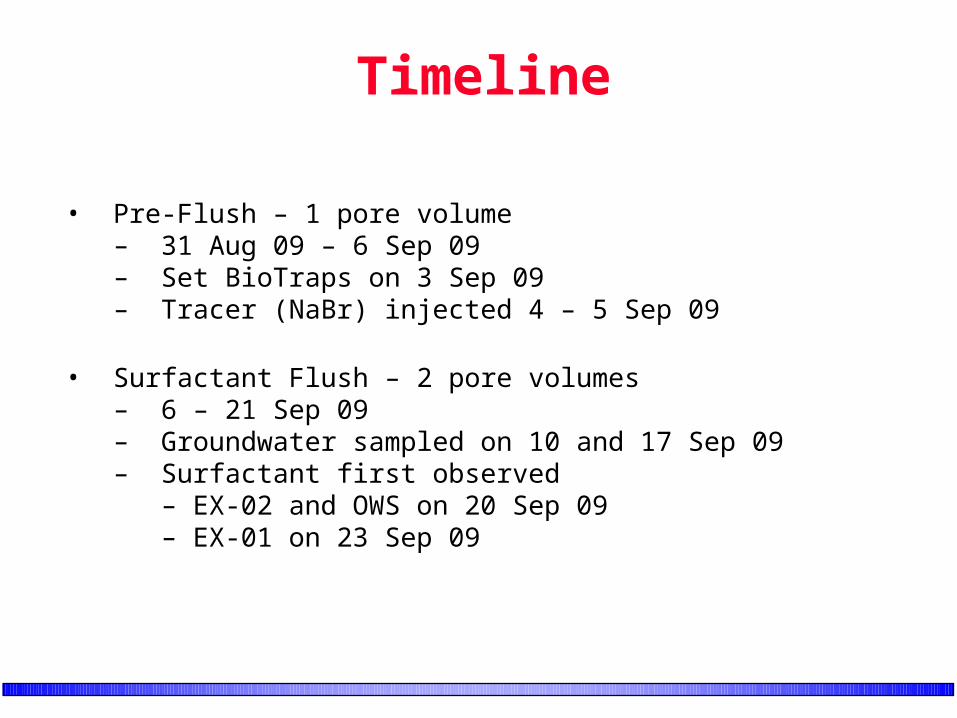
Timeline
• Pre-Flush – 1 pore volume– 31 Aug 09 – 6 Sep 09– Set BioTraps on 3 Sep 09– Tracer (NaBr) injected 4 – 5 Sep 09
• Surfactant Flush – 2 pore volumes– 6 – 21 Sep 09 – Groundwater sampled on 10 and 17 Sep 09– Surfactant first observed
– EX-02 and OWS on 20 Sep 09– EX-01 on 23 Sep 09
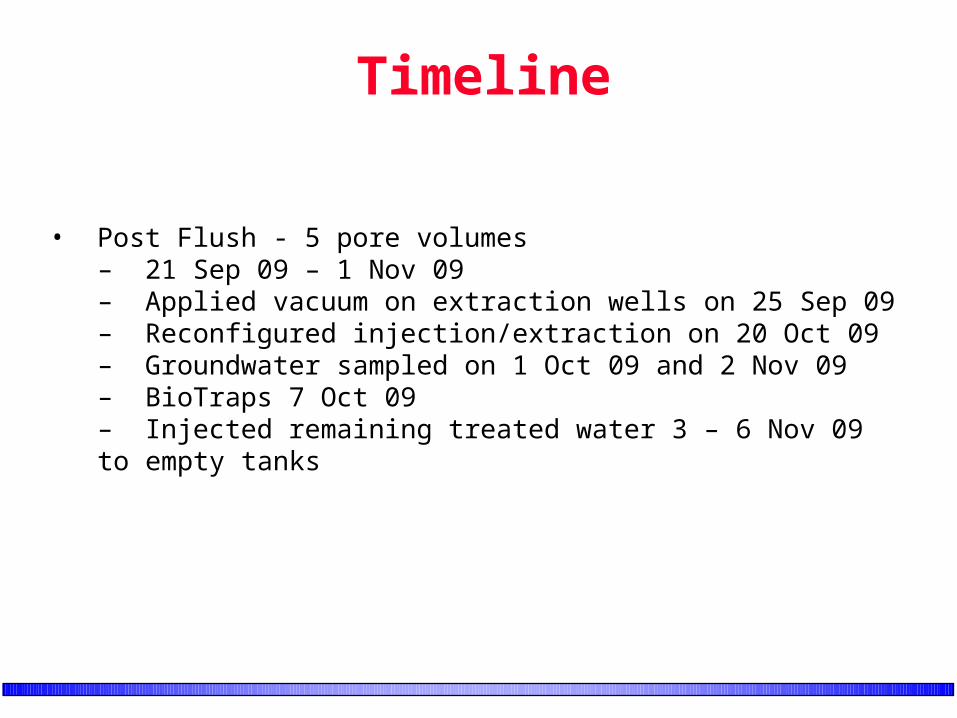
Timeline
• Post Flush - 5 pore volumes– 21 Sep 09 – 1 Nov 09– Applied vacuum on extraction wells on 25 Sep 09– Reconfigured injection/extraction on 20 Oct 09– Groundwater sampled on 1 Oct 09 and 2 Nov 09 – BioTraps 7 Oct 09– Injected remaining treated water 3 – 6 Nov 09 to empty tanks
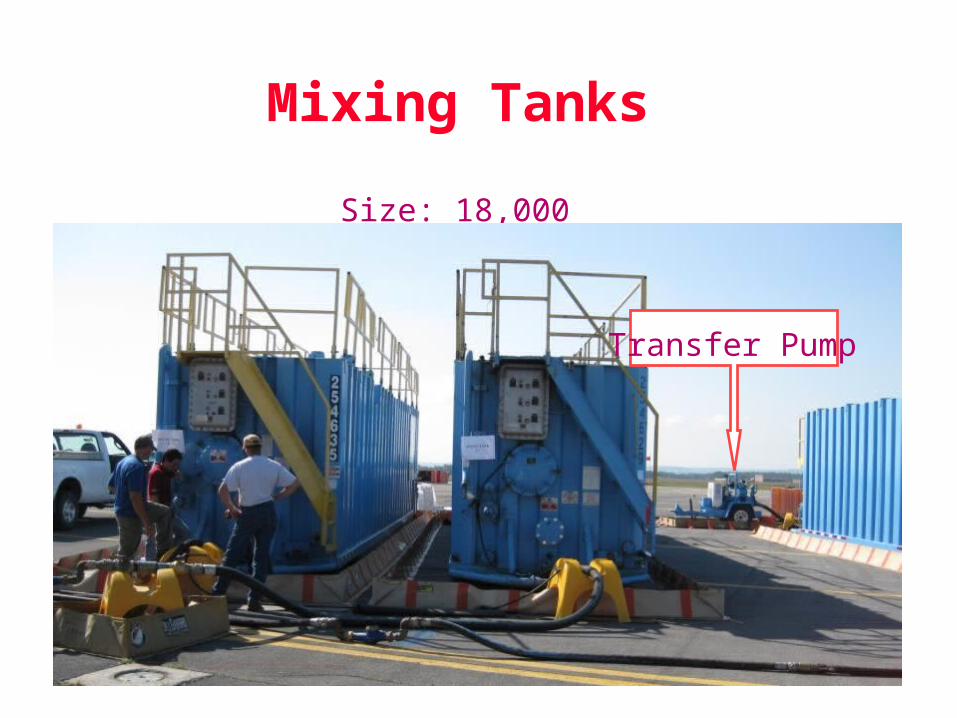
Size: 18,000 Gallons
Transfer Pump
Mixing Tanks
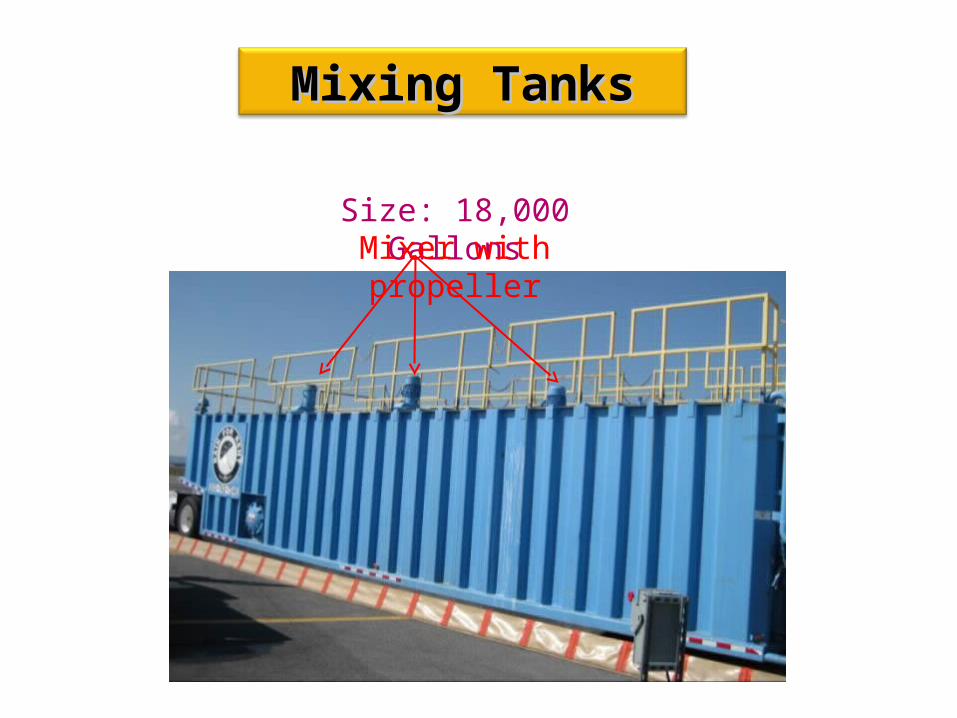
Mixing TanksMixing Tanks
Size: 18,000 GallonsMixer with propeller
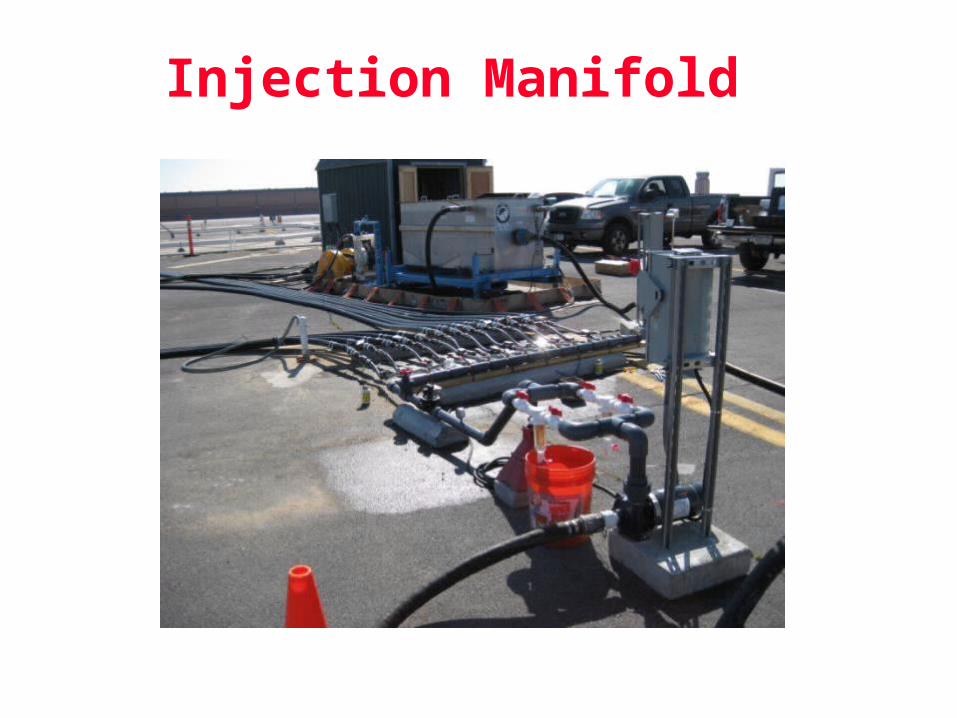
Injection Manifold
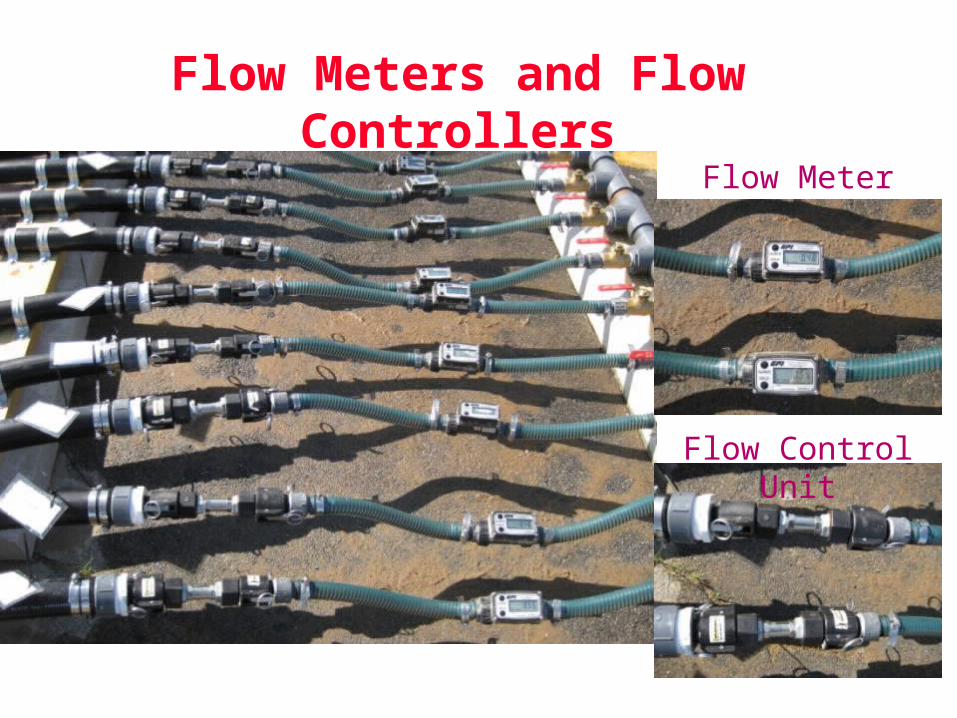
Flow Meter
Flow Control Unit
Flow Meters and Flow Controllers
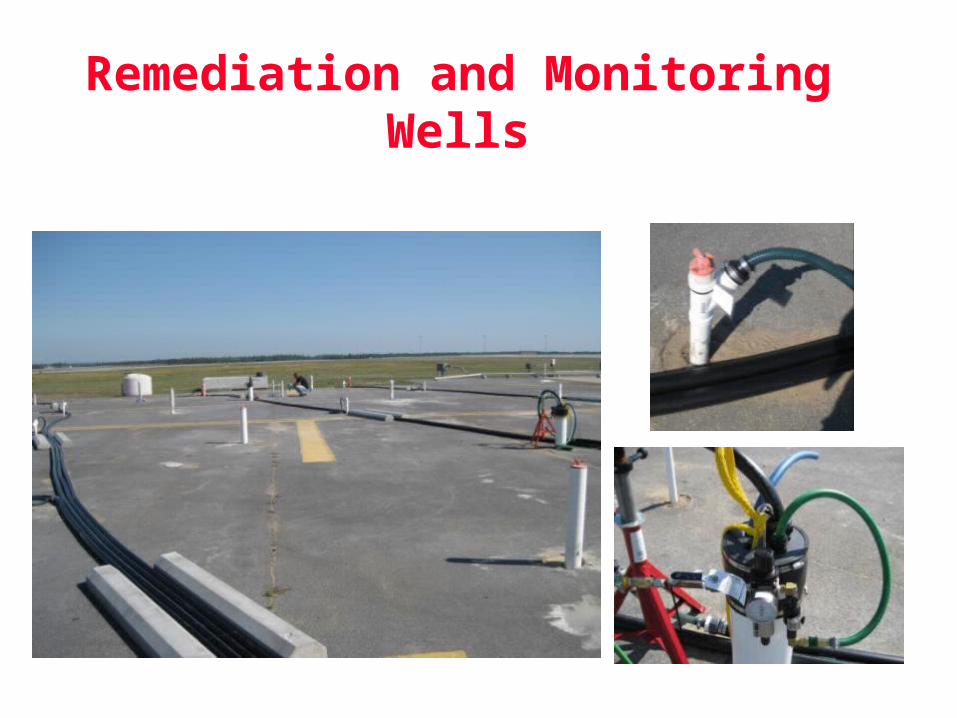
Remediation and Monitoring Wells
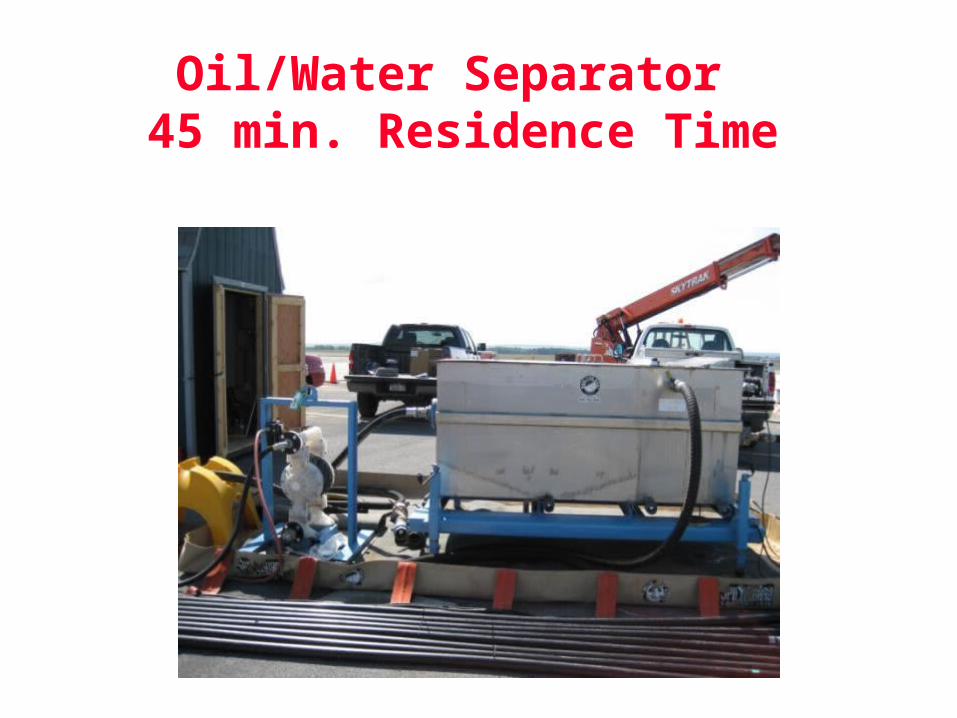
Oil/Water Separator 45 min. Residence Time
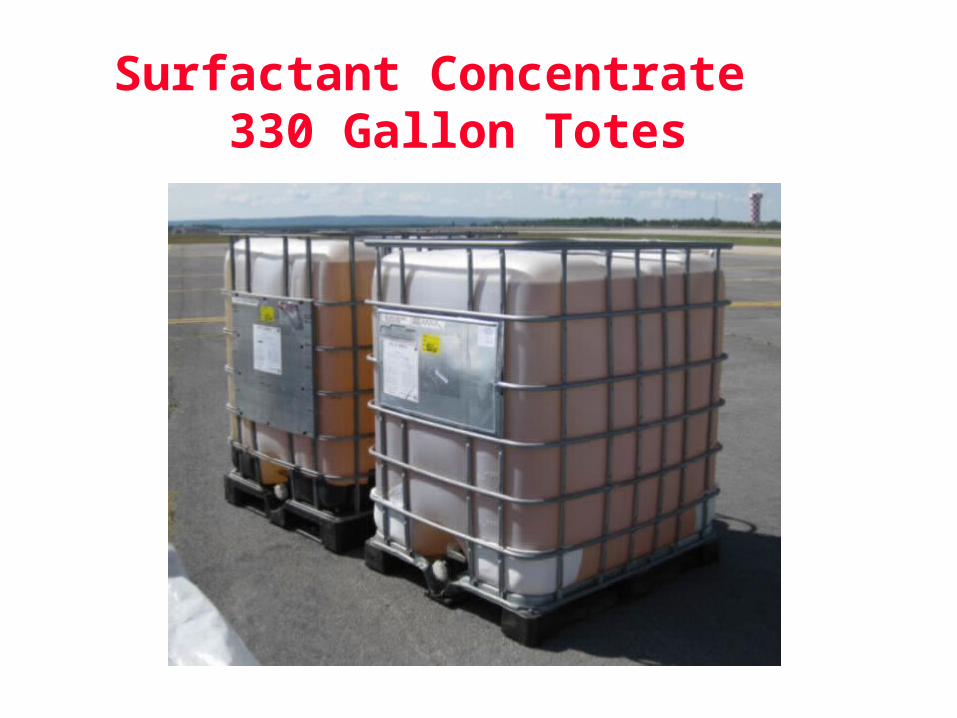
Surfactant Concentrate 330 Gallon Totes
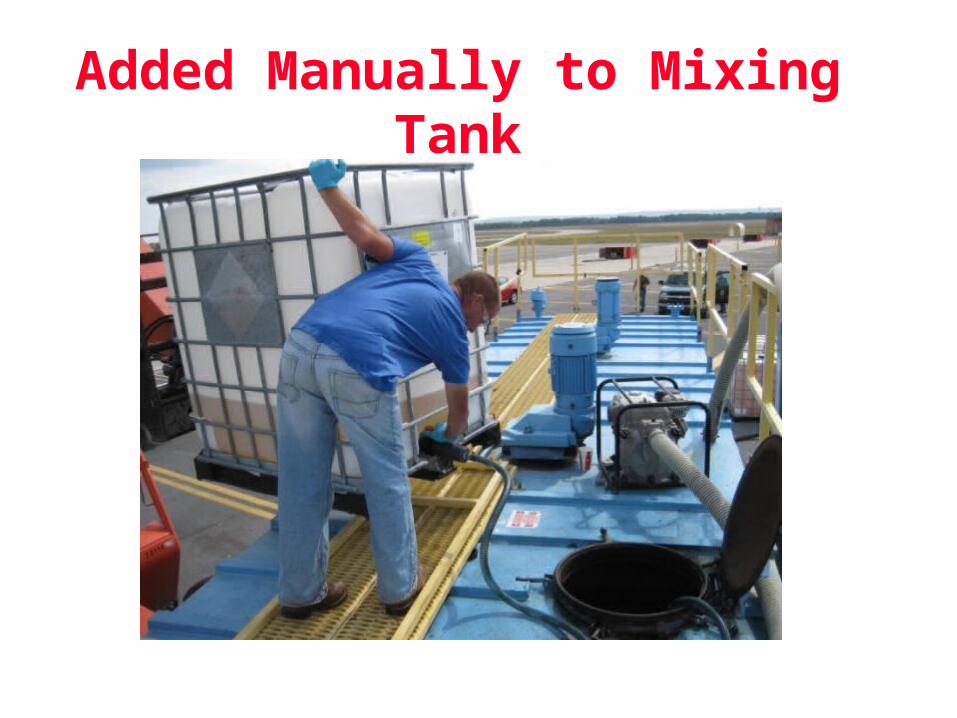
Added Manually to Mixing Tank
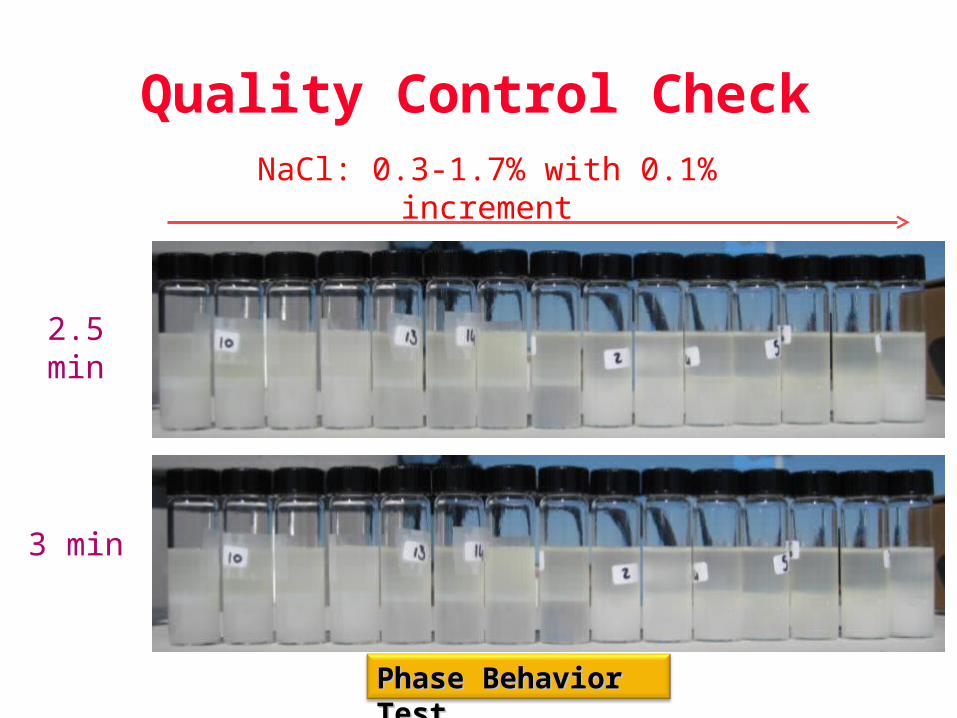
Phase Behavior Phase Behavior TestTest
2.5 min
3 min
NaCl: 0.3-1.7% with 0.1% increment
Quality Control Check
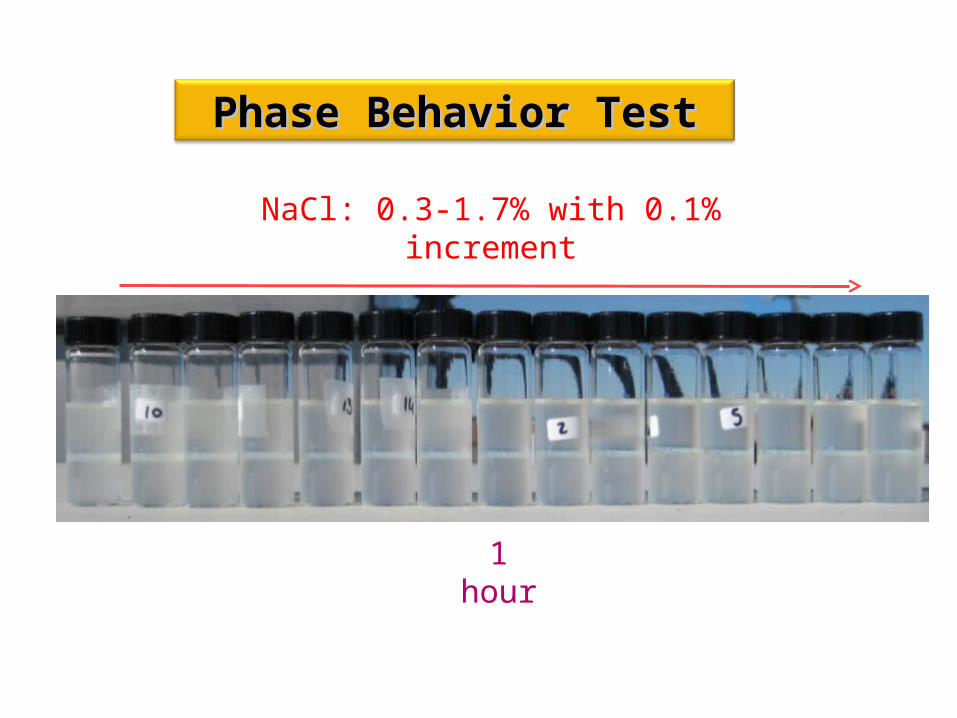
Phase Behavior TestPhase Behavior Test
1 hour
NaCl: 0.3-1.7% with 0.1% increment
Data Assessment
• Pre-Pilot Conditions– API Model estimated 2,300 gal LNAPL
• Results– Total LNAPL Recovery was 2,740 gal– API Model estimated140 gal remained
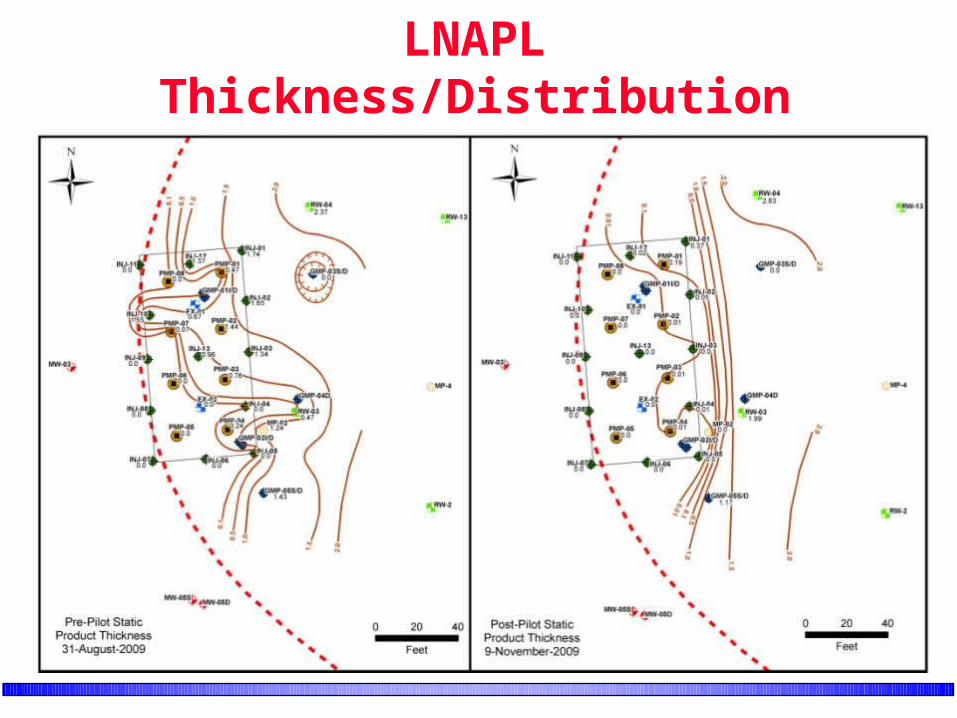
LNAPL Thickness/Distribution
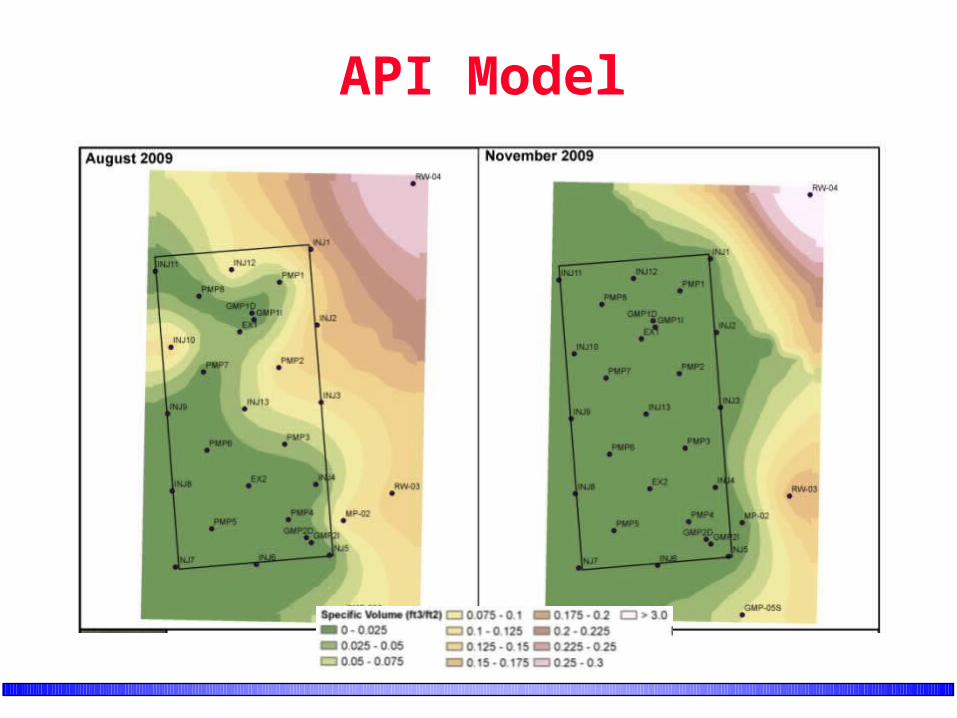
API Model
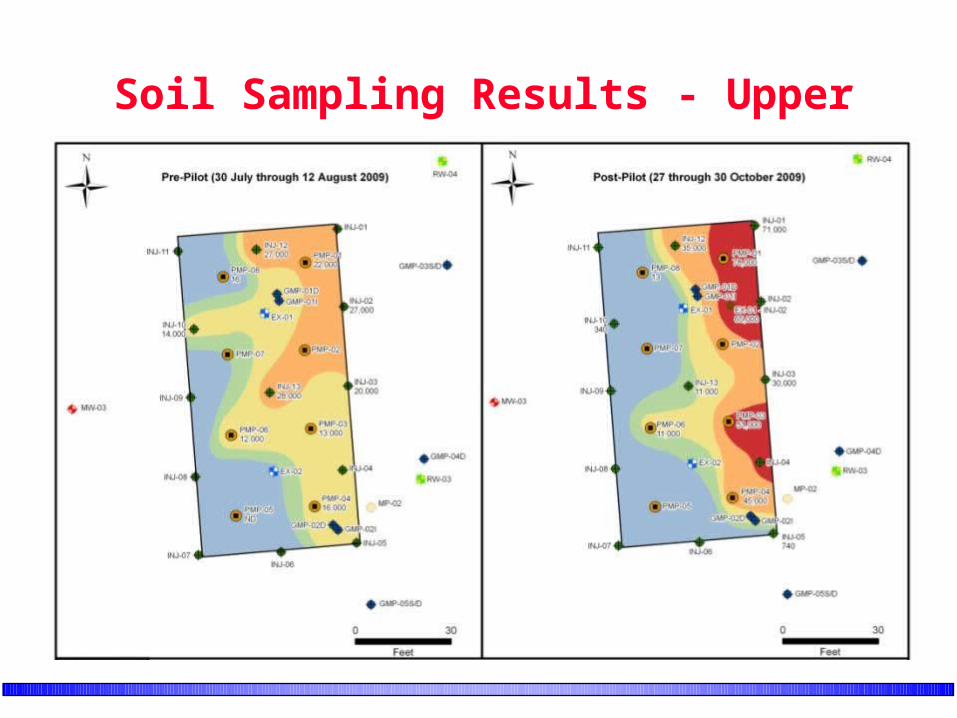
Soil Sampling Results - Upper
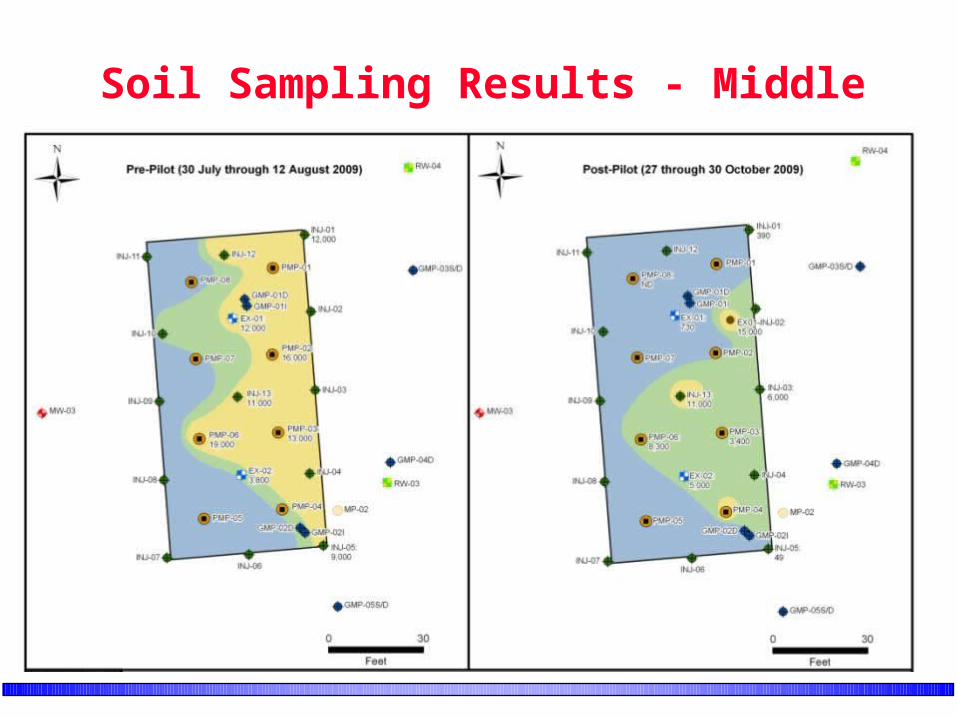
Soil Sampling Results - Middle
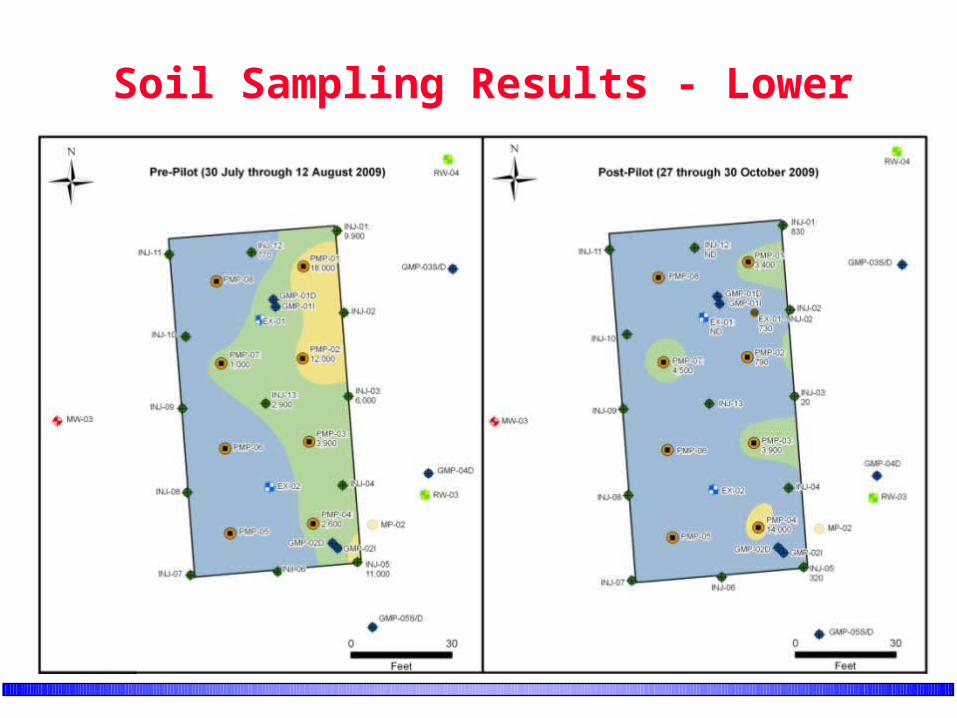
Soil Sampling Results - Lower
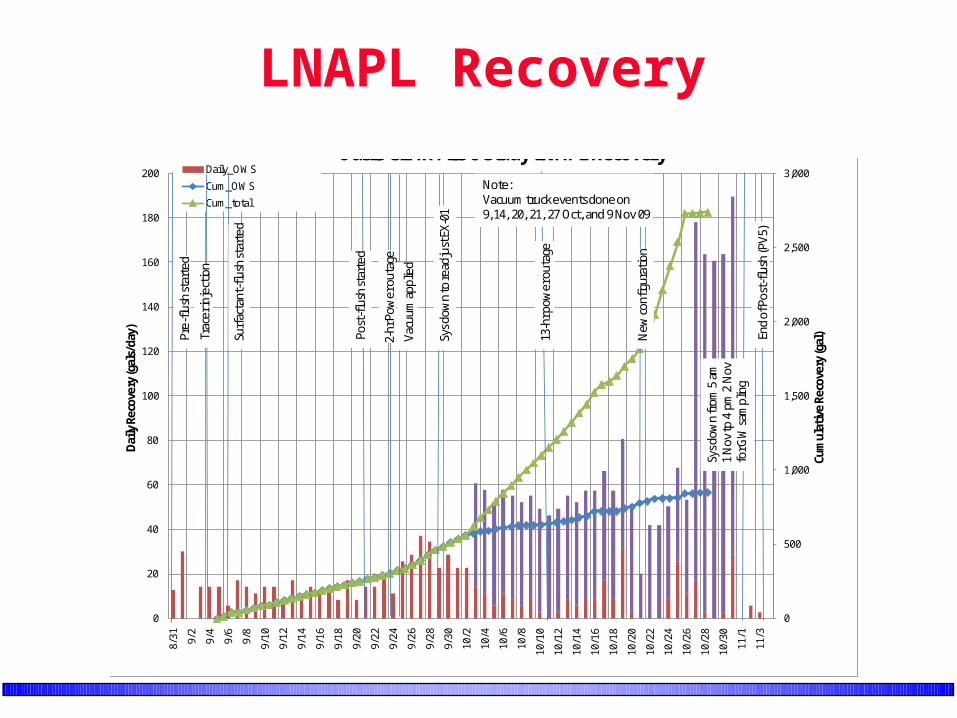
LNAPL Recovery
0
500
1,000
1,500
2,000
2,500
3,000
0
20
40
60
80
100
120
140
160
180
2008/
31 9/2
9/4
9/6
9/8
9/10
9/12
9/14
9/16
9/18
9/20
9/22
9/24
9/26
9/28
9/30
10/2
10/4
10/6
10/8
10/1
0
10/1
2
10/1
4
10/1
6
10/1
8
10/2
0
10/2
2
10/2
4
10/2
6
10/2
8
10/3
0
11/1
11/3
Cum
ulati
ve R
ecov
ery (
gal)
Daily
Rec
over
y (ga
ls/d
ay)
Oasis SEAR Pilot Study LNAPL RecoveryDaily_tanks (estimated)
Daily_OWS
Cum_OWS
Cum_totalTr
acer
inje
ction
Surf
acta
nt-fl
ush
star
ted
Pre-
flush
star
ted
Post
-flus
h st
arte
d
2-hr
Pow
er o
utag
e
Vacu
umap
plie
d
Sys d
own
to re
adju
st EX
-01
13-h
r pow
erou
tage
Note:Vacuum truck events done on9, 14, 20, 21, 27 Oct, and 9 Nov 09
New
confi
gura
tion
Sysd
own
from
5 am
1
Nov
tp 4
pm
2 N
ov
for G
W sa
mpl
ing
End
of P
ost-
flush
(PV5
)
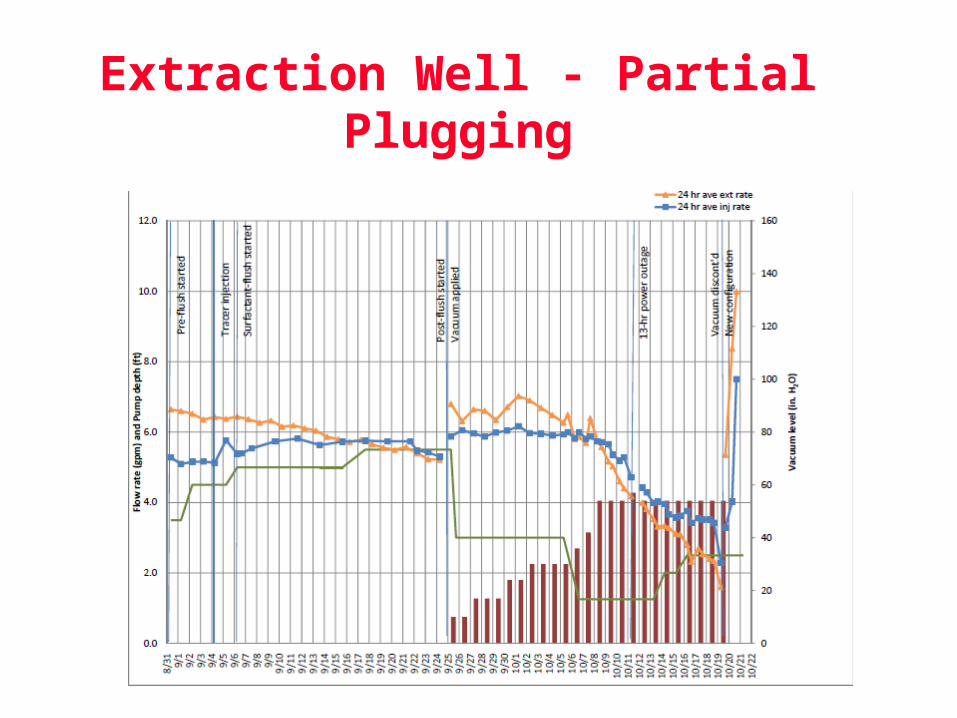
Extraction Well - Partial Plugging
Key Findings
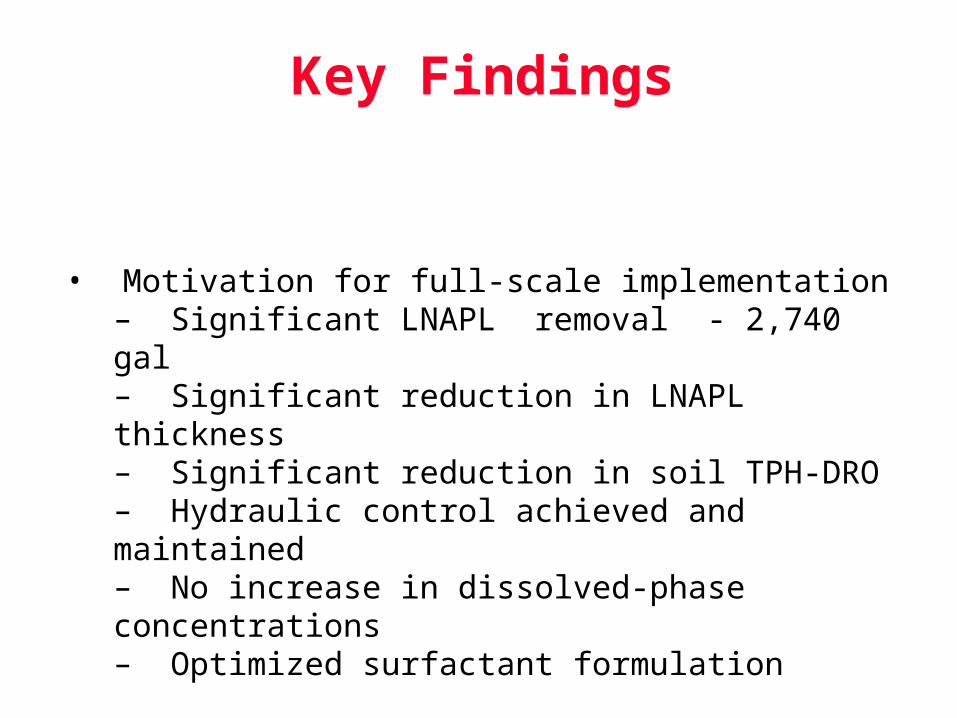
• Motivation for full-scale implementation– Significant LNAPL removal - 2,740 gal – Significant reduction in LNAPL thickness– Significant reduction in soil TPH-DRO – Hydraulic control achieved and maintained– No increase in dissolved-phase concentrations– Optimized surfactant formulation
Key Findings
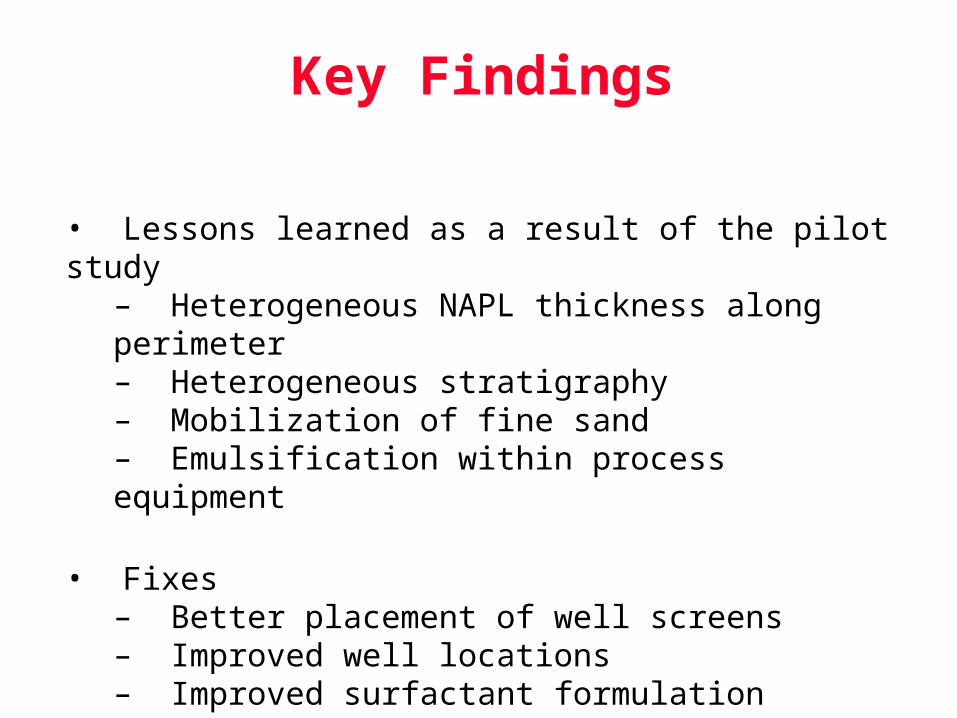
• Lessons learned as a result of the pilot study– Heterogeneous NAPL thickness along perimeter– Heterogeneous stratigraphy – Mobilization of fine sand– Emulsification within process equipment
• Fixes– Better placement of well screens– Improved well locations– Improved surfactant formulation– Longer residence times in oil/water separator
Full Scale Implementation
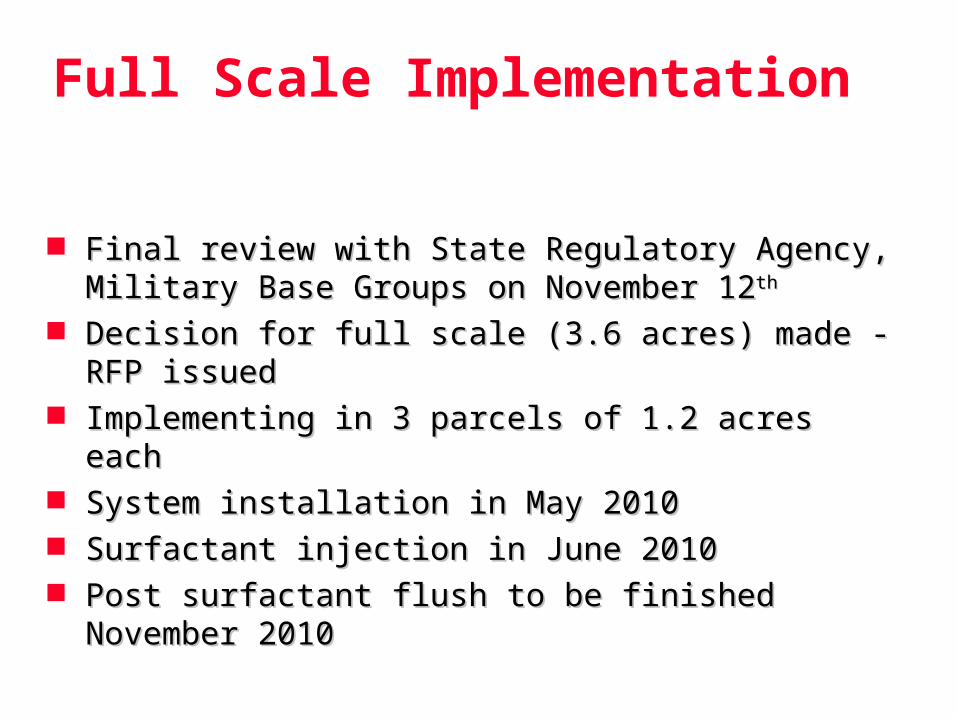
Final review with State Regulatory Agency, Military Base Final review with State Regulatory Agency, Military Base Groups on November 12Groups on November 12thth
Decision for full scale (3.6 acres) made - RFP issuedDecision for full scale (3.6 acres) made - RFP issued Implementing in 3 parcels of 1.2 acres eachImplementing in 3 parcels of 1.2 acres each System installation in May 2010System installation in May 2010 Surfactant injection in June 2010Surfactant injection in June 2010 Post surfactant flush to be finished November 2010Post surfactant flush to be finished November 2010