Embed Size (px)
Citation preview
Surfactant Based Enhanced Oil Recovery and Foam Mobility Control
3nd Semi-Annual Technical Report
Reporting Period Start Date: July 2005
Reporting Period End Date: December 2005
Principal Authors:
George J. Hirasaki, Rice University
Clarence A. Miller, Rice University
Gary A. Pope, The University of Texas
Date Report was Issued: February 2006
DE-FC26-03NT15406
Rice UniversityDepartment of Chemical Engineering, MS-362
6100 Main StreetHouston, TX 77005-1892
The University of TexasDepartment of Petroleum Engineering
P.O. Box 7726Austin, TX 78713-7726
INTERA, Inc.9111A Research Blvd.
Austin, TX 78758
Surfactant Based Enhanced Oil Recovery and Foam Mobility Control, G.J. Hirasaki, C.A. Miller and G.A. PopeDE-FC26-03NT15406, February 2006
2
DISCLAIMER
This report was prepared as an account of work sponsored by anagency of the United States Government. Neither the United States Governmentnor any agency thereof, nor any of their employees, make any warranty,expressed or implied, or assumes any legal liability or responsibility for theaccuracy, completeness, or usefulness of any information, apparatus, product, orprocess disclosed, or represents that its use would not infringe privately ownedrights. References herein to any specific commercial product, process, orservice by trade name, trademark, manufacturer, or otherwise does notnecessarily constitute or imply its endorsement, recommendation, or favoring bythe United States Government or any agency thereof. The views and opinions ofauthors expressed herein do not necessarily state or reflect those of the UnitedStates Government or and agency thereof.
Surfactant Based Enhanced Oil Recovery and Foam Mobility Control, G.J. Hirasaki, C.A. Miller and G.A. PopeDE-FC26-03NT15406, February 2006
3
ABSTRACT
Surfactant flooding has the potential to significantly increaserecovery over that of conventional waterflooding. The availability of a largenumber of surfactant structures makes it possible to conduct a systematic studyof the relation between surfactant structure and its efficacy for oil recovery. Amixture of two surfactants was found to be particularly effective for application incarbonate formations at low temperature. The mixture is single phase for highersalinity or calcium concentrations than that for either surfactant used alone. Thismakes it possible to inject the surfactant slug with polymer close to optimalconditions and yet be single phase. A formulation has been designed for aparticular field application. It uses partially hydrolyzed polyacrylamide for mobilitycontrol.
The addition of an alkali such as sodium carbonate makespossible in situ generation of naphthenic soap and significant reduction ofsynthetic surfactant adsorption. The design of the process to maximize theregion of ultra-low IFT takes advantage of the observation that the ratio of soapto synthetic surfactant is a parameter in the conditions for optimal salinity. Evenfor a fixed ratio of soap to surfactant, the range of salinity for low IFT was widerthat that observed for surfactant systems in the literature. Low temperature,forced displacement experiments in dolomite and silica sandpacks demonstratethat greater than 95% recovery of the waterflood remaining oil is possible with0.2% surfactant concentration, 0.5 PV surfactant slug, with no alcohol.Compositional simulation of the displacement process demonstrates the role ofsoap/surfactant ratio on passage of the profile through the ultralow IFT region,the importance of a wide low IFT dependence on salinity, and the importance ofthe viscosity of the surfactant slug.
Mobility control is essential for surfactant EOR. Foam is evaluatedto improve the sweep efficiency of surfactant injected into fractured reservoirs aswell as a drive fluid for ASP flooding.
UTCHEM is a reservoir simulator specially designed for surfactantEOR. It has been modified to represent the effects of a change in wettability.
Surfactant Based Enhanced Oil Recovery and Foam Mobility Control, G.J. Hirasaki, C.A. Miller and G.A. PopeDE-FC26-03NT15406, February 2006
4
TABLE OF CONTENTS
DISCLAIMER...................................................................................................................2
ABSTRACT......................................................................................................................3
TABLE OF CONTENTS...................................................................................................4
TABLE OF TABLES.........................................................................................................5
TABLE OF FIGURES.......................................................................................................5
INTRODUCTION .............................................................................................................8
EXECUTIVE SUMMARY .................................................................................................9
Task 1 Improved surfactants and formulations ..............................................................11
1.1. Identifying and Synthesizing Improved, Cost-effective Surfactants............11
1.2. Surfactant Tailoring for Crude Oils and Phase Behavior.............................12
1.2.1 Phase Behavior Results ..................................................................12
1.2.2 Polymer Results ..............................................................................13
1.3 Propoxylated-sulfated surfactants ................................................................16
1.4 Calcium tolerance of NI surfactant blend ......................................................19
Task 2 Phase behavior, adsorption, and composition changes duringdisplacement..................................................................................................................20
2.1 Surfactant Adsorption....................................................................................20
Low surfactant adsorption domain............................................................20
Surfactant adsorption with different soaps................................................23
Conclusions..............................................................................................26
Reference:................................................................................................26
2.2 IFT measurement and ultra-low IFT region ..................................................27
Correlation between phase behavior and IFT.........................................37
2.3 Characteristics of Alkali-Surfactant-Polymer process ....................................42
2.4 Alkaline-Surfactant Polymer Forced Displacement .......................................48
Dolomite sand pack..................................................................................48
Silica sand pack........................................................................................53
Polymer/Surfactant phase separation.......................................................55
Conclusions..............................................................................................58
Task 3 Foam for Mobility Control ...................................................................................59
3.1 Bulk foam in fractures ......................................................................................59
Experimental technique ..........................................................................59
Surfactant Based Enhanced Oil Recovery and Foam Mobility Control, G.J. Hirasaki, C.A. Miller and G.A. PopeDE-FC26-03NT15406, February 2006
5
Theory ....................................................................................................61
Results and discussion ...........................................................................62
3.2 Foam drive for ASP process............................................................................63
3.3 Foam stability with the presence of residual oil................................................66
Reference ...............................................................................................68
Task 4: Simulation of Field-Scale Processes ................................................................69
4.2: Wettability alterations in naturally fractured reservoirs................................69
Wettability alteration model in UTCHEM ..................................................69
References ...............................................................................................71
TABLE OF TABLES
Table 1.1-1Surfactants Tested in Year 3 .......................................................................11
Table 1.2-1 Formulations Screened with Cedar Hills Crude Oil, 104°C.........................13
Table 2.3-1 Other major parameters for the example ....................................................43
Table 2.4-1 Formulation for the alkaline surfactant polymer solution.............................50
TABLE OF FIGURES
Figure 1.2-1. Viscosity of Flopaam®3330S Polymer.....................................................14
Figure 1.2-2. Polymer Permeability Reduction Factor vs. Permeability for MidlandFarms Core, 38oC ..........................................................................................................15
Figure 1.3-1. Test results of salinity scans for 3- and 7- propoxylated-sulfatedsurfactants .....................................................................................................................17
Figure 1.3-2. Optimal salinity vs. Alkane Carbon Number (ACN)...................................18
Figure 1.1-1 Phase diagram of NI blend ........................................................................19
Figure 2.1-1 Adsorption of 4:1 N67:IOS on calcite in varying salinity and alkalinity.......21
Figure 2.1-2 Adsorption of 4:1 N67:IOS on calcite in varying alkalinity at 5% NaCl.......21
Figure 2.1-3 the contour of maximal adsorption for N57 IOS(4:1) .................................22
Figure 2.1-4 Adsorption of N67 on calcite powder .........................................................22
Figure 2.1-5 Adsorption of IOS on calcite powder..........................................................23
Figure 2.1-6 Adsorption of 4:1 N67:IOS on calcite with sodium oleate ..........................25
Figure 2.1-7 Adsorption of 4:1 N67:IOS on calcite with sodium naphthenates ..............25
Figure 2.2-1 Phase behavior of 0.2% NI blend / 1% Na2CO3 / 2% NaCl (23 dayssettling) ..........................................................................................................................27
Surfactant Based Enhanced Oil Recovery and Foam Mobility Control, G.J. Hirasaki, C.A. Miller and G.A. PopeDE-FC26-03NT15406, February 2006
6
Figure 2.2-2 Spinning drop measurement of 0.2 % NI blend/1% Na2CO3/2%NaCl, 4 hours’ settling. There are three layers...............................................................27
Figure 2.2-3 IFT of 0.2% NI blend / 1% Na2CO3 / 2% NaCl with different settlingtime................................................................................................................................28
Figure 2.2-4 Photos of spinning drop of IFT of 0.2% NI blend / 1% Na2CO3 / 2%NaCl ..............................................................................................................................29
Figure 2.2-5 Photo of two different spinning drops of 0.2% NI blend / 1% Na2CO3/ 2% NaCl ......................................................................................................................29
Figure 2.2-6 IFT of 0.2% NI blend / 1% Na2CO3 / 2% NaCl with different settlingtime................................................................................................................................30
Figure 2.2-7 Comparison of phase appearance of 0.2% NI / 1% Na2CO3 / x %NaCl at different time .....................................................................................................31
Figure 2.2-8 Photos of spinning drop of 0.2% NI blend / 1% Na2CO3 / 3.4% NaClwith all the oil-rich emulsion...........................................................................................31
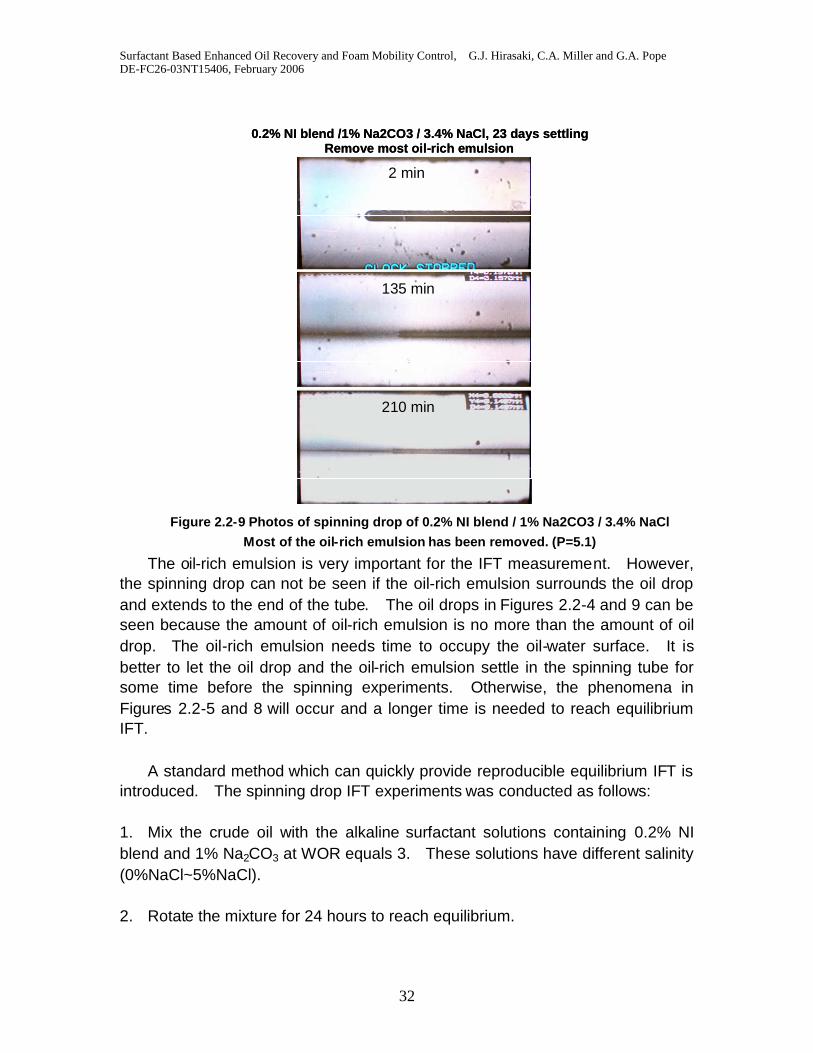
Figure 2.2-9 Photos of spinning drop of 0.2% NI blend / 1% Na2CO3 / 3.4%NaCl; Remove most of the oil-rich emulsion (P=5.1) ....................................................32
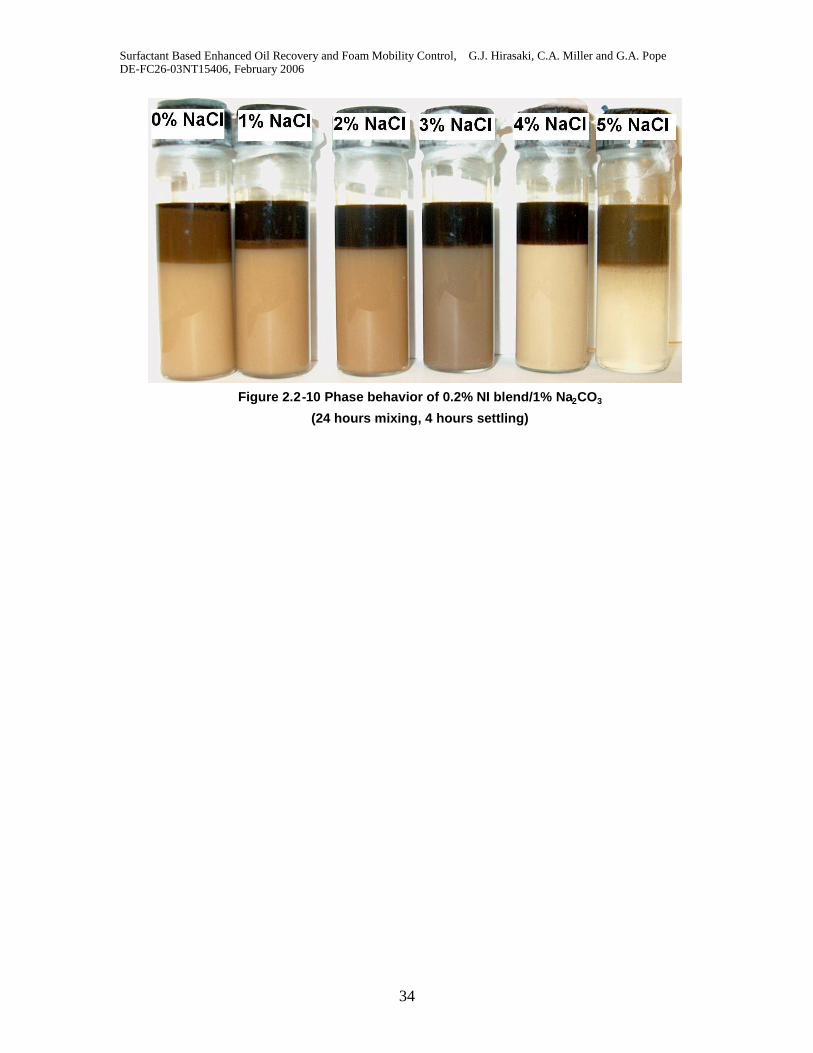
Figure 2.2-10 Phase behavior of 0.2% NI blend/1% Na2CO3; (24 hours mixing, 4hours settling) ................................................................................................................34
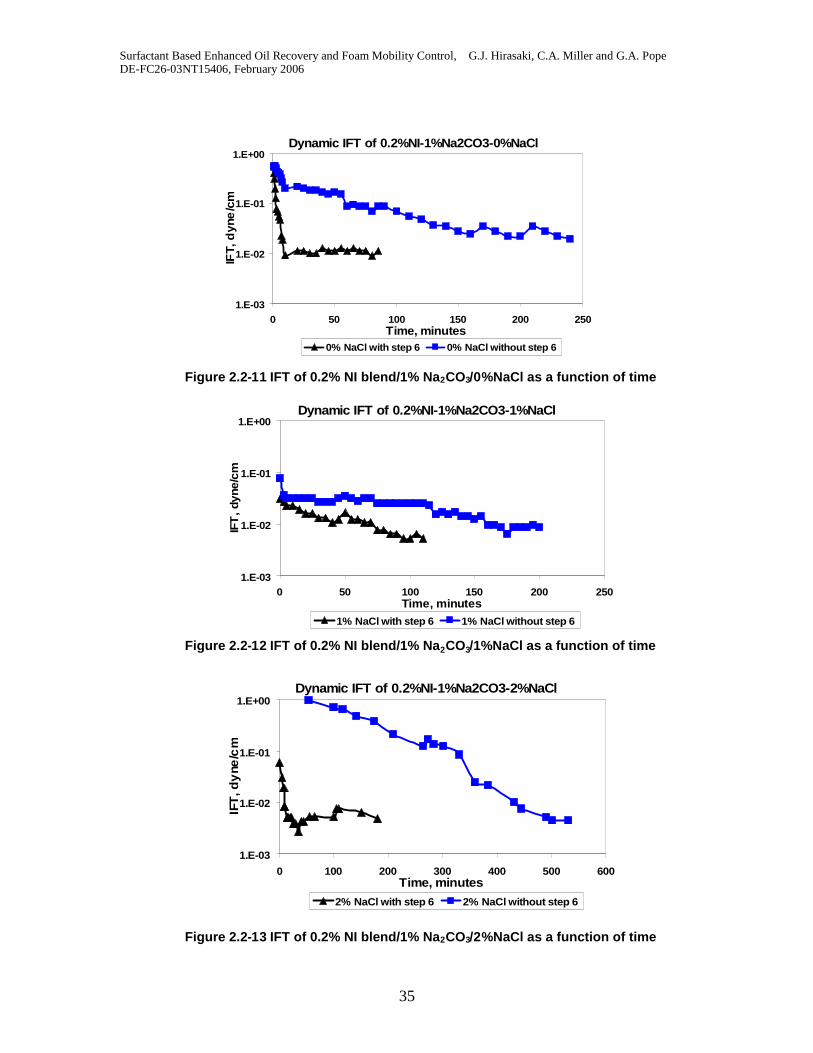
Figure 2.2-11 IFT of 0.2% NI blend/1% Na2CO3/0%NaCl as a function of time.............35
Figure 2.2-12 IFT of 0.2% NI blend/1% Na2CO3/1%NaCl as a function of time.............35
Figure 2.2-13 IFT of 0.2% NI blend/1% Na2CO3/2%NaCl as a function of time.............35
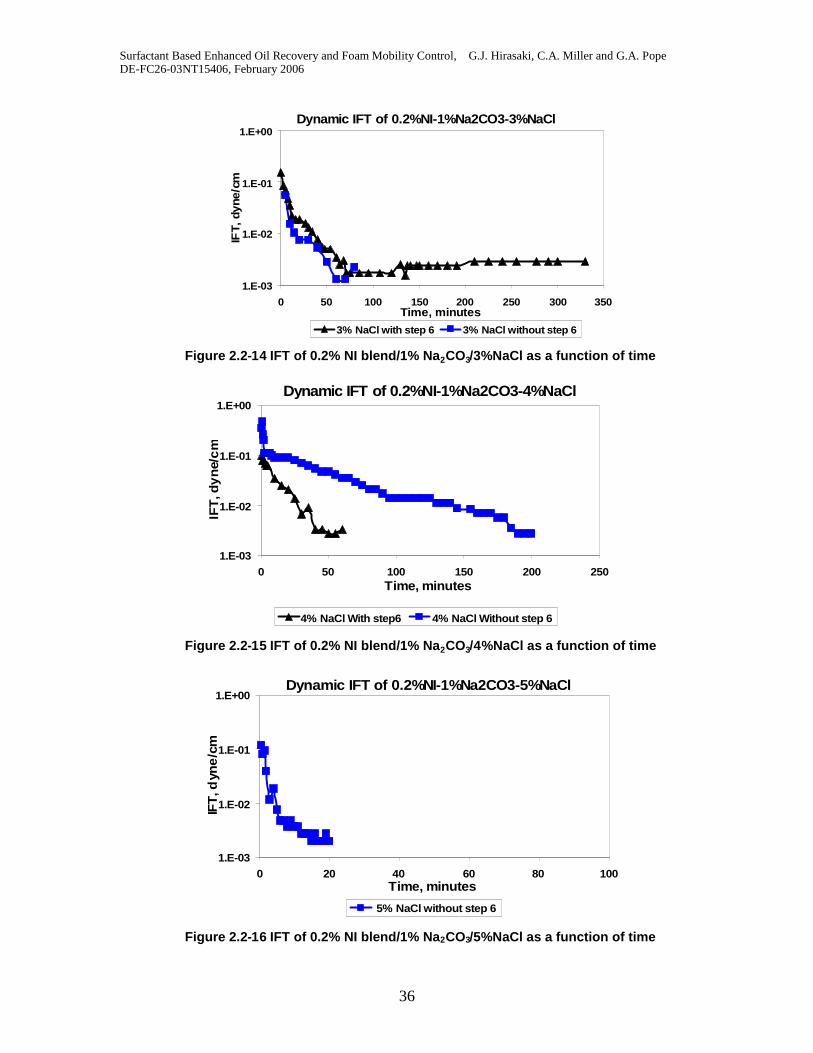
Figure 2.2-14 IFT of 0.2% NI blend/1% Na2CO3/3%NaCl as a function of time.............36
Figure 2.2-15 IFT of 0.2% NI blend/1% Na2CO3/4%NaCl as a function of time.............36
Figure 2.2-16 IFT of 0.2% NI blend/1% Na2CO3/5%NaCl as a function of time.............36
Figure 2.2-17 IFT change with salinity for 0.2NI-1%Na2CO3/WOR=3............................37
Figure 2.2-18 Phase behavior after 2 months with 0.2% and 0.5% NI blend. 38
Figure 2.2-19 Solubility ratios of 0.2% NI blend/1% Na2CO3/NaCl 38
Figure 2.2.20 Comparison of IFT measured by spinning drop measurementsusing standard procedure and that estimated by Chun-Huh correlation of 0.2% NIblend/1% Na2CO3/NaCl. c=0.3..................................................................... .................39
Figure 2.2-21 Solubility ratios of 0.5% NI blend/1% Na2CO3/NaCl ...............................40
Figure 2.2-22 IFT estimated by Chun-Huh correlation of 0.5% NI blend/1%Na2CO3/NaCl, c=0.3. .....................................................................................................40
Fig. 2.2-23 Phase behavior of 0.2% NI blend/1% Na2CO3/x% NaCl, 40 days ofsettling. Thin creamed oil-rich layers exist at salinity of 2-3.4% NaCl. ...........................41
Figure 2.3-1 Contour of interfacial tension with wide low IFT region..............................42
Surfactant Based Enhanced Oil Recovery and Foam Mobility Control, G.J. Hirasaki, C.A. Miller and G.A. PopeDE-FC26-03NT15406, February 2006
7
Figure 2.3-2 Contour of interfacial tension with narrow low IFT region..........................43
Figure 2.3-3 Comparison of profiles between wide and narrow low IFT regions............44
Figure 2.3-4 Oil recoveries vs. injecting brine salinities .................................................45
Figure 2.3-5 Comparison of profiles between varied injecting solution viscosities.........46
Figure 2.3-6 Oil Fractional Flow vs. Saturation at IFT=0.001dyne/cm ..........................47
Figure 2.4-1 Photos of oil flooding and water flooding...................................................49
Figure 2.4-2 Oil Recovery of Water Flooding in Dolomite Sand Pack............................49
Figure 2.4-3 Photos of dolomite pack at different injecting pore volumes......................51
Figure 2.4-4 Oil Recovery of ASP Flooding in Dolomite Sand Pack ............................51
Figure 2.4-5 Effluent of ASP Flooding in Dolomite Sand Pack .....................................52
Figure 2.4-6 History of pressure drop for dolomite pack ................................................52
Figure 2.4-7 Comparison between simulation and experiments for dolomite pack........52
Figure 2.4-8 Photos of silica sand pack at different injecting pore volumes...................53
Figure 2.4-9 Oil Recovery of ASP flooding in silica sand pack ......................................54
Figure 2.4-10 History of pressure drop for silica pack....................................................54
Figure 2.4-11 Comparison between simulation and experiments for silica pack............55
Figure 2.4-12 Photos of silica sand pack at different injecting pore volumes wheninjecting salinity = 4.0% NaCl.........................................................................................56
Figure 2.4-13 Pressure difference vs. pore volume when polymer/surfactantseparation, 4% NaCl......................................................................................................56
Figure 2.4-14 Phase behaviors of different ASP solutions after one week ....................57
Figure 3.1-1 Detailed fracture model .............................................................................60
Figure 3.1-2 Diagram for experiment in fracture model..................................................61
Figure 3.1-3 Bulk foam apparent viscosity in fractures; measurement andprediction. K=1.01 for Mooney and Krieger and Dougherty equations...........................63
Figure 3.2-1 Foam sweep of the sand pack presaturated with polymer/surfactant ........64
Figure 3.2-2 Apparent viscosity during the sweeping the sand pack presaturatedwith polymer/surfactant ..................................................................................................65
Figure 3.3-1 Short sand pack.........................................................................................66
Figure 3.3-2 Comparison of foam strength with or without residual oil by differentsurfactants .....................................................................................................................67
Surfactant Based Enhanced Oil Recovery and Foam Mobility Control, G.J. Hirasaki, C.A. Miller and G.A. PopeDE-FC26-03NT15406, February 2006
8
INTRODUCTION
Oil recovery by primary depletion and waterflooding, on the average,recovers only about one third of the original in place. The remaining oil can becategorized into: (1) the residual oil in the regions swept by water and (2) themovable oil in the regions unswept or poorly swept by water. This project usessurfactants to reduce the residual oil saturation by both interfacial tensionreduction and wettability alteration, the latter in cases where wettability isresponsible for retaining oil in the matrix. A factor in the sweep efficiency of areservoir is the mobility ratio between the resident fluids and the injected fluids.Polymer solution is the traditional method for mobility control in surfactantflooding. This project will evaluate foam as an alternate or supplement topolymer for mobility control. Our objective is to economically increase therecovery efficiency beyond that achieved by waterflooding.
Both unfractured and fractured formations will be addressed in this project.The driving force for displacement of oil in unfractured systems is primarily thepressure gradient developed by displacing fluids from the injection well to theproduction well. This pressure gradient may be only a small contributor infractured formations. In this case, spontaneous imbibition is needed to exchangethe injected fluid and oil between the fracture and matrix. The driving force forspontaneous imbibition includes capillary pressure gradients and buoyancy, orgravity drainage. The contribution due to capillary pressure gradients may bediminished because of low interfacial tension.
Both sandstone and carbonate formations will be considered. Carbonateformation usually tend to be more oil-wet and fractured compared to sandstoneformations. In either case, surfactant adsorption on the mineral surfaces must beminimized. Sodium carbonate is used with anionic surfactants in carbonateformations to reduce adsorption. The alkalinity of the sodium carbonate alsogenerates surfactants in situ by reacting with the naphthenic acids in the crudeoil.
Scale-up from the laboratory to the field is a necessary part of developingan enhanced oil recovery process. The tool for this scale-up is the reservoirsimulator, UTCHEM.
Surfactant Based Enhanced Oil Recovery and Foam Mobility Control, G.J. Hirasaki, C.A. Miller and G.A. PopeDE-FC26-03NT15406, February 2006
9
EXECUTIVE SUMMARY
Twenty four surfactants are compared for their efficacy for oil recovery bysurfactant flooding. Surfactant structure – performance relationships are neededfor applications with a specified crude oil composition, brine salinity, reservoirtemperature, formation mineralogy, and recovery mechanism. The surfactantsare characterized by the optimal salinity for different pure hydrocarbon oils, thesolubilization ratio, which is an estimator of the level of interfacial tension atoptimal conditions, and whether it forms viscous gel or liquid crystalline phasesthat cause slow emulsion coalescence. A combination of two surfactants, N67-7PO-S and IOS 15-18, was found to be particularly effective. N67-7PO-S has amoderately branched hydrophobe with 16-17 carbons, an average of 7 PO(propylene oxide) groups, and is sulfated. IOS 15-18 is an internal olefinsulfonate with 15-18 carbons. The location of the sulfonate in the IOS isdistributed along the carbon chain and thus the result is a twin-tailed or branchedhydrophobe. The branching reduces the tendency to form gels and viscousemulsions at low temperatures. EO and PO groups impart tolerance to divalentions. PO is more lipophlic than the hydrophilic EO group and results in a loweroptimal salinity requirement. The sulfate has an ester linkage and is subject tohydrolysis at high temperatures and low pH. Thermally stable sulfonates areevaluated for high temperature applications.
A surfactant-polymer formulation is being developed for a West Texascarbonate reservoir that has a pressure too low for CO2 flooding. The formationhas anhydrite, which will result in precipitation of sodium carbonate. Theformulation has recovered up to 95% of the oil remaining after waterflooding inreservoir formation core material. The project team has met with the operatorand partners to plan for a field test.
An alkaline surfactant process is also being developed for enhancedrecovery in oil-wet, carbonate formations. The carbonate ion of sodiumcarbonate is a potential determining ion in carbonate formations such as calciteand dolomite. Alteration of the mineral surface to a negative charge aids in thewettability alteration and makes a dramatic reduction in the adsorption of anionicsurfactants. Calcium ion concentration is sequestered because of the lowsolubility product of calcium carbonate. Also the alkali raises the pH, whichresults in saponification of naphthenic acids to naphthenic soap, a naturalsurfactant. The naphthenic soap is usually too lipophilic by itself and addition ofa synthetic surfactant is needed. Ultra-low interfacial tensions are possible atsynthetic surfactant concentrations as low as 0.05%. However, the system iscomplex because it is a mixture of naphthenic soap and synthetic surfactantswith very different properties. This results in optimal salinity that depends on thewater/oil ratio and surfactant concentration. However, these dependencies canbe correlated by the ratio of soap/synthetic surfactant. It was discovered thateven for a fixed soap/surfactant ratio the range of salinities over which low IFT (<10-2 mN/m) occurs is much wider than that expected for conventionalakylarylsulfonate surfactants. Also, the changing ratio of soap/surfactant during
Surfactant Based Enhanced Oil Recovery and Foam Mobility Control, G.J. Hirasaki, C.A. Miller and G.A. PopeDE-FC26-03NT15406, February 2006
10
oil displacement can be utilized to have the composition pass through the low IFTregion at the displacement front. This results in a robust recovery process that isnot overly sensitive to salinity and surfactant concentration. ASP formulationswith 0.5 PV surfactant slug and low surfactant concentrations have recoveredover 95% of the waterflood remaining oil from dolomite (0.2% surfactant) andsilica (0.5% surfactant) sandpacks. This was possible at room temperaturewithout need for alcohol.
Surfactant retention by adsorption and phase trapping determines theamount of surfactant required for a surfactant enhanced oil recovery process.We show that the adsorption of anionic surfactants on calcite and dolomite canbe reduced by an order of magnitude by addition of sodium carbonate.
Mobility control is recognized as an essential element of surfactant EOR.Surfactant injection into fractured formations imposes a severe challenge forreservoir conformance or sweep efficiency. It was shown earlier that foamimproves sweep in fracture systems. The apparent viscosity of bulk foam infractures is evaluated in this report. The possibility of substituting the polymerdrive with a foam drive is examined.
The reservoir simulator, UTCHEM will be used as the tool to scale-up fromlaboratory experiments to field design. An approach to model the change inwettability is presented.
Surfactant Based Enhanced Oil Recovery and Foam Mobility Control, G.J. Hirasaki, C.A. Miller and G.A. PopeDE-FC26-03NT15406, February 2006
11
Task 1. Improved Surfactants and Formulations
Subtask 1.1. Identifying and Synthesizing Improved, Cost-effectiveSurfactants
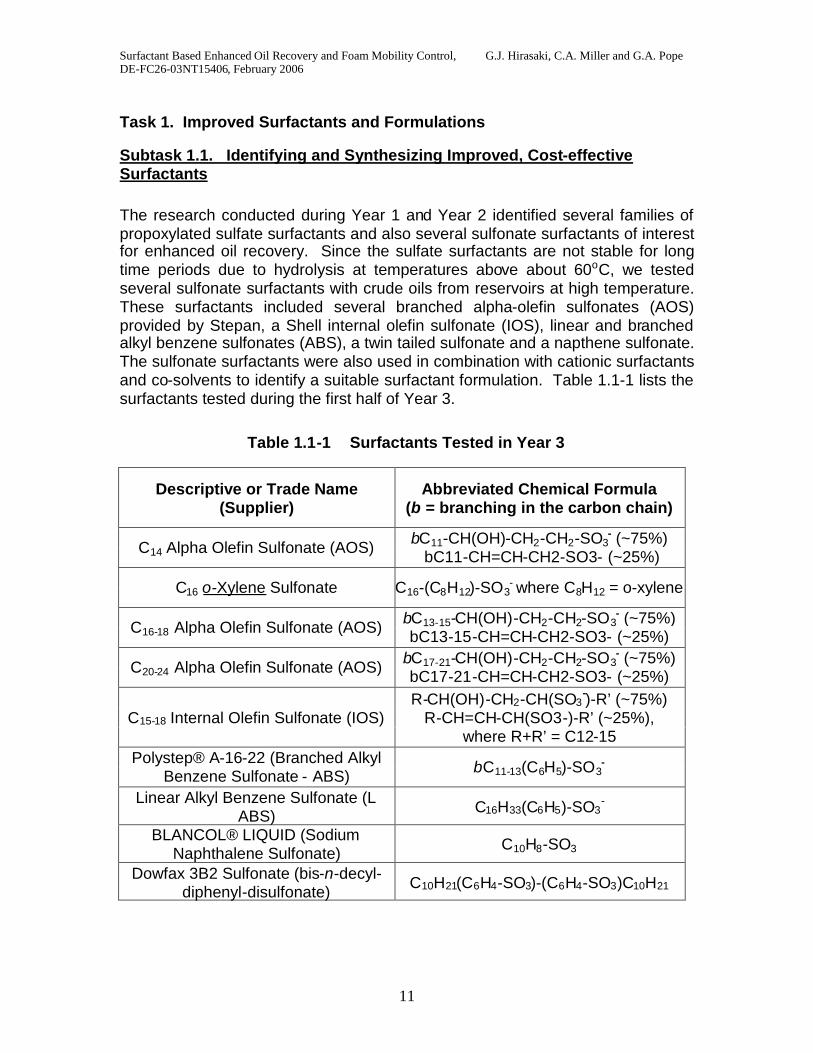
The research conducted during Year 1 and Year 2 identified several families ofpropoxylated sulfate surfactants and also several sulfonate surfactants of interestfor enhanced oil recovery. Since the sulfate surfactants are not stable for longtime periods due to hydrolysis at temperatures above about 60oC, we testedseveral sulfonate surfactants with crude oils from reservoirs at high temperature.These surfactants included several branched alpha-olefin sulfonates (AOS)provided by Stepan, a Shell internal olefin sulfonate (IOS), linear and branchedalkyl benzene sulfonates (ABS), a twin tailed sulfonate and a napthene sulfonate.The sulfonate surfactants were also used in combination with cationic surfactantsand co-solvents to identify a suitable surfactant formulation. Table 1.1-1 lists thesurfactants tested during the first half of Year 3.
Table 1.1-1 Surfactants Tested in Year 3
Descriptive or Trade Name(Supplier)
Abbreviated Chemical Formula(b = branching in the carbon chain)
C14 Alpha Olefin Sulfonate (AOS) bC11-CH(OH)-CH2-CH2-SO3- (~75%)
bC11-CH=CH-CH2-SO3- (~25%)
C16 o-Xylene Sulfonate C16-(C8H12)-SO3- where C8H12 = o-xylene
C16-18 Alpha Olefin Sulfonate (AOS) bC13-15-CH(OH)-CH2-CH2-SO3- (~75%)
bC13-15-CH=CH-CH2-SO3- (~25%)
C20-24 Alpha Olefin Sulfonate (AOS) bC17-21-CH(OH)-CH2-CH2-SO3- (~75%)
bC17-21-CH=CH-CH2-SO3- (~25%)
C15-18 Internal Olefin Sulfonate (IOS)R-CH(OH)-CH2-CH(SO3
-)-R’ (~75%)R-CH=CH-CH(SO3-)-R’ (~25%),
where R+R’ = C12-15Polystep® A-16-22 (Branched Alkyl
Benzene Sulfonate - ABS) bC11-13(C6H5)-SO3-
Linear Alkyl Benzene Sulfonate (LABS) C16H33(C6H5)-SO3
-
BLANCOL® LIQUID (SodiumNaphthalene Sulfonate) C10H8-SO3
Dowfax 3B2 Sulfonate (bis-n-decyl-diphenyl-disulfonate) C10H21(C6H4-SO3)-(C6H4-SO3)C10H21
Surfactant Based Enhanced Oil Recovery and Foam Mobility Control, G.J. Hirasaki, C.A. Miller and G.A. PopeDE-FC26-03NT15406, February 2006
12
Subtask 1.2. Surfactant Tailoring for Crude Oils and Phase Behavior
Surfactant tailoring for crude oils in Year 3 was conducted in the samesystematic way as reported in the Year 2 Annual Report. Phase behaviorexperiments were used to narrow possible surfactant candidates in an efficientand effective manner. These surfactants were selected based upon the designcriteria reported in Year 1 and 2. Polymers and mixtures of surfactants andpolymers were also tested to select suitable polymers for further testing. Theseprocesses were integrated into ongoing core flood experiments to evaluate thebest surfactants for oil recovery for the particular crude oils provided by oilcompanies.
1.2.1 Phase Behavior Results
The selection of a high-temperature surfactant formulation introduces newchallenges to the phase behavior experiments. The crude oil selected for theseexperiments was from the Burlington Resources Cedar Hills (CH) field inMontana and Wyoming. The reservoir temperature for Cedar Hills is 104oC. Dueto the high temperature a limited number of new surfactants were available forscreening with this crude oil.
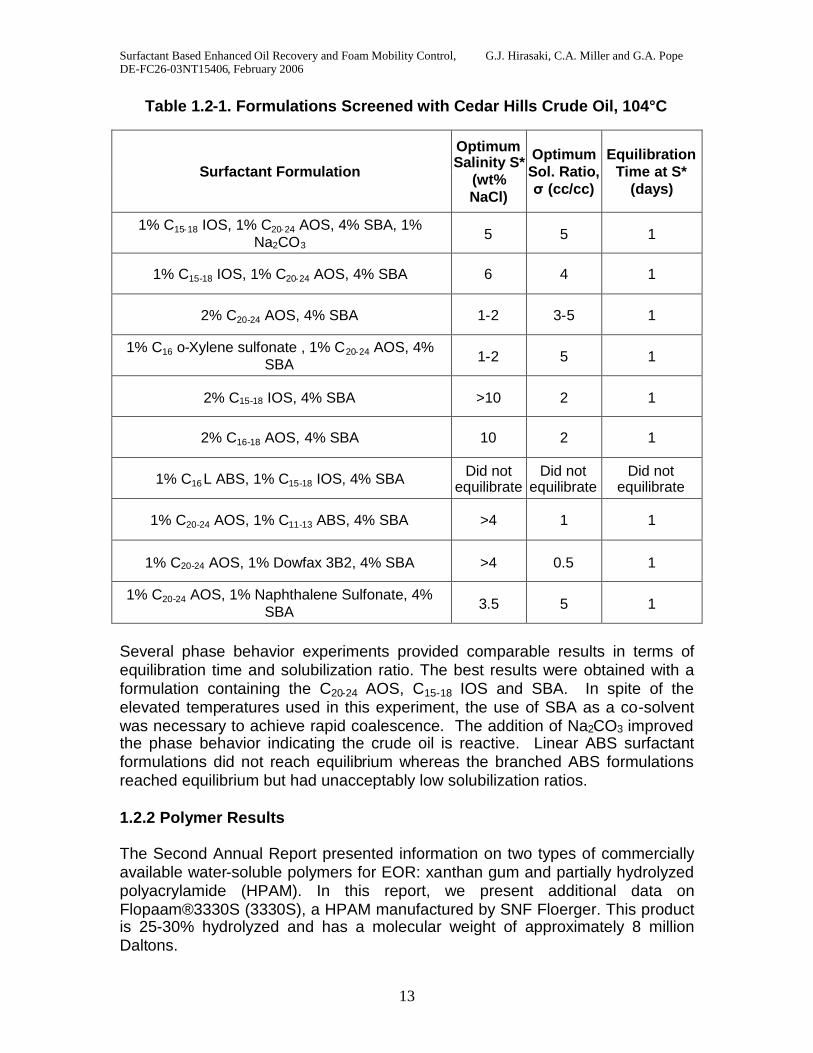
Surfactant formulations were screened for several characteristics during thephase behavior tests. Different mixtures are first tested for solubility and aqueousstability. The surfactants are then mixed with brine and crude oil to observe theirphase behavior at reservoir temperature. In particular, the time required for thesamples to reach equilibrium is important. Also, the samples are observed to seehow viscous the phases are and whether macroemulsions form and how long ittakes for such macroemulsions to break. The solubilization ratios for theequilibrium microemulsions are measured for those formulations that reachequilibrium in a reasonable length of time. The viscosity of the equilibriummicroemulsion is measured for some of the most promising formulations. Ifneeded, more samples are made with higher alcohol co-solvent added to speedup the equilibration and reduce microemulsion viscosity. The results of some ofthe Cedar Hills phase behavior experiments are presented in Table 1.2-1.
Surfactant Based Enhanced Oil Recovery and Foam Mobility Control, G.J. Hirasaki, C.A. Miller and G.A. PopeDE-FC26-03NT15406, February 2006
13
Table 1.2-1. Formulations Screened with Cedar Hills Crude Oil, 104°C
Surfactant Formulation
OptimumSalinity S*
(wt%NaCl)
OptimumSol. Ratio,σ(cc/cc)
EquilibrationTime at S*
(days)
1% C15-18 IOS, 1% C20-24 AOS, 4% SBA, 1%Na2CO3
5 5 1
1% C15-18 IOS, 1% C20-24 AOS, 4% SBA 6 4 1
2% C20-24 AOS, 4% SBA 1-2 3-5 1
1% C16 o-Xylene sulfonate , 1% C20-24 AOS, 4%SBA 1-2 5 1
2% C15-18 IOS, 4% SBA >10 2 1
2% C16-18 AOS, 4% SBA 10 2 1
1% C16 L ABS, 1% C15-18 IOS, 4% SBA Did notequilibrate
Did notequilibrate
Did notequilibrate
1% C20-24 AOS, 1% C11-13 ABS, 4% SBA >4 1 1
1% C20-24 AOS, 1% Dowfax 3B2, 4% SBA >4 0.5 1
1% C20-24 AOS, 1% Naphthalene Sulfonate, 4%SBA 3.5 5 1
Several phase behavior experiments provided comparable results in terms ofequilibration time and solubilization ratio. The best results were obtained with aformulation containing the C20-24 AOS, C15-18 IOS and SBA. In spite of theelevated temperatures used in this experiment, the use of SBA as a co-solventwas necessary to achieve rapid coalescence. The addition of Na2CO3 improvedthe phase behavior indicating the crude oil is reactive. Linear ABS surfactantformulations did not reach equilibrium whereas the branched ABS formulationsreached equilibrium but had unacceptably low solubilization ratios.
1.2.2 Polymer Results
The Second Annual Report presented information on two types of commerciallyavailable water-soluble polymers for EOR: xanthan gum and partially hydrolyzedpolyacrylamide (HPAM). In this report, we present additional data onFlopaam®3330S (3330S), a HPAM manufactured by SNF Floerger. This productis 25-30% hydrolyzed and has a molecular weight of approximately 8 millionDaltons.
Surfactant Based Enhanced Oil Recovery and Foam Mobility Control, G.J. Hirasaki, C.A. Miller and G.A. PopeDE-FC26-03NT15406, February 2006
14
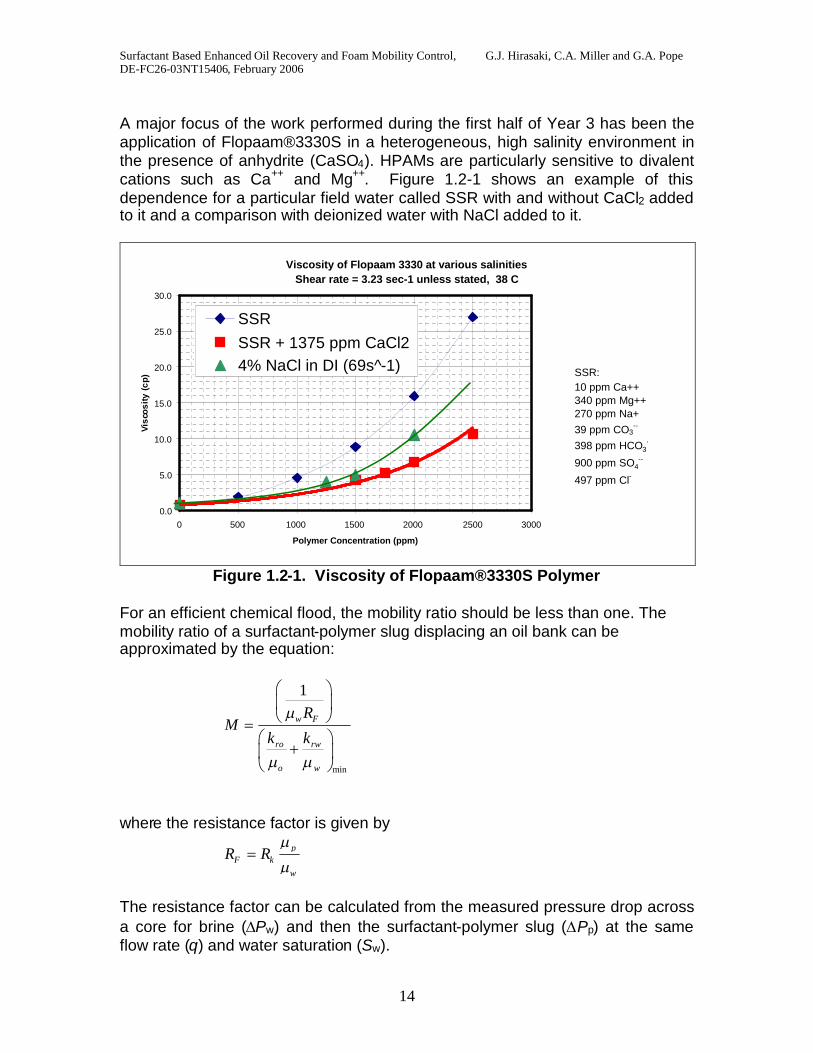
A major focus of the work performed during the first half of Year 3 has been theapplication of Flopaam®3330S in a heterogeneous, high salinity environment inthe presence of anhydrite (CaSO4). HPAMs are particularly sensitive to divalentcations such as Ca++ and Mg++. Figure 1.2-1 shows an example of thisdependence for a particular field water called SSR with and without CaCl2 addedto it and a comparison with deionized water with NaCl added to it.
Viscosity of Flopaam 3330 at various salinitiesShear rate = 3.23 sec-1 unless stated, 38 C
0.0
5.0
10.0
15.0
20.0
25.0
30.0
0 500 1000 1500 2000 2500 3000
Polymer Concentration (ppm)
Visc
osity
(cp)
SSRSSR + 1375 ppm CaCl24% NaCl in DI (69s^-1) SSR:
10 ppm Ca++340 ppm Mg++270 ppm Na+39 ppm CO3
--
398 ppm HCO3-
900 ppm SO4--
497 ppm Cl-
Figure 1.2-1. Viscosity of Flopaam®3330S Polymer
For an efficient chemical flood, the mobility ratio should be less than one. Themobility ratio of a surfactant-polymer slug displacing an oil bank can beapproximated by the equation:
min
1
w F
ro rw
o w
RM
k k
where the resistance factor is given by
pF k
w
R R
The resistance factor can be calculated from the measured pressure drop acrossa core for brine (Pw) and then the surfactant-polymer slug (Pp) at the sameflow rate (q) and water saturation (Sw).
Surfactant Based Enhanced Oil Recovery and Foam Mobility Control, G.J. Hirasaki, C.A. Miller and G.A. PopeDE-FC26-03NT15406, February 2006
15
Rf = (Pp/Pw)q, Sw
The permeability reduction factor (Rk) can then be calculated using the viscositydata as follows:
Rk = Rf / (p/w)
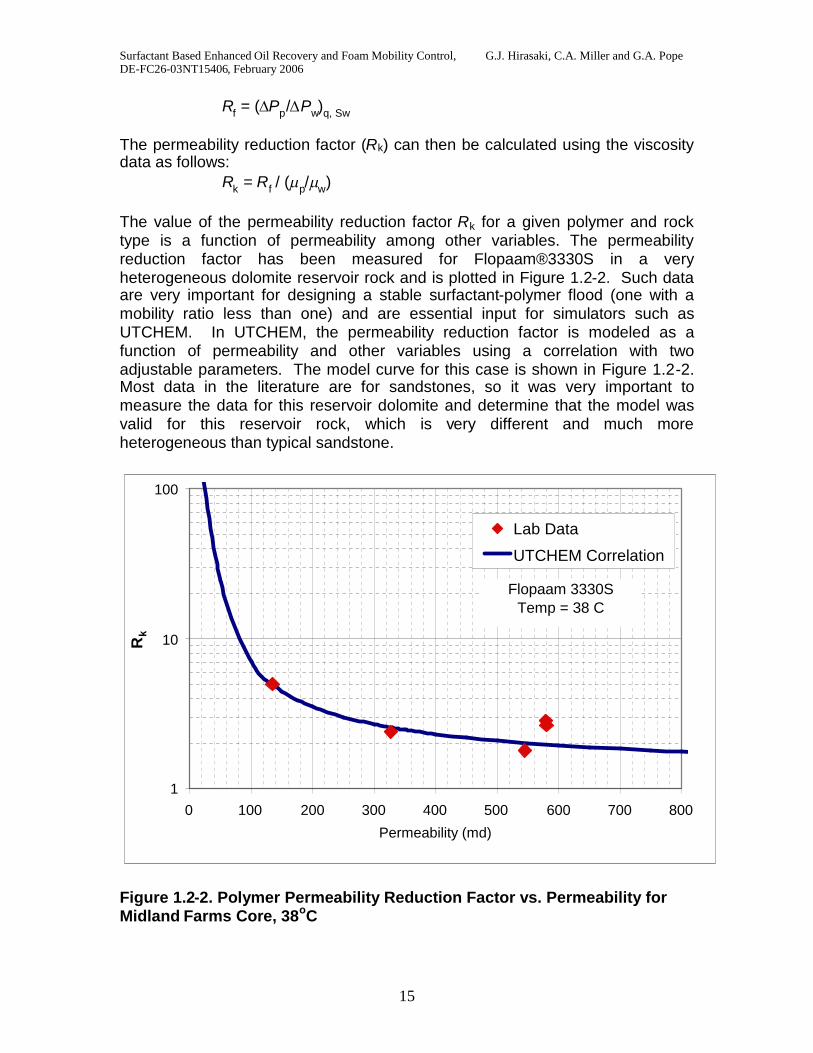
The value of the permeability reduction factor Rk for a given polymer and rocktype is a function of permeability among other variables. The permeabilityreduction factor has been measured for Flopaam®3330S in a veryheterogeneous dolomite reservoir rock and is plotted in Figure 1.2-2. Such dataare very important for designing a stable surfactant-polymer flood (one with amobility ratio less than one) and are essential input for simulators such asUTCHEM. In UTCHEM, the permeability reduction factor is modeled as afunction of permeability and other variables using a correlation with twoadjustable parameters. The model curve for this case is shown in Figure 1.2-2.Most data in the literature are for sandstones, so it was very important tomeasure the data for this reservoir dolomite and determine that the model wasvalid for this reservoir rock, which is very different and much moreheterogeneous than typical sandstone.
1
10
100
0 100 200 300 400 500 600 700 800
Permeability (md)
Rk
Lab Data
UTCHEM Correlation
Flopaam 3330STemp = 38 C
Figure 1.2-2. Polymer Permeability Reduction Factor vs. Permeability forMidland Farms Core, 38oC
Surfactant Based Enhanced Oil Recovery and Foam Mobility Control, G.J. Hirasaki, C.A. Miller and G.A. PopeDE-FC26-03NT15406, February 2006
16
Subtask 1.3 Propoxylated-sulfated surfactants
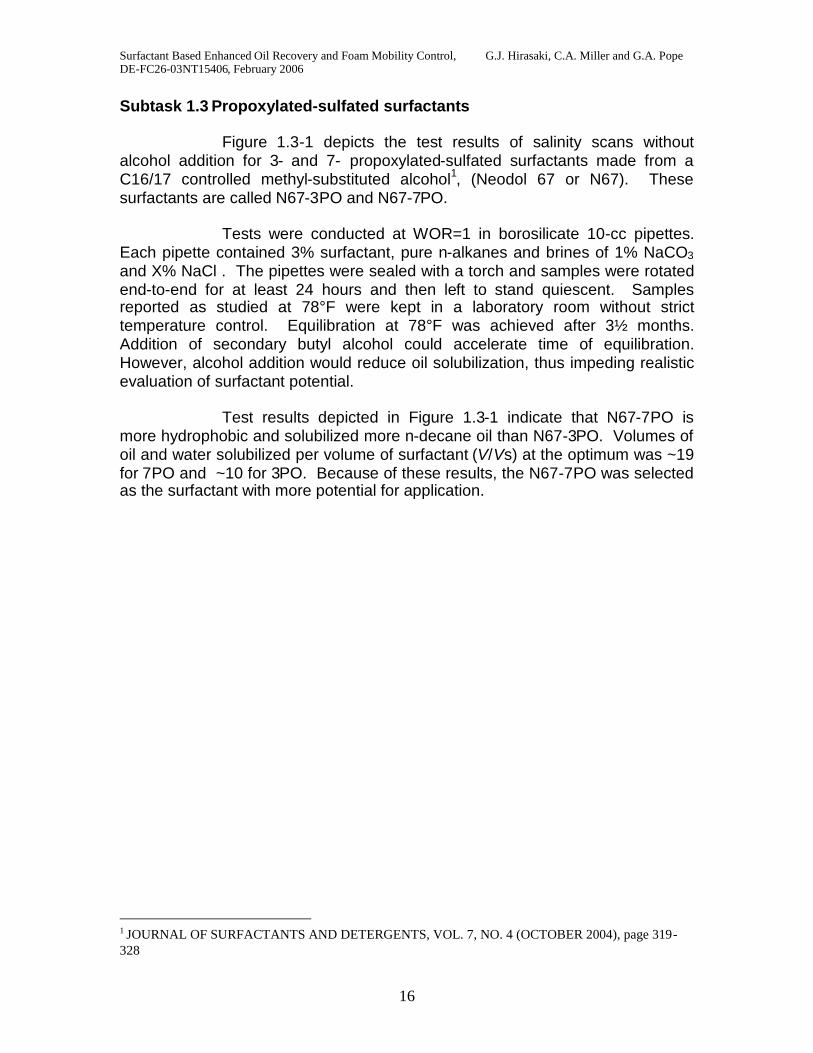
Figure 1.3-1 depicts the test results of salinity scans withoutalcohol addition for 3- and 7- propoxylated-sulfated surfactants made from aC16/17 controlled methyl-substituted alcohol1, (Neodol 67 or N67). Thesesurfactants are called N67-3PO and N67-7PO.
Tests were conducted at WOR=1 in borosilicate 10-cc pipettes.Each pipette contained 3% surfactant, pure n-alkanes and brines of 1% NaCO3
and X% NaCl . The pipettes were sealed with a torch and samples were rotatedend-to-end for at least 24 hours and then left to stand quiescent. Samplesreported as studied at 78°F were kept in a laboratory room without stricttemperature control. Equilibration at 78°F was achieved after 3½ months.Addition of secondary butyl alcohol could accelerate time of equilibration.However, alcohol addition would reduce oil solubilization, thus impeding realisticevaluation of surfactant potential.
Test results depicted in Figure 1.3-1 indicate that N67-7PO ismore hydrophobic and solubilized more n-decane oil than N67-3PO. Volumes ofoil and water solubilized per volume of surfactant (V/Vs) at the optimum was ~19for 7PO and ~10 for 3PO. Because of these results, the N67-7PO was selectedas the surfactant with more potential for application.
1 JOURNAL OF SURFACTANTS AND DETERGENTS, VOL. 7, NO. 4 (OCTOBER 2004), page 319-328
Surfactant Based Enhanced Oil Recovery and Foam Mobility Control, G.J. Hirasaki, C.A. Miller and G.A. PopeDE-FC26-03NT15406, February 2006
17
PO3
PO7
0
5
10
15
20
25
30
35
1 2 3 4 5 6 7 8 9
%NaCl +1% Na2CO3
Vo/
Vs
0
5
10
15
20
25
30
35
Vw
/Vs
Figure 1.3-1. Test results of salinity scans for 3- and7- propoxylated-sulfated surfactants made from aC16/17 controlled methyl-substituted alcohol.3%N67-7PO and –3PO, WOR=1, n-C10, 78°F.
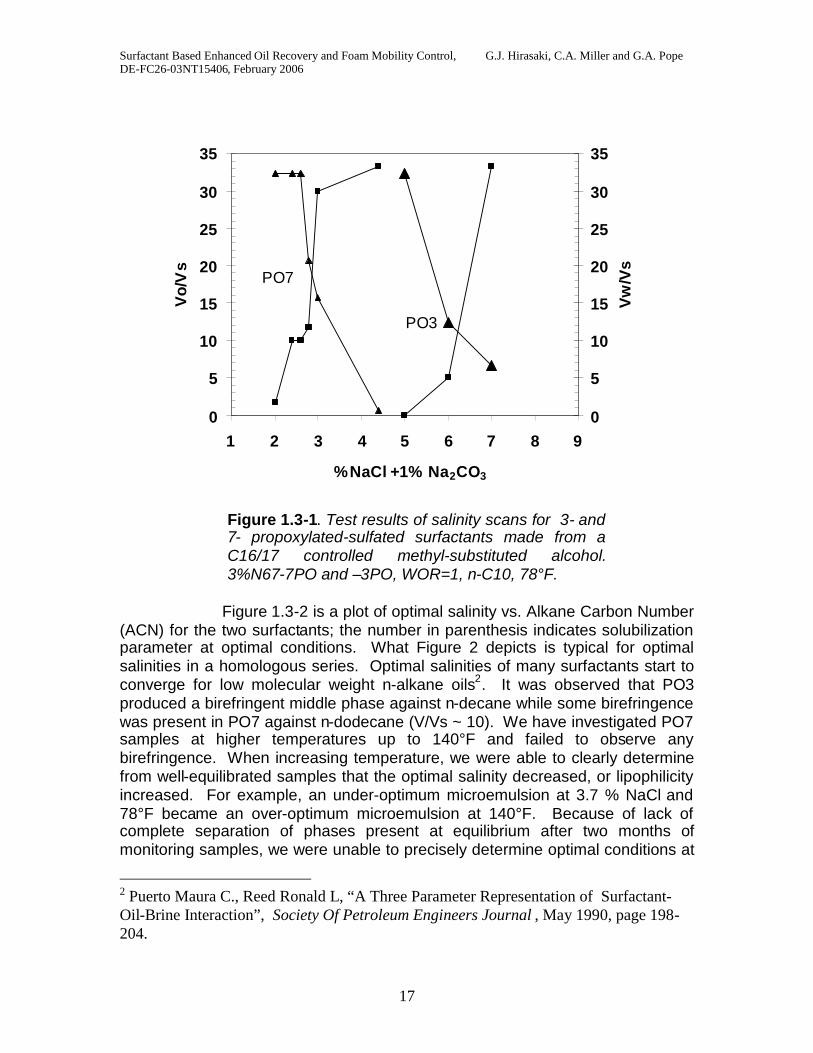
Figure 1.3-2 is a plot of optimal salinity vs. Alkane Carbon Number(ACN) for the two surfactants; the number in parenthesis indicates solubilizationparameter at optimal conditions. What Figure 2 depicts is typical for optimalsalinities in a homologous series. Optimal salinities of many surfactants start toconverge for low molecular weight n-alkane oils2. It was observed that PO3produced a birefringent middle phase against n-decane while some birefringencewas present in PO7 against n-dodecane (V/Vs ~ 10). We have investigated PO7samples at higher temperatures up to 140°F and failed to observe anybirefringence. When increasing temperature, we were able to clearly determinefrom well-equilibrated samples that the optimal salinity decreased, or lipophilicityincreased. For example, an under-optimum microemulsion at 3.7 % NaCl and78°F became an over-optimum microemulsion at 140°F. Because of lack ofcomplete separation of phases present at equilibrium after two months ofmonitoring samples, we were unable to precisely determine optimal conditions at
2 Puerto Maura C., Reed Ronald L, “A Three Parameter Representation of Surfactant-Oil-Brine Interaction”, Society Of Petroleum Engineers Journal , May 1990, page 198-204.
Surfactant Based Enhanced Oil Recovery and Foam Mobility Control, G.J. Hirasaki, C.A. Miller and G.A. PopeDE-FC26-03NT15406, February 2006
18
140°F. We hypothesize that the appearance of birefringence as the oil molecularweight increased is a manifestation of the surfactant lipophile not being long-enough to solubilize enough oil to have all the surfactant exist as microemulsion.For PO-3, birefringence started at n-decane, whereas for PO-7 it started at n–dodecane. Because the propoxylated surfactants become more lipophilic whenraising test temperature, which should lead to greater solubilization, the absenceof birefringence at140°F is consistent with validate this hypothesis. This matterneeds further investigation.
PO7
(~19)
(~10)
PO 3
(~10)
0
1
2
3
4
5
6
7
3 4 5 6 7 8 9 10 11 12 13
ACN
Op
timal
Sal
init
y
Figure 1.3-2. Optimal salinity vs. Alkane Carbon Number (ACN). 3%N67-7PO and –3PO, WOR=1
Surfactant Based Enhanced Oil Recovery and Foam Mobility Control, G.J. Hirasaki, C.A. Miller and G.A. PopeDE-FC26-03NT15406, February 2006
19
Subtask 1.4 Calcium tolerance of NI surfactant blend
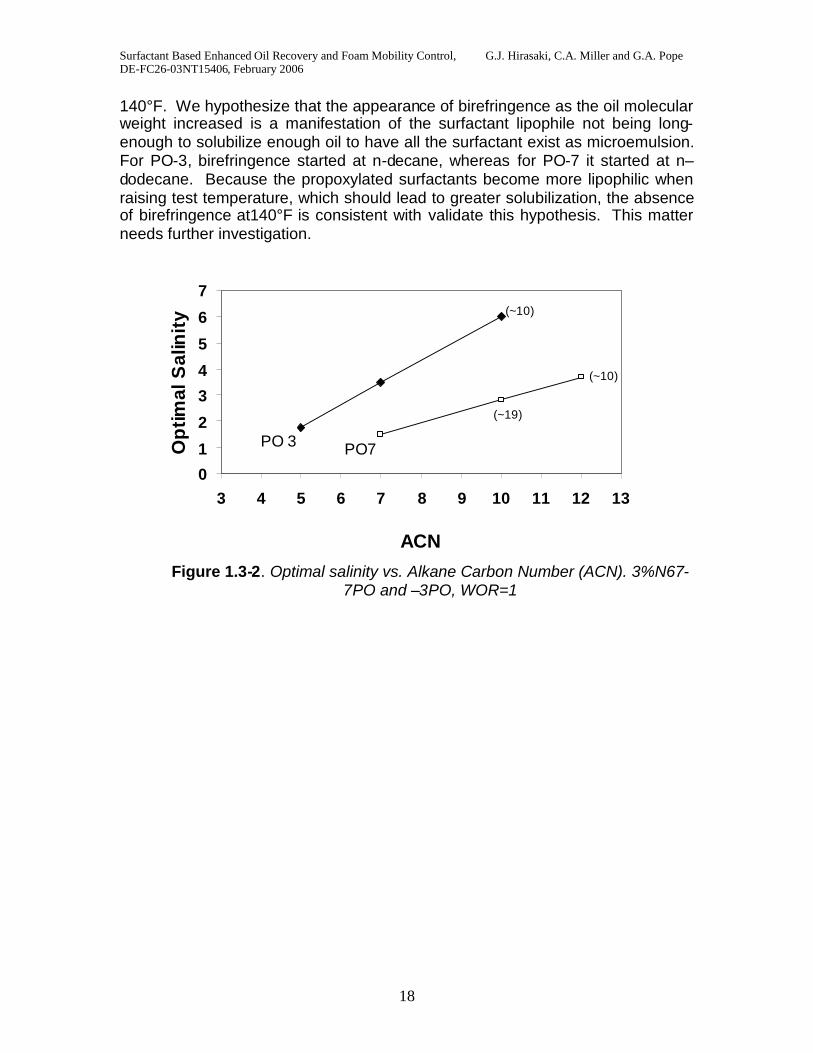
Blends of N67-7PO and IOS15-18 (called NI blend) can not only providegood oil recovery as discussed in subtask 2.4, but also improve the tolerance ofsurfactant to calcium.
Figure 1.4-1 shows that when N67-7PO and IOS were used separately, theconcentration of calcium chloride for phase separation occurred at 0.5% and0.1%, respectively. The phase separation behaviors of the two surfactants weredifferent: IOS was precipitated by calcium, while N67-7PO formed cloudysolutions, which ultimately separate into a viscous surfactant-rich phase andbrine, the former being more dense. However, when they were mixed at differentweight ratios, they stayed in the single-phase region over a much wider calciumrange than for IOS or N67-7PO alone. For 4:1 ratio which we used for forceddisplacement experiments described later, the upper limit concentration of CaCl2with clear solutions is 1.0%.
0.5% N67-7PO&IOS, 2% NaCl
0.0%
0.5%
1.0%
1.5%
2.0%
2.5%
N67-7PO
Con
cent
ratio
nof
CaC
l2
Phase Separation
Precipitation
Clear
IOS 4:1 2:1 1:1 1:2 1:4 1:9
Single Phase Region
Multi Phase Region
Figure 1.4-1 Phase diagram of NI blendConclusion
1. Mixtures of N67-7PO and IOS have higher calcium tolerance than either usedseparately.
Surfactant Based Enhanced Oil Recovery and Foam Mobility Control, G.J. Hirasaki, C.A. Miller and G.A. PopeDE-FC26-03NT15406, February 2006
20
Task 2 Phase behavior, adsorption, and composition changes duringdisplacement
Subtask 2.1 Surfactant Adsorption
Surfactant adsorption is crucial to surfactant recovery processes including thealkali-surfactant process. Both alkali concentration and salinity influence thesurfactant adsorption significantly. The presence of Na2CO3 can reduce thesurfactant adsorption. However, higher salinity causes higher surfactantadsorption and counteracts the adsorption reduction by alkali. Thus, it is betterto implement the alkali-surfactant process at lower salinity range. The effect ofsoap on synthetic surfactant adsorption was also tested. No synthetic surfactantadsorption reduction was found by using sodium oleate or sodium naphthenatesfrom Fisher Scientific.
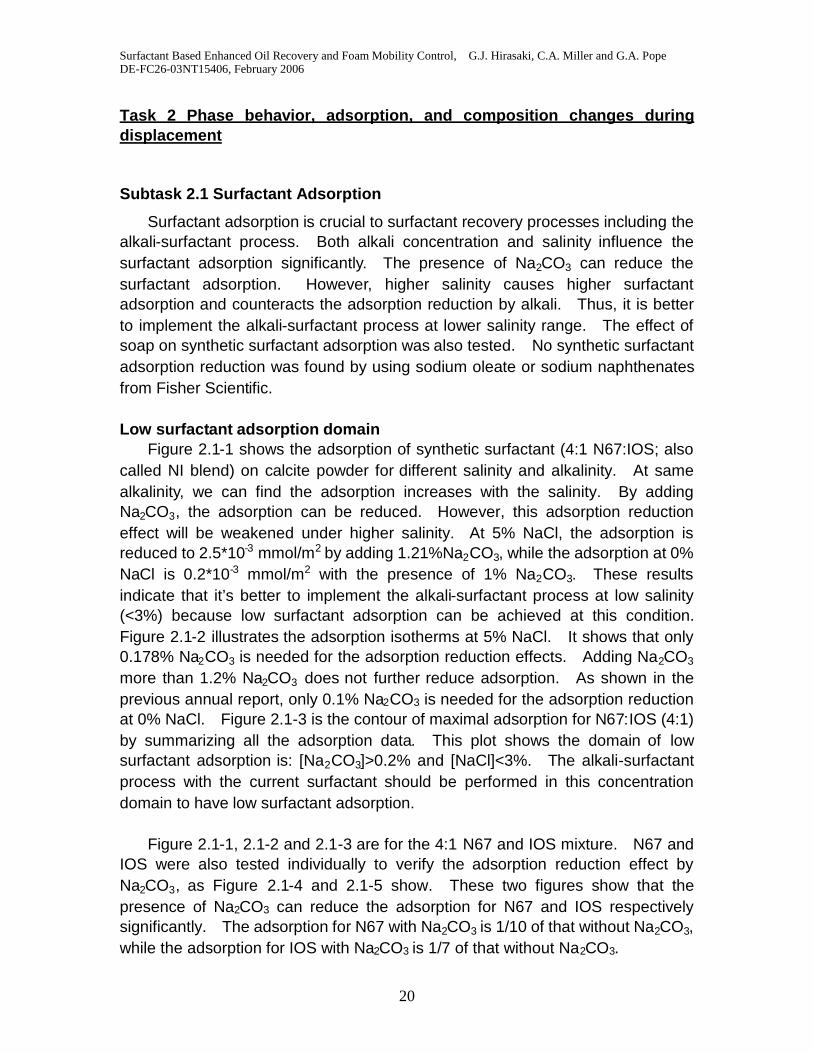
Low surfactant adsorption domainFigure 2.1-1 shows the adsorption of synthetic surfactant (4:1 N67:IOS; also
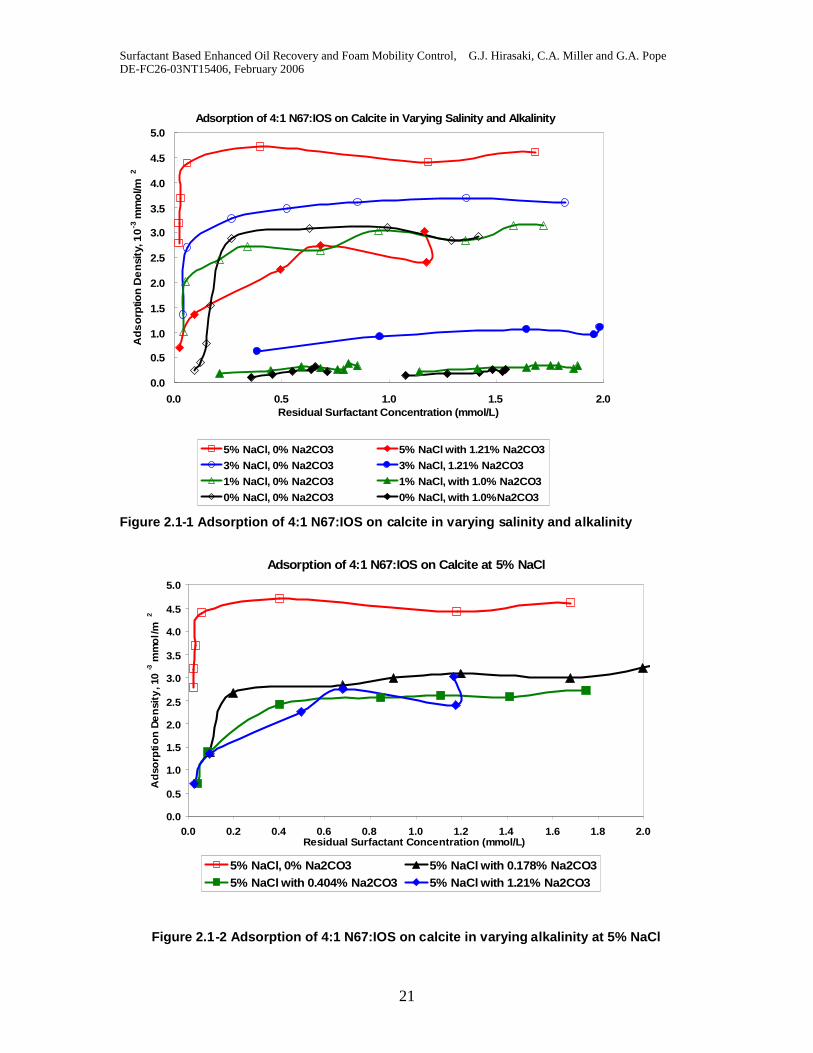
called NI blend) on calcite powder for different salinity and alkalinity. At samealkalinity, we can find the adsorption increases with the salinity. By addingNa2CO3, the adsorption can be reduced. However, this adsorption reductioneffect will be weakened under higher salinity. At 5% NaCl, the adsorption isreduced to 2.5*10-3 mmol/m2 by adding 1.21%Na2CO3, while the adsorption at 0%NaCl is 0.2*10-3 mmol/m2 with the presence of 1% Na2CO3. These resultsindicate that it’s better to implement the alkali-surfactant process at low salinity(<3%) because low surfactant adsorption can be achieved at this condition.Figure 2.1-2 illustrates the adsorption isotherms at 5% NaCl. It shows that only0.178% Na2CO3 is needed for the adsorption reduction effects. Adding Na2CO3
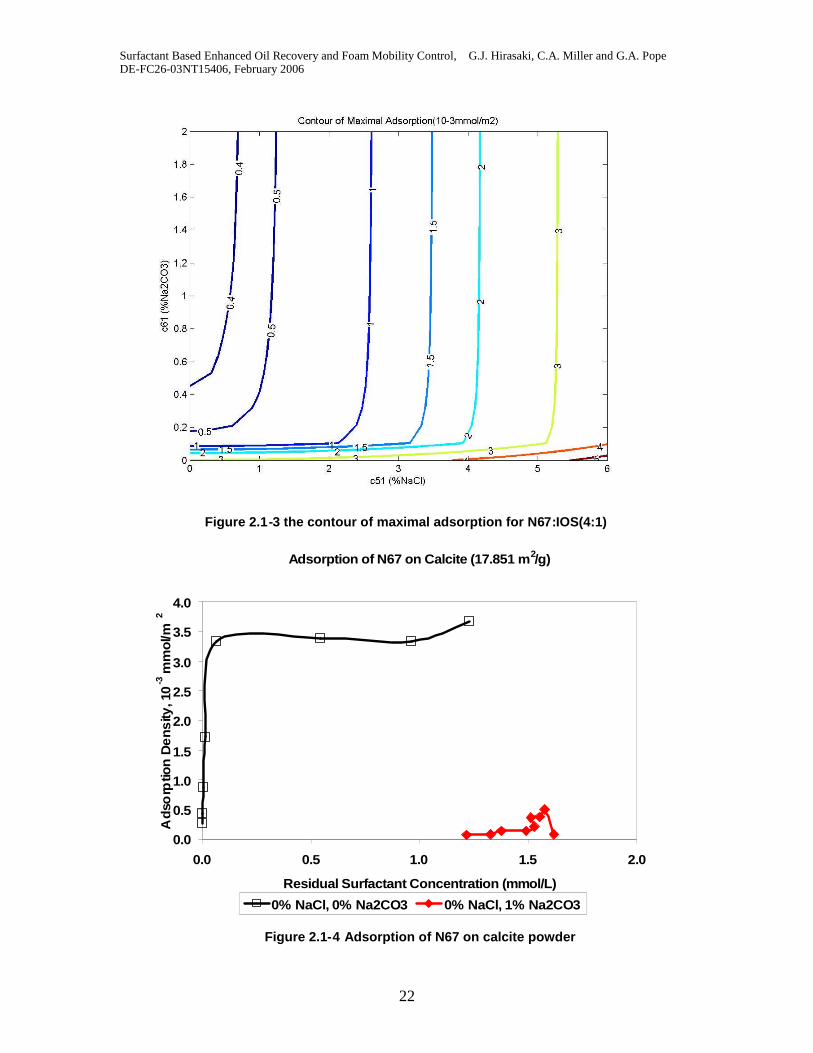
more than 1.2% Na2CO3 does not further reduce adsorption. As shown in theprevious annual report, only 0.1% Na2CO3 is needed for the adsorption reductionat 0% NaCl. Figure 2.1-3 is the contour of maximal adsorption for N67:IOS (4:1)by summarizing all the adsorption data. This plot shows the domain of lowsurfactant adsorption is: [Na2CO3]>0.2% and [NaCl]<3%. The alkali-surfactantprocess with the current surfactant should be performed in this concentrationdomain to have low surfactant adsorption.
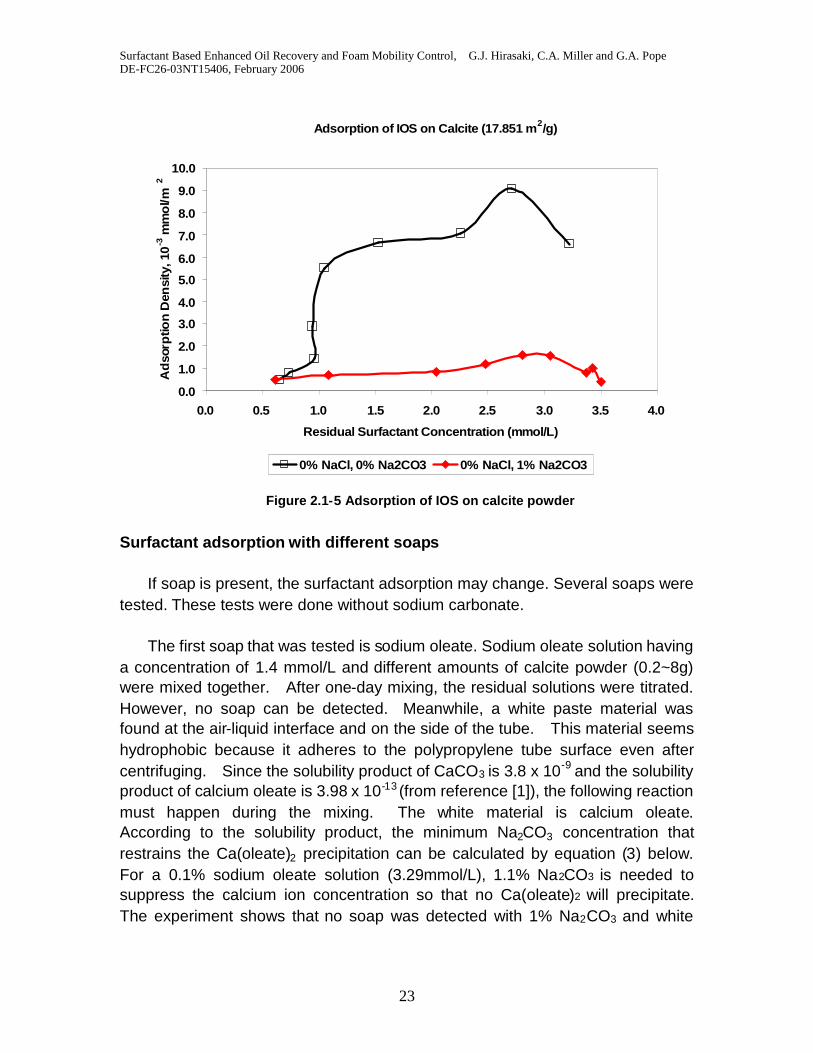
Figure 2.1-1, 2.1-2 and 2.1-3 are for the 4:1 N67 and IOS mixture. N67 andIOS were also tested individually to verify the adsorption reduction effect byNa2CO3, as Figure 2.1-4 and 2.1-5 show. These two figures show that thepresence of Na2CO3 can reduce the adsorption for N67 and IOS respectivelysignificantly. The adsorption for N67 with Na2CO3 is 1/10 of that without Na2CO3,while the adsorption for IOS with Na2CO3 is 1/7 of that without Na2CO3.
Surfactant Based Enhanced Oil Recovery and Foam Mobility Control, G.J. Hirasaki, C.A. Miller and G.A. PopeDE-FC26-03NT15406, February 2006
21
Adsorption of 4:1 N67:IOS on Calcite in Varying Salinity and Alkalinity
0.0
0.5
1.0
1.5
2.0
2.5
3.0
3.5
4.0
4.5
5.0
0.0 0.5 1.0 1.5 2.0Residual Surfactant Concentration (mmol/L)
Ad
so
rptio
nD
en
sity
,10
-3m
mo
l/m2
5% NaCl, 0% Na2CO3 5% NaCl with 1.21% Na2CO33% NaCl, 0% Na2CO3 3% NaCl, 1.21% Na2CO31% NaCl, 0% Na2CO3 1% NaCl, with 1.0% Na2CO30% NaCl, 0% Na2CO3 0% NaCl, with 1.0%Na2CO3
Figure 2.1-1 Adsorption of 4:1 N67:IOS on calcite in varying salinity and alkalinity
Adsorption of 4:1 N67:IOS on Calcite at 5% NaCl
0.0
0.5
1.0
1.5
2.0
2.5
3.0
3.5
4.0
4.5
5.0
0.0 0.2 0.4 0.6 0.8 1.0 1.2 1.4 1.6 1.8 2.0Residual Surfactant Concentration (mmol/L)
Ad
sorp
tio
nD
en
sity
,10
-3m
mo
l/m
2
5% NaCl, 0% Na2CO3 5% NaCl with 0.178% Na2CO35% NaCl with 0.404% Na2CO3 5% NaCl with 1.21% Na2CO3
Figure 2.1-2 Adsorption of 4:1 N67:IOS on calcite in varying alkalinity at 5% NaCl
Surfactant Based Enhanced Oil Recovery and Foam Mobility Control, G.J. Hirasaki, C.A. Miller and G.A. PopeDE-FC26-03NT15406, February 2006
22
Figure 2.1-3 the contour of maximal adsorption for N67:IOS(4:1)
Adsorption of N67 on Calcite (17.851 m2/g)
0.0
0.5
1.0
1.5
2.0
2.5
3.0
3.5
4.0
0.0 0.5 1.0 1.5 2.0
Residual Surfactant Concentration (mmol/L)
Ad
sorp
tion
De
ns
ity,1
0-3
mm
ol/m
2
0% NaCl, 0% Na2CO3 0% NaCl, 1% Na2CO3
Figure 2.1-4 Adsorption of N67 on calcite powder
Surfactant Based Enhanced Oil Recovery and Foam Mobility Control, G.J. Hirasaki, C.A. Miller and G.A. PopeDE-FC26-03NT15406, February 2006
23
Adsorption of IOS on Calcite (17.851 m2/g)
0.0
1.0
2.0
3.0
4.0
5.0
6.0
7.0
8.0
9.0
10.0
0.0 0.5 1.0 1.5 2.0 2.5 3.0 3.5 4.0
Residual Surfactant Concentration (mmol/L)
Ad
sorp
tion
Den
sity
,10
-3m
mo
l/m2
0% NaCl, 0% Na2CO3 0% NaCl, 1% Na2CO3
Figure 2.1-5 Adsorption of IOS on calcite powder
Surfactant adsorption with different soaps
If soap is present, the surfactant adsorption may change. Several soaps weretested. These tests were done without sodium carbonate.
The first soap that was tested is sodium oleate. Sodium oleate solution havinga concentration of 1.4 mmol/L and different amounts of calcite powder (0.2~8g)were mixed together. After one-day mixing, the residual solutions were titrated.However, no soap can be detected. Meanwhile, a white paste material wasfound at the air-liquid interface and on the side of the tube. This material seemshydrophobic because it adheres to the polypropylene tube surface even aftercentrifuging. Since the solubility product of CaCO3 is 3.8 x 10⁻⁹ and the solubilityproduct of calcium oleate is 3.98 x 10⁻¹³ (from reference [1]), the following reactionmust happen during the mixing. The white material is calcium oleate.According to the solubility product, the minimum Na2CO3 concentration thatrestrains the Ca(oleate)2 precipitation can be calculated by equation (3) below.For a 0.1% sodium oleate solution (3.29mmol/L), 1.1% Na2CO3 is needed tosuppress the calcium ion concentration so that no Ca(oleate)2 will precipitate.The experiment shows that no soap was detected with 1% Na2CO3 and white
Surfactant Based Enhanced Oil Recovery and Foam Mobility Control, G.J. Hirasaki, C.A. Miller and G.A. PopeDE-FC26-03NT15406, February 2006
24
materials were found inside the tube. Only after adding 5% Na2CO3, no whitematerial was formed. The relevant reactions and equilibrium relations are:
NaOleateCaCaOleateNa 22 22 (1)
323
2 CaCOCOCa (2)
2
)(
223 ][*9500][][
2
3 OleateK
KOleateCO
OleatespCa
spCaCO (3)
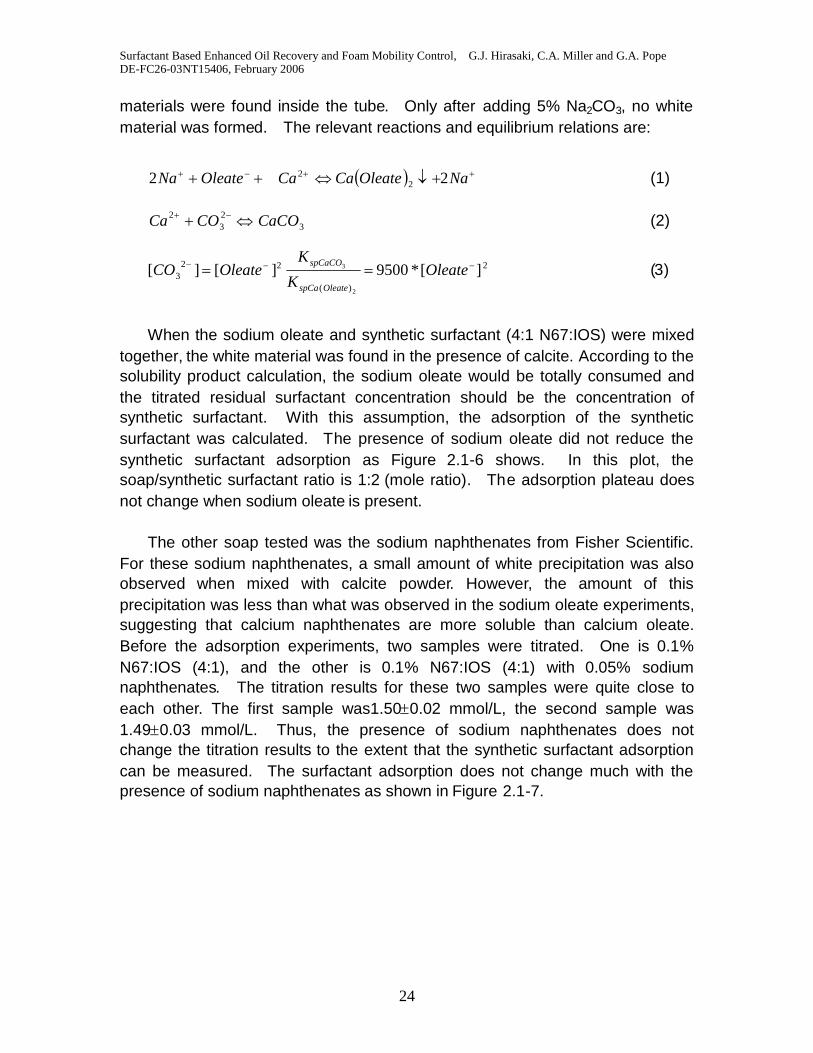
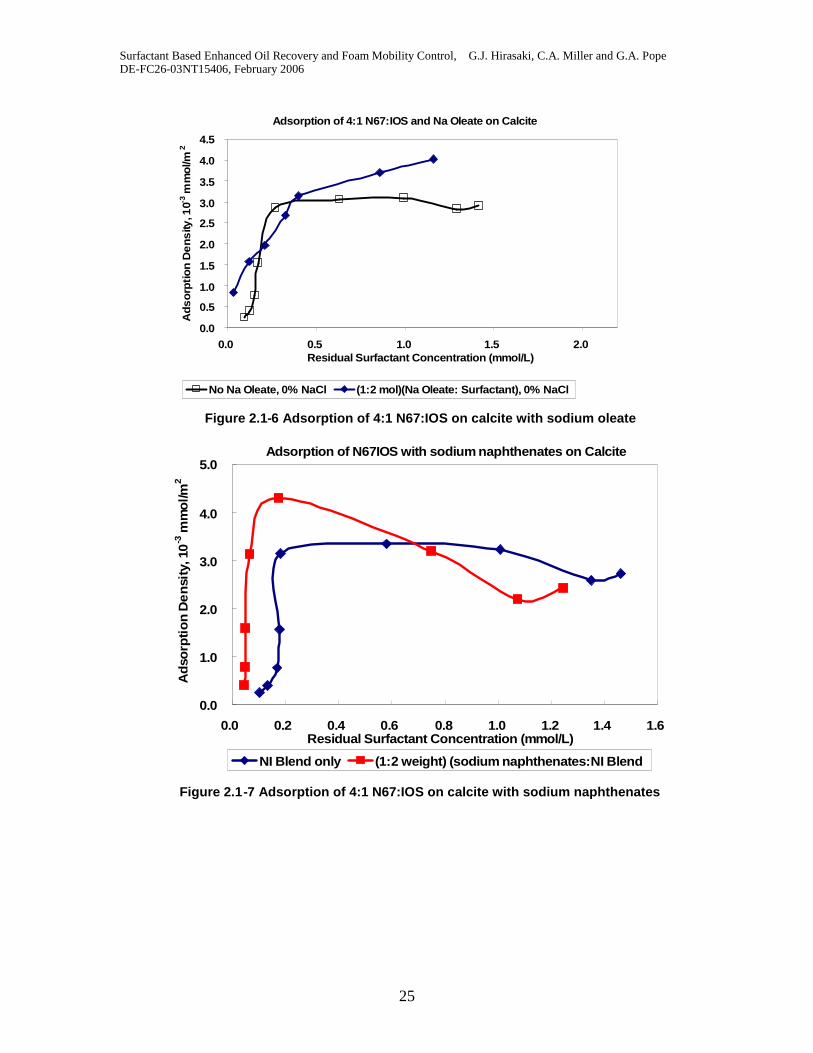
When the sodium oleate and synthetic surfactant (4:1 N67:IOS) were mixedtogether, the white material was found in the presence of calcite. According to thesolubility product calculation, the sodium oleate would be totally consumed andthe titrated residual surfactant concentration should be the concentration ofsynthetic surfactant. With this assumption, the adsorption of the syntheticsurfactant was calculated. The presence of sodium oleate did not reduce thesynthetic surfactant adsorption as Figure 2.1-6 shows. In this plot, thesoap/synthetic surfactant ratio is 1:2 (mole ratio). The adsorption plateau doesnot change when sodium oleate is present.
The other soap tested was the sodium naphthenates from Fisher Scientific.For these sodium naphthenates, a small amount of white precipitation was alsoobserved when mixed with calcite powder. However, the amount of thisprecipitation was less than what was observed in the sodium oleate experiments,suggesting that calcium naphthenates are more soluble than calcium oleate.Before the adsorption experiments, two samples were titrated. One is 0.1%N67:IOS (4:1), and the other is 0.1% N67:IOS (4:1) with 0.05% sodiumnaphthenates. The titration results for these two samples were quite close toeach other. The first sample was1.500.02 mmol/L, the second sample was1.490.03 mmol/L. Thus, the presence of sodium naphthenates does notchange the titration results to the extent that the synthetic surfactant adsorptioncan be measured. The surfactant adsorption does not change much with thepresence of sodium naphthenates as shown in Figure 2.1-7.
Surfactant Based Enhanced Oil Recovery and Foam Mobility Control, G.J. Hirasaki, C.A. Miller and G.A. PopeDE-FC26-03NT15406, February 2006
25
Adsorption of 4:1 N67:IOS and Na Oleate on Calcite
0.0
0.5
1.0
1.5
2.0
2.5
3.0
3.5
4.0
4.5
0.0 0.5 1.0 1.5 2.0Residual Surfactant Concentration (mmol/L)
Ad
so
rpti
on
De
ns
ity,1
0-3m
mo
l/m2
No Na Oleate, 0% NaCl (1:2 mol)(Na Oleate: Surfactant), 0% NaCl
Figure 2.1-6 Adsorption of 4:1 N67:IOS on calcite with sodium oleate
Adsorption of N67IOS with sodium naphthenates on Calcite
0.0
1.0
2.0
3.0
4.0
5.0
0.0 0.2 0.4 0.6 0.8 1.0 1.2 1.4 1.6Residual Surfactant Concentration (mmol/L)
Ad
sorp
tio
nD
en
sity
,10
-3m
mo
l/m2
NI Blend only (1:2 weight) (sodium naphthenates:NI Blend
Figure 2.1-7 Adsorption of 4:1 N67:IOS on calcite with sodium naphthenates
Surfactant Based Enhanced Oil Recovery and Foam Mobility Control, G.J. Hirasaki, C.A. Miller and G.A. PopeDE-FC26-03NT15406, February 2006
26
Conclusions
1. Both alkali concentration and salinity influence the anionic surfactantadsorption significantly. The presence of Na2CO3 can reduce the surfactantadsorption. However, higher salinity increases surfactant adsorption andcounteracts the adsorption reduction by alkali.
2. The concentration domain with low surfactant adsorption for the currentsurfactant is: [Na2CO3]>0.2% and [NaCl]<3%.
3. The presence of Na2CO3 reduces the adsorption for N67 and IOS respectivelysignificantly.
4. The presence of sodium oleate and sodium naphthenates does not reduce thesynthetic surfactant adsorption on calcite, in the absence of sodium carbonate.
Reference:
[1] Beneventi D, Carre B, Gandini A., Precipitation and Solubility of CalciumSoaps in Basic Aqueous Media. J Colloid Interface Sci. 2001 May1;237(1):142-144
Surfactant Based Enhanced Oil Recovery and Foam Mobility Control, G.J. Hirasaki, C.A. Miller and G.A. PopeDE-FC26-03NT15406, February 2006
27
Subtask 2.2 IFT measurement and ultra-low IFT region
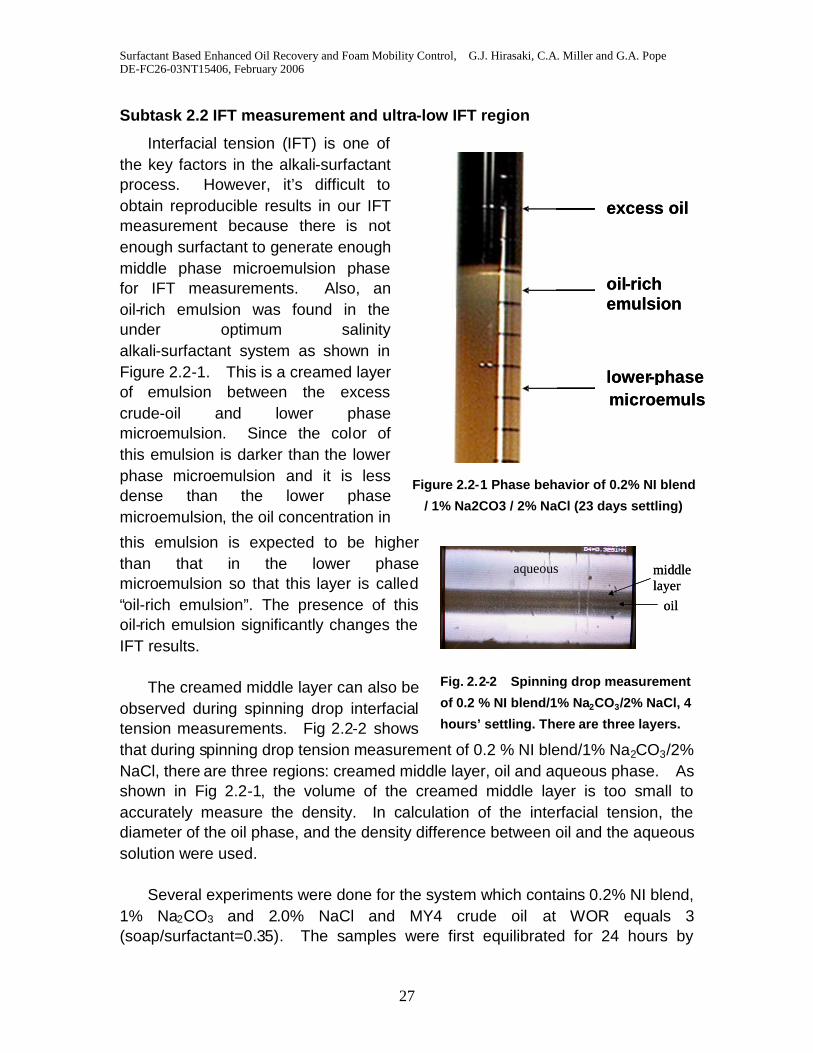
Interfacial tension (IFT) is one ofthe key factors in the alkali-surfactantprocess. However, it’s difficult toobtain reproducible results in our IFTmeasurement because there is notenough surfactant to generate enoughmiddle phase microemulsion phasefor IFT measurements. Also, anoil-rich emulsion was found in theunder optimum salinityalkali-surfactant system as shown inFigure 2.2-1. This is a creamed layerof emulsion between the excesscrude-oil and lower phasemicroemulsion. Since the color ofthis emulsion is darker than the lowerphase microemulsion and it is lessdense than the lower phasemicroemulsion, the oil concentration in
this emulsion is expected to be higherthan that in the lower phasemicroemulsion so that this layer is called“oil-rich emulsion”. The presence of thisoil-rich emulsion significantly changes theIFT results.
The creamed middle layer can also beobserved during spinning drop interfacialtension measurements. Fig 2.2-2 showsthat during spinning drop tension measuremeNaCl, there are three regions: creamed middshown in Fig 2.2-1, the volume of the creaccurately measure the density. In calcudiameter of the oil phase, and the density difsolution were used.
Several experiments were done for the s1% Na2CO3 and 2.0% NaCl and MY(soap/surfactant=0.35). The samples were
oil-richemulsion
lower-phase
excess oil
microemulsion
oil-richemulsion
lower-phase
excess oil
microemulsion
Figure 2.2-1 Phase behavior of 0.2% NI blend
/ 1% Na2CO3 / 2% NaCl (23 days settling)
oil
middlelayer
aqueous
oil
middlelayer
aqueous
Fig. 2.2-2 Spinning drop measurement
of 0.2 % NI blend/1% Na2CO3/2% NaCl, 4
nt of 0.2 % NI blend/1% Na2CO3/2%le layer, oil and aqueous phase. Asamed middle layer is too small to
lation of the interfacial tension, theference between oil and the aqueous
ystem which contains 0.2% NI blend,4 crude oil at WOR equals 3
first equilibrated for 24 hours by
hours’ settling. There are three layers.
Surfactant Based Enhanced Oil Recovery and Foam Mobility Control, G.J. Hirasaki, C.A. Miller and G.A. PopeDE-FC26-03NT15406, February 2006
28
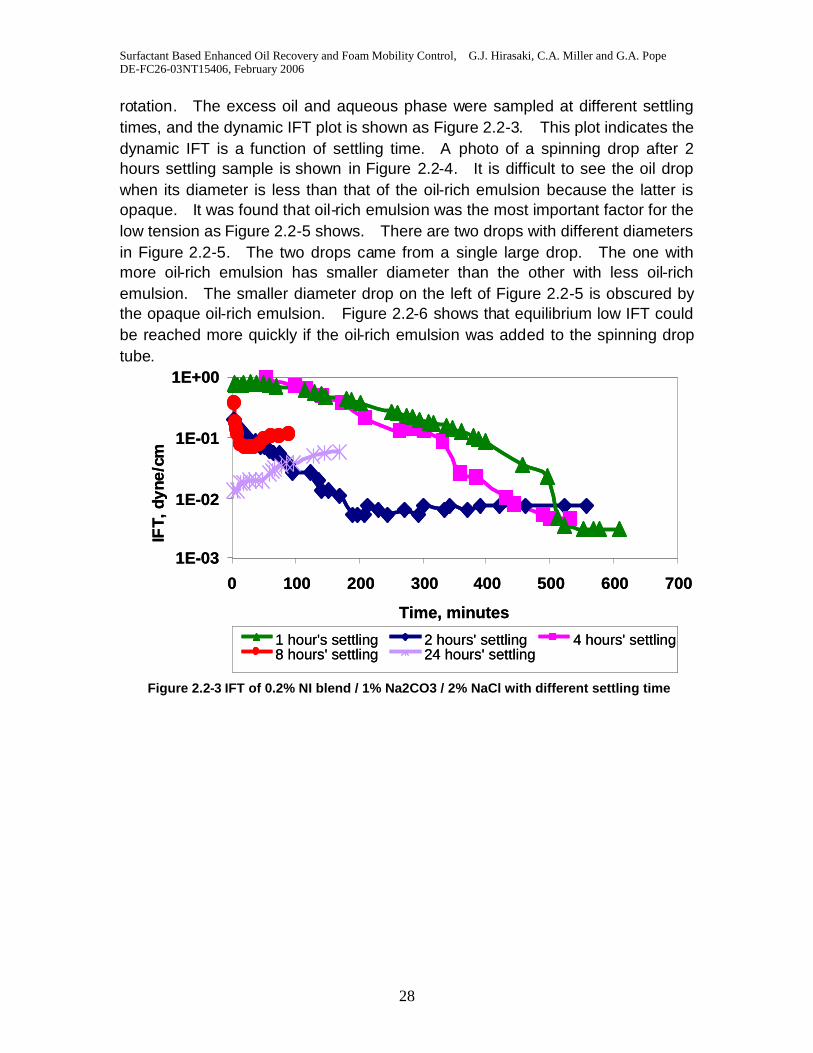
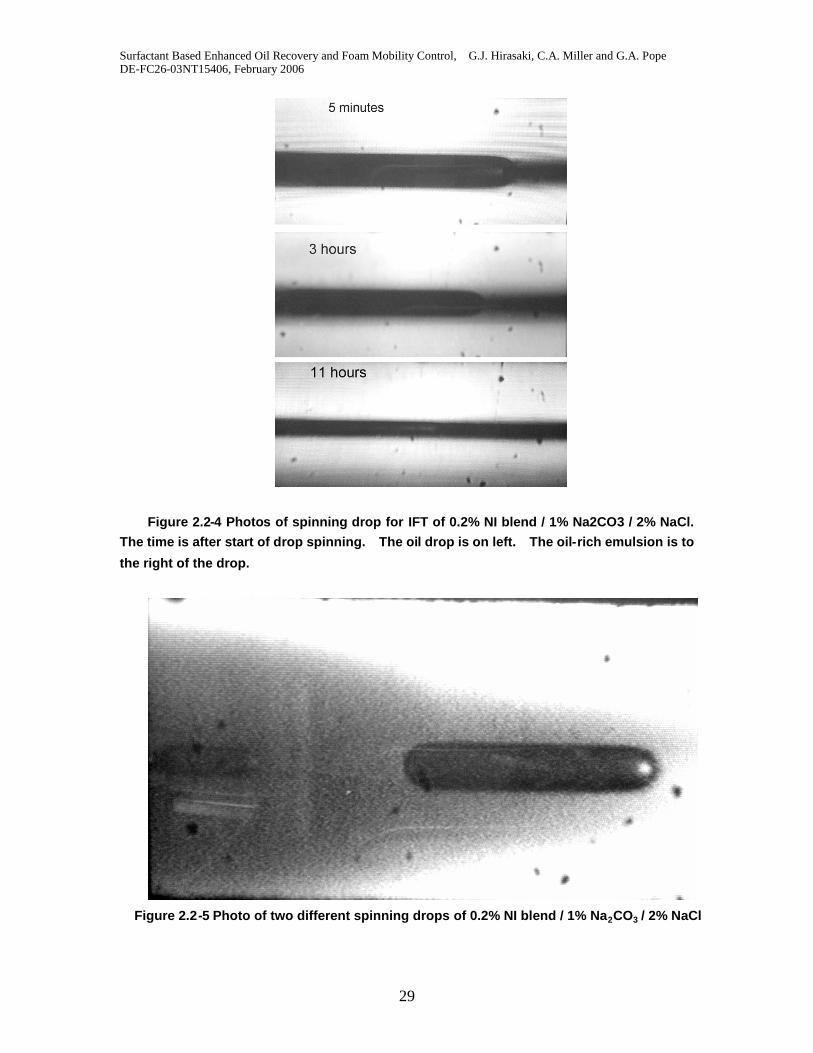
rotation. The excess oil and aqueous phase were sampled at different settlingtimes, and the dynamic IFT plot is shown as Figure 2.2-3. This plot indicates thedynamic IFT is a function of settling time. A photo of a spinning drop after 2hours settling sample is shown in Figure 2.2-4. It is difficult to see the oil dropwhen its diameter is less than that of the oil-rich emulsion because the latter isopaque. It was found that oil-rich emulsion was the most important factor for thelow tension as Figure 2.2-5 shows. There are two drops with different diametersin Figure 2.2-5. The two drops came from a single large drop. The one withmore oil-rich emulsion has smaller diameter than the other with less oil-richemulsion. The smaller diameter drop on the left of Figure 2.2-5 is obscured bythe opaque oil-rich emulsion. Figure 2.2-6 shows that equilibrium low IFT couldbe reached more quickly if the oil-rich emulsion was added to the spinning droptube.
1E-03
1E-02
1E-01
1E+00
0 100 200 300 400 500 600 700
Time, minutes
IFT,
dyne
/cm
2 hours' settling 4 hours' settling1 hour's settling8 hours' settling 24 hours' settling
1E-03
1E-02
1E-01
1E+00
0 100 200 300 400 500 600 700
Time, minutes
IFT,
dyne
/cm
2 hours' settling 4 hours' settling1 hour's settling8 hours' settling 24 hours' settling
2 hours' settling2 hours' settling 4 hours' settling4 hours' settling1 hour's settling1 hour's settling8 hours' settling8 hours' settling 24 hours' settling24 hours' settling
Figure 2.2-3 IFT of 0.2% NI blend / 1% Na2CO3 / 2% NaCl with different settling time
Surfactant Based Enhanced Oil Recovery and Foam Mobility Control, G.J. Hirasaki, C.A. Miller and G.A. PopeDE-FC26-03NT15406, February 2006
29
Figure 2.2-4 Photos of spinning drop for IFT of 0.2% NI blend / 1% Na2CO3 / 2% NaCl.The time is after start of drop spinning. The oil drop is on left. The oil-rich emulsion is to
the right of the drop.
Figure 2.2-5 Photo of two different spinning drops of 0.2% NI blend / 1% Na2CO3 / 2% NaCl
Surfactant Based Enhanced Oil Recovery and Foam Mobility Control, G.J. Hirasaki, C.A. Miller and G.A. PopeDE-FC26-03NT15406, February 2006
30
1E-04
1E-03
1E-02
1E-01
1E+00
0 100 200 300 400 500 600 700
Time, minutes
IFT
,dyn
e/cm
2 hours' settling 4 hours' settling1 hour's settling2 hours settling, clear aqueous + oil-rich emulsion
1E-04
1E-03
1E-02
1E-01
1E+00
0 100 200 300 400 500 600 700
Time, minutes
IFT
,dyn
e/cm
2 hours' settling2 hours' settling 4 hours' settling4 hours' settling1 hour's settling1 hour's settling2 hours settling, clear aqueous + oil-rich emulsion2 hours settling, clear aqueous + oil-rich emulsion
Figure 2.2-6 IFT of 0.2% NI blend / 1% Na2CO3 / 2% NaCl with different settling time
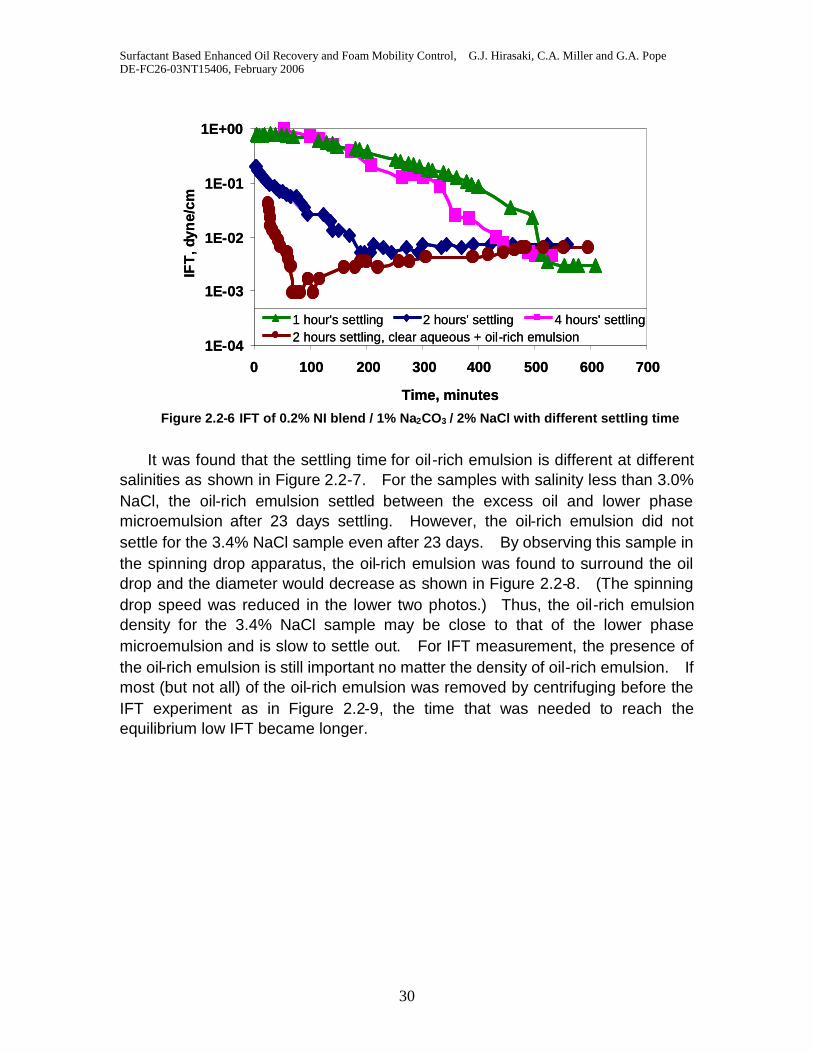
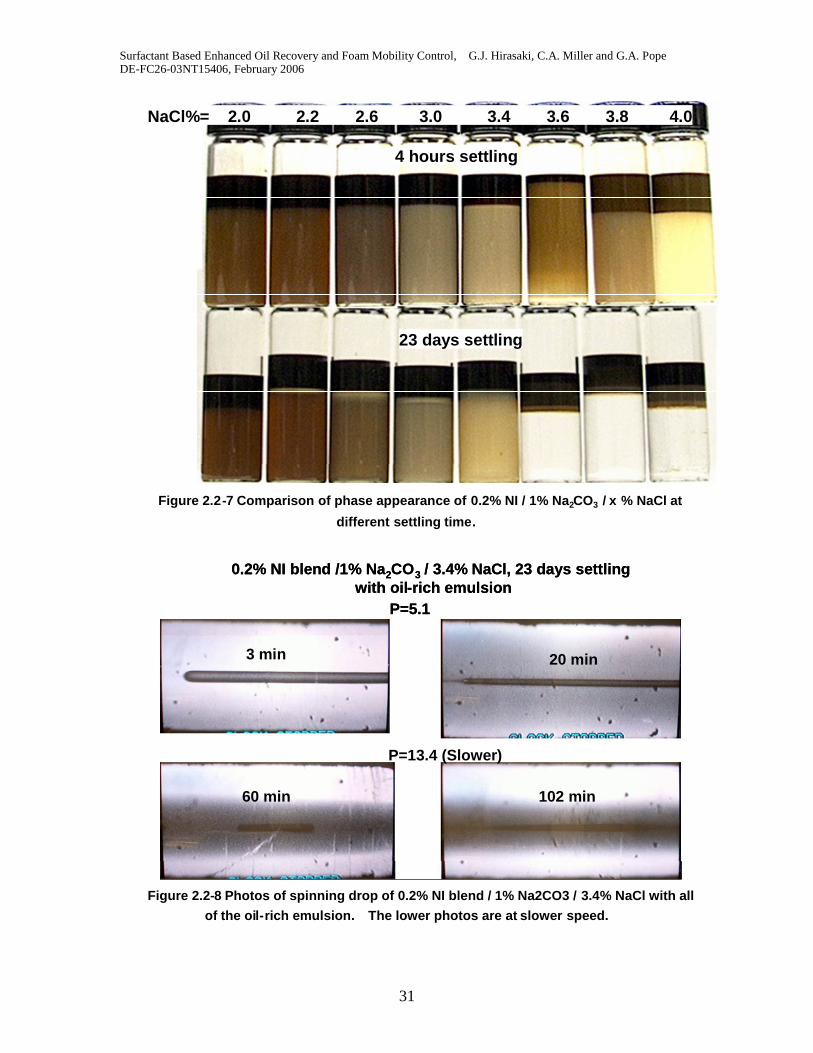
It was found that the settling time for oil-rich emulsion is different at differentsalinities as shown in Figure 2.2-7. For the samples with salinity less than 3.0%NaCl, the oil-rich emulsion settled between the excess oil and lower phasemicroemulsion after 23 days settling. However, the oil-rich emulsion did notsettle for the 3.4% NaCl sample even after 23 days. By observing this sample inthe spinning drop apparatus, the oil-rich emulsion was found to surround the oildrop and the diameter would decrease as shown in Figure 2.2-8. (The spinningdrop speed was reduced in the lower two photos.) Thus, the oil-rich emulsiondensity for the 3.4% NaCl sample may be close to that of the lower phasemicroemulsion and is slow to settle out. For IFT measurement, the presence ofthe oil-rich emulsion is still important no matter the density of oil-rich emulsion. Ifmost (but not all) of the oil-rich emulsion was removed by centrifuging before theIFT experiment as in Figure 2.2-9, the time that was needed to reach theequilibrium low IFT became longer.
Surfactant Based Enhanced Oil Recovery and Foam Mobility Control, G.J. Hirasaki, C.A. Miller and G.A. PopeDE-FC26-03NT15406, February 2006
31
NaCl%= 2.0 2.2 2.6 3.0 3.4 3.6 3.8 4.0
23 days settling
4 hours settling
NaCl%= 2.0 2.2 2.6 3.0 3.4 3.6 3.8 4.0
23 days settling
4 hours settling
Figure 2.2-7 Comparison of phase appearance of 0.2% NI / 1% Na2CO3 / x % NaCl at
different settling time.
3 min 20 min
60 min
P=5.1
P=13.4 (Slower)
102 min
0.2% NI blend /1% Na2CO3 / 3.4% NaCl, 23 days settlingwith oil-rich emulsion
3 min 20 min
60 min
P=5.1
P=13.4 (Slower)
102 min
0.2% NI blend /1% Na2CO3 / 3.4% NaCl, 23 days settlingwith oil-rich emulsion
Figure 2.2-8 Photos of spinning drop of 0.2% NI blend / 1% Na2CO3 / 3.4% NaCl with allof the oil-rich emulsion. The lower photos are at slower speed.
Surfactant Based Enhanced Oil Recovery and Foam Mobility Control, G.J. Hirasaki, C.A. Miller and G.A. PopeDE-FC26-03NT15406, February 2006
32
2 min
135 min
210 min
0.2% NI blend /1% Na2CO3 / 3.4% NaCl, 23 days settlingRemove most oil-rich emulsion
2 min
135 min
210 min
2 min
135 min
210 min
0.2% NI blend /1% Na2CO3 / 3.4% NaCl, 23 days settlingRemove most oil-rich emulsion
Figure 2.2-9 Photos of spinning drop of 0.2% NI blend / 1% Na2CO3 / 3.4% NaClMost of the oil-rich emulsion has been removed. (P=5.1)
The oil-rich emulsion is very important for the IFT measurement. However,the spinning drop can not be seen if the oil-rich emulsion surrounds the oil dropand extends to the end of the tube. The oil drops in Figures 2.2-4 and 9 can beseen because the amount of oil-rich emulsion is no more than the amount of oildrop. The oil-rich emulsion needs time to occupy the oil-water surface. It isbetter to let the oil drop and the oil-rich emulsion settle in the spinning tube forsome time before the spinning experiments. Otherwise, the phenomena inFigures 2.2-5 and 8 will occur and a longer time is needed to reach equilibriumIFT.
A standard method which can quickly provide reproducible equilibrium IFT isintroduced. The spinning drop IFT experiments was conducted as follows:
1. Mix the crude oil with the alkaline surfactant solutions containing 0.2% NIblend and 1% Na2CO3 at WOR equals 3. These solutions have different salinity(0%NaCl~5%NaCl).
2. Rotate the mixture for 24 hours to reach equilibrium.
Surfactant Based Enhanced Oil Recovery and Foam Mobility Control, G.J. Hirasaki, C.A. Miller and G.A. PopeDE-FC26-03NT15406, February 2006
33
3. After settling the mixture for 4 hours, oleic and aqueous phases were takenout into different syringes. The phase appearances of these samples are shownas Figure 2.2-10. If settling time is longer than 24 hours, the aqueous phase willclear up due to separation of the oil-rich emulsion. Low IFT may not be observedas discussed in previous annual report.
4. Since the samples in the syringes may continue to settle and the settling timein the syringe may be different, they were shaken before the IFT spinning dropmeasurement so that they can be considered as the same sample that wasobtained after 4 hours settling.
5. Before the spinning drop measurement, the aqueous phase was centrifugedfirst to remove some of the excess oil-rich emulsion because the sample will betoo dark if too much oil-rich emulsion is left. The remaining oil-rich emulsionshould be less volume than the volume of the excess oil drop that is added intothe spinning drop tube.
6. Let the oil drop settle in the vertical tube for some time (~12 hours) so thatthe oil-rich emulsion can equilibrate with the oil and the lower phasemicroemulsion.
7. Begin the spinning drop IFT measurement.
Step 6 will be shown to be a necessary procedure in the following. Figure2.2-11 - 16 show the dynamic IFT of the samples with different salinities(0%~5%). For 0% NaCl, 1% NaCl, 2% NaCl and 4% NaCl samples, step 6reduces the time that is needed to reach the equilibrium low tension. However,there is no significant difference for 3% NaCl sample by using step 6. This canbe explained by phase behavior in Figure 2.2-10. The lower phase for 3% NaClis similar in density to the oil-rich emulsion phase so that the oil-rich emulsion wasprobably dispersed throughout the lower phase. For 5% NaCl sample, step 6was not used because there is no oil-rich emulsion in the aqueous phase as theaqueous phase is clear. The oil-rich emulsion must be the upper phaseemulsion, and Figure2.2-10 shows the upper-phase emulsion for 5% NaClsample.
Surfactant Based Enhanced Oil Recovery and Foam Mobility Control, G.J. Hirasaki, C.A. Miller and G.A. PopeDE-FC26-03NT15406, February 2006
34
Figure 2.2-10 Phase behavior of 0.2% NI blend/1% Na2CO3
(24 hours mixing, 4 hours settling)
Surfactant Based Enhanced Oil Recovery and Foam Mobility Control, G.J. Hirasaki, C.A. Miller and G.A. PopeDE-FC26-03NT15406, February 2006
35
Dynamic IFT of 0.2%NI-1%Na2CO3-0%NaCl
1.E-03
1.E-02
1.E-01
1.E+00
0 50 100 150 200 250Time, minutes
IFT,
dyn
e/c
m
0% NaCl with step 6 0% NaCl without step 6
Figure 2.2-11 IFT of 0.2% NI blend/1% Na2CO3/0%NaCl as a function of time
Dynamic IFT of 0.2%NI-1%Na2CO3-1%NaCl
1.E-03
1.E-02
1.E-01
1.E+00
0 50 100 150 200 250Time, minutes
IFT
,dyn
e/cm
1% NaCl with step 6 1% NaCl without step 6
Figure 2.2-12 IFT of 0.2% NI blend/1% Na2CO3/1%NaCl as a function of time
Dynamic IFT of 0.2%NI-1%Na2CO3-2%NaCl
1.E-03
1.E-02
1.E-01
1.E+00
0 100 200 300 400 500 600Time, minutes
IFT
,dy
ne/c
m
2% NaCl with step 6 2% NaCl without step 6
Figure 2.2-13 IFT of 0.2% NI blend/1% Na2CO3/2%NaCl as a function of time
Surfactant Based Enhanced Oil Recovery and Foam Mobility Control, G.J. Hirasaki, C.A. Miller and G.A. PopeDE-FC26-03NT15406, February 2006
36
Dynamic IFT of 0.2%NI-1%Na2CO3-3%NaCl
1.E-03
1.E-02
1.E-01
1.E+00
0 50 100 150 200 250 300 350Time, minutes
IFT,
dyne
/cm
3% NaCl with step 6 3% NaCl without step 6
Figure 2.2-14 IFT of 0.2% NI blend/1% Na2CO3/3%NaCl as a function of time
Dynamic IFT of 0.2%NI-1%Na2CO3-4%NaCl
1.E-03
1.E-02
1.E-01
1.E+00
0 50 100 150 200 250Time, minutes
IFT
,dy
ne/
cm
4% NaCl With step6 4% NaCl Without step 6
Figure 2.2-15 IFT of 0.2% NI blend/1% Na2CO3/4%NaCl as a function of time
Dynamic IFT of 0.2%NI-1%Na2CO3-5%NaCl
1.E-03
1.E-02
1.E-01
1.E+00
0 20 40 60 80 100Time, minutes
IFT
,dyn
e/c
m
5% NaCl without step 6
Figure 2.2-16 IFT of 0.2% NI blend/1% Na2CO3/5%NaCl as a function of time
Surfactant Based Enhanced Oil Recovery and Foam Mobility Control, G.J. Hirasaki, C.A. Miller and G.A. PopeDE-FC26-03NT15406, February 2006
37
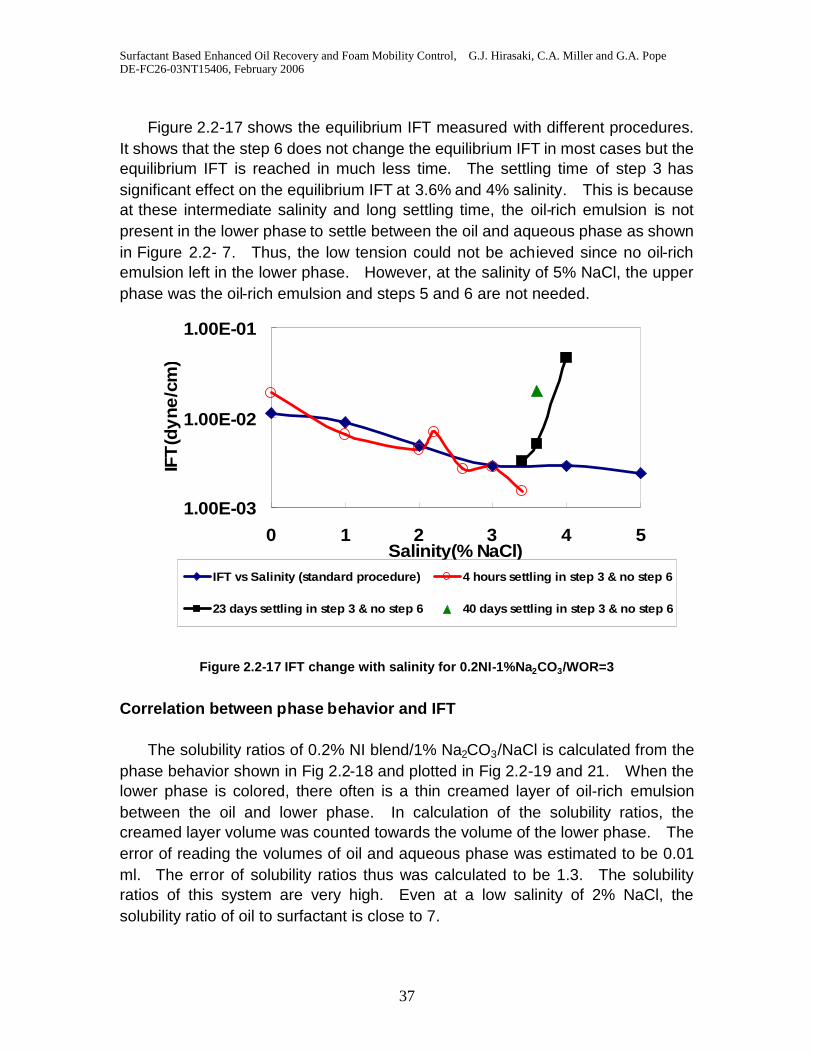
Figure 2.2-17 shows the equilibrium IFT measured with different procedures.It shows that the step 6 does not change the equilibrium IFT in most cases but theequilibrium IFT is reached in much less time. The settling time of step 3 hassignificant effect on the equilibrium IFT at 3.6% and 4% salinity. This is becauseat these intermediate salinity and long settling time, the oil-rich emulsion is notpresent in the lower phase to settle between the oil and aqueous phase as shownin Figure 2.2- 7. Thus, the low tension could not be achieved since no oil-richemulsion left in the lower phase. However, at the salinity of 5% NaCl, the upperphase was the oil-rich emulsion and steps 5 and 6 are not needed.
1.00E-03
1.00E-02
1.00E-01
0 1 2 3 4 5Salinity(% NaCl)
IFT
(dy
ne
/cm
)
IFT vs Salinity (standard procedure) 4 hours settling in step 3 & no step 6
23 days settling in step 3 & no step 6 40 days settling in step 3 & no step 6
Figure 2.2-17 IFT change with salinity for 0.2NI-1%Na2CO3/WOR=3
Correlation between phase behavior and IFT
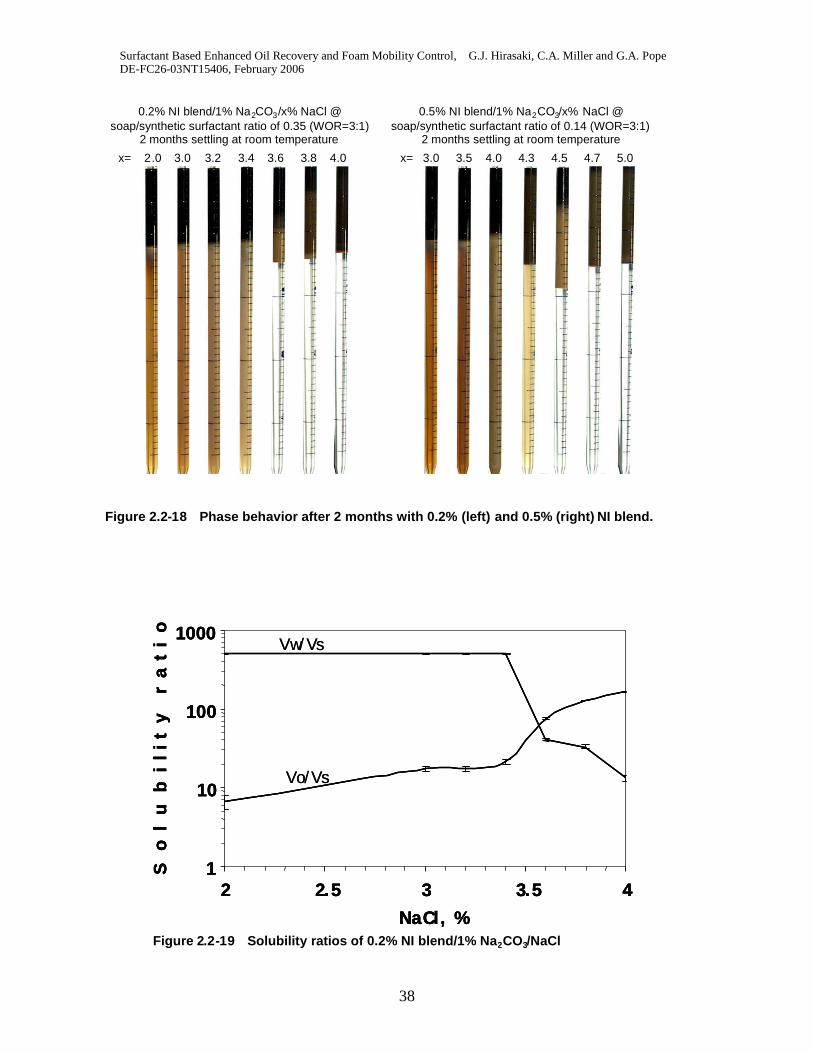
The solubility ratios of 0.2% NI blend/1% Na2CO3/NaCl is calculated from thephase behavior shown in Fig 2.2-18 and plotted in Fig 2.2-19 and 21. When thelower phase is colored, there often is a thin creamed layer of oil-rich emulsionbetween the oil and lower phase. In calculation of the solubility ratios, thecreamed layer volume was counted towards the volume of the lower phase. Theerror of reading the volumes of oil and aqueous phase was estimated to be 0.01ml. The error of solubility ratios thus was calculated to be 1.3. The solubilityratios of this system are very high. Even at a low salinity of 2% NaCl, thesolubility ratio of oil to surfactant is close to 7.
Surfactant Based Enhanced Oil Recovery and Foam Mobility Control, G.J. Hirasaki, C.A. Miller and G.A. PopeDE-FC26-03NT15406, February 2006
Figure 2.2-18 Phase behavior after 2 months with 0.2% (left) and 0.5% (right) NI blend.
1
10
100
1000
2 2.5 3 3.5 4
NaCl, %
So
lu
bi
lit
yr
at
io
Vw/ Vs
Vo/Vs
1
10
100
1000
2 2.5 3 3.5 4
NaCl, %
So
lu
bi
lit
yr
at
io
1
10
100
1000
2 2.5 3 3.5 4
NaCl, %
So
lu
bi
lit
yr
at
io
Vw/ Vs
Vo/Vs
x= 2.0 3.0 3.2 3.4 3.6 3.8 4.0
0.2% NI blend/1% Na2CO3/x% NaCl @soap/synthetic surfactant ratio of 0.35 (WOR=3:1)
2 months settling at room temperature
0.5% NI blend/1% Na2CO3/x% NaCl @soap/synthetic surfactant ratio of 0.14 (WOR=3:1)
2 months settling at room temperature
x= 3.0 3.5 4.0 4.3 4.5 4.7 5.0x= 2.0 3.0 3.2 3.4 3.6 3.8 4.0
0.2% NI blend/1% Na2CO3/x% NaCl @soap/synthetic surfactant ratio of 0.35 (WOR=3:1)
2 months settling at room temperature
0.5% NI blend/1% Na2CO3/x% NaCl @soap/synthetic surfactant ratio of 0.14 (WOR=3:1)
2 months settling at room temperature
x= 3.0 3.5 4.0 4.3 4.5 4.7 5.0
38
Figure 2.2-19 Solubility ratios of 0.2% NI blend/1% Na2CO3/NaCl
Surfactant Based Enhanced Oil Recovery and Foam Mobility Control, G.J. Hirasaki, C.A. Miller and G.A. PopeDE-FC26-03NT15406, February 2006
39
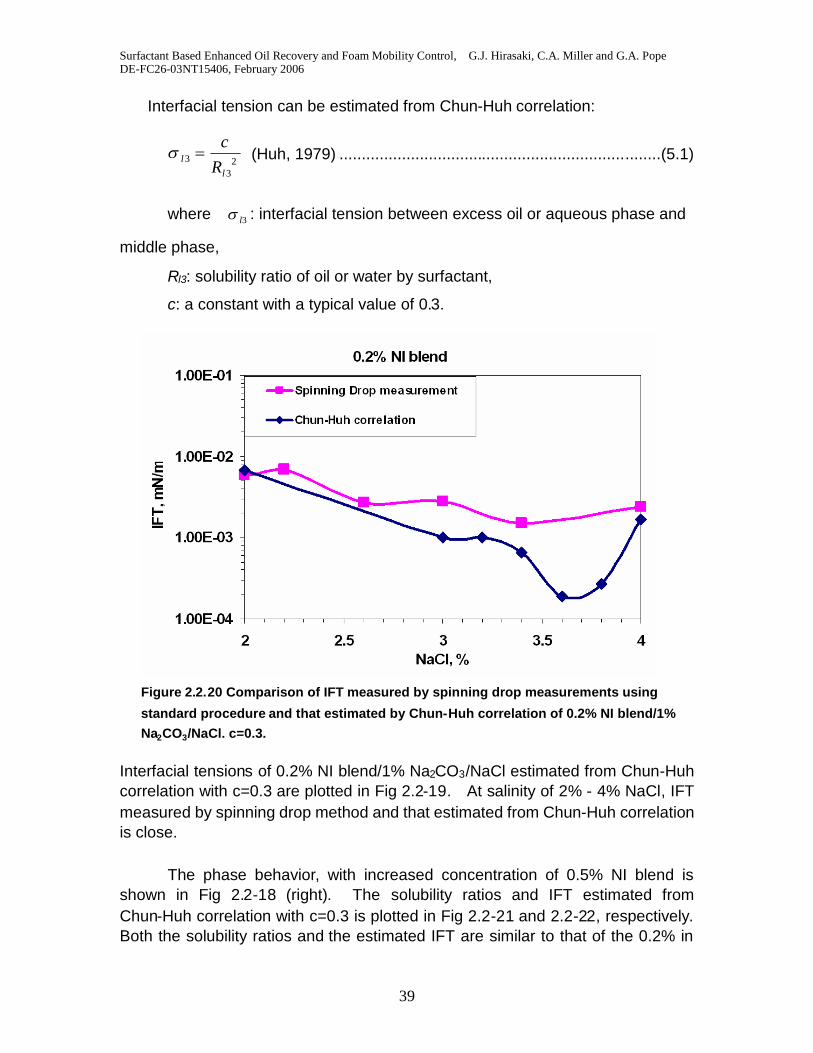
Interfacial tension can be estimated from Chun-Huh correlation:
23
3l
lR
c (Huh, 1979) ........................................................................(5.1)
where 3l : interfacial tension between excess oil or aqueous phase and
middle phase,
Rl3: solubility ratio of oil or water by surfactant,
c: a constant with a typical value of 0.3.
Interfacial tensions of 0.2% NI blend/1% Na2CO3/NaCl estimated from Chun-Huhcorrelation with c=0.3 are plotted in Fig 2.2-19. At salinity of 2% - 4% NaCl, IFTmeasured by spinning drop method and that estimated from Chun-Huh correlationis close.
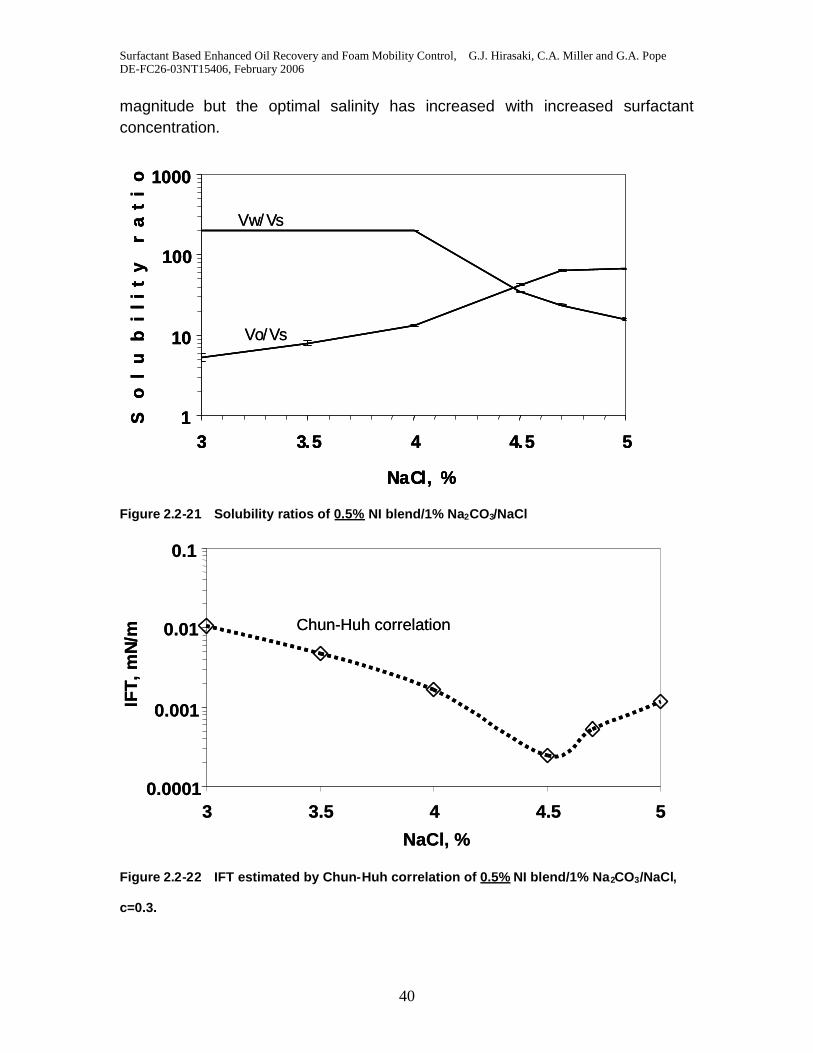
The phase behavior, with increased concentration of 0.5% NI blend isshown in Fig 2.2-18 (right). The solubility ratios and IFT estimated fromChun-Huh correlation with c=0.3 is plotted in Fig 2.2-21 and 2.2-22, respectively.Both the solubility ratios and the estimated IFT are similar to that of the 0.2% in
Figure 2.2.20 Comparison of IFT measured by spinning drop measurements using
standard procedure and that estimated by Chun-Huh correlation of 0.2% NI blend/1%Na2CO3/NaCl. c=0.3.
Surfactant Based Enhanced Oil Recovery and Foam Mobility Control, G.J. Hirasaki, C.A. Miller and G.A. PopeDE-FC26-03NT15406, February 2006
magnitude but the optimal salinity has increased with increased surfactantconcentration.
40
Figure 2.2-21 Solubility ratios of 0.5% NI blend/1% Na2CO3/NaCl
0.0001
0.001
0.01
0.1
3 3.5 4 4.5 5
NaCl, %
IFT,
mN
/m
Chun-Huh correlation
0.0001
0.001
0.01
0.1
3 3.5 4 4.5 5
NaCl, %
IFT,
mN
/m
Chun-Huh correlation
Figure 2.2-22 IFT estimated by Chun-Huh correlation of 0.5% NI blend/1% Na2CO3/NaCl,
c=0.3.
1
10
100
1000
3 3.5 4 4.5 5
NaCl, %
So
lu
bi
lit
yr
at
io
Vw/ Vs
Vo/Vs
1
10
100
1000
3 3.5 4 4.5 5
NaCl, %
So
lu
bi
lit
yr
at
io
1
10
100
1000
3 3.5 4 4.5 5
NaCl, %
So
lu
bi
lit
yr
at
io
Vw/ Vs
Vo/Vs
Surfactant Based Enhanced Oil Recovery and Foam Mobility Control, G.J. Hirasaki, C.A. Miller and G.A. PopeDE-FC26-03NT15406, February 2006
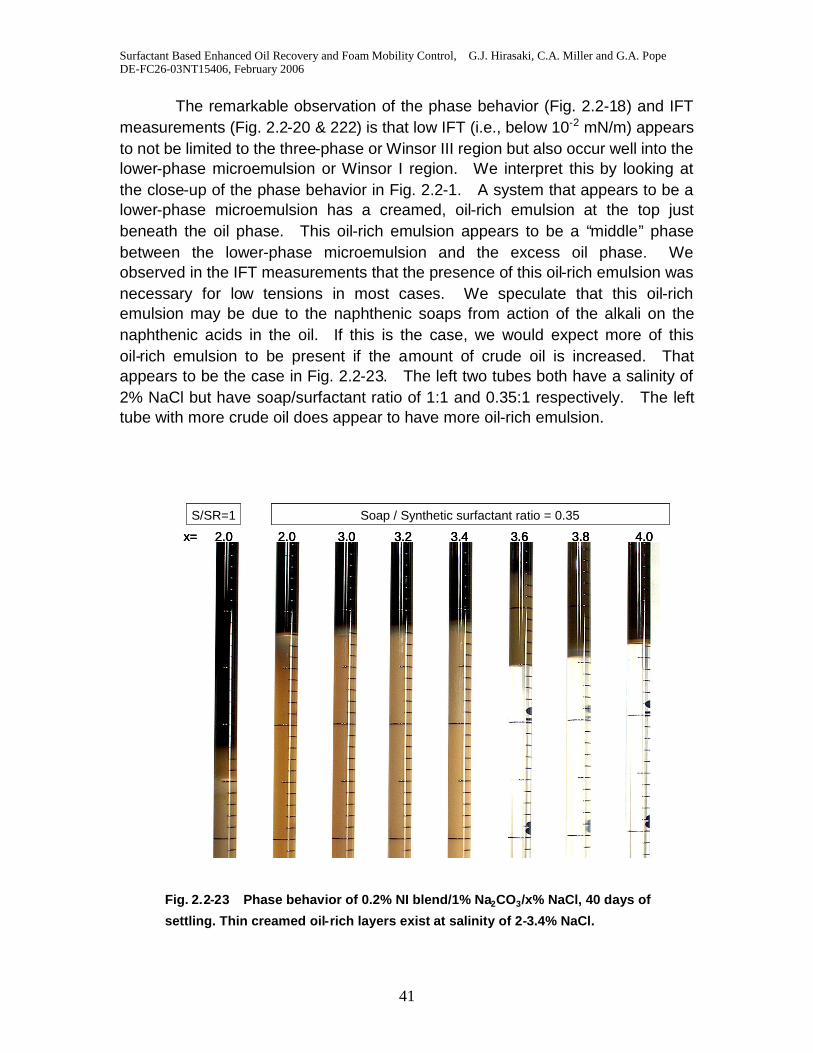
The remarkable observation of the phase behavior (Fig. 2.2-18) and IFTmeasurements (Fig. 2.2-20 & 222) is that low IFT (i.e., below 10-2 mN/m) appearsto not be limited to the three-phase or Winsor III region but also occur well into thelower-phase microemulsion or Winsor I region. We interpret this by looking atthe close-up of the phase behavior in Fig. 2.2-1. A system that appears to be alower-phase microemulsion has a creamed, oil-rich emulsion at the top justbeneath the oil phase. This oil-rich emulsion appears to be a “middle” phasebetween the lower-phase microemulsion and the excess oil phase. Weobserved in the IFT measurements that the presence of this oil-rich emulsion wasnecessary for low tensions in most cases. We speculate that this oil-richemulsion may be due to the naphthenic soaps from action of the alkali on thenaphthenic acids in the oil. If this is the case, we would expect more of thisoil-rich emulsion to be present if the amount of crude oil is increased. Thatappears to be the case in Fig. 2.2-23. The left two tubes both have a salinity of2% NaCl but have soap/surfactant ratio of 1:1 and 0.35:1 respectively. The lefttube with more crude oil does appear to have more oil-rich emulsion.
F
s
S/SR=1
x= 2.0 2.0 3.0 3.2 3.4 3.6 3.8 4.0
Soap / Synthetic surfactant ratio = 0.35S/SR=1
x= 2.0 2.0 3.0 3.2 3.4 3.6 3.8 4.0
Soap / Synthetic surfactant ratio = 0.35
x= 2.0 2.0 3.0 3.2 3.4 3.6 3.8 4.0
Soap / Synthetic surfactant ratio = 0.35
ig. 2.2-23 Phase behavior of 0.2% NI blend/1% Na2CO3/x% NaCl, 40 days of
41
ettling. Thin creamed oil-rich layers exist at salinity of 2-3.4% NaCl.
Surfactant Based Enhanced Oil Recovery and Foam Mobility Control, G.J. Hirasaki, C.A. Miller and G.A. PopeDE-FC26-03NT15406, February 2006
42
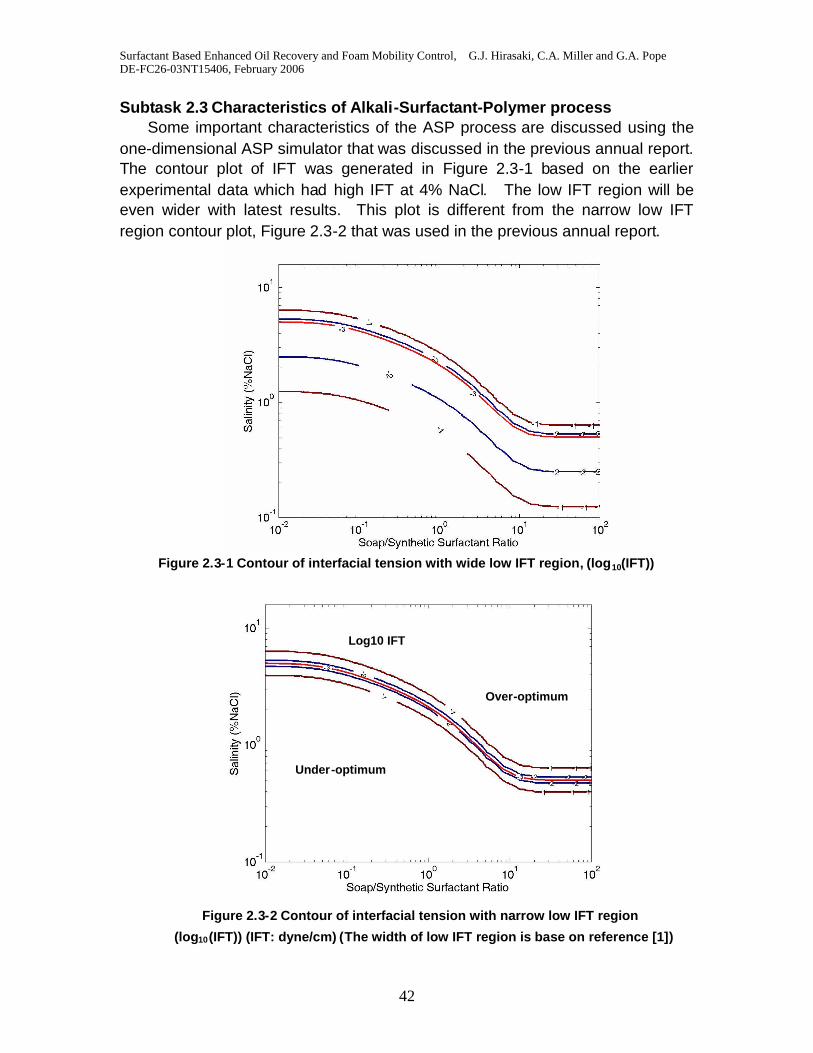
Subtask 2.3 Characteristics of Alkali-Surfactant-Polymer processSome important characteristics of the ASP process are discussed using the
one-dimensional ASP simulator that was discussed in the previous annual report.The contour plot of IFT was generated in Figure 2.3-1 based on the earlierexperimental data which had high IFT at 4% NaCl. The low IFT region will beeven wider with latest results. This plot is different from the narrow low IFTregion contour plot, Figure 2.3-2 that was used in the previous annual report.
Figure 2.3-1 Contour of interfacial tension with wide low IFT region, (log10(IFT))
Log10 IFT
Over-optimum
Under-optimum
Figure 2.3-2 Contour of interfacial tension with narrow low IFT region
(log10(IFT)) (IFT: dyne/cm) (The width of low IFT region is base on reference [1])
Surfactant Based Enhanced Oil Recovery and Foam Mobility Control, G.J. Hirasaki, C.A. Miller and G.A. PopeDE-FC26-03NT15406, February 2006
43
Initial Oil
Saturation
Formation
Brine
Acid No. of Crude oil Injecting Na2CO3
concentration
Injecting
Salinity
0.3 2.0% 0.2g KOH/g 1.0% 2.0% NaCl
Surfactant
concentration
Surfactant
Slug Size
Injecting Polymer
(flopaam3330S)
Injecting solution
viscosity:
Crude Oil
viscosity
0.5%(NI blend) 0.5 PV 5000ppm 40 cp 19.7 cp
Polymer
adsorption
Surfactant
Adsorption
NX (Grid block No.) dt/dx Peclet No
20 g/g 0.2mg/g 100 0.05 500
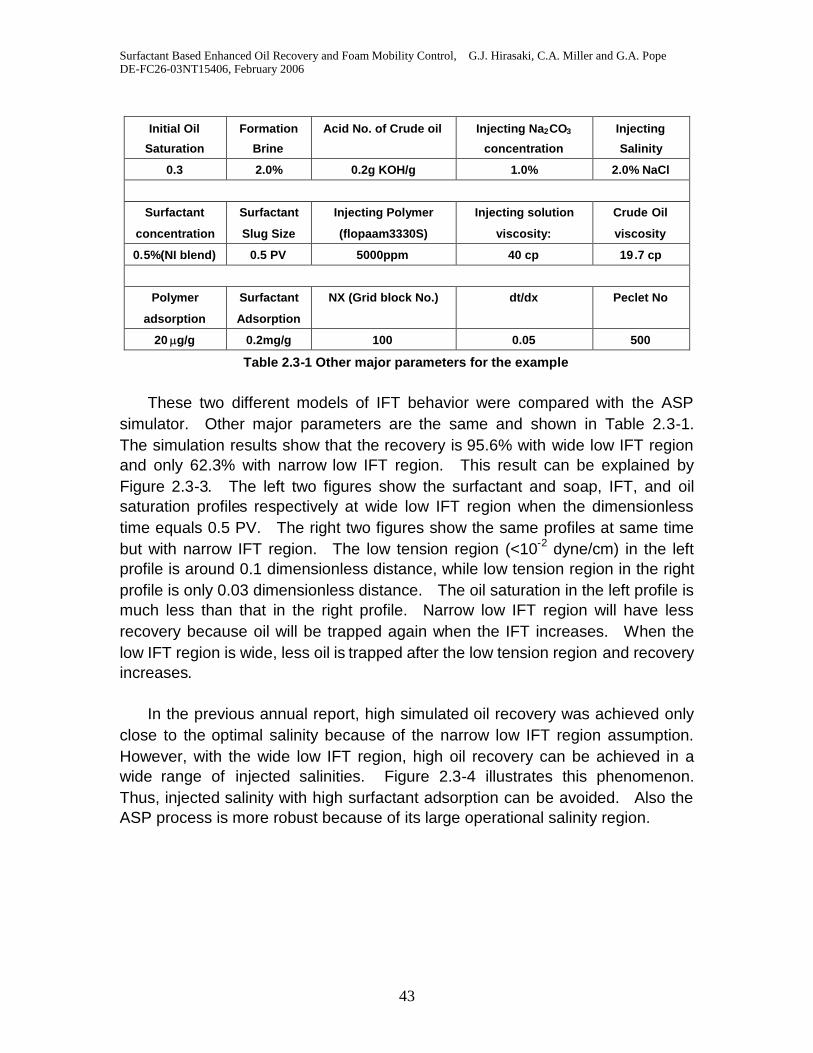
Table 2.3-1 Other major parameters for the example
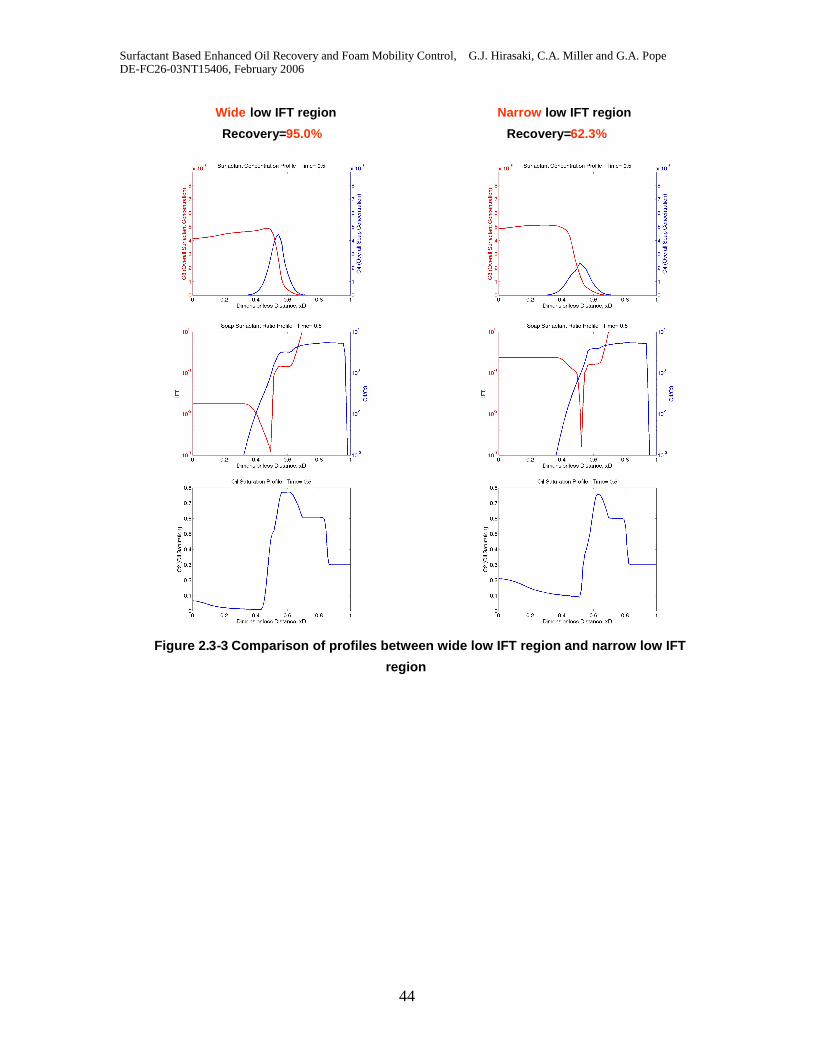
These two different models of IFT behavior were compared with the ASPsimulator. Other major parameters are the same and shown in Table 2.3-1.The simulation results show that the recovery is 95.6% with wide low IFT regionand only 62.3% with narrow low IFT region. This result can be explained byFigure 2.3-3. The left two figures show the surfactant and soap, IFT, and oilsaturation profiles respectively at wide low IFT region when the dimensionlesstime equals 0.5 PV. The right two figures show the same profiles at same timebut with narrow IFT region. The low tension region (<10-2 dyne/cm) in the leftprofile is around 0.1 dimensionless distance, while low tension region in the rightprofile is only 0.03 dimensionless distance. The oil saturation in the left profile ismuch less than that in the right profile. Narrow low IFT region will have lessrecovery because oil will be trapped again when the IFT increases. When thelow IFT region is wide, less oil is trapped after the low tension region and recoveryincreases.
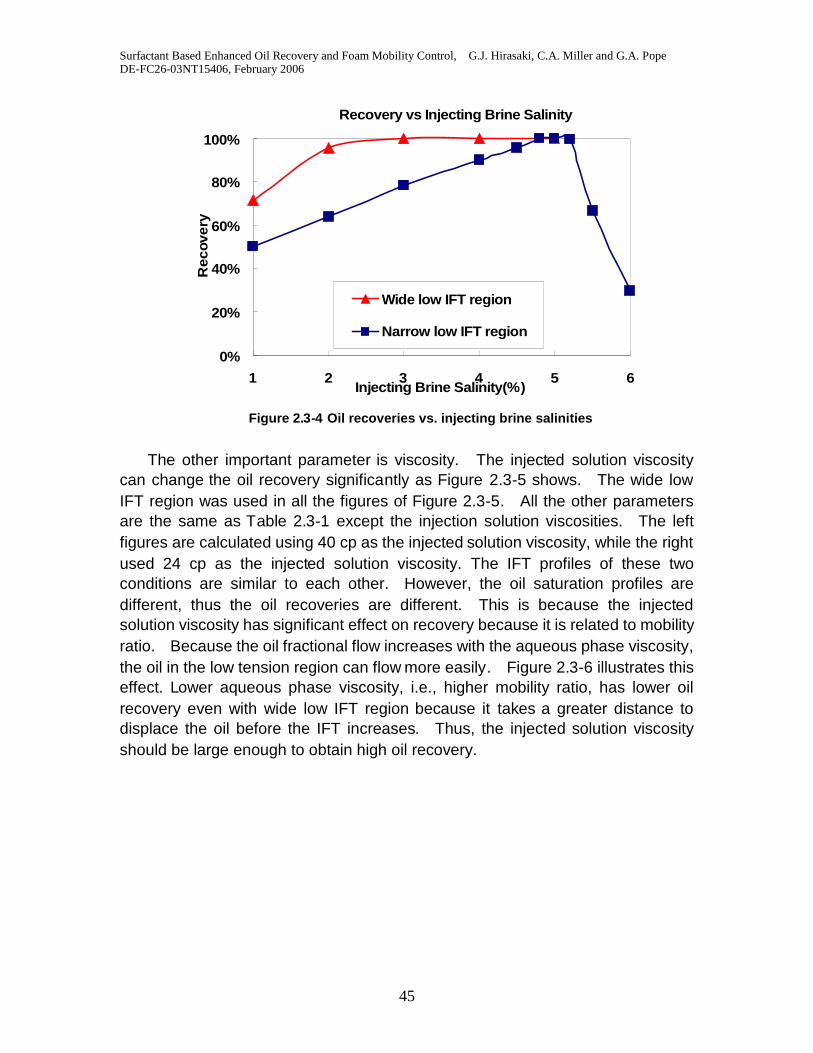
In the previous annual report, high simulated oil recovery was achieved onlyclose to the optimal salinity because of the narrow low IFT region assumption.However, with the wide low IFT region, high oil recovery can be achieved in awide range of injected salinities. Figure 2.3-4 illustrates this phenomenon.Thus, injected salinity with high surfactant adsorption can be avoided. Also theASP process is more robust because of its large operational salinity region.
Surfactant Based Enhanced Oil Recovery and Foam Mobility Control, G.J. Hirasaki, C.A. Miller and G.A. PopeDE-FC26-03NT15406, February 2006
44
Recovery=62.3%Recovery=95.0%
Narrow low IFT regionWide low IFT region
Figure 2.3-3 Comparison of profiles between wide low IFT region and narrow low IFT
region
Surfactant Based Enhanced Oil Recovery and Foam Mobility Control, G.J. Hirasaki, C.A. Miller and G.A. PopeDE-FC26-03NT15406, February 2006
45
Recovery vs Injecting Brine Salinity
0%
20%
40%
60%
80%
100%
1 2 3 4 5 6Injecting Brine Salinity(%)
Rec
over
y
Wide low IFT region
Narrow low IFT region
Figure 2.3-4 Oil recoveries vs. injecting brine salinities
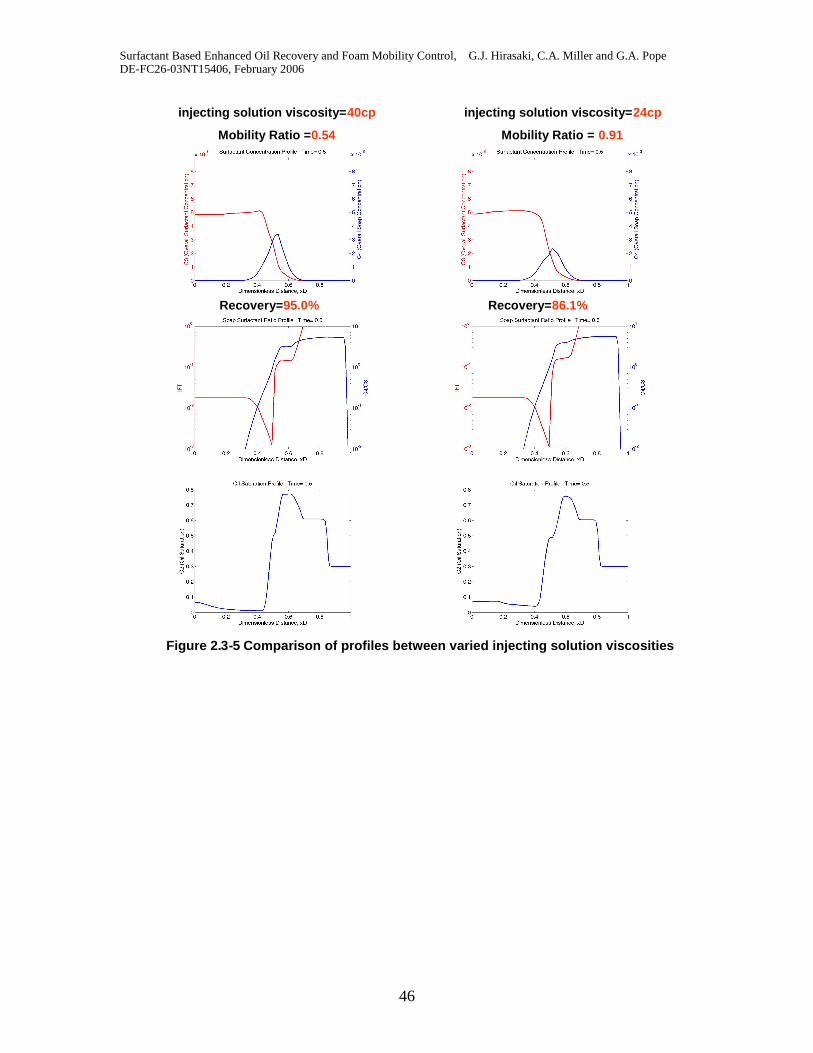
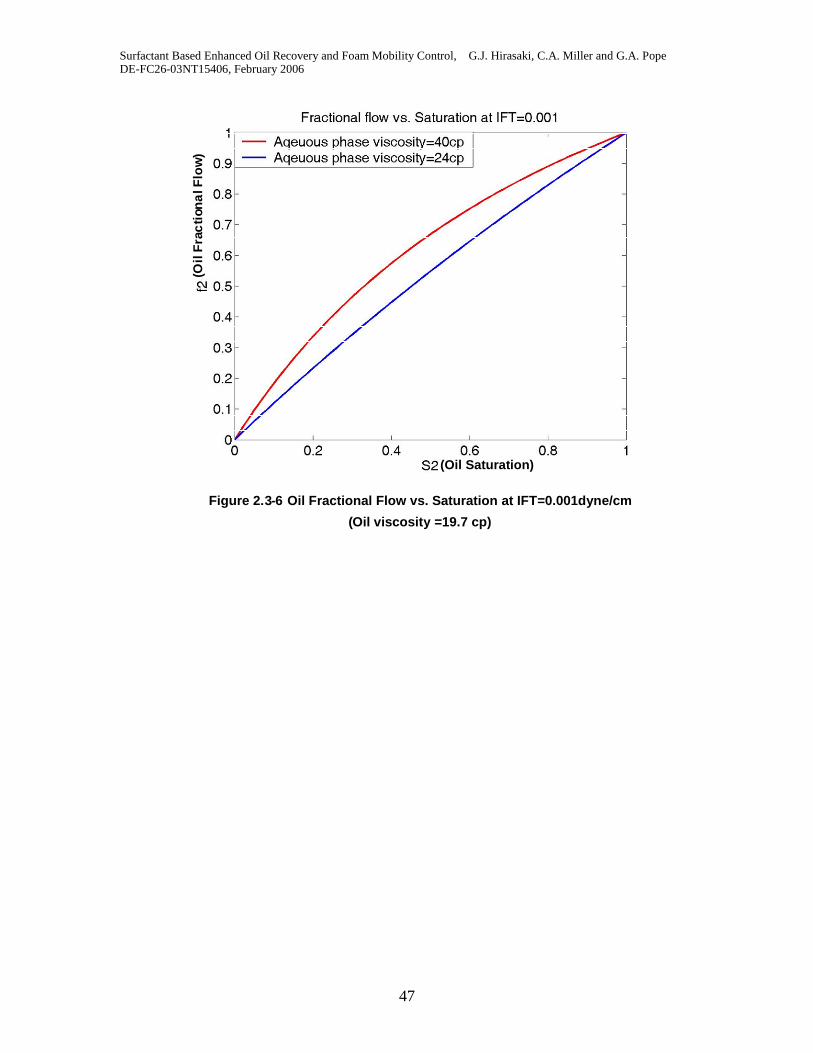
The other important parameter is viscosity. The injected solution viscositycan change the oil recovery significantly as Figure 2.3-5 shows. The wide lowIFT region was used in all the figures of Figure 2.3-5. All the other parametersare the same as Table 2.3-1 except the injection solution viscosities. The leftfigures are calculated using 40 cp as the injected solution viscosity, while the rightused 24 cp as the injected solution viscosity. The IFT profiles of these twoconditions are similar to each other. However, the oil saturation profiles aredifferent, thus the oil recoveries are different. This is because the injectedsolution viscosity has significant effect on recovery because it is related to mobilityratio. Because the oil fractional flow increases with the aqueous phase viscosity,the oil in the low tension region can flow more easily. Figure 2.3-6 illustrates thiseffect. Lower aqueous phase viscosity, i.e., higher mobility ratio, has lower oilrecovery even with wide low IFT region because it takes a greater distance todisplace the oil before the IFT increases. Thus, the injected solution viscosityshould be large enough to obtain high oil recovery.
Surfactant Based Enhanced Oil Recovery and Foam Mobility Control, G.J. Hirasaki, C.A. Miller and G.A. PopeDE-FC26-03NT15406, February 2006
46
injecting solution viscosity=24cp
Mobility Ratio = 0.91
injecting solution viscosity=40cp
Mobility Ratio =0.54
Recovery=86.1%Recovery=95.0%
Figure 2.3-5 Comparison of profiles between varied injecting solution viscosities
Surfactant Based Enhanced Oil Recovery and Foam Mobility Control, G.J. Hirasaki, C.A. Miller and G.A. PopeDE-FC26-03NT15406, February 2006
47
(Oil Saturation)
(Oil
Fra
cti
ona
lFlo
w)
Figure 2.3-6 Oil Fractional Flow vs. Saturation at IFT=0.001dyne/cm
(Oil viscosity =19.7 cp)
Surfactant Based Enhanced Oil Recovery and Foam Mobility Control, G.J. Hirasaki, C.A. Miller and G.A. PopeDE-FC26-03NT15406, February 2006
48
Subtask 2.4 Alkaline-Surfactant Polymer Forced Displacement
1. Dolomite sand pack
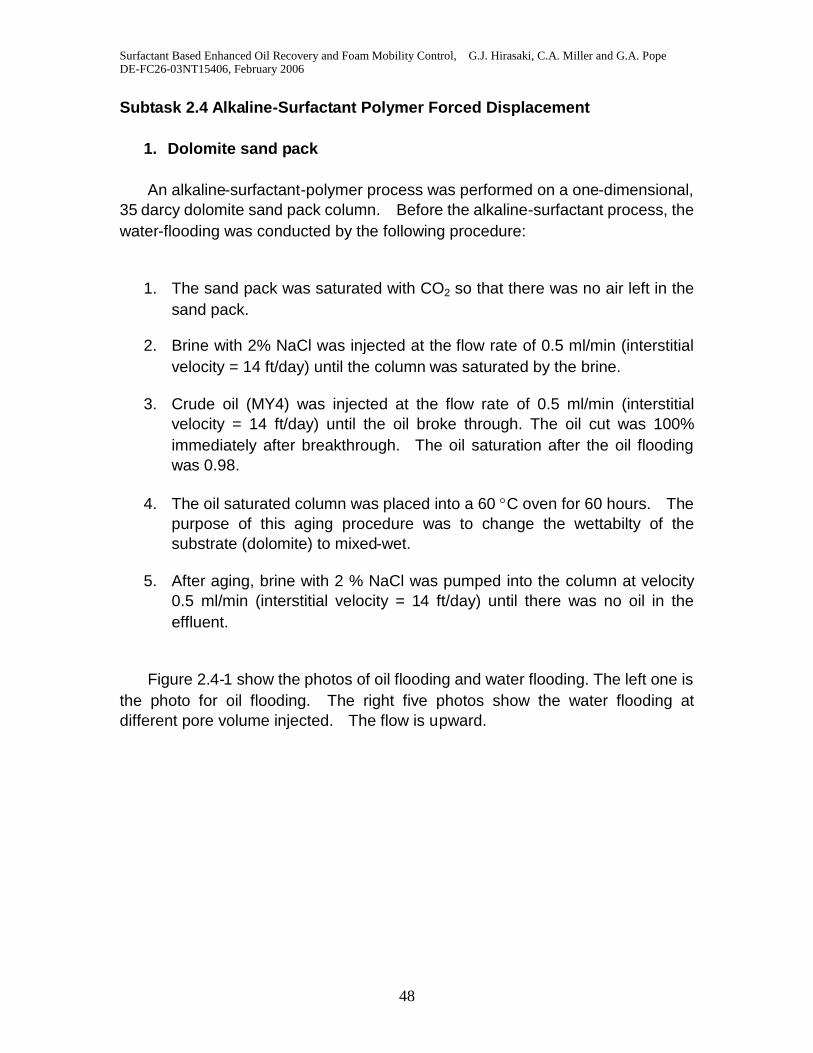
An alkaline-surfactant-polymer process was performed on a one-dimensional,35 darcy dolomite sand pack column. Before the alkaline-surfactant process, thewater-flooding was conducted by the following procedure:
1. The sand pack was saturated with CO2 so that there was no air left in thesand pack.
2. Brine with 2% NaCl was injected at the flow rate of 0.5 ml/min (interstitialvelocity = 14 ft/day) until the column was saturated by the brine.
3. Crude oil (MY4) was injected at the flow rate of 0.5 ml/min (interstitialvelocity = 14 ft/day) until the oil broke through. The oil cut was 100%immediately after breakthrough. The oil saturation after the oil floodingwas 0.98.
4. The oil saturated column was placed into a 60 C oven for 60 hours. Thepurpose of this aging procedure was to change the wettabilty of thesubstrate (dolomite) to mixed-wet.
5. After aging, brine with 2 % NaCl was pumped into the column at velocity0.5 ml/min (interstitial velocity = 14 ft/day) until there was no oil in theeffluent.
Figure 2.4-1 show the photos of oil flooding and water flooding. The left one isthe photo for oil flooding. The right five photos show the water flooding atdifferent pore volume injected. The flow is upward.
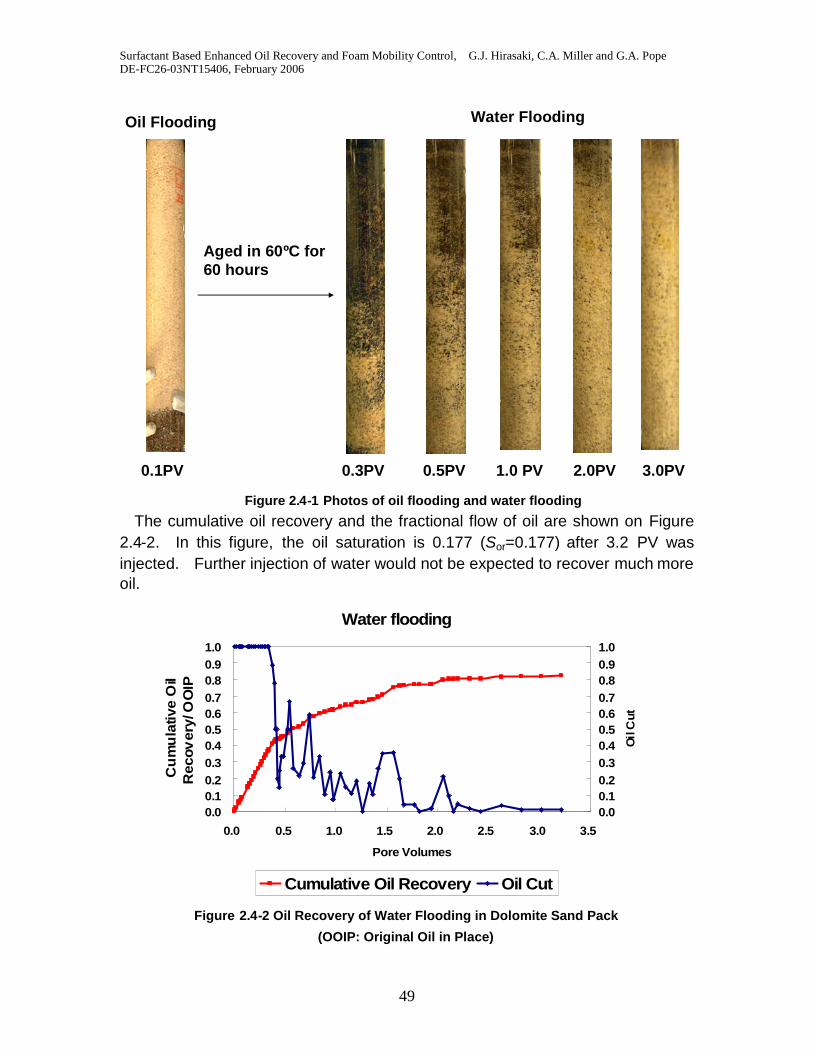
Surfactant Based Enhanced Oil Recovery and Foam Mobility Control, G.J. Hirasaki, C.A. Miller and G.A. PopeDE-FC26-03NT15406, February 2006
49
Oil Flooding Water Flooding
Aged in 60ºC for60 hours
0.1PV 0.3PV 0.5PV 1.0 PV 2.0PV 3.0PV
Figure 2.4-1 Photos of oil flooding and water flooding
The cumulative oil recovery and the fractional flow of oil are shown on Figure2.4-2. In this figure, the oil saturation is 0.177 (Sor=0.177) after 3.2 PV wasinjected. Further injection of water would not be expected to recover much moreoil.
Water flooding
0.00.10.20.30.40.50.60.70.80.91.0
0.0 0.5 1.0 1.5 2.0 2.5 3.0 3.5
Pore Volumes
Cu
mu
lativ
eO
ilR
ecov
ery/
OO
IP.
0.00.10.20.30.40.50.60.70.80.91.0
Oil
Cut
Cumulative Oil Recovery Oil Cut
Figure 2.4-2 Oil Recovery of Water Flooding in Dolomite Sand Pack
(OOIP: Original Oil in Place)
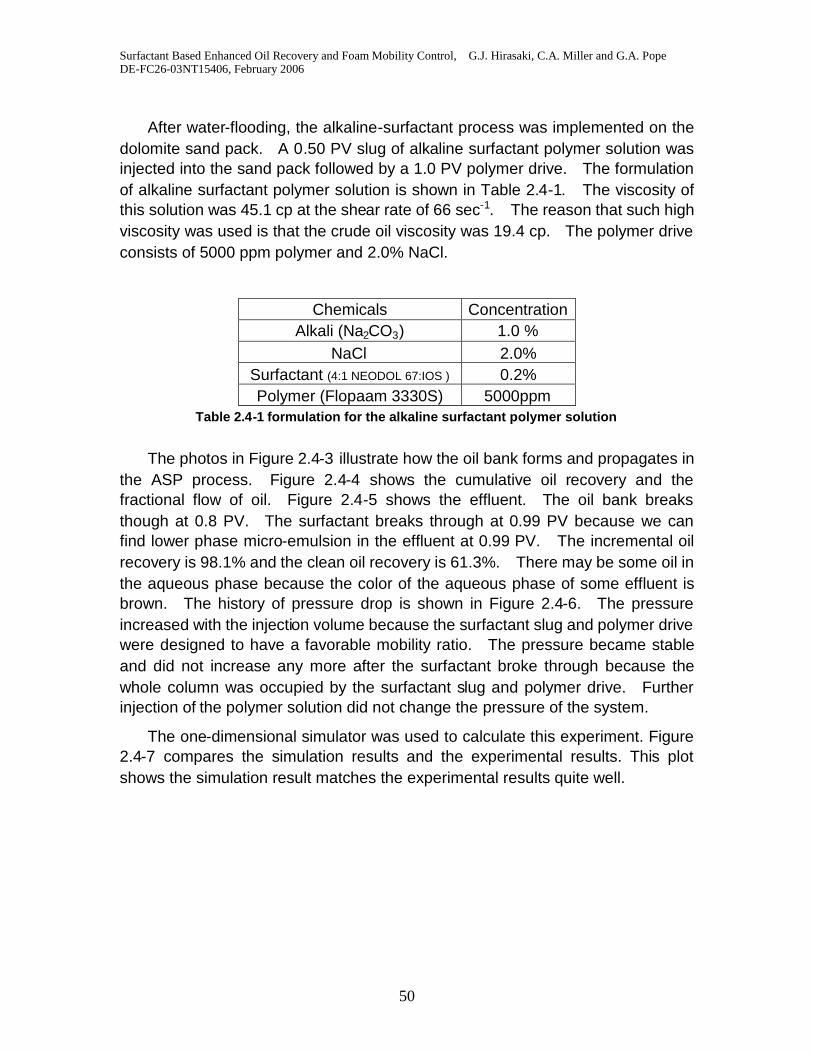
Surfactant Based Enhanced Oil Recovery and Foam Mobility Control, G.J. Hirasaki, C.A. Miller and G.A. PopeDE-FC26-03NT15406, February 2006
50
After water-flooding, the alkaline-surfactant process was implemented on thedolomite sand pack. A 0.50 PV slug of alkaline surfactant polymer solution wasinjected into the sand pack followed by a 1.0 PV polymer drive. The formulationof alkaline surfactant polymer solution is shown in Table 2.4-1. The viscosity ofthis solution was 45.1 cp at the shear rate of 66 sec-1. The reason that such highviscosity was used is that the crude oil viscosity was 19.4 cp. The polymer driveconsists of 5000 ppm polymer and 2.0% NaCl.
Chemicals ConcentrationAlkali (Na2CO3) 1.0 %
NaCl 2.0%Surfactant (4:1 NEODOL 67:IOS ) 0.2%Polymer (Flopaam 3330S) 5000ppm
Table 2.4-1 formulation for the alkaline surfactant polymer solution
The photos in Figure 2.4-3 illustrate how the oil bank forms and propagates inthe ASP process. Figure 2.4-4 shows the cumulative oil recovery and thefractional flow of oil. Figure 2.4-5 shows the effluent. The oil bank breaksthough at 0.8 PV. The surfactant breaks through at 0.99 PV because we canfind lower phase micro-emulsion in the effluent at 0.99 PV. The incremental oilrecovery is 98.1% and the clean oil recovery is 61.3%. There may be some oil inthe aqueous phase because the color of the aqueous phase of some effluent isbrown. The history of pressure drop is shown in Figure 2.4-6. The pressureincreased with the injection volume because the surfactant slug and polymer drivewere designed to have a favorable mobility ratio. The pressure became stableand did not increase any more after the surfactant broke through because thewhole column was occupied by the surfactant slug and polymer drive. Furtherinjection of the polymer solution did not change the pressure of the system.
The one-dimensional simulator was used to calculate this experiment. Figure2.4-7 compares the simulation results and the experimental results. This plotshows the simulation result matches the experimental results quite well.
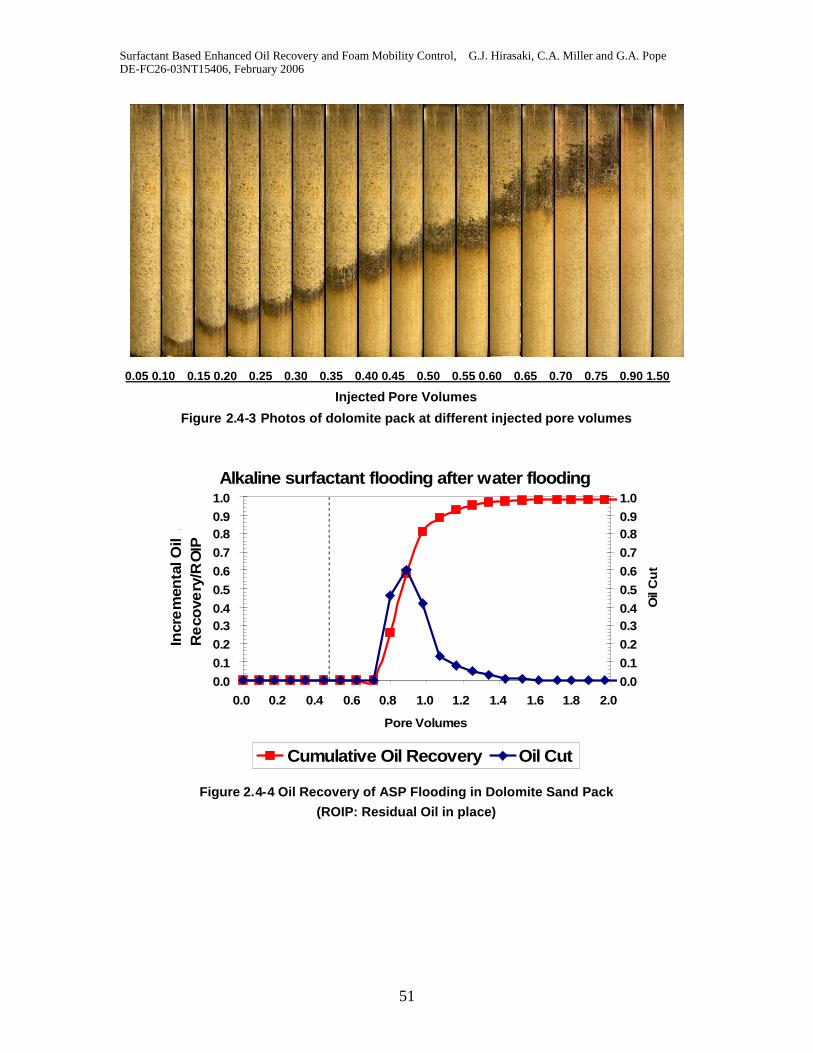
Surfactant Based Enhanced Oil Recovery and Foam Mobility Control, G.J. Hirasaki, C.A. Miller and G.A. PopeDE-FC26-03NT15406, February 2006
51
0.05 0.10 0.15 0.20 0.25 0.30 0.35 0.40 0.45 0.50 0.55 0.60 0.65 0.70 0.75 0.90 1.50
Injected Pore Volumes
Figure 2.4-3 Photos of dolomite pack at different injected pore volumes
Alkaline surfactant flooding after water flooding
0.00.10.20.30.40.50.60.70.80.91.0
0.0 0.2 0.4 0.6 0.8 1.0 1.2 1.4 1.6 1.8 2.0
Pore Volumes
Incr
em
enta
lOil
.R
eco
very
/RO
IP.
0.00.10.20.30.40.50.60.70.80.91.0
Oil
Cu
t
Cumulative Oil Recovery Oil Cut
Figure 2.4-4 Oil Recovery of ASP Flooding in Dolomite Sand Pack(ROIP: Residual Oil in place)
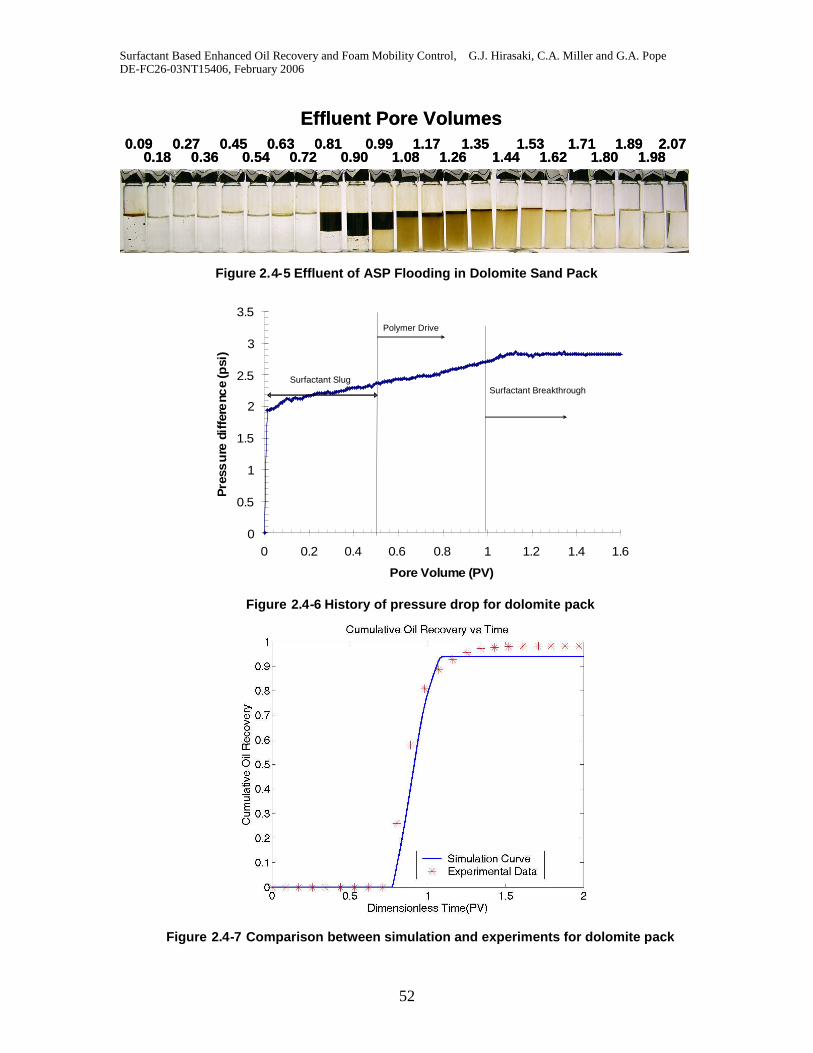
Surfactant Based Enhanced Oil Recovery and Foam Mobility Control, G.J. Hirasaki, C.A. Miller and G.A. PopeDE-FC26-03NT15406, February 2006
52
0.09 0.27 0.45 0.63 0.81 0.99 1.17 1.35 1.53 1.71 1.89 2.070.18 0.36 0.54 0.72 0.90 1.08 1.26 1.44 1.62 1.80 1.98
Effluent Pore Volumes0.09 0.27 0.45 0.63 0.81 0.99 1.17 1.35 1.53 1.71 1.89 2.07
0.18 0.36 0.54 0.72 0.90 1.08 1.26 1.44 1.62 1.80 1.98
Effluent Pore Volumes
Figure 2.4-5 Effluent of ASP Flooding in Dolomite Sand Pack
0
0.5
1
1.5
2
2.5
3
3.5
0 0.2 0.4 0.6 0.8 1 1.2 1.4 1.6
Pore Volume (PV)
Pre
ssu
redi
ffer
enc
e(p
si)
.
Surfactant Slug
Polymer Drive
Surfactant Breakthrough
Figure 2.4-6 History of pressure drop for dolomite pack
Figure 2.4-7 Comparison between simulation and experiments for dolomite pack
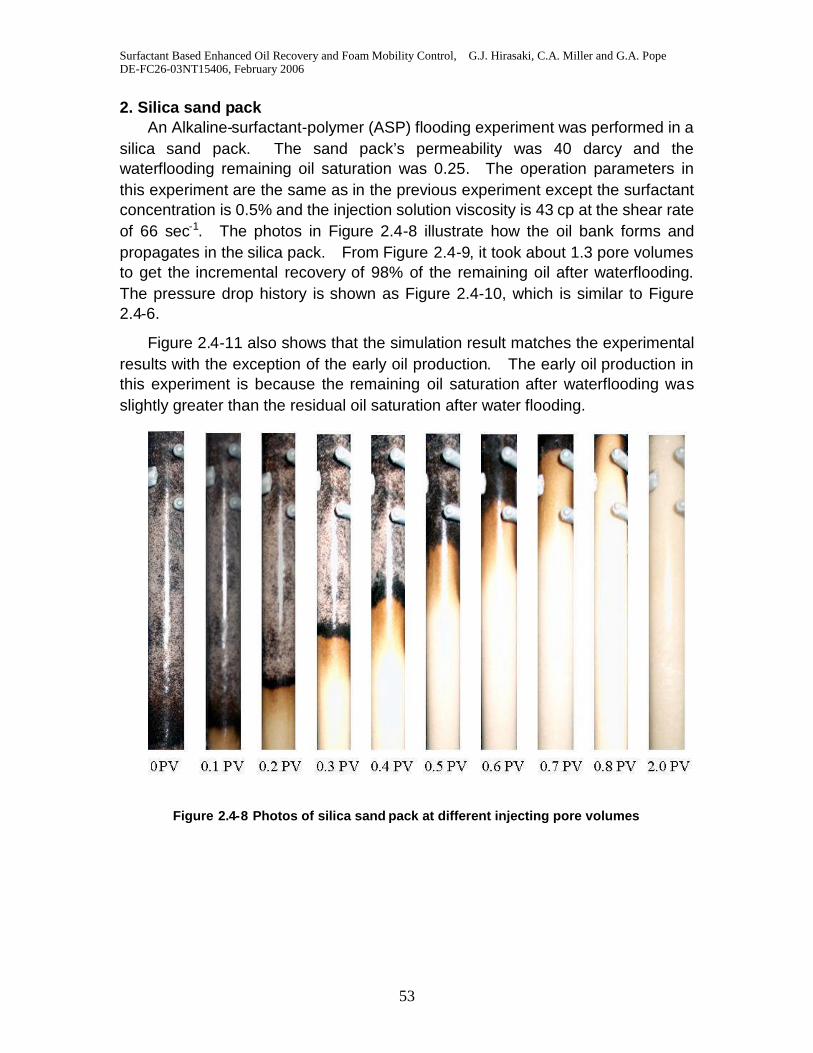
Surfactant Based Enhanced Oil Recovery and Foam Mobility Control, G.J. Hirasaki, C.A. Miller and G.A. PopeDE-FC26-03NT15406, February 2006
53
2. Silica sand packAn Alkaline-surfactant-polymer (ASP) flooding experiment was performed in a
silica sand pack. The sand pack’s permeability was 40 darcy and thewaterflooding remaining oil saturation was 0.25. The operation parameters inthis experiment are the same as in the previous experiment except the surfactantconcentration is 0.5% and the injection solution viscosity is 43 cp at the shear rateof 66 sec-1. The photos in Figure 2.4-8 illustrate how the oil bank forms andpropagates in the silica pack. From Figure 2.4-9, it took about 1.3 pore volumesto get the incremental recovery of 98% of the remaining oil after waterflooding.The pressure drop history is shown as Figure 2.4-10, which is similar to Figure2.4-6.
Figure 2.4-11 also shows that the simulation result matches the experimentalresults with the exception of the early oil production. The early oil production inthis experiment is because the remaining oil saturation after waterflooding wasslightly greater than the residual oil saturation after water flooding.
Figure 2.4-8 Photos of silica sand pack at different injecting pore volumes
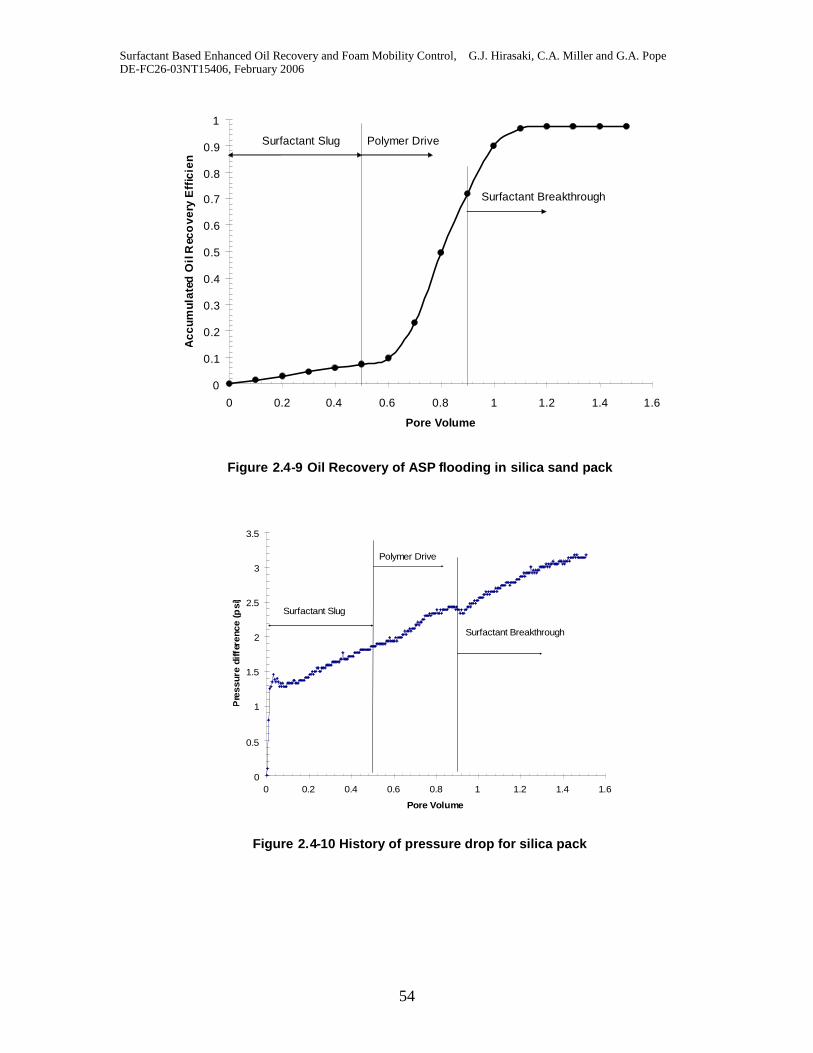
Surfactant Based Enhanced Oil Recovery and Foam Mobility Control, G.J. Hirasaki, C.A. Miller and G.A. PopeDE-FC26-03NT15406, February 2006
54
0
0.1
0.2
0.3
0.4
0.5
0.6
0.7
0.8
0.9
1
0 0.2 0.4 0.6 0.8 1 1.2 1.4 1.6
Pore Volume
Acc
umul
ated
Oil
Rec
ove
ryE
ffic
ienc
y Surfactant Slug Polymer Drive
Surfactant Breakthrough
Figure 2.4-9 Oil Recovery of ASP flooding in silica sand pack
0
0.5
1
1.5
2
2.5
3
3.5
0 0.2 0.4 0.6 0.8 1 1.2 1.4 1.6
Pore Volume
Pre
ssur
edi
ffer
ence
(psi
)
Surfactant Slug
Polymer Drive
Surfactant Breakthrough
Figure 2.4-10 History of pressure drop for silica pack
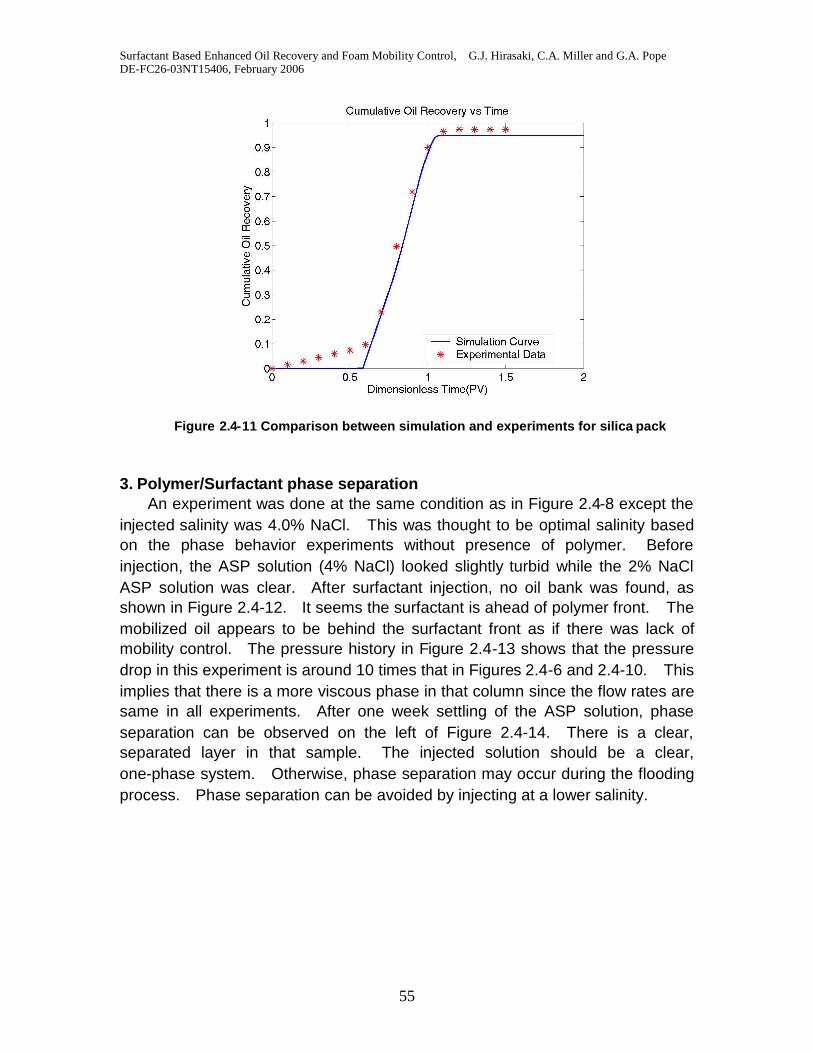
Surfactant Based Enhanced Oil Recovery and Foam Mobility Control, G.J. Hirasaki, C.A. Miller and G.A. PopeDE-FC26-03NT15406, February 2006
55
Figure 2.4-11 Comparison between simulation and experiments for silica pack
3. Polymer/Surfactant phase separationAn experiment was done at the same condition as in Figure 2.4-8 except the
injected salinity was 4.0% NaCl. This was thought to be optimal salinity basedon the phase behavior experiments without presence of polymer. Beforeinjection, the ASP solution (4% NaCl) looked slightly turbid while the 2% NaClASP solution was clear. After surfactant injection, no oil bank was found, asshown in Figure 2.4-12. It seems the surfactant is ahead of polymer front. Themobilized oil appears to be behind the surfactant front as if there was lack ofmobility control. The pressure history in Figure 2.4-13 shows that the pressuredrop in this experiment is around 10 times that in Figures 2.4-6 and 2.4-10. Thisimplies that there is a more viscous phase in that column since the flow rates aresame in all experiments. After one week settling of the ASP solution, phaseseparation can be observed on the left of Figure 2.4-14. There is a clear,separated layer in that sample. The injected solution should be a clear,one-phase system. Otherwise, phase separation may occur during the floodingprocess. Phase separation can be avoided by injecting at a lower salinity.
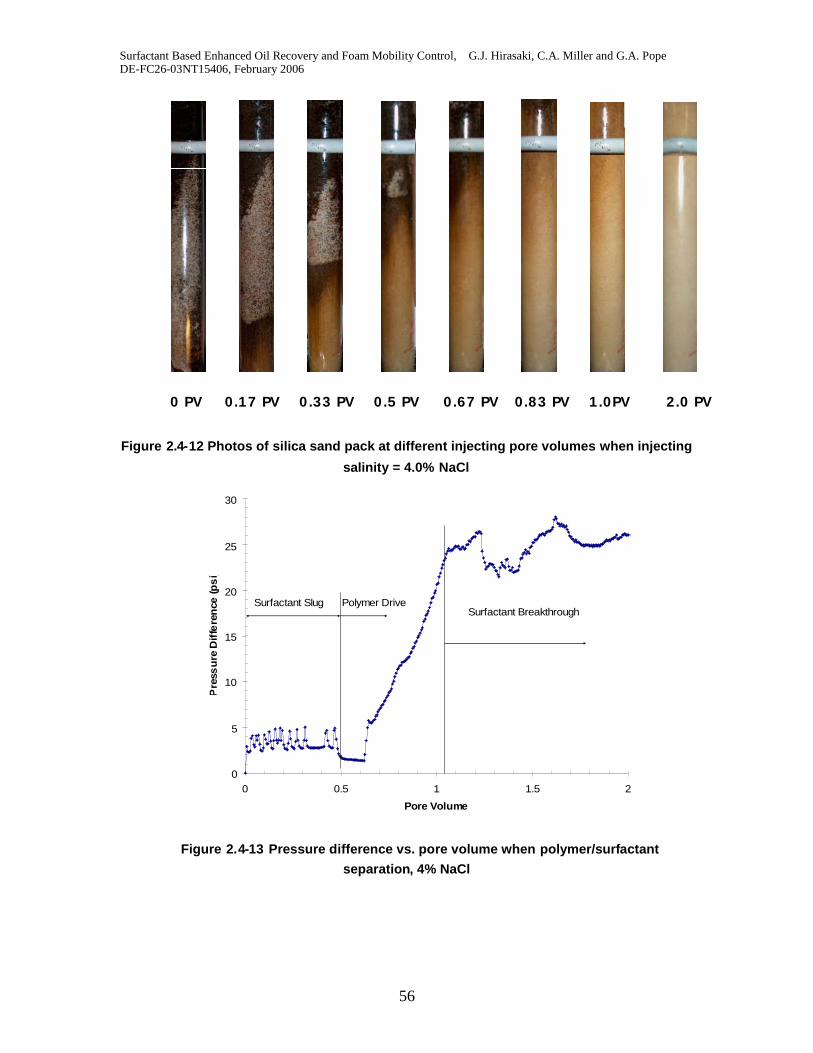
Surfactant Based Enhanced Oil Recovery and Foam Mobility Control, G.J. Hirasaki, C.A. Miller and G.A. PopeDE-FC26-03NT15406, February 2006
56
0 PV 0.17 PV 0.33 PV 0.5 PV 0.67 PV 0.83 PV 1.0PV 2.0 PV
Figure 2.4-12 Photos of silica sand pack at different injecting pore volumes when injecting
salinity = 4.0% NaCl
0
5
10
15
20
25
30
0 0.5 1 1.5 2
Pore Volume
Pre
ssu
reD
iffe
ren
ce(p
si)
Surfactant Slug Polymer DriveSurfactant Breakthrough
Figure 2.4-13 Pressure difference vs. pore volume when polymer/surfactantseparation, 4% NaCl
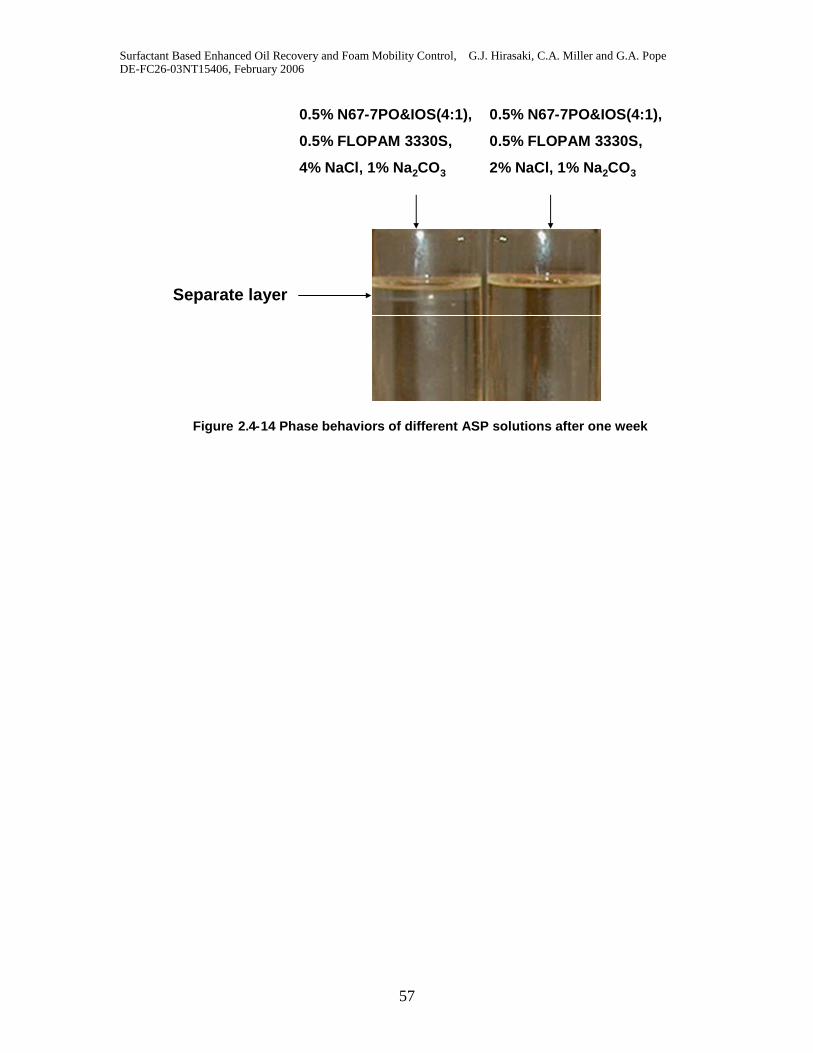
Surfactant Based Enhanced Oil Recovery and Foam Mobility Control, G.J. Hirasaki, C.A. Miller and G.A. PopeDE-FC26-03NT15406, February 2006
57
0.5% N67-7PO&IOS(4:1),
0.5% FLOPAM 3330S,
4% NaCl, 1% Na2CO3
0.5% N67-7PO&IOS(4:1),
0.5% FLOPAM 3330S,
2% NaCl, 1% Na2CO3
Separate layer
Figure 2.4-14 Phase behaviors of different ASP solutions after one week
Surfactant Based Enhanced Oil Recovery and Foam Mobility Control, G.J. Hirasaki, C.A. Miller and G.A. PopeDE-FC26-03NT15406, February 2006
58
Conclusions
1. The oil-rich emulsion plays an important role for low IFT in thealkali-surfactant system.
2. A spinning drop IFT measurement procedure was introduced foralkali-surfactant system which can quickly reach the equilibrium IFT.
3. The NI Blend-MY4-Na2CO3 system has a wider low IFT region than normallyseen for single surfactant systems. The width of the low IFT region is a keyfactor for recovery. Narrow low IFT region will have less recovery becauseoil will be trapped again when the IFT increases. When the low IFT region iswide enough, less oil will be trapped after the low tension region.
4. The injection solution viscosity has significant effect on recovery. Loweraqueous phase viscosity, i.e., higher mobility ratio, has lower oil recoveryeven with wide low IFT region. This is because the oil fractional flowincreases with the aqueous phase viscosity.
5. Experimental results show that the ASP process with only 0.2%, 0.5 PVsurfactant slug recovers 98% of the oil that is trapped after water-flooding.Good recoveries (>95%) were obtained in both dolomite and silica sandpacks.
6. The simulation matches the experimental data for both dolomite and silica.
7. High salinity can cause the phase separation of ASP solutions. This mayresult in loss of mobility control.
Surfactant Based Enhanced Oil Recovery and Foam Mobility Control, G.J. Hirasaki, C.A. Miller and G.A. PopeDE-FC26-03NT15406, February 2006
59
Task 3 Foam for Mobility Control
3.1 Bulk foam in fractures
In our previous work, we found the factors that can affect foam apparentviscosity in fractures when the foam bubble diameter is larger than the fractureaperture. Two mechanisms – liquid between bubbles and bubble deformation --were found to contribute to the foam apparent viscosity in this case. Predictionsof a theory modeling these two mechanisms fit experimental data. But when thefoam bubble diameter is significantly less than the aperture, bulk foam existsthroughout the fracture. Further experiments were performed and a differentmodel used for this case as discussed below.
Experimental technique
The fracture model shown in Fig. 3.1-1 has been described in previousreports. It mainly consists of two parallel plates. Changing the gasket thicknessbetween the plates can change the aperture of the fracture. The set-up diagramof the equipment for the foam experiments is shown in Fig. 3.1-2. A Harvardsyringe infusion pump (Model 22) is used to inject surfactant solution, and aMatheson mass flow controller (Model 8270) is used to inject air into the foamgenerator. Relatively uniform size bubbles can be generated only when the airand liquid are introduced on opposite sides of the frit in the foam generator.Choosing frits with different pore size can generate different sizes of bubbles.Two grooves were made along the inlet and outlet of the fracture model toensure a uniform pressure at the inlet and outlet.
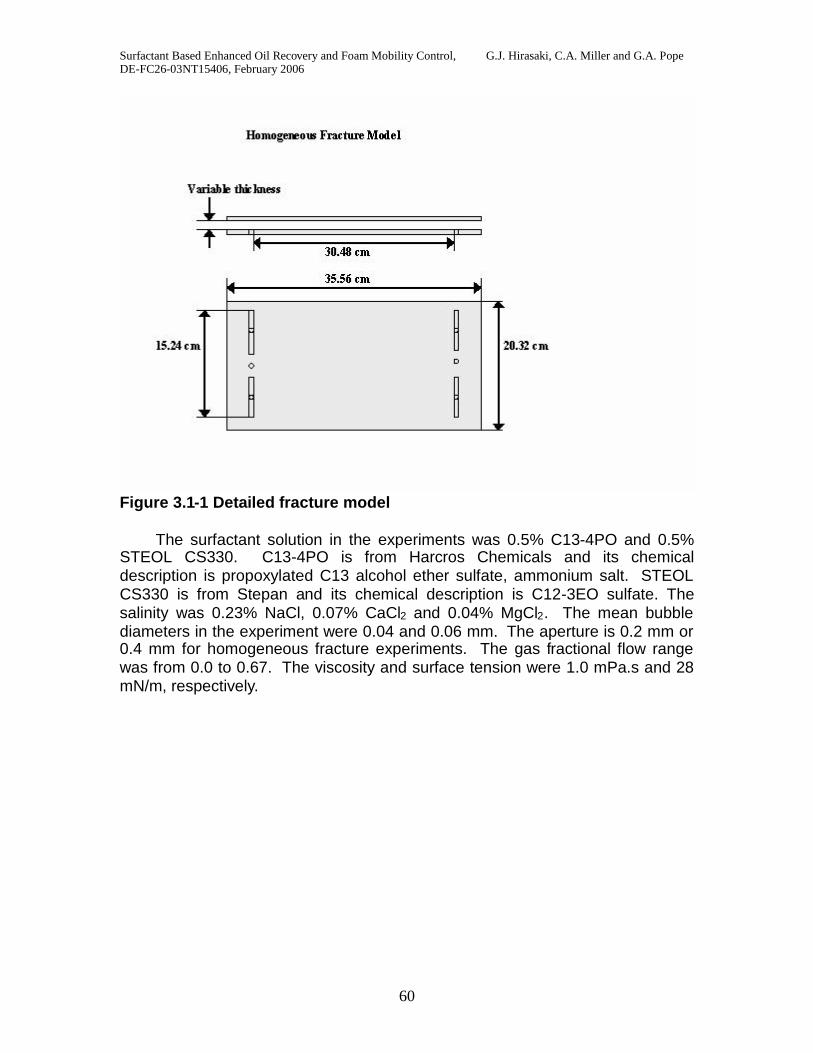
Surfactant Based Enhanced Oil Recovery and Foam Mobility Control, G.J. Hirasaki, C.A. Miller and G.A. PopeDE-FC26-03NT15406, February 2006
60
Figure 3.1-1 Detailed fracture model
The surfactant solution in the experiments was 0.5% C13-4PO and 0.5%STEOL CS330. C13-4PO is from Harcros Chemicals and its chemicaldescription is propoxylated C13 alcohol ether sulfate, ammonium salt. STEOLCS330 is from Stepan and its chemical description is C12-3EO sulfate. Thesalinity was 0.23% NaCl, 0.07% CaCl2 and 0.04% MgCl2. The mean bubblediameters in the experiment were 0.04 and 0.06 mm. The aperture is 0.2 mm or0.4 mm for homogeneous fracture experiments. The gas fractional flow rangewas from 0.0 to 0.67. The viscosity and surface tension were 1.0 mPa.s and 28mN/m, respectively.
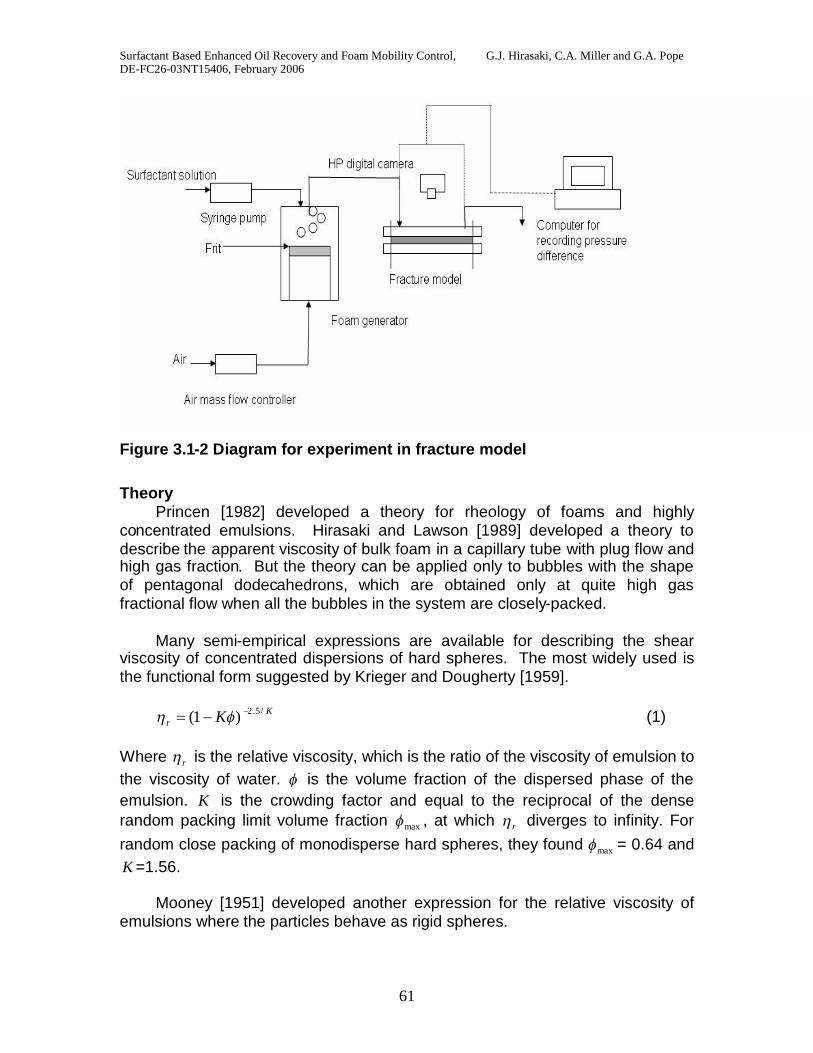
Surfactant Based Enhanced Oil Recovery and Foam Mobility Control, G.J. Hirasaki, C.A. Miller and G.A. PopeDE-FC26-03NT15406, February 2006
61
Figure 3.1-2 Diagram for experiment in fracture model
TheoryPrincen [1982] developed a theory for rheology of foams and highly
concentrated emulsions. Hirasaki and Lawson [1989] developed a theory todescribe the apparent viscosity of bulk foam in a capillary tube with plug flow andhigh gas fraction. But the theory can be applied only to bubbles with the shapeof pentagonal dodecahedrons, which are obtained only at quite high gasfractional flow when all the bubbles in the system are closely-packed.
Many semi-empirical expressions are available for describing the shearviscosity of concentrated dispersions of hard spheres. The most widely used isthe functional form suggested by Krieger and Dougherty [1959].
Kr K /5.2)1( (1)
Where r is the relative viscosity, which is the ratio of the viscosity of emulsion tothe viscosity of water. is the volume fraction of the dispersed phase of theemulsion. K is the crowding factor and equal to the reciprocal of the denserandom packing limit volume fraction max , at which r diverges to infinity. Forrandom close packing of monodisperse hard spheres, they found max = 0.64 andK =1.56.
Mooney [1951] developed another expression for the relative viscosity ofemulsions where the particles behave as rigid spheres.
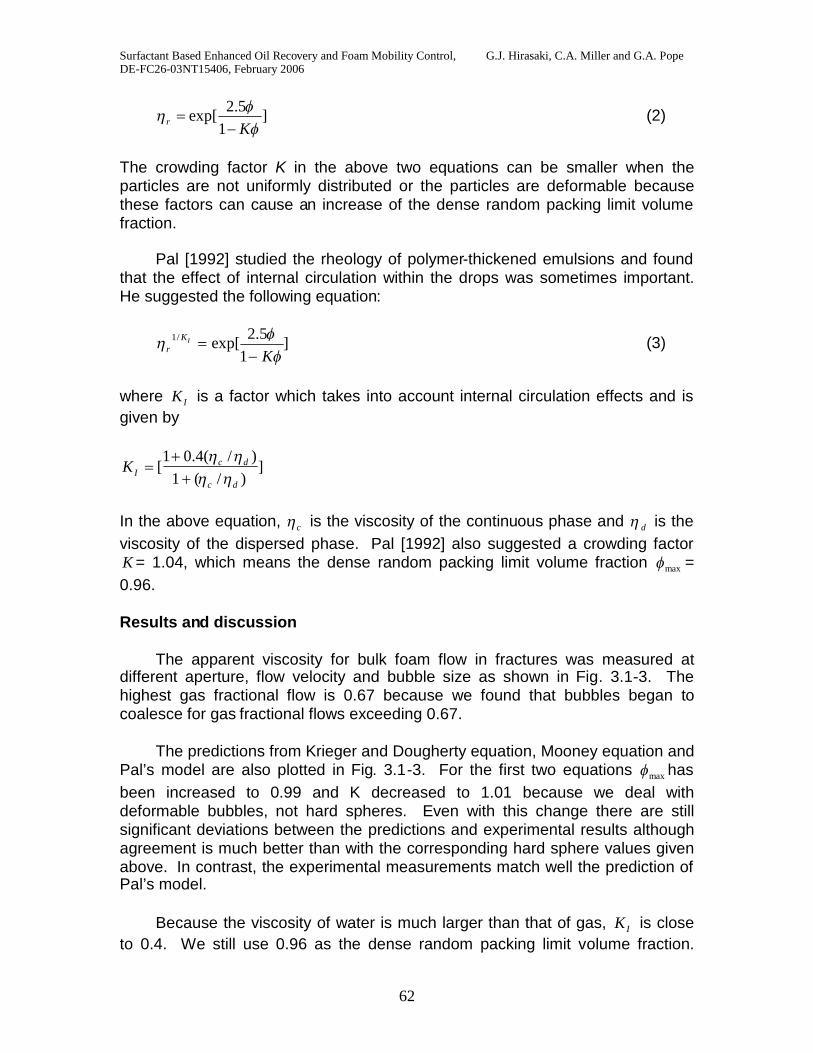
Surfactant Based Enhanced Oil Recovery and Foam Mobility Control, G.J. Hirasaki, C.A. Miller and G.A. PopeDE-FC26-03NT15406, February 2006
62
]1
5.2exp[
Kr (2)
The crowding factor K in the above two equations can be smaller when theparticles are not uniformly distributed or the particles are deformable becausethese factors can cause an increase of the dense random packing limit volumefraction.
Pal [1992] studied the rheology of polymer-thickened emulsions and foundthat the effect of internal circulation within the drops was sometimes important.He suggested the following equation:
]1
5.2exp[/1
K
IKr
(3)
where IK is a factor which takes into account internal circulation effects and isgiven by
])/(1
)/(4.01[
dc
dcIK
In the above equation, c is the viscosity of the continuous phase and d is theviscosity of the dispersed phase. Pal [1992] also suggested a crowding factorK = 1.04, which means the dense random packing limit volume fraction max =0.96.
Results and discussion
The apparent viscosity for bulk foam flow in fractures was measured atdifferent aperture, flow velocity and bubble size as shown in Fig. 3.1-3. Thehighest gas fractional flow is 0.67 because we found that bubbles began tocoalesce for gas fractional flows exceeding 0.67.
The predictions from Krieger and Dougherty equation, Mooney equation andPal’s model are also plotted in Fig. 3.1-3. For the first two equations max hasbeen increased to 0.99 and K decreased to 1.01 because we deal withdeformable bubbles, not hard spheres. Even with this change there are stillsignificant deviations between the predictions and experimental results althoughagreement is much better than with the corresponding hard sphere values givenabove. In contrast, the experimental measurements match well the prediction ofPal’s model.
Because the viscosity of water is much larger than that of gas, IK is closeto 0.4. We still use 0.96 as the dense random packing limit volume fraction.
Surfactant Based Enhanced Oil Recovery and Foam Mobility Control, G.J. Hirasaki, C.A. Miller and G.A. PopeDE-FC26-03NT15406, February 2006
63
Then the crowding factor K is 1.04. Because the viscosity of the dispersedphase is small in the foam case, internal circulation doesn't contributesignificantly to the viscosity. .
0.5% C13-4PO & 0.5% CS3300.23% NaCl, 0.07% CaCl2, 0.04% MgCl2,
1
10
100
1000
0 0.2 0.4 0.6 0.8 1
Gas fractional flow
Ap
pare
ntvi
scos
ity(c
p)
u = 20 cm/min, aperture = 0.2mm, DB = 0.04mm
u = 40 cm/min, aperture = 0.2mm, DB = 0.04mm
u = 26 cm/min, aperture = 0.3mm, DB = 0.04mm
u = 26 cm/min, aperture = 0.3mm, DB = 0.06mm
u = 52 cm/min, aperture = 0.3mm, DB = 0.06mm
Pal equation
Mooney equation
Krieger and Dougherty equation
Bubble Coalescence
Figure 3.1-3 Bulk foam apparent viscosity in fractures; measurement andprediction. K=1.01 for Mooney and Krieger and Dougherty equations.
3.2 Foam drive for ASP process
In normal alkaline/surfactant/polymer process, polymer is used as mobilitycontrol agent to be injected together with surfactant and also as drive. Howeverpolymer is expensive. We investigated the possibility of using foam to replacepolymer as drive.
The experiment was performed in a horizontal one-dimensional 1-foot longsand pack. The sand pack’s permeability is 40 darcy. It was presaturated with apolymer/surfactant solution (the same as in the ASP flood of Section 3.1 below)to simulate a situation when residual crude oil saturation was zero behind thesurfactant/polymer slug. The polymer in this slug is 0.5% FLOPAM 3330S. Thesurfactant is 0.5% N67-7PO:IOS15-18 (4:1). The salinity is 2% NaCl and 1%Na2CO3. By measurement, the viscosity of the polymer/surfactant solution is43cp at 24C and shear rate 66s-1.
The experiment was performed at constant pressure drop between 4.0 and4.5psi. The foam was generated in the sand pack by co-injection of surfactant
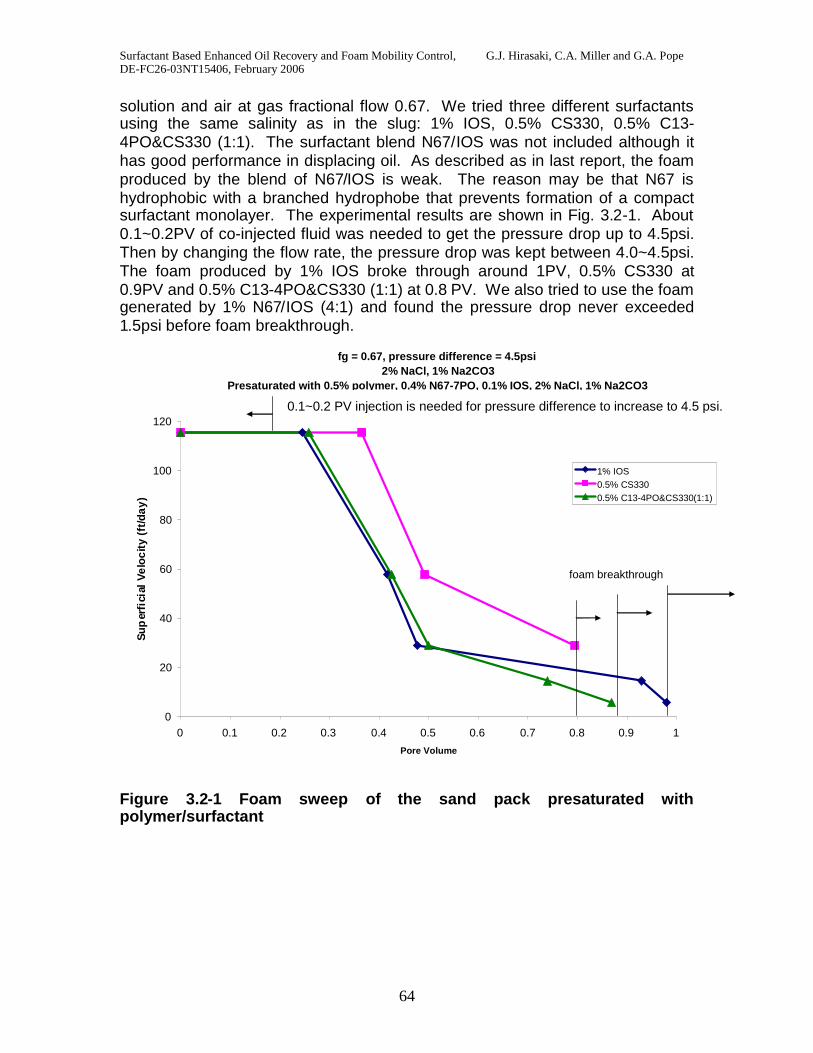
Surfactant Based Enhanced Oil Recovery and Foam Mobility Control, G.J. Hirasaki, C.A. Miller and G.A. PopeDE-FC26-03NT15406, February 2006
64
solution and air at gas fractional flow 0.67. We tried three different surfactantsusing the same salinity as in the slug: 1% IOS, 0.5% CS330, 0.5% C13-4PO&CS330 (1:1). The surfactant blend N67/IOS was not included although ithas good performance in displacing oil. As described as in last report, the foamproduced by the blend of N67/IOS is weak. The reason may be that N67 ishydrophobic with a branched hydrophobe that prevents formation of a compactsurfactant monolayer. The experimental results are shown in Fig. 3.2-1. About0.1~0.2PV of co-injected fluid was needed to get the pressure drop up to 4.5psi.Then by changing the flow rate, the pressure drop was kept between 4.0~4.5psi.The foam produced by 1% IOS broke through around 1PV, 0.5% CS330 at0.9PV and 0.5% C13-4PO&CS330 (1:1) at 0.8 PV. We also tried to use the foamgenerated by 1% N67/IOS (4:1) and found the pressure drop never exceeded1.5psi before foam breakthrough.
Figure 3.2-1 Foam sweep of the sand pack presaturated withpolymer/surfactant
fg = 0.67, pressure difference = 4.5psi2% NaCl, 1% Na2CO3
Presaturated with 0.5% polymer, 0.4% N67-7PO, 0.1% IOS, 2% NaCl, 1% Na2CO3
0
20
40
60
80
100
120
0 0.1 0.2 0.3 0.4 0.5 0.6 0.7 0.8 0.9 1
Pore Volume
Sup
erfi
cial
Velo
city
(ft/d
ay)
1% IOS0.5% CS3300.5% C13-4PO&CS330(1:1)
foam breakthrough
0.1~0.2 PV injection is needed for pressure difference to increase to 4.5 psi.
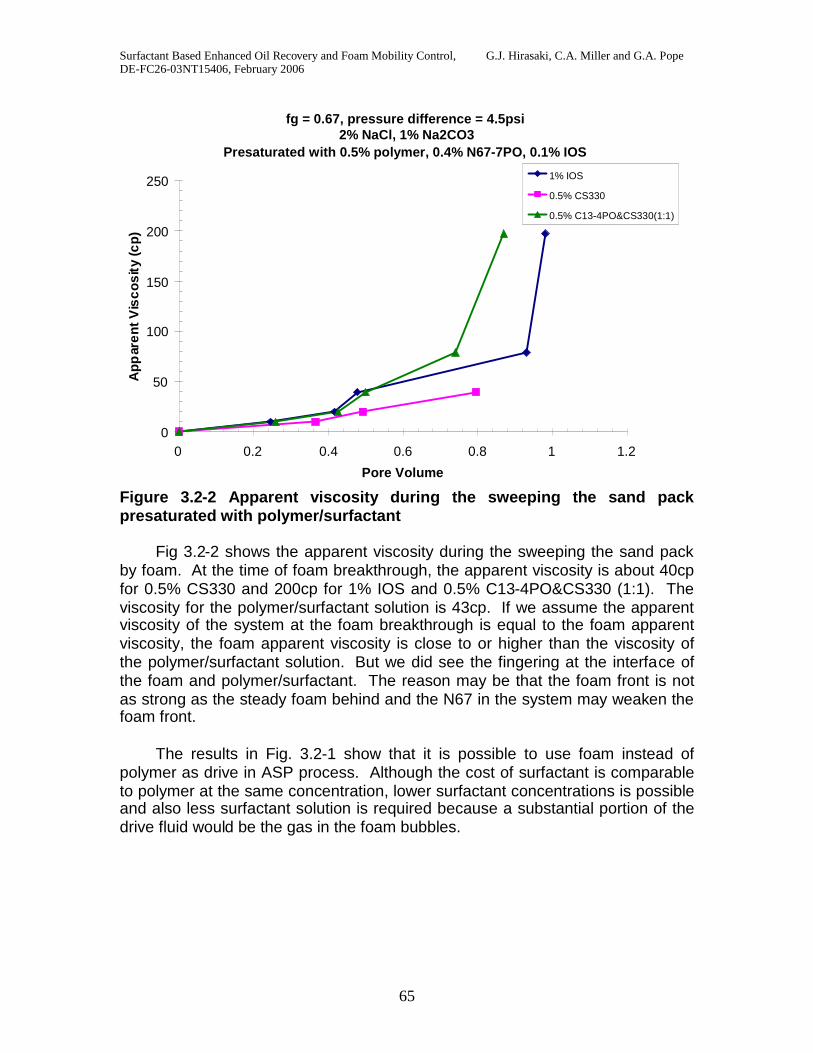
Surfactant Based Enhanced Oil Recovery and Foam Mobility Control, G.J. Hirasaki, C.A. Miller and G.A. PopeDE-FC26-03NT15406, February 2006
65
fg = 0.67, pressure difference = 4.5psi2% NaCl, 1% Na2CO3
Presaturated with 0.5% polymer, 0.4% N67-7PO, 0.1% IOS
0
50
100
150
200
250
0 0.2 0.4 0.6 0.8 1 1.2
Pore Volume
App
aren
tVis
cosi
ty(c
p)
1% IOS
0.5% CS330
0.5% C13-4PO&CS330(1:1)
Figure 3.2-2 Apparent viscosity during the sweeping the sand packpresaturated with polymer/surfactant
Fig 3.2-2 shows the apparent viscosity during the sweeping the sand packby foam. At the time of foam breakthrough, the apparent viscosity is about 40cpfor 0.5% CS330 and 200cp for 1% IOS and 0.5% C13-4PO&CS330 (1:1). Theviscosity for the polymer/surfactant solution is 43cp. If we assume the apparentviscosity of the system at the foam breakthrough is equal to the foam apparentviscosity, the foam apparent viscosity is close to or higher than the viscosity ofthe polymer/surfactant solution. But we did see the fingering at the interface ofthe foam and polymer/surfactant. The reason may be that the foam front is notas strong as the steady foam behind and the N67 in the system may weaken thefoam front.
The results in Fig. 3.2-1 show that it is possible to use foam instead ofpolymer as drive in ASP process. Although the cost of surfactant is comparableto polymer at the same concentration, lower surfactant concentrations is possibleand also less surfactant solution is required because a substantial portion of thedrive fluid would be the gas in the foam bubbles.
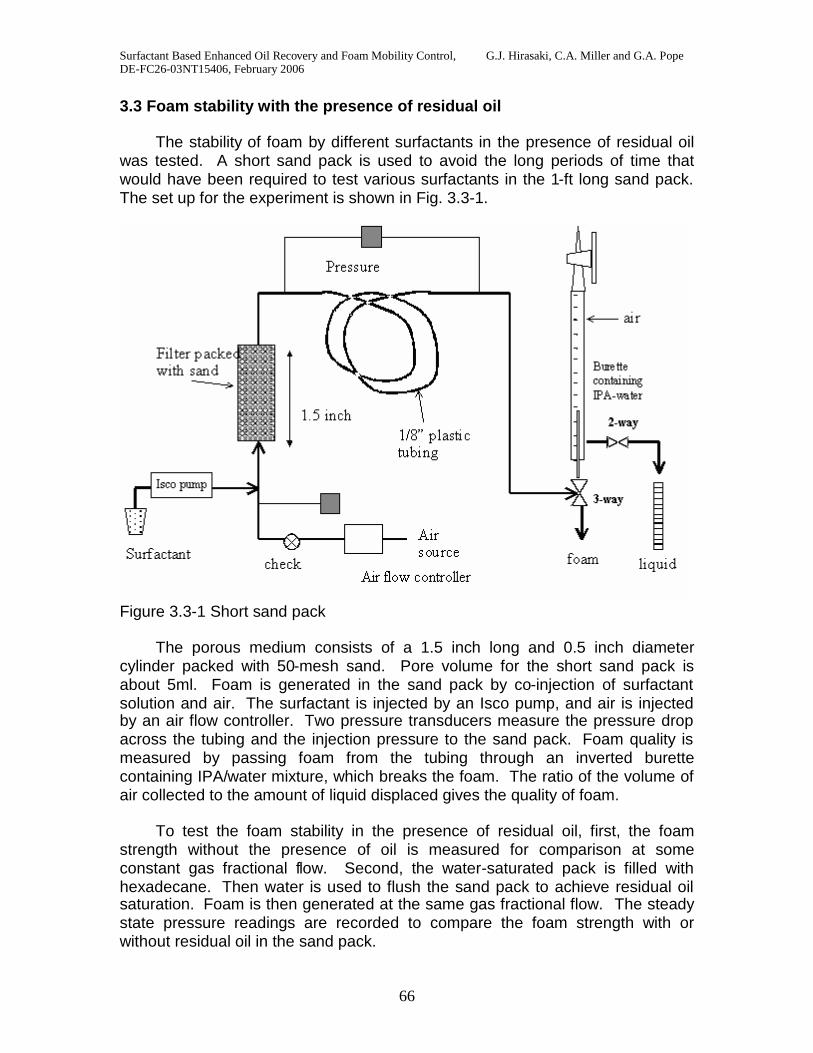
Surfactant Based Enhanced Oil Recovery and Foam Mobility Control, G.J. Hirasaki, C.A. Miller and G.A. PopeDE-FC26-03NT15406, February 2006
66
3.3 Foam stability with the presence of residual oil
The stability of foam by different surfactants in the presence of residual oilwas tested. A short sand pack is used to avoid the long periods of time thatwould have been required to test various surfactants in the 1-ft long sand pack.The set up for the experiment is shown in Fig. 3.3-1.
Figure 3.3-1 Short sand pack
The porous medium consists of a 1.5 inch long and 0.5 inch diametercylinder packed with 50-mesh sand. Pore volume for the short sand pack isabout 5ml. Foam is generated in the sand pack by co-injection of surfactantsolution and air. The surfactant is injected by an Isco pump, and air is injectedby an air flow controller. Two pressure transducers measure the pressure dropacross the tubing and the injection pressure to the sand pack. Foam quality ismeasured by passing foam from the tubing through an inverted burettecontaining IPA/water mixture, which breaks the foam. The ratio of the volume ofair collected to the amount of liquid displaced gives the quality of foam.
To test the foam stability in the presence of residual oil, first, the foamstrength without the presence of oil is measured for comparison at someconstant gas fractional flow. Second, the water-saturated pack is filled withhexadecane. Then water is used to flush the sand pack to achieve residual oilsaturation. Foam is then generated at the same gas fractional flow. The steadystate pressure readings are recorded to compare the foam strength with orwithout residual oil in the sand pack.
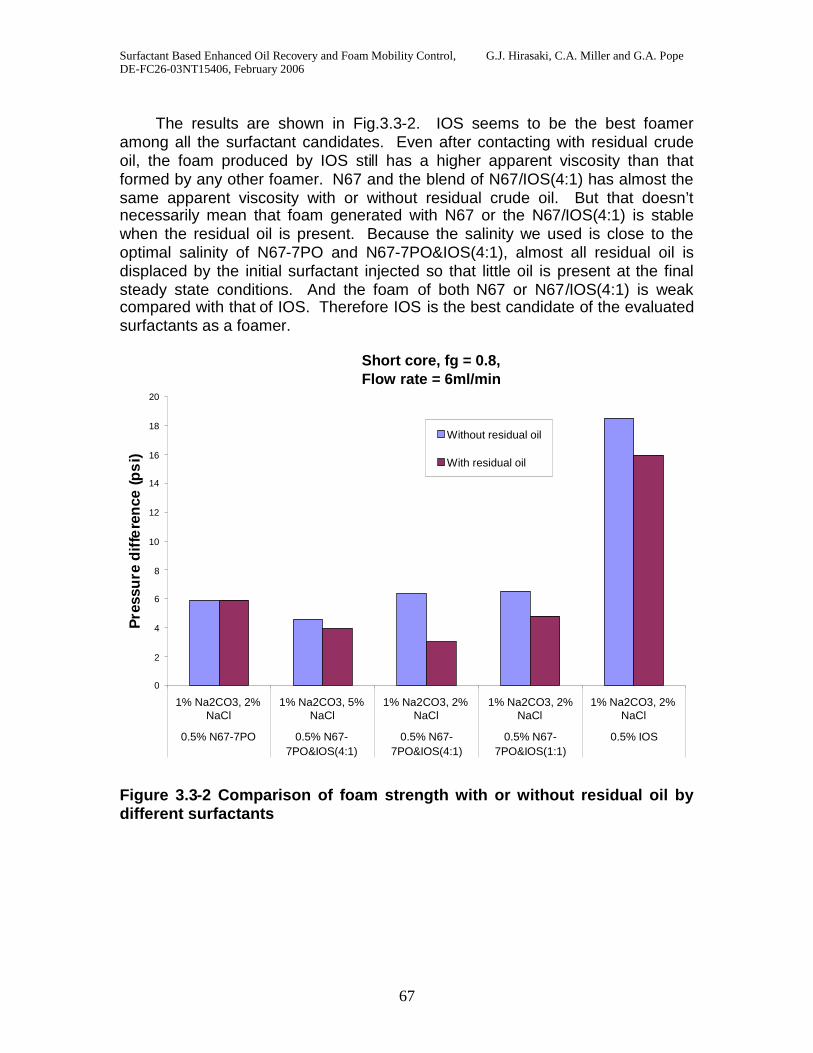
Surfactant Based Enhanced Oil Recovery and Foam Mobility Control, G.J. Hirasaki, C.A. Miller and G.A. PopeDE-FC26-03NT15406, February 2006
67
The results are shown in Fig.3.3-2. IOS seems to be the best foameramong all the surfactant candidates. Even after contacting with residual crudeoil, the foam produced by IOS still has a higher apparent viscosity than thatformed by any other foamer. N67 and the blend of N67/IOS(4:1) has almost thesame apparent viscosity with or without residual crude oil. But that doesn’tnecessarily mean that foam generated with N67 or the N67/IOS(4:1) is stablewhen the residual oil is present. Because the salinity we used is close to theoptimal salinity of N67-7PO and N67-7PO&IOS(4:1), almost all residual oil isdisplaced by the initial surfactant injected so that little oil is present at the finalsteady state conditions. And the foam of both N67 or N67/IOS(4:1) is weakcompared with that of IOS. Therefore IOS is the best candidate of the evaluatedsurfactants as a foamer.
Short core, fg = 0.8,Flow rate = 6ml/min
0
2
4
6
8
10
12
14
16
18
20
1% Na2CO3, 2%NaCl
1% Na2CO3, 5%NaCl
1% Na2CO3, 2%NaCl
1% Na2CO3, 2%NaCl
1% Na2CO3, 2%NaCl
0.5% N67-7PO 0.5% N67-7PO&IOS(4:1)
0.5% N67-7PO&IOS(4:1)
0.5% N67-7PO&IOS(1:1)
0.5% IOS
Pre
ssu
red
iffe
ren
ce(p
si)
Without residual oil
With residual oil
Figure 3.3-2 Comparison of foam strength with or without residual oil bydifferent surfactants
Surfactant Based Enhanced Oil Recovery and Foam Mobility Control, G.J. Hirasaki, C.A. Miller and G.A. PopeDE-FC26-03NT15406, February 2006
68
Reference
1. G.J. Hirasaki and J.B Lawson, Mechanisms of Foam Flow in PorousMedia: Apparent Viscosity in Smooth Capillaries, Society of PetroleumEngineers Journal, 25 (2), 1985, 176-190.
2. H.M. Princen, Rheology of Foams and Highly Concentrated Emulsions, I.Elastic Properties and Yield Stress of a Cylindrical Model System, Journalof Colloid Interface Science (1983) 91, No. 1 160-175.
3. I.M. Krieger, Rheology of Monodisperse Latices, Advances in Colloid andinterface Science, 1972, 3, 111-136.
4. M.J. Mooney, The Viscosity of a Concentrated Suspension of SphericalParticles, Journal of Colloid Science, 1951, 6, 162-170.
5. R. Pal, Rheology of Polymer-thickened Emulsions, Journal of Rheology,36(7), 1992.
Surfactant Based Enhanced Oil Recovery and Foam Mobility Control, G.J. Hirasaki, C.A. Miller and G.A. PopeDE-FC26-03NT15406, February 2006
69
Task 4: Simulation of Field-Scale Processes
Subtask 4.2: Wettability alterations in naturally fractured reservoirs
The objective of this task was to adapt the existing chemical reservoirsimulator UTCHEM to model wettability alteration in oil reservoirs due tosurfactant injection. We have continued our effort to compile both laboratorydata and correlations for relative permeability and capillary pressure as a functionof wettability. We have developed and implemented in UTCHEM a linearcorrelation to take into account the effect of wettability alteration on relativepermeabilities. The correlation takes into account the effect of surfactant on IFTreduction and oil mobilization in addition to relative permeability changes due towettability alteration.
Wettability alteration model in UTCHEM
Corey-type relative permeabilities are calculated for each gridblock.
nn
orr Skk (1)
where l is either water, oil or microemulsion phases, ork is the relative
permeability endpoint for phase l , nℓis the Corey exponent of phase l and Snℓisthe normalized saturation of phase l calculated as follows:
3
1r
rn
S1
SSS
(2)
where Sℓis the saturation of phase l and Sℓr is the residual saturation of phase l.As mentioned before, in addition to the wettability alteration effect, surfactantsalso reduce the interfacial tension between oil and aqueous phases and help inthe oil mobilization. This effect is modeled by means of a dimensionless groupcalled trapping number, which is a combination of capillary number and bondnumber and can adequately model the combined effect of viscous, capillary, andbuoyancy forces in three dimensions (Delshad, 1990; Delshad et al., 1996; Jin,1995, UTCHEM technical manual, 2000). As the surfactant enters a gridblock, itreduces the interfacial tension and as a result, trapping number increases.Interfacial tension reduction and oil mobilization effects of surfactantsproduceschanges in the residual phase saturations, endpoint relative permeabilities, andexponents. Mobilization effect on residual phase saturations is modeled inUTCHEM as follows (Delshad et al., 1986):
T
highr
lowrhigh
rr NT1SS
SS
(3)
Surfactant Based Enhanced Oil Recovery and Foam Mobility Control, G.J. Hirasaki, C.A. Miller and G.A. PopeDE-FC26-03NT15406, February 2006
70
where Sℓrhigh and Sℓr
low are residual saturations of phase l at high and lowcapillary numbers respectively (given as input parameters), Tℓ is the inputtrapping parameter of phase l and NTℓ is trapping number of phase l.Mobilization effects on endpoint relative permeabilities are modeled using thefollowing correlation (Delshad et al., 1986; UTCHEM technical manual, 2000).
lowhighlow or
orhigh
rlowr
rlowro
ror kk
SSSS
kk
(4)
lowork and
highork represent the endpoint relative permeability of phase l at low and
high capillary numbers respectively. Equation 5 gives the relative permeabilityexponents as a function of capillary number (Delshad et al., 1986; UTCHEMtechnical manual, 2000).
lowhighhighr
lowr
rlowrlow nn
SSSS
nn
(5)
where nℓlow and nℓhigh represent the relative permeability exponents for low and
high capillary numbers respectively specified as input parameters.
The above equations (Equations 1-5) are solved once for initial reservoirwettability condition for example oil-wet ( original
rk ) and once for the extreme alteredcondition of water-wet ( final
rk ). Two sets of relative permeability ( ork , Sℓr, nℓ) and
trapping parameters (Tℓ) are required as input corresponding to each wettabilitystate.
The relative permeability in each gridblock, rk , is then obtained by linearinterpolation between two relative permeabilities corresponding to differentwettability conditions, provided that the concentration of surfactant in thegridblock is greater than the critical micelle concentration. Interpolation is madebased on the scaling factor .
initialr
finalr
actualr k1kk (6)
where is the interpolation scaling factor, finalrk and original
rk represent the relativepermeabilities corresponding to the two extreme wetting states, i.e. final andinitial wettability states, respectively. The scaling factor is related to theconcentration of surfactant adsorbed in each gridblock as follows:
Surfactant Based Enhanced Oil Recovery and Foam Mobility Control, G.J. Hirasaki, C.A. Miller and G.A. PopeDE-FC26-03NT15406, February 2006
71
surfsurf
surf
CCC
(7)
where ĈSurf and CSurf represent the adsorbed and total concentration of surfactantrespectively. The historical maximum of in each gridblock is used for theinterpolation.
The model has been implemented in UTCHEM. We are in the process ofvalidating the model and its implementation against the laboratory imbibition cellexperiments performed at Rice University (Hirasaki et al., 2005).
References
Delshad, Mojdeh, Delshad, Mohammad, Bhuyan, D., Pope, G. A. and Lake,L.W.: "Effect of Capillary Number on the Residual Saturation of a Three-Phase Micellar Solution," Paper SPE 14911, Proceedings of the SPE/DOEFifth Symposium on Enhanced Oil Recovery, Tulsa, OK, April 20-23,1986.
Delshad, Mohammad: "Trapping of Micellar Fluids in Berea Sandstone," Ph.D.dissertation, The University of Texas at Austin, 1990.
Delshad, M., Pope, G. A., and Sepehrnoori, K.: "A Compositional Simulator forModeling Surfactant Enhanced Aquifer Remediation, 1 Formulation,"Journal of Contaminant Hydrology, 23, 303-327, 1996.
Hirasaki, G.J., C.A. Miller, and G.A. Pope: "Surfactant Based Enhanced OilRecovery and Foam Mobility Control," DOE annual report for the period ofJuly 2004 to July 2005. DOE contract number DE-FC26-03NT15406, July2005.
Jin, M.: "A Study of Nonaqueous Phase Liquid Characterization and SurfactantRemediation," Ph.D. dissertation, The University of Texas at Austin, 1995.
"Technical Documentation for UTCHEM-9.0 A three- Dimensional ChemicalFlood Simulator," prepared by Reservoir Engineering Research Center forPetroleum and Geosystems Engineering, The University of Texas atAustin, Austin, Texas, July 2000.