Embed Size (px)
Citation preview
U.S. Department of the InteriorU.S. Geological Survey
Surface Water-Ground Water Interactions Along the Lower Dungeness River and Vertical Hydraulic Conductivity ofStreambed Sediments, Clallam County, Washington, September 1999-July 2001
Prepared in cooperation with
Clallam County
Water-Resources Investigations Report 02-4161Washington State Department of Ecology Report 02-03-027
Oblique aerial photograph of the lower Dungeness River as it crosses the Sequim-Dungeness peninsula, Clallam County, Washington. Photograph courtesy of Dan Crowell, Soundview Aerial Photography, Arlington, Washington, March 1993.
U.S. GEOLOGICAL SURVEY
Water-Resources Investigations Report 02-4161Washington State Department of Ecology Report 02-03-027
Surface Water-Ground Water Interactions Along the Lower Dungeness River and Vertical Hydraulic Conductivity of Streambed Sediments, Clallam County, Washington, September 1999-July 2001
Prepared in cooperation with
CLALLAM COUNTY
By F. William Simonds1 and Kirk A. Sinclair2
1 U.S. Geological Survey, Tacoma, Washington2 Washington State Department of Ecology
Tacoma, Washington2002
U.S. DEPARTMENT OF THE INTERIOR
GALE A. NORTON, Secretary
U.S. GEOLOGICAL SURVEY
Charles G. Groat, Director
For additional information write to:
District ChiefU.S. Geological Survey1201 Pacific Avenue – Suite 600Tacoma, Washington 98402
http://wa.water.usgs.gov
Copies of this report can be purchasedfrom:
U.S. Geological SurveyInformation ServicesBuilding 810Box 25286, Federal CenterDenver, CO 80225-0286
Any use of trade, product, or firm names in this publication is for descriptive purposes only and does not imply endorsement by the U.S. Government.
District ChiefU.S. Geological Survey1201 Pacific Avenue – Suite 600Tacoma, Washington 98402http://wa.water.usgs.gov
Contents iii
CONTENTS
Abstract ................................................................................................................................................................ 1Introduction .......................................................................................................................................................... 2
Purpose and Scope ...................................................................................................................................... 2Description of Study Area.................................................................................................................................... 5
Previous Investigations ............................................................................................................................... 5Acknowledgments....................................................................................................................................... 5
Hydrogeologic Setting.......................................................................................................................................... 6Data Collection and Methods of Analysis............................................................................................................ 11
In-Stream Mini-Piezometers ....................................................................................................................... 11Seepage Runs .............................................................................................................................................. 16Off-Stream Well Transects ......................................................................................................................... 19
Interaction Between the Lower Dungeness River and the Water-Table Aquifer ................................................ 23Seepage Reach 1 ......................................................................................................................................... 25Seepage Reach 2 ......................................................................................................................................... 25Seepage Reach 3 ......................................................................................................................................... 31Seepage Reach 4 ......................................................................................................................................... 35Seepage Reach 5 ......................................................................................................................................... 35
Vertical Hydraulic Conductivity of Streambed Sediments .................................................................................. 40Sources of Uncertainty in Data Collection and Methods of Analysis.................................................................. 41
In-Stream Mini-Piezometers ....................................................................................................................... 41Seepage Runs .............................................................................................................................................. 42Off-Stream Well Transects ......................................................................................................................... 42Calculation of Streambed Hydraulic Conductivity Values......................................................................... 44
Summary and Conclusions................................................................................................................................... 45References ............................................................................................................................................................ 46
FIGURES
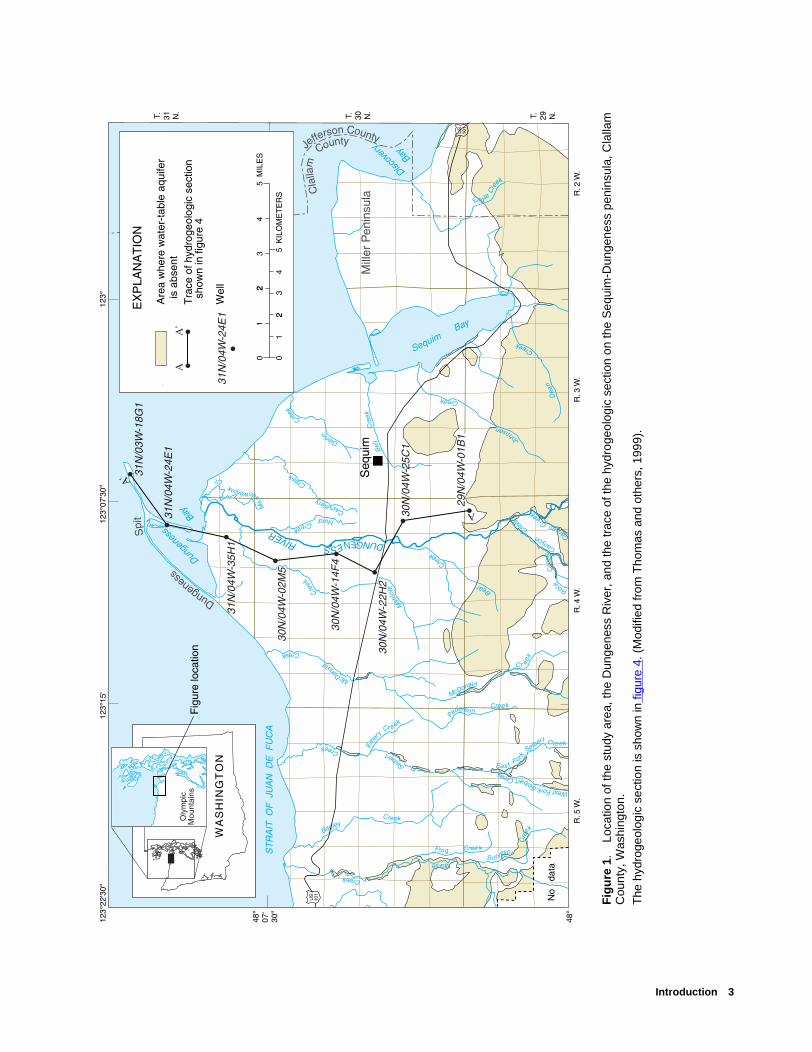
Figure 1. Map showing location of the study area, the Dungeness River, and the trace of the hydrogeologic section on the Sequim-Dungeness peninsula, Clallam County, Washington............ 3
Figure 2. Map showing locations of the sites of in-stream mini-piezometers, seepage-run discharge measurements, and off-stream well transects in the study area along the Dungeness River corridor on the Sequim-Dungeness peninsula, Clallam County, Washington ...... 4
Figure 3. Map showing surficial geology of the study area on the Sequim-Dungeness peninsula, Clallam County, Washington............................................................................................................. 7
Figure 4. Hydrogeologic section showing the principal aquifer and confining units and directions of ground-water flow on the Sequim-Dungeness peninsula, Clallam County, Washington.................. 8
Figure 5. Graph showing Mean daily discharge for the Dungeness River and average monthly precipitation near Sequim, Washington............................................................................................. 9
Figure 6. Map showing horizontal ground-water flow in the water-table aquifer on the Sequim-Dungeness peninsula, Clallam County, Washington ........................................................... 10
Figure 7. Diagram showing a typical in-stream mini-piezometer installation and manometerboard configuration............................................................................................................................ 12
Figure 8. Photograph showing demonstration of how a manometer board is used for measuring hydraulic head difference between surface water and ground water head ........................................ 15
Figure 9. Diagram showing configuration of the off-stream well transect at Dungeness Meadowson the Sequim-Dungeness peninsula, Clallam County, Washington ................................................ 20
Figure 10. Diagram showing configuration of the off-stream well transect at Schoolhouse Bridge on the Sequim-Dungeness peninsula, Clallam County, Washington ................................................ 21
Figure 11. Diagram showing construction of a typical monitoring well ............................................................ 22Figure 12. Digrams showing interaction between surface water and ground water to form a
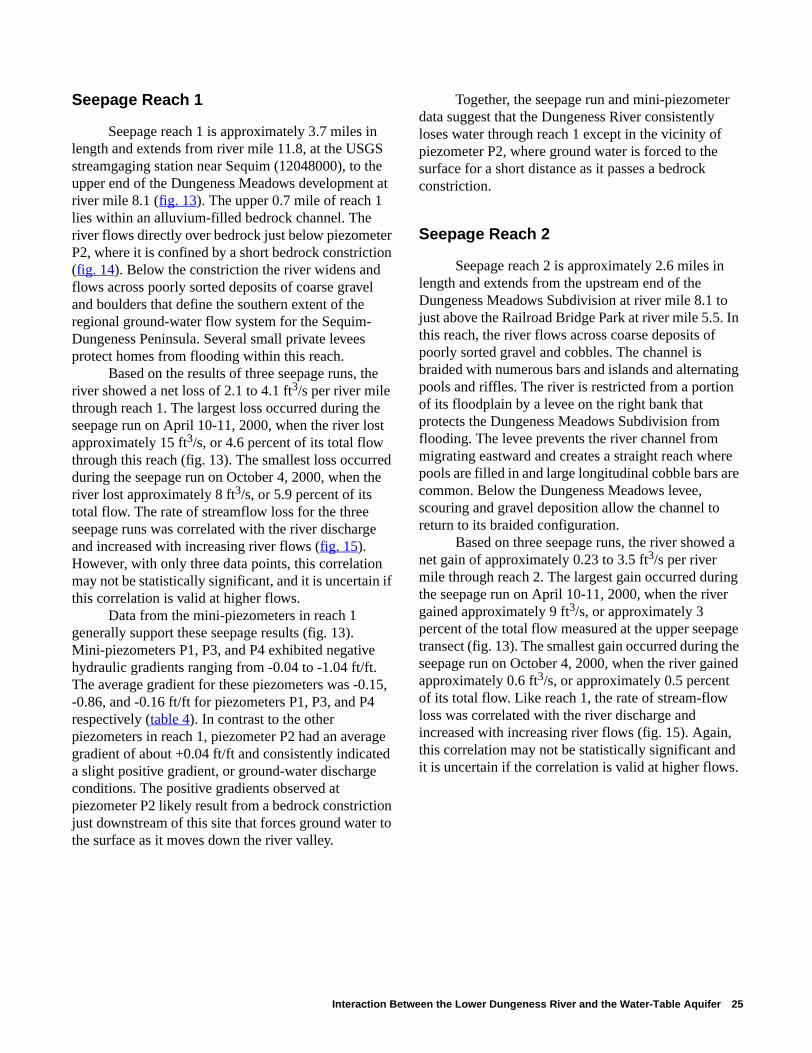
losing stream, a gaining stream, a disconnected stream, and bank storage ....................................... 24Figure 13. Map showing results of the seepage runs on the five study reaches of the lower
Dungeness River on the Sequim-Dungeness peninsula, Clallam County, Washington, April 11 and October 4, 2000, and April 12, 2001 ............................................................................ 26
Figure 14. Map showing locations of the river reaches and results of in-stream mini-piezometermeasurements in the study area of the lower Dungeness River on the Sequim-Dungeness peninsula, Clallam County, Washington ........................................................................................... 27
Figure 15. Graphs showing correlation between streamflow gain or loss and river discharge during the three seepage runs in the five study reaches of the lower Dungeness River on the Sequim-Dungeness peninsula, Clallam County, Washington ................................................28
Figure 16. Graph showing continuous surface- and ground-water level data collected from June 2000 to July 2001 at the Dungeness Meadows off-stream well transect on the Sequim-Dungeness peninsula, Clallam County, Washington ........................................................... 32
Figure 17. Graph showing continuous surface- and ground-water temperature data collected fromJune 2000 to July 2001 at the Dungeness Meadows off-stream well transect on theSequim-Dungeness peninsula, Clallam County, Washington ........................................................... 33
iv Figures
Figure 18. Water-level profiles of the water-table aquifer, constructed from monthly water-level measurements at the Dungeness Meadows off-stream well transect on the Sequim-Dungeness peninsula, Clallam County, Washington ........................................................... 34
Figure 19. Graph showing continuous surface- and ground-water level data collected from June 2000 to July 2001 at the Schoolhouse Bridge off-stream well transect on the Sequim-Dungeness peninsula, Clallam County, Washington ........................................................... 37
Figure 20. Graph showing continuous surface- and ground-water temperature data collected from June 2000 to July 2001 at the Schoolhouse Bridge off-stream well transect on the Sequim-Dungeness peninsula, Clallam County, Washington ..................................................... 38
Figure 21. Water-level profiles of the water-table aquifer, constructed from monthly water-level measurements at the Schoolhouse Bridge off-stream well transect on the Sequim-Dungeness peninsula, Clallam County, Washington ........................................................... 39
Figure 22. Graph showing comparison of vertical hydraulic gradient between the river and ground water at the in-stream mini-piezometer sites along the lower Dungeness River on the Sequim-Dungeness peninsula, Clallam County, Washington ................................................ 43
Figures v
vi Tables
TABLES
Table 1. Details of construction and installation of the mini-piezometers along the lowerDungeness River on the Sequim-Dungeness peninsula, Clallam County, Washington ................... 13
Table 2. Summary of surface- and ground-water data collected during in-stream mini-piezometersurveys for the lower Dungeness River on the Sequim-Dungeness peninsula, Clallam County, Washington ............................................................................................................ 17
Table 3. Details of construction of the off-stream piezometer transects ........................................................ 19Table 4. Results of in-stream mini-piezometer surveys on the lower Dungeness River
on the Sequim-Dungeness peninsula, Clallam County, Washington ............................................... 29Table 5. Characteristics of and calculated average vertical hydraulic gradient and
vertical hydraulic conductivity for the study reaches in the lower Dungeness River on the Sequim-Dungeness peninsula, Clallam County, Washington, April 12, 2001 41
Table 6. Data collected during the mini-piezometer surveys on the lower Dungeness River on the Sequim-Dungeness peninsula, Clallam County, Washington, September 1999 to July 2001 ......... 49
Table 7. Data collected during the seepage runs on the lower Dungeness River on the Sequim-Dungeness peninsula, Clallam County, Washington, April and October 2000 and April 2001 ........................................................................................................... 51
Table 8. Data measured monthly in the lower Dungeness River and at the off-stream well transects on the Sequim-Dungeness peninsula, Clallam County, Washington, March 2000 to July 2001 .................................................................................................................. 54
Conversion Factors and Vertical Datum vii
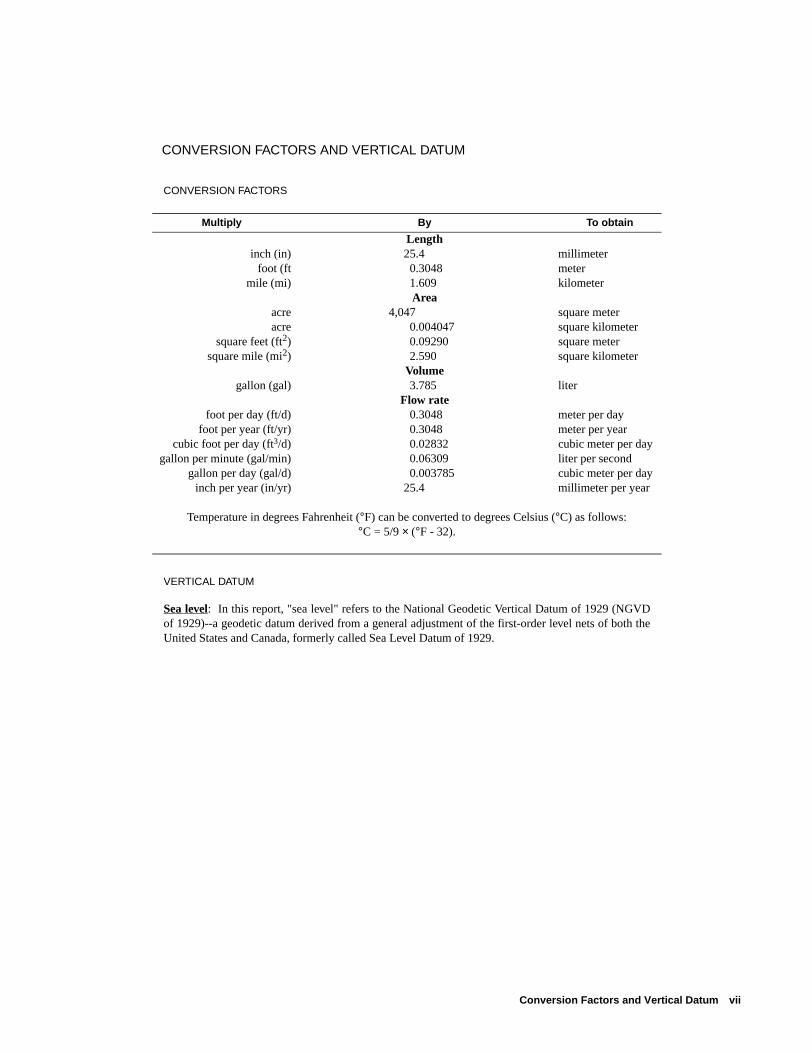
CONVERSION FACTORS AND VERTICAL DATUM
CONVERSION FACTORS
VERTICAL DATUM
Sea level: In this report, "sea level" refers to the National Geodetic Vertical Datum of 1929 (NGVDof 1929)--a geodetic datum derived from a general adjustment of the first-order level nets of both theUnited States and Canada, formerly called Sea Level Datum of 1929.
Multiply By To obtain
Lengthinch (in) 25.4 millimeter
foot (ft 0.3048 metermile (mi) 1.609 kilometer
Areaacre 4,047 square meteracre 0.004047 square kilometer
square feet (ft2) 0.09290 square metersquare mile (mi2) 2.590 square kilometer
Volumegallon (gal) 3.785 liter
Flow ratefoot per day (ft/d) 0.3048 meter per day
foot per year (ft/yr) 0.3048 meter per yearcubic foot per day (ft3/d) 0.02832 cubic meter per day
gallon per minute (gal/min) 0.06309 liter per secondgallon per day (gal/d) 0.003785 cubic meter per day
inch per year (in/yr) 25.4 millimeter per year
Temperature in degrees Fahrenheit (°F) can be converted to degrees Celsius (°C) as follows: °C = 5/9 × (°F - 32).
Surface Water-Ground Water Interactions Along the Lower Dungeness River and Vertical Hydraulic Conductivity of Streambed Sediments, Clallam County, Washington, September 1999-July 2001
By F. William Simonds and Kirk A. Sinclair
ABSTRACT
The Dungeness River emerges from the Olympic Mountains and flows generally north toward the Strait of Juan De Fuca, crossing the broad, fertile alluvial fan of the Sequim-Dungeness peninsula in northeastern Clallam County, Washington. Increasing competition for the peninsula's ground-water resources, changing water-use patterns, and recent requirements to maintain minimum in-stream flows to enhance endangered salmon and trout populations have severely strained the peninsula's water resources and necessitated a better understanding of the interaction between surface water and ground water. Three methods were used to characterize the interchange between surface water and ground water along the lower 11.8 miles of the Dungeness River corridor between September 1999 and July 2001. In-stream mini-piezometers were used to measure vertical hydraulic gradients between the river and the water-table aquifer at 27 points along the river and helped to define the distribution of gaining and losing stream reaches. Seepage runs were used to quantify the net volume of water exchanged between the river and ground water within each of five river reaches, termed "seepage reaches." Continuous water-level and water-temperature monitoring at two off-stream well transects provided data on near-river horizontal hydraulic gradients and temporal patterns of water exchange for a representative gaining stream reach and a representative losing stream reach.
Vertical hydraulic gradients in the mini-piezometers generally were negative between river miles 11.8 and 3.6, indicating loss of water from the river to ground water. Gradients decreased in the downstream direction from an average of -0.86 at river mile 10.3 to -0.23 at river mile 3.7. Small positive gradients (+0.01 to +0.02) indicating ground-water discharge occurred in three localized reaches below river mile 3.7. Data from the seepage runs and off-stream transect wells supported and were generally consistent with the mini-piezometer findings. An exception occurred between river miles 8.1 and 5.5 where seepage results showed a small gain and the mini-piezometers showed negative gradients.
Vertical hydraulic conductivity of riverbed sediments was estimated using hydraulic gradients measured with the mini-piezometers and estimated seepage fluxes. The resulting conductivity values ranged from an average of 1 to 29 feet per day and are similar to values reported for similar river environments elsewhere.
The results of this study will be used to calibrate a transient, three-dimensional ground-water flow model of the Sequim-Dungeness peninsula. The model will be used to assess the potential effects on ground-water levels and river flows that result from future water use and land-use changes on the peninsula.
Abstract 1
INTRODUCTION
The Dungeness River emerges from the Olympic Mountains and flows generally north toward the Strait of Juan De Fuca, crossing the broad, fertile alluvial fan of the Sequim-Dungeness peninsula, in Clallam County, Washington (fig. 1). The river is an important source of irrigation water for the area's agricultural economy. During the past 20 years, the peninsula's human population has increased by roughly 250 percent and land use has gradually shifted from irrigated agriculture to urban and rural residential development (Thomas and others, 1999).
Increasing competition for the peninsula's ground-water resources, changing water-use patterns, and recent requirements to maintain minimum in-stream flows to enhance endangered salmon and trout populations have severely strained the peninsula's water resources and necessitated a better understanding of the interaction between surface water and ground water (U.S. Forest Service, 1995: Jamestown S'Klallam Tribe, 1994). To address this need, the U.S. Geological Survey (USGS), in cooperation with Clallam County, conducted a study from September 1999 to July 2001 to assess the interaction between surface water and ground water using three methods of data collection and analysis that, combined, provide a reasonable evaluation of the distribution, timing, and volume of surface water-ground water exchange in the area. Results from the study will be useful in future water management decisions affecting the peninsula and will provide information for the development and calibration of a transient, three-dimensional ground-water-flow model of the Sequim-Dungeness peninsula. The model will be used to assess the effects of anticipated water-use changes on the peninsula and the potential ramifications of these changes on area ground-water levels and in-stream flows.
Purpose and Scope
This report summarizes a 2-year effort to evaluate and describe the hydraulic interaction between the lower Dungeness River and the water-table aquifer underlying the Sequim-Dungeness peninsula in northeastern Clallam County, Washington. The major objectives of this study were:1. To provide annual and seasonal estimates of the
distribution, direction, and volume of water exchange between the lower Dungeness River and the water table aquifer;
2. To evaluate how rainfall and snowmelt-driven river-level changes affect surface water and ground water exchange along the lower Dungeness River corridor; and
3. To estimate average vertical hydraulic conductivity of Dungeness River streambed sediments, which will aid in the calibration of a transient, three-dimensional ground-water flow model of the study area.The approach involved using three data-
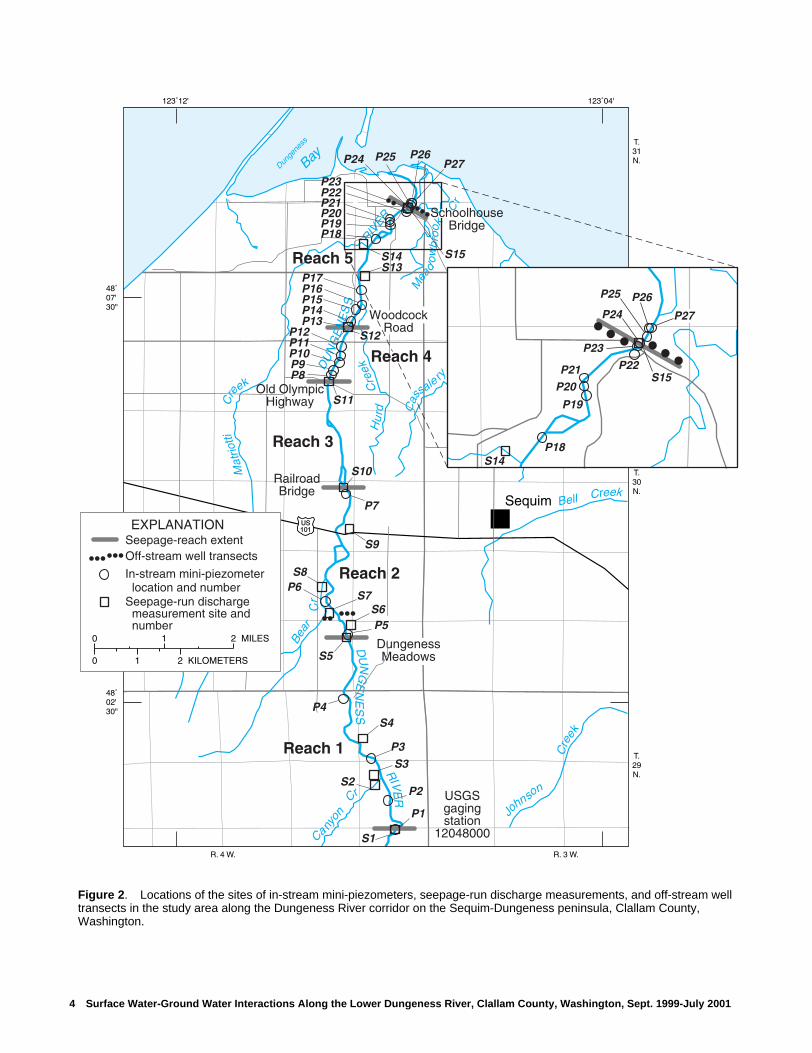
collection and analysis methods to evaluate the distribution, timing, and volume of surface-water and ground-water exchange. Data were collected from 27 in-stream mini-piezometer locations, 3 stream seepage runs in which 5 river reaches or seepage reaches were evaluated, and 2 off-stream piezometer arrays termed "off-stream well transects" (fig. 2). The study was conducted from September 1999 through July 2001 and focused on the lower Dungeness River corridor from USGS streamgaging station 12048000 to Schoolhouse Bridge near the mouth of the river.
2 Surface Water-Ground Water Interactions Along the Lower Dungeness River, Clallam County, Washington, Sept. 1999-July 2001
Mill
er P
enin
sula
US
101
US
101
Seq
uim
Dungeness
Spi
tJe
fferson County
Cla
llam
County
Pro
tect
ion
Isla
nd
Morse Creek
Fro g Cree k
Su rveyor
Cre
ek
S
eibert
Creek
West Fork Seibert Creek
P
ederso n
Cree k
M
atrio
tti C
ree
k
Caraco C
reek
Canyon
Cre
ek
Rock
C
ree
k
Cassalery
Cree
k
Hurd Creek
Gierin
Cre
ek
Bell
C
reek
Joh
nson
Creek De
an
C
reek
Discov
ery
Bay
Sequim Bay
Dun
gene
ss
Bay
ST
RA
IT O
F JU
AN
D
E F
UC
A
DUNGENESS
RIVER
McDonald
Cr e
ek
McD
onald
Creek
Me
adowbrook
Cr.
Eas t Fork
Seibert C reek
Eag le
Cre
ek
B
ear
Cre
ek
Em
ery
Cre ek
Bagley
Creek
Are
a w
here
wat
er-t
able
aqu
ifer
is
abse
ntT
race
of h
ydro
geol
ogic
sec
tion
sho
wn
in fi
gure
4
Wel
l
EX
PLA
NA
TIO
N
01
23
45
MIL
ES
2
01
23
45
KIL
OM
ET
ER
S2
A'
A
T. 31 N.
T. 30 N.
T. 29 N.
R. 4
W.
R. 5
W.
R. 3
W.
R. 2
W.
No
dat
a
WA
SH
ING
TO
N
Fig
ure
loca
tion
Oly
mpi
cM
ount
ains
31
N/0
3W
-18
G1
31
N/0
4W
-24
E1
31
N/0
4W
-24
E1
31
N/0
4W
-35
H1
30
N/0
4W
-02
M5
30
N/0
4W
-14
F4
30
N/0
4W
-22
H2
30
N/0
4W
-25
C1
29
N/0
4W
-01
B1
A'
A
Fig
ure
1.
Loca
tion
of th
e st
udy
area
, the
Dun
gene
ss R
iver
, and
the
trac
e of
the
hydr
ogeo
logi
c se
ctio
n on
the
Seq
uim
-Dun
gene
ss p
enin
sula
, Cla
llam
C
ount
y, W
ashi
ngto
n.
The
hyd
roge
olog
ic s
ectio
n is
sho
wn
in fi
gure
4. (
Mod
ified
from
Tho
mas
and
oth
ers,
199
9).
Introduction 3
Dunge
ness
Bay
US101
Sequim
DungenessMeadows
SchoolhouseBridge
Mat
riotti
C
re
ekH
urd
C
reek
Cas
sale ry
C
re
ek
Gier i n
C
re
ek
Bell Creek
Jo
hnson
Cre
ek
Mea
dow
bro
ok
Cr
Bea
r
C
r C
a ny
on C
r
DU
NG
EN
ES
S
R
IVER
DU
NG
EN
ES
S R
IVE
R
P9
P21
P24 P25
P16
P10
P23P22
P2
P8
P7
P6
P5
P4
P1
P20P19P18
P17
P15P14P13
P12P11
P26P27
P3
S11
S15
S12
S10
S5
S7
S8
S1
S2
S3
S4
S6
S9
S13S14
WoodcockRoad
Old OlympicHighway
RailroadBridge
USGSgagingstation
12048000
Reach 1
Reach 2
Reach 3
Reach 4
Reach 5
R. 4 W. R. 3 W.
T.31N.
T.30N.
T.29N.
P21
P24
P25
P23
P22
P20
P19
P18
P26
S15
S14
P27
EXPLANATIONSeepage-reach extentOff-stream well transects
In-stream mini-piezometer location and numberSeepage-run discharge measurement site and number
1 2 MILES
0
0
1 2 KILOMETERS
Figure 2. Locations of the sites of in-stream mini-piezometers, seepage-run discharge measurements, and off-stream well transects in the study area along the Dungeness River corridor on the Sequim-Dungeness peninsula, Clallam County, Washington.
4 Surface Water-Ground Water Interactions Along the Lower Dungeness River, Clallam County, Washington, Sept. 1999-July 2001
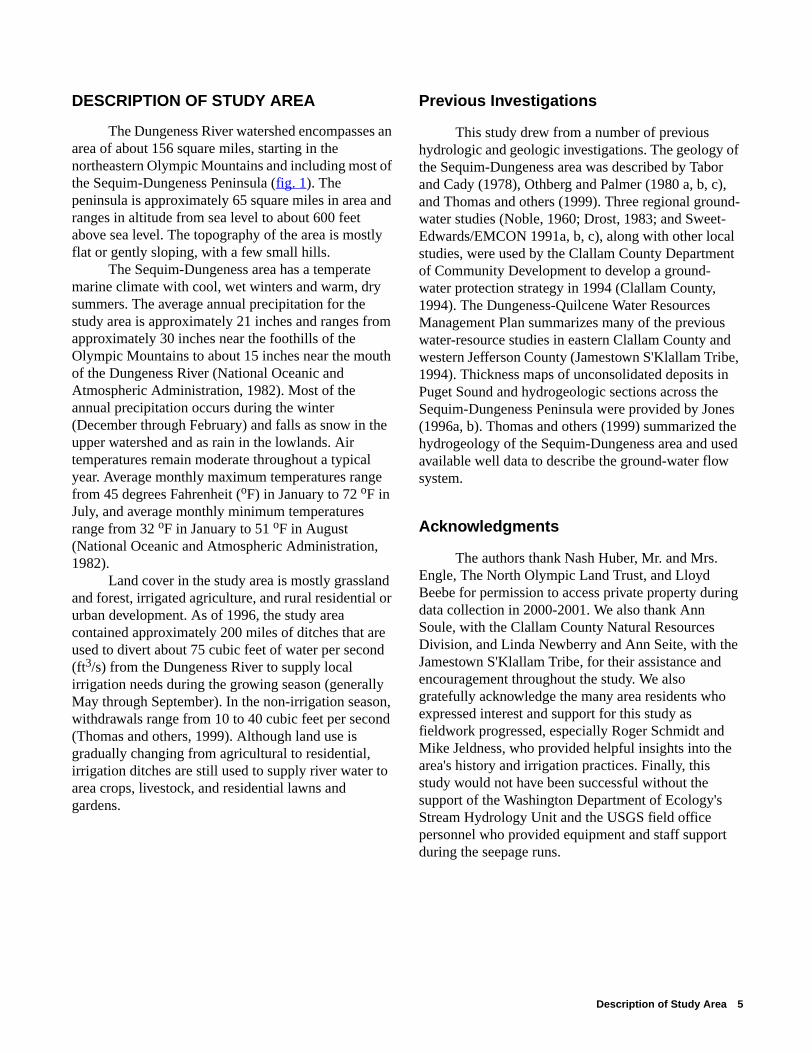
DESCRIPTION OF STUDY AREA
The Dungeness River watershed encompasses an area of about 156 square miles, starting in the northeastern Olympic Mountains and including most of the Sequim-Dungeness Peninsula (fig. 1). The peninsula is approximately 65 square miles in area and ranges in altitude from sea level to about 600 feet above sea level. The topography of the area is mostly flat or gently sloping, with a few small hills.
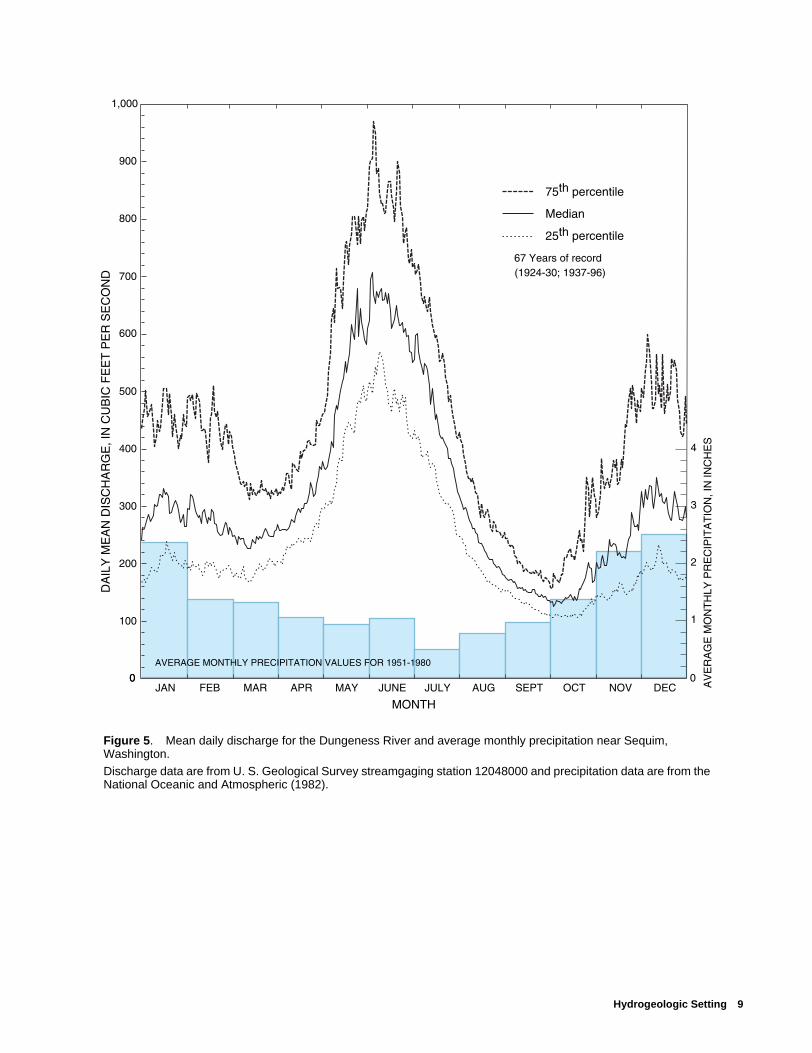
The Sequim-Dungeness area has a temperate marine climate with cool, wet winters and warm, dry summers. The average annual precipitation for the study area is approximately 21 inches and ranges from approximately 30 inches near the foothills of the Olympic Mountains to about 15 inches near the mouth of the Dungeness River (National Oceanic and Atmospheric Administration, 1982). Most of the annual precipitation occurs during the winter (December through February) and falls as snow in the upper watershed and as rain in the lowlands. Air temperatures remain moderate throughout a typical year. Average monthly maximum temperatures range from 45 degrees Fahrenheit (oF) in January to 72 oF in July, and average monthly minimum temperatures range from 32 oF in January to 51 oF in August (National Oceanic and Atmospheric Administration, 1982).
Land cover in the study area is mostly grassland and forest, irrigated agriculture, and rural residential or urban development. As of 1996, the study area contained approximately 200 miles of ditches that are used to divert about 75 cubic feet of water per second (ft3/s) from the Dungeness River to supply local irrigation needs during the growing season (generally May through September). In the non-irrigation season, withdrawals range from 10 to 40 cubic feet per second (Thomas and others, 1999). Although land use is gradually changing from agricultural to residential, irrigation ditches are still used to supply river water to area crops, livestock, and residential lawns and gardens.
Previous Investigations
This study drew from a number of previous hydrologic and geologic investigations. The geology of the Sequim-Dungeness area was described by Tabor and Cady (1978), Othberg and Palmer (1980 a, b, c), and Thomas and others (1999). Three regional ground-water studies (Noble, 1960; Drost, 1983; and Sweet-Edwards/EMCON 1991a, b, c), along with other local studies, were used by the Clallam County Department of Community Development to develop a ground-water protection strategy in 1994 (Clallam County, 1994). The Dungeness-Quilcene Water Resources Management Plan summarizes many of the previous water-resource studies in eastern Clallam County and western Jefferson County (Jamestown S'Klallam Tribe, 1994). Thickness maps of unconsolidated deposits in Puget Sound and hydrogeologic sections across the Sequim-Dungeness Peninsula were provided by Jones (1996a, b). Thomas and others (1999) summarized the hydrogeology of the Sequim-Dungeness area and used available well data to describe the ground-water flow system.
Acknowledgments
The authors thank Nash Huber, Mr. and Mrs. Engle, The North Olympic Land Trust, and Lloyd Beebe for permission to access private property during data collection in 2000-2001. We also thank Ann Soule, with the Clallam County Natural Resources Division, and Linda Newberry and Ann Seite, with the Jamestown S'Klallam Tribe, for their assistance and encouragement throughout the study. We also gratefully acknowledge the many area residents who expressed interest and support for this study as fieldwork progressed, especially Roger Schmidt and Mike Jeldness, who provided helpful insights into the area's history and irrigation practices. Finally, this study would not have been successful without the support of the Washington Department of Ecology's Stream Hydrology Unit and the USGS field office personnel who provided equipment and staff support during the seepage runs.
Description of Study Area 5
HYDROGEOLOGIC SETTING
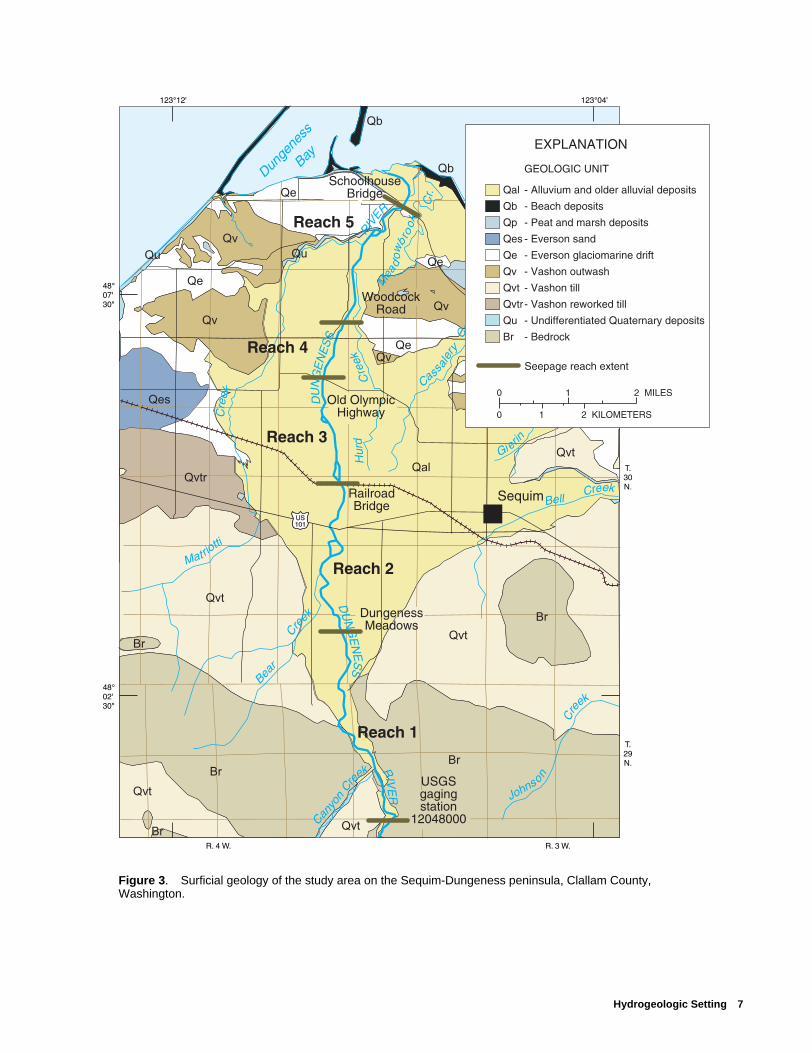
The river channel in the headwaters of the Dungeness River is composed of Tertiary-age volcanic and sedimentary bedrock that makes up most of the Olympic Mountains. Once the river leaves the Olympic Mountains and enters the Sequim-Dungeness peninsula, it is underlain by recent alluvium and a sequence of unconsolidated glacial and interglacial sediments of Quaternary age (fig. 3). The thickness of the unconsolidated deposits increases from a few feet near the southern bedrock contact to approximately 2,400 feet near the mouth of the Dungeness River (Jones, 1996b). Consequently, the number and thickness of hydrogeologic units beneath the river channel increases to the north.
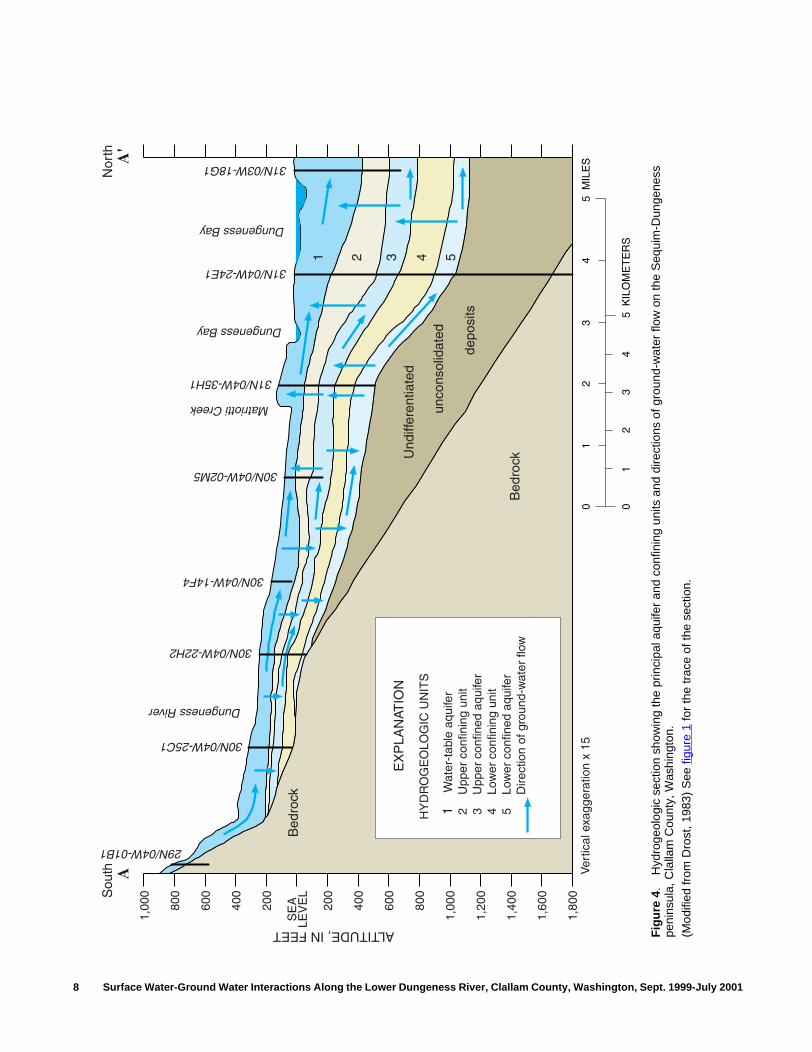
Three aquifer units and two confining units have been identified and correlated using well logs from the Sequim-Dungeness area (Drost, 1983; Jones, 1996b; Thomas and others, 1999). In descending order, the hydrogeologic units are the water-table aquifer, the upper confining unit, the upper confined aquifer, the lower confining unit, and the lower confined aquifer (fig. 4). The aquifer units consist primarily of coarse-grained deposits of sand and gravel. The confining units generally consist of fine-grained silt and clay. Very few data are available on the undifferentiated deposits below the lower confined aquifer, however they are assumed to be a mixture of glacial and non-glacial deposits of Quaternary age (Jones, 1996b).
The materials that compose the water-table aquifer were deposited about 10,000 to 15,000 years ago during the Vashon stade of the Frasier glaciation. Modern fluvial processes have dominated the landscape since retreat of the Vashon ice sheet and have extensively reworked the Vashon outwash materials. Currently, the Dungeness River meanders from south to north across the peninsula for approximately 11 miles before emptying into the Strait of Juan De Fuca north of the town of Sequim. The river forms a braided channel that descends from the
mountain front at an average gradient of 48 feet per mile. Flood-control levees, constructed to protect crop land and residential development, cut off some portions of the channel from the adjacent flood plain. Flow in the Dungeness River (fig. 5) varies seasonally, with high flows in the winter (due to rain) and in the early summer (due to snow melt). Flow in the river is consistently low in the late summer and fall.
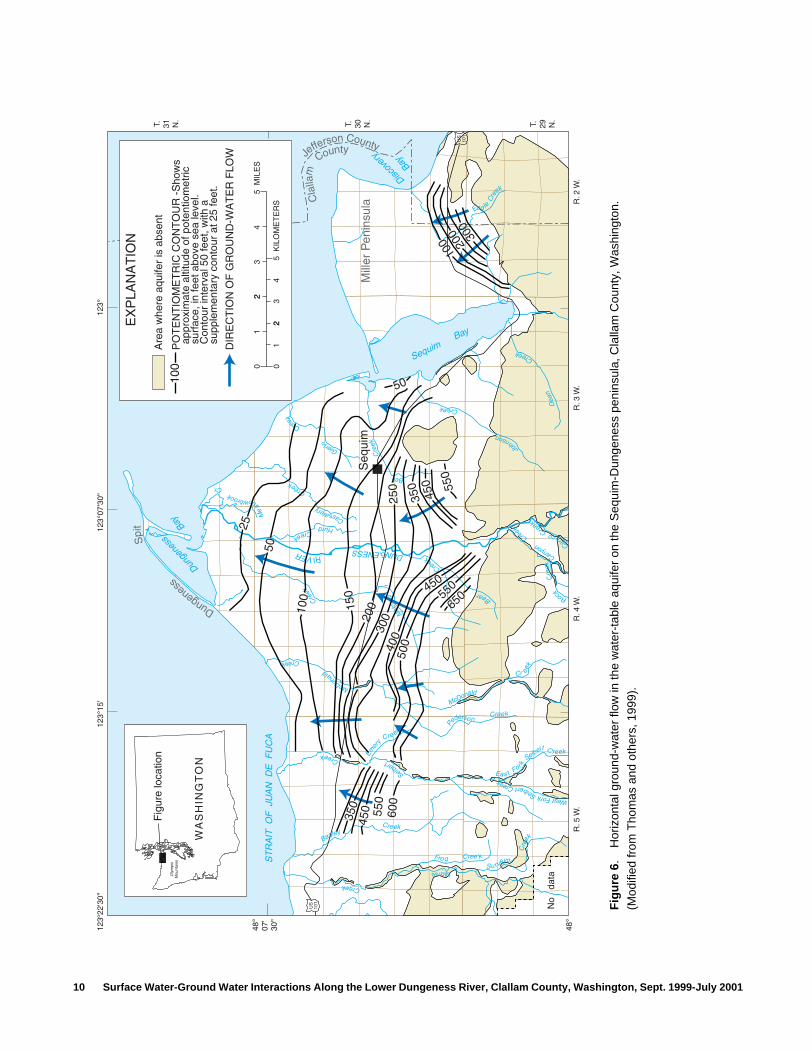
Recharge to the study area ground-water system is highly variable and derives from several sources including precipitation (mostly in the winter), leakage from the Dungeness River and irrigation ditches, and percolation of septic-system effluent and unconsumed irrigation water. Area ground water generally flows from south to north across the peninsula toward natural points of discharge at springs and seeps, the Dungeness River, and the Strait of Juan De Fuca (fig. 6). Evapotranspiration and pumping from wells also remove water from the ground-water system.
Horizontal ground-water flow in the water-table aquifer is approximately parallel to the Dungeness River (fig. 6). Ground-water flow directions in the upper and lower confined aquifers, although not as well defined by available water-level data, are thought to be similar to those in the water-table aquifer (Thomas and others, 1999). Vertical flow between aquifers is generally downward in the southern study area (near the Olympic Mountain foothills) and upward in the northern study area (near the Strait of Juan De Fuca) (fig. 4).
Because of its low permeability, bedrock is assumed to be the lower boundary of the regional aquifer system. The upper boundary is the potentiometric surface for the water-table aquifer and was well defined in 1996 by Thomas and others (1999). Lateral boundaries of the regional aquifer system include bedrock to the south, Morse Creek to the west, and saltwater interfaces along the Strait of Juan De Fuca, Dungeness Bay to the north, and Sequim Bay to the east.
6 Surface Water-Ground Water Interactions Along the Lower Dungeness River, Clallam County, Washington, Sept. 1999-July 2001
US101
Sequim
Matrio
tti
C
reek
Hur
d
C
reek
Cassal
er
y Cr
eek
Bell Creek
J
ohnson
Cre
ek
Mea
dow
b rook
Cr.
Bea
r
Cre
ekD
UN
GE
NE
SS
R
IVER
DU
NG
EN
ES
S
RIVE
R
Ca
nyon
Cre
ek
Dunge
ness
Bay
Gi er
in
R. 4 W. R. 3 W.
T.31N.
T.30N.
T.29N.
SchoolhouseBridge
WoodcockRoad
Old OlympicHighway
RailroadBridge
USGSgagingstation
12048000
DungenessMeadows
Reach 1
Reach 2
Reach 3
Reach 4
Reach 5
Br
Qu
Qvtr
Qvt
Qv
Qe
Qes
Qp
Qb
Qal
- Bedrock
- Undifferentiated Quaternary deposits
- Vashon reworked till
- Vashon till
- Vashon outwash
- Everson glaciomarine drift
- Everson sand
- Peat and marsh deposits
- Beach deposits
- Alluvium and older alluvial deposits
GEOLOGIC UNIT
EXPLANATION
Seepage reach extent
1 2 MILES
0
0
1 2 KILOMETERS
Qb
Qb
Br
Br
Br
Br
Br
Qu Qu
Qvtr
Qvt
Qvt
Qvt
Qvt
Qvt
Qe
Qe
Qe
Qe
Qv
Qv
Qv
Qv
Qes
Qal
Figure 3. Surficial geology of the study area on the Sequim-Dungeness peninsula, Clallam County, Washington.
Hydrogeologic Setting 7
SE
ALE
VE
L
ALTITUDE, IN FEETS
outh
Nor
th A'
Ver
tical
exa
gger
atio
n x
15
1,00
0
800
600
400
200
1,00
0
1,20
0
1,40
0
1,60
0
1,80
0
800
600
400
200
A
01
34
5 M
ILE
S2
01
34
5 K
ILO
ME
TE
RS
2
30N/04W-25C1
29N/04W-01B1
30N/04W-22H2
30N/04W-14F4
30N/04W-02M5
31N/04W-35H1
31N/04W-24E1
31N/03W-18G1
Dungeness River
Matriotti Creek
Dungeness Bay
Dungeness Bay
Bed
rock
Bed
rock
Und
iffer
entia
ted
unco
nsol
idat
ed
depo
sits
EX
PLA
NAT
ION
HY
DR
OG
EO
LOG
IC U
NIT
S
1
Wat
er-t
able
aqu
ifer
2
Upp
er c
onfin
ing
unit
3
Upp
er c
onfin
ed a
quife
r4
Lo
wer
con
finin
g un
it5
Lo
wer
con
fined
aqu
ifer
Dire
ctio
n of
gro
und-
wat
er fl
ow
1 2 3 4 5
8 Surface Water-Ground Water Interactions Along the Lower Dungeness River, Clallam County, Washington,
Fig
ure
4.
Hyd
roge
olog
ic s
ectio
n sh
owin
g th
e pr
inci
pal a
quife
r an
d co
nfin
ing
units
and
dire
ctio
ns o
f gro
und-
wat
er fl
ow o
n th
e S
equi
m-D
unge
ness
pe
nins
ula,
Cla
llam
Cou
nty,
Was
hing
ton.
(Mod
ified
from
Dro
st, 1
983)
See
figu
re 1
for
the
trac
e of
the
sect
ion.
Sept. 1999-July 2001
4
1
2
3
AVERAGE MONTHLY PRECIPITATION VALUES FOR 1951-1980
AV
ER
AG
E M
ON
TH
LY P
RE
CIP
ITA
TIO
N, I
N IN
CH
ES
JAN FEB MAR APR MAY JUNE JULY AUG SEPT OCT NOV DEC
MONTH
0
1,000
0 0
100
200
300
400
500
600
700
800
900
DA
ILY
ME
AN
DIS
CH
AR
GE
, IN
CU
BIC
FE
ET
PE
R S
EC
ON
D
75th percentile
Median
25th percentile
67 Years of record(1924-30; 1937-96)
Figure 5. Mean daily discharge for the Dungeness River and average monthly precipitation near Sequim, Washington.
Discharge data are from U. S. Geological Survey streamgaging station 12048000 and precipitation data are from the National Oceanic and Atmospheric (1982).
Hydrogeologic Setting 9
Mill
er P
enin
sula
US
101
US
101
Seq
uim
Dungeness
Spi
t
Jefferson County
Cla
llam
County
Pro
tect
ion
Isla
nd
Morse Creek
Fro g Cree k
Su rveyor
Cre
ek
S
eibert
Creek
West Fork Seibert Creek
P
ederso n
Cree k
M
atrio
tti C
ree
k
Caraco C
reek
Canyon
Cre
ek
Rock
C
ree
k
Cassalery
Cree
k
Hurd Creek
Gierin
Cre
ek
Bell
C
ree
k
Joh
nson
Creek De
an
C
reek
Discov
ery
Bay
Sequim Bay
Dun
gene
ss
Bay
ST
RA
IT O
F JU
AN
D
E F
UC
A
DUNGENESS RIVER
McDonald
Cr e
ek
McD
onald
Creek
Me
adowbrook
Cr.
Eas t Fork
Seibert C reek
Eag le
Cre
ek
B
ear
Cre
e
k
Em
ery
Cre ek
Bagley
Creek
Are
a w
here
aqu
ifer
is a
bsen
t
PO
TE
NT
IOM
ET
RIC
CO
NT
OU
R -
Sho
ws
app
roxi
mat
e al
titud
e of
pot
entio
met
ric s
urfa
ce, i
n fe
et a
bove
sea
leve
l. C
onto
ur in
terv
al 5
0 fe
et, w
ith a
sup
plem
enta
ry c
onto
ur a
t 25
feet
.
DIR
EC
TIO
N O
F G
RO
UN
D-W
AT
ER
FLO
W
100
EX
PLA
NA
TIO
N
01
23
45
MIL
ES
2
01
23
45
KIL
OM
ET
ER
S2
100 20
0 300
550
450
350
250
65055
0450
450 55
060
0
350
50040030
020015
0
100
50
50
25
T. 31 N.
T. 30 N.
T. 29 N.
R. 4
W.
R. 5
W.
R. 3
W.
R. 2
W.
No
dat
a
WA
SH
ING
TO
N
Fig
ure
loca
tion
Oly
mpic
Mounta
ins
10 Surface Water-Ground Water Interactions Along the Lower Dungeness River, Clallam County, Wash
Fig
ure
6.
Hor
izon
tal g
roun
d-w
ater
flow
in th
e w
ater
-tab
le a
quife
r on
the
Seq
uim
-Dun
gene
ss p
enin
sula
, Cla
llam
Cou
nty,
Was
hing
ton.
(Mod
ified
from
Tho
mas
and
oth
ers,
199
9).
ington, Sept. 1999-July 2001
DATA COLLECTION AND METHODS OF ANALYSIS
The fieldwork for this study spanned a period of approximately 22 months. During this time, in-stream mini-piezometers were installed into the bed of the Dungeness River, multiple seepage runs were conducted, and two off-stream well transects were constructed adjacent to the river and were instrumented to continuously record ground-water levels and temperatures. Each of these activities is discussed in detail below, along with the analysis methods used to evaluate the study results.
Site locations for the in-stream mini-piezometers, seepage run discharge measurements, and off-stream well transects, were determined using a global positioning system (GPS) receiver (fig. 2). The receiver has a reported accuracy of about 50 feet. The latitude and longitude of all data collection sites were entered into a Geographic Information System (GIS) database. A GIS routing program was then used to determine the distance between sites and their approximate river-mile locations relative to the mouth of the Dungeness river at mile 0.0. The river mile locations derived through this technique are dependent on the scale of the GIS data used to perform the analysis. Thus, the station locations referenced in this report may differ slightly from those reported by prior investigators.
In-Stream Mini-Piezometers
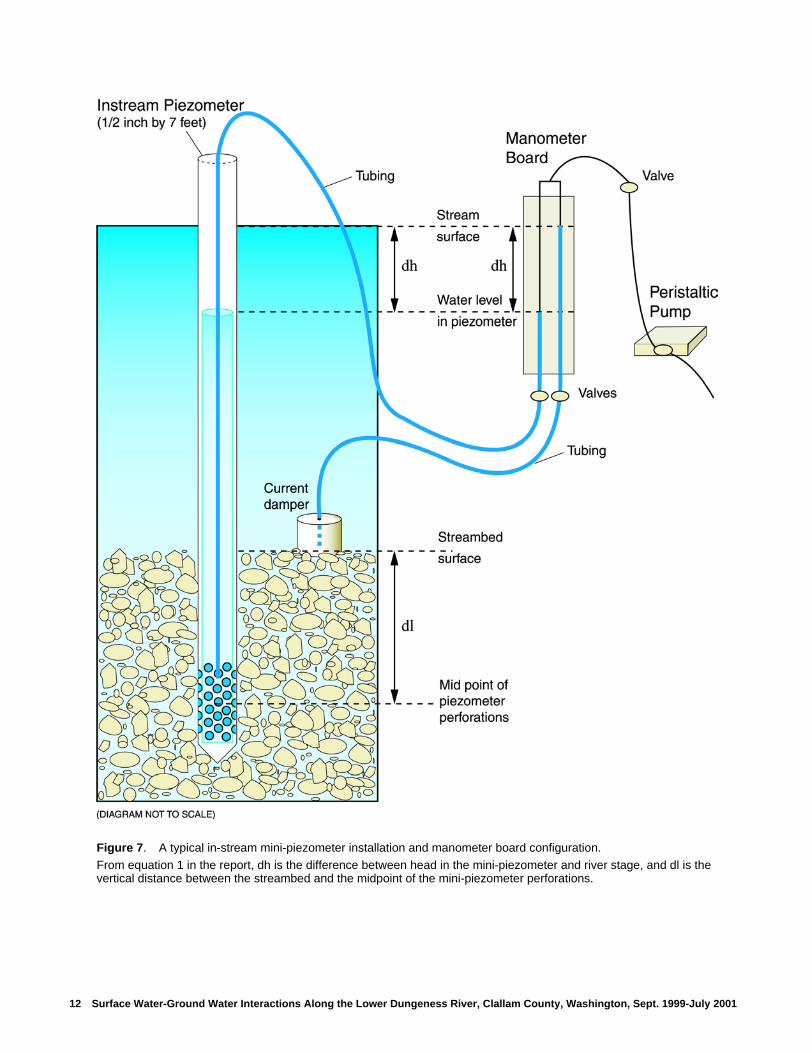
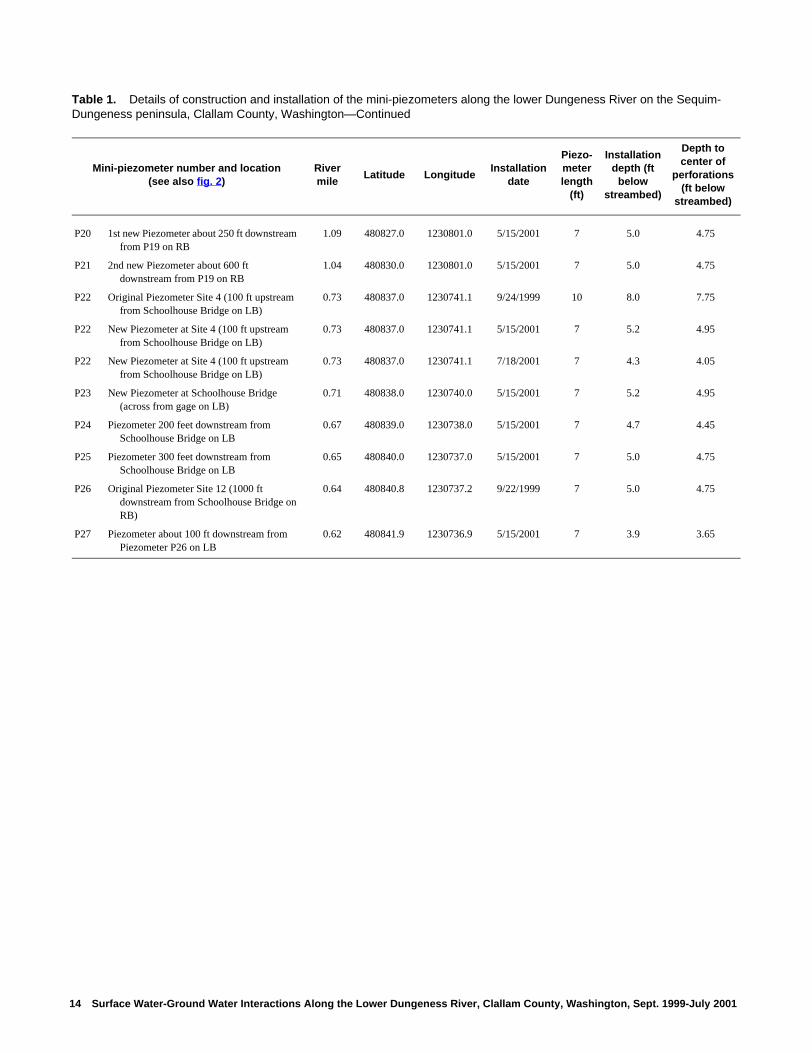
Twenty-seven in-stream mini-piezometers were driven into the streambed of the lower Dungeness River to define the vertical hydraulic gradient and direction of flow between the river and the water-table aquifer (fig. 2). Initially, 12 mini-piezometers were installed to verify the gaining and losing reaches previously identified by Thomas and others (1999). As the study progressed, 15 additional mini-piezometers were installed to help define the extent of localized ground-water discharge zones. The 27 mini-piezometers are labeled in downstream order from P1 to P27.
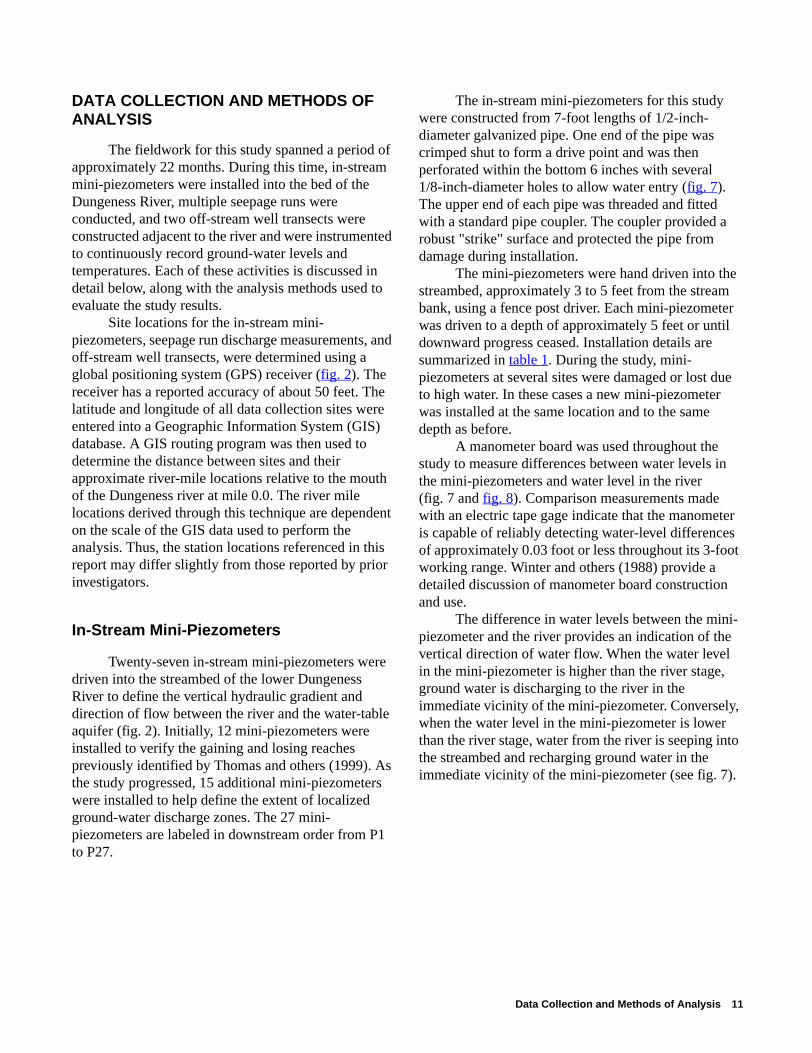
The in-stream mini-piezometers for this study were constructed from 7-foot lengths of 1/2-inch-diameter galvanized pipe. One end of the pipe was crimped shut to form a drive point and was then perforated within the bottom 6 inches with several 1/8-inch-diameter holes to allow water entry (fig. 7). The upper end of each pipe was threaded and fitted with a standard pipe coupler. The coupler provided a robust "strike" surface and protected the pipe from damage during installation.
The mini-piezometers were hand driven into the streambed, approximately 3 to 5 feet from the stream bank, using a fence post driver. Each mini-piezometer was driven to a depth of approximately 5 feet or until downward progress ceased. Installation details are summarized in table 1. During the study, mini-piezometers at several sites were damaged or lost due to high water. In these cases a new mini-piezometer was installed at the same location and to the same depth as before.
A manometer board was used throughout the study to measure differences between water levels in the mini-piezometers and water level in the river (fig. 7 and fig. 8). Comparison measurements made with an electric tape gage indicate that the manometer is capable of reliably detecting water-level differences of approximately 0.03 foot or less throughout its 3-foot working range. Winter and others (1988) provide a detailed discussion of manometer board construction and use.
The difference in water levels between the mini-piezometer and the river provides an indication of the vertical direction of water flow. When the water level in the mini-piezometer is higher than the river stage, ground water is discharging to the river in the immediate vicinity of the mini-piezometer. Conversely, when the water level in the mini-piezometer is lower than the river stage, water from the river is seeping into the streambed and recharging ground water in the immediate vicinity of the mini-piezometer (see fig. 7).
Data Collection and Methods of Analysis 11
12
Figure 7. A typical in-stream mini-piezometer installation and manometer board configuration.
From equation 1 in the report, dh is the difference between head in the mini-piezometer and river stage, and dl is the vertical distance between the streambed and the midpoint of the mini-piezometer perforations.
Surface Water-Ground Water Interactions Along the Lower Dungeness River, Clallam County, Washington, Sept. 1999-July 2001
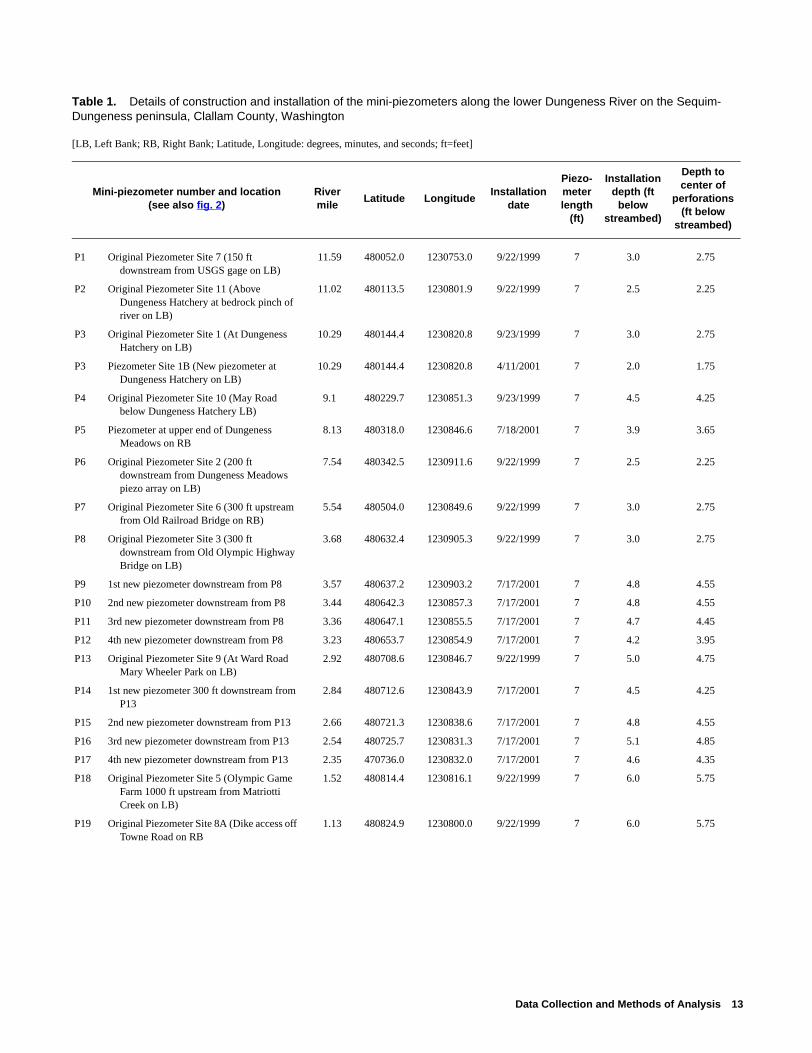
Table 1. Details of construction and installation of the mini-piezometers along the lower Dungeness River on the Sequim-Dungeness peninsula, Clallam County, Washington—Continued
Mini-piezometer number and location (see also fig. 2)
River mile
Latitude LongitudeInstallation
date
Piezo-meter length
(ft)
Installation depth (ft
below streambed)
Depth to center of
perforations (ft below
streambed)
P1 Original Piezometer Site 7 (150 ft downstream from USGS gage on LB)
11.59 480052.0 1230753.0 9/22/1999 7 3.0 2.75
P2 Original Piezometer Site 11 (Above Dungeness Hatchery at bedrock pinch of river on LB)
11.02 480113.5 1230801.9 9/22/1999 7 2.5 2.25
P3 Original Piezometer Site 1 (At Dungeness Hatchery on LB)
10.29 480144.4 1230820.8 9/23/1999 7 3.0 2.75
P3 Piezometer Site 1B (New piezometer at Dungeness Hatchery on LB)
10.29 480144.4 1230820.8 4/11/2001 7 2.0 1.75
P4 Original Piezometer Site 10 (May Road below Dungeness Hatchery LB)
9.1 480229.7 1230851.3 9/23/1999 7 4.5 4.25
P5 Piezometer at upper end of Dungeness Meadows on RB
8.13 480318.0 1230846.6 7/18/2001 7 3.9 3.65
P6 Original Piezometer Site 2 (200 ft downstream from Dungeness Meadows piezo array on LB)
7.54 480342.5 1230911.6 9/22/1999 7 2.5 2.25
P7 Original Piezometer Site 6 (300 ft upstream from Old Railroad Bridge on RB)
5.54 480504.0 1230849.6 9/22/1999 7 3.0 2.75
P8 Original Piezometer Site 3 (300 ft downstream from Old Olympic Highway Bridge on LB)
3.68 480632.4 1230905.3 9/22/1999 7 3.0 2.75
P9 1st new piezometer downstream from P8 3.57 480637.2 1230903.2 7/17/2001 7 4.8 4.55
P10 2nd new piezometer downstream from P8 3.44 480642.3 1230857.3 7/17/2001 7 4.8 4.55
P11 3rd new piezometer downstream from P8 3.36 480647.1 1230855.5 7/17/2001 7 4.7 4.45
P12 4th new piezometer downstream from P8 3.23 480653.7 1230854.9 7/17/2001 7 4.2 3.95
P13 Original Piezometer Site 9 (At Ward Road Mary Wheeler Park on LB)
2.92 480708.6 1230846.7 9/22/1999 7 5.0 4.75
P14 1st new piezometer 300 ft downstream from P13
2.84 480712.6 1230843.9 7/17/2001 7 4.5 4.25
P15 2nd new piezometer downstream from P13 2.66 480721.3 1230838.6 7/17/2001 7 4.8 4.55
P16 3rd new piezometer downstream from P13 2.54 480725.7 1230831.3 7/17/2001 7 5.1 4.85
P17 4th new piezometer downstream from P13 2.35 470736.0 1230832.0 7/17/2001 7 4.6 4.35
P18 Original Piezometer Site 5 (Olympic Game Farm 1000 ft upstream from Matriotti Creek on LB)
1.52 480814.4 1230816.1 9/22/1999 7 6.0 5.75
P19 Original Piezometer Site 8A (Dike access off Towne Road on RB
1.13 480824.9 1230800.0 9/22/1999 7 6.0 5.75
Table 1. Details of construction and installation of the mini-piezometers along the lower Dungeness River on the Sequim-Dungeness peninsula, Clallam County, Washington
[LB, Left Bank; RB, Right Bank; Latitude, Longitude: degrees, minutes, and seconds; ft=feet]
Data Collection and Methods of Analysis 13
P20 1st new Piezometer about 250 ft downstream from P19 on RB
1.09 480827.0 1230801.0 5/15/2001 7 5.0 4.75
P21 2nd new Piezometer about 600 ft downstream from P19 on RB
1.04 480830.0 1230801.0 5/15/2001 7 5.0 4.75
P22 Original Piezometer Site 4 (100 ft upstream from Schoolhouse Bridge on LB)
0.73 480837.0 1230741.1 9/24/1999 10 8.0 7.75
P22 New Piezometer at Site 4 (100 ft upstream from Schoolhouse Bridge on LB)
0.73 480837.0 1230741.1 5/15/2001 7 5.2 4.95
P22 New Piezometer at Site 4 (100 ft upstream from Schoolhouse Bridge on LB)
0.73 480837.0 1230741.1 7/18/2001 7 4.3 4.05
P23 New Piezometer at Schoolhouse Bridge (across from gage on LB)
0.71 480838.0 1230740.0 5/15/2001 7 5.2 4.95
P24 Piezometer 200 feet downstream from Schoolhouse Bridge on LB
0.67 480839.0 1230738.0 5/15/2001 7 4.7 4.45
P25 Piezometer 300 feet downstream from Schoolhouse Bridge on LB
0.65 480840.0 1230737.0 5/15/2001 7 5.0 4.75
P26 Original Piezometer Site 12 (1000 ft downstream from Schoolhouse Bridge on RB)
0.64 480840.8 1230737.2 9/22/1999 7 5.0 4.75
P27 Piezometer about 100 ft downstream from Piezometer P26 on LB
0.62 480841.9 1230736.9 5/15/2001 7 3.9 3.65
Table 1. Details of construction and installation of the mini-piezometers along the lower Dungeness River on the Sequim-Dungeness peninsula, Clallam County, Washington—Continued
Mini-piezometer number and location (see also fig. 2)
River mile
Latitude LongitudeInstallation
date
Piezo-meter length
(ft)
Installation depth (ft
below streambed)
Depth to center of
perforations (ft below
streambed)
14 Surface Water-Ground Water Interactions Along the Lower Dungeness River, Clallam County, Washington, Sept. 1999-July 2001
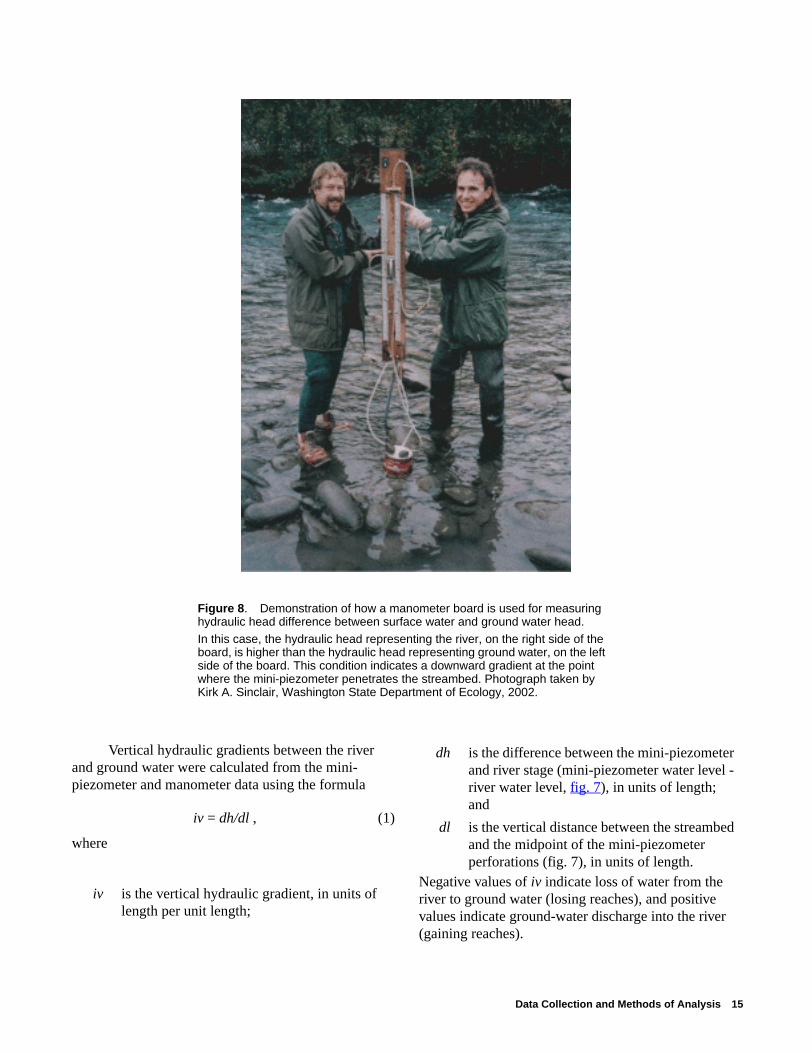
Figure 8. Demonstration of how a manometer board is used for measuring hydraulic head difference between surface water and ground water head.
In this case, the hydraulic head representing the river, on the right side of the board, is higher than the hydraulic head representing ground water, on the left side of the board. This condition indicates a downward gradient at the point where the mini-piezometer penetrates the streambed. Photograph taken by Kirk A. Sinclair, Washington State Department of Ecology, 2002.
Vertical hydraulic gradients between the river and ground water were calculated from the mini-piezometer and manometer data using the formula
iv = dh/dl , (1)
where
Negative values of iv indicate loss of water from the river to ground water (losing reaches), and positive values indicate ground-water discharge into the river (gaining reaches).
iv is the vertical hydraulic gradient, in units of length per unit length;
dh is the difference between the mini-piezometer and river stage (mini-piezometer water level - river water level, fig. 7), in units of length; and
dl is the vertical distance between the streambed and the midpoint of the mini-piezometer perforations (fig. 7), in units of length.
Data Collection and Methods of Analysis 15
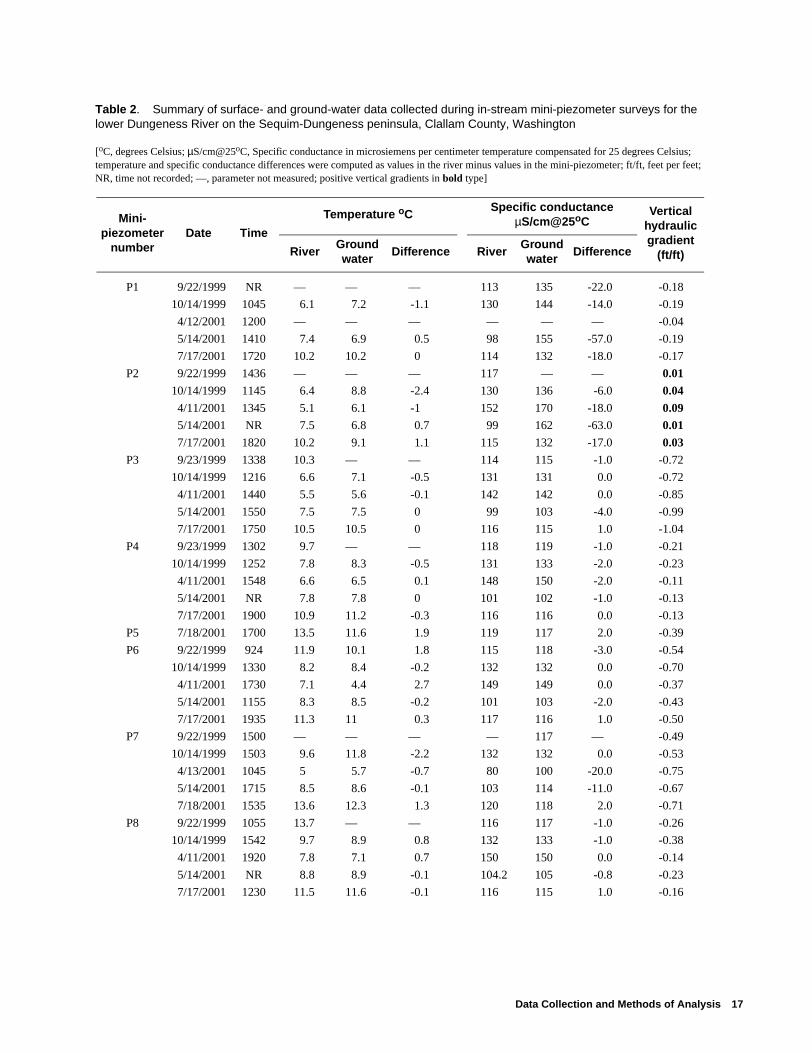
During each survey, the instream mini-piezometers and river were sampled for temperature and specific conductance to provide additional verification of the manometer measurements. In losing reaches, the river temperature and ground-water temperature tend to match closely and the specific conductance of the two water sources is often very similar. In gaining reaches ground water is typically warmer in the winter, or cooler in the summer, than the river, and the specific conductance of the river and ground water may differ significantly (Fryar and others, 2000).
Water temperature and specific conductance were measured at the stream center using a YSI TLC combination field meter or a Multiline P4 universal meter and Tetracon 325 conductivity/temperature probe. All field meters were calibrated where possible or were checked daily against known standards, in accordance with the project quality-assurance plan (Simonds and others, unpublished document, 1999). The mini-piezometers were purged for approximately 5 minutes with a peristaltic pump (at a rate of approximately 500 milliliters per minute) prior to sampling. Grab samples were then collected at approximately 1-minute intervals as purging progressed, and were evaluated using the above described meters. Water-quality values were considered stable when two successive grab samples yielded comparable results (that is, there was less than a 10-percent difference from the mean of two grab samples for all measurements). Water-level and water-quality data for the instream mini-piezometers are summarized in table 2, and the collected data are provided in table 6 (at back of report).
Seepage Runs
Seepage runs were conducted over a 1- or 2-day period during stable streamflow conditions in April 2000, October 2000, and April 2001. During the seepage runs discharge measurements were made at selected sites along the main stem of the Dungeness River, at tributary inputs to the river, and at irrigation ditch out-takes and fish-bypass-return flows (fig. 2).
The increase or decrease in discharge between measurement sites that cannot be accounted for through tributary input or out-of-stream diversions is an estimate of the net volume of water exchanged between the river and ground water. The seepage measurement sites were arranged in downstream order, with site S1 the upstream-most location and site S15 the downstream-most location (fig. 2). Reaches of the river between the measurement sites are termed "seepage reaches" in this report.
To determine the volume of water gained or lost by the river, the seepage data were used in a mass balance calculation as follows.
Net seepage gain or loss = Qd -T -Qu + D , (2)
where
The result of equation 2 is the net volume of water entering or leaving the river. The sign of the number indicates if a given seepage reach is gaining water from (positive) or losing water to (negative) ground water. The data collected during the seepage runs are listed in table 7 (at back of report).
The seepage discharge measurements were made with a Swoffer Model 2100 horizontal axis current meter or a Price AA current meter using the cross section method described by Rantz and others (1982). Side-by-side comparison measurements of the two types of meter yielded differences of less than 3 percent. Duplicate discharge measurements were made at each of the seepage transects on the main stem of the Dungeness River to evaluate measurement precision.
Qd is the discharge measured at the downstream end of the reach, in ft3/s;
Qu is the discharge measured at the upstream end of the reach, in ft3/s;
T is the sum of tributary inflows, in ft3/s; and
D is the sum of irrigation ditch diversions, in ft3/s.
16 Surface Water-Ground Water Interactions Along the Lower Dungeness River, Clallam County, Washington, Sept. 1999-July 2001
The irrigation ditches and tributaries generally were measured only once because they typically represented a small percentage of the total flow.
Table 2. Summary of surface- and ground-water data collected during in-stream mini-piezometer surveys for the lower Dungeness River on the Sequim-Dungeness peninsula, Clallam County, Washington—Continued
Mini-piezometer
numberDate Time
Temperature oCSpecific conductance
µS/cm@25oCVertical
hydraulic gradient
(ft/ft)RiverGround water
Difference RiverGround water
Difference
P1 9/22/1999 NR — — — 113 135 -22.0 -0.18
10/14/1999 1045 6.1 7.2 -1.1 130 144 -14.0 -0.19
4/12/2001 1200 — — — — — — -0.04
5/14/2001 1410 7.4 6.9 0.5 98 155 -57.0 -0.19
7/17/2001 1720 10.2 10.2 0 114 132 -18.0 -0.17
P2 9/22/1999 1436 — — — 117 — — 0.01
10/14/1999 1145 6.4 8.8 -2.4 130 136 -6.0 0.04
4/11/2001 1345 5.1 6.1 -1 152 170 -18.0 0.095/14/2001 NR 7.5 6.8 0.7 99 162 -63.0 0.01
7/17/2001 1820 10.2 9.1 1.1 115 132 -17.0 0.03
P3 9/23/1999 1338 10.3 — — 114 115 -1.0 -0.72
10/14/1999 1216 6.6 7.1 -0.5 131 131 0.0 -0.72
4/11/2001 1440 5.5 5.6 -0.1 142 142 0.0 -0.85
5/14/2001 1550 7.5 7.5 0 99 103 -4.0 -0.99
7/17/2001 1750 10.5 10.5 0 116 115 1.0 -1.04
P4 9/23/1999 1302 9.7 — — 118 119 -1.0 -0.21
10/14/1999 1252 7.8 8.3 -0.5 131 133 -2.0 -0.23
4/11/2001 1548 6.6 6.5 0.1 148 150 -2.0 -0.11
5/14/2001 NR 7.8 7.8 0 101 102 -1.0 -0.13
7/17/2001 1900 10.9 11.2 -0.3 116 116 0.0 -0.13
P5 7/18/2001 1700 13.5 11.6 1.9 119 117 2.0 -0.39
P6 9/22/1999 924 11.9 10.1 1.8 115 118 -3.0 -0.54
10/14/1999 1330 8.2 8.4 -0.2 132 132 0.0 -0.70
4/11/2001 1730 7.1 4.4 2.7 149 149 0.0 -0.37
5/14/2001 1155 8.3 8.5 -0.2 101 103 -2.0 -0.43
7/17/2001 1935 11.3 11 0.3 117 116 1.0 -0.50
P7 9/22/1999 1500 — — — — 117 — -0.49
10/14/1999 1503 9.6 11.8 -2.2 132 132 0.0 -0.53
4/13/2001 1045 5 5.7 -0.7 80 100 -20.0 -0.75
5/14/2001 1715 8.5 8.6 -0.1 103 114 -11.0 -0.67
7/18/2001 1535 13.6 12.3 1.3 120 118 2.0 -0.71
P8 9/22/1999 1055 13.7 — — 116 117 -1.0 -0.26
10/14/1999 1542 9.7 8.9 0.8 132 133 -1.0 -0.38
4/11/2001 1920 7.8 7.1 0.7 150 150 0.0 -0.14
5/14/2001 NR 8.8 8.9 -0.1 104.2 105 -0.8 -0.23
7/17/2001 1230 11.5 11.6 -0.1 116 115 1.0 -0.16
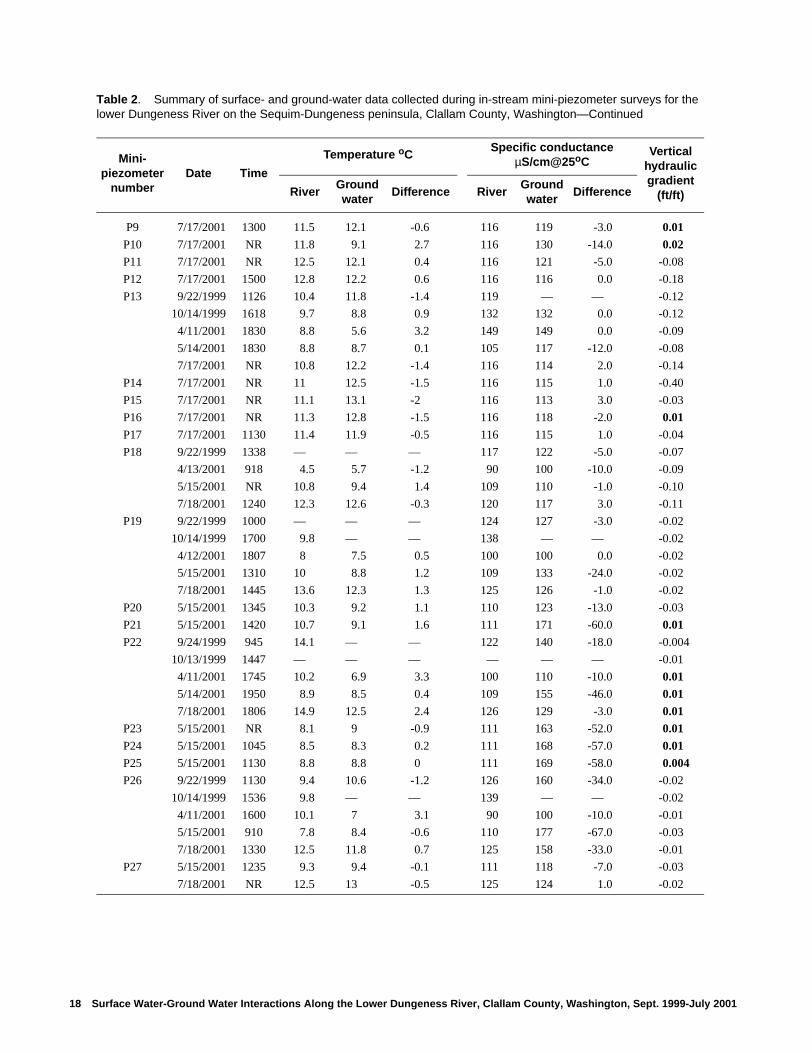
Table 2. Summary of surface- and ground-water data collected during in-stream mini-piezometer surveys for the lower Dungeness River on the Sequim-Dungeness peninsula, Clallam County, Washington
[oC, degrees Celsius; µS/cm@25oC, Specific conductance in microsiemens per centimeter temperature compensated for 25 degrees Celsius; temperature and specific conductance differences were computed as values in the river minus values in the mini-piezometer; ft/ft, feet per feet; NR, time not recorded; —, parameter not measured; positive vertical gradients in bold type]
Data Collection and Methods of Analysis 17
18
P9 7/17/2001 1300 11.5 12.1 -0.6 116 119 -3.0 0.01
P10 7/17/2001 NR 11.8 9.1 2.7 116 130 -14.0 0.02P11 7/17/2001 NR 12.5 12.1 0.4 116 121 -5.0 -0.08
P12 7/17/2001 1500 12.8 12.2 0.6 116 116 0.0 -0.18
P13 9/22/1999 1126 10.4 11.8 -1.4 119 — — -0.12
10/14/1999 1618 9.7 8.8 0.9 132 132 0.0 -0.12
4/11/2001 1830 8.8 5.6 3.2 149 149 0.0 -0.09
5/14/2001 1830 8.8 8.7 0.1 105 117 -12.0 -0.08
7/17/2001 NR 10.8 12.2 -1.4 116 114 2.0 -0.14
P14 7/17/2001 NR 11 12.5 -1.5 116 115 1.0 -0.40
P15 7/17/2001 NR 11.1 13.1 -2 116 113 3.0 -0.03
P16 7/17/2001 NR 11.3 12.8 -1.5 116 118 -2.0 0.01
P17 7/17/2001 1130 11.4 11.9 -0.5 116 115 1.0 -0.04
P18 9/22/1999 1338 — — — 117 122 -5.0 -0.07
4/13/2001 918 4.5 5.7 -1.2 90 100 -10.0 -0.09
5/15/2001 NR 10.8 9.4 1.4 109 110 -1.0 -0.10
7/18/2001 1240 12.3 12.6 -0.3 120 117 3.0 -0.11
P19 9/22/1999 1000 — — — 124 127 -3.0 -0.02
10/14/1999 1700 9.8 — — 138 — — -0.02
4/12/2001 1807 8 7.5 0.5 100 100 0.0 -0.02
5/15/2001 1310 10 8.8 1.2 109 133 -24.0 -0.02
7/18/2001 1445 13.6 12.3 1.3 125 126 -1.0 -0.02
P20 5/15/2001 1345 10.3 9.2 1.1 110 123 -13.0 -0.03
P21 5/15/2001 1420 10.7 9.1 1.6 111 171 -60.0 0.01
P22 9/24/1999 945 14.1 — — 122 140 -18.0 -0.004
10/13/1999 1447 — — — — — — -0.01
4/11/2001 1745 10.2 6.9 3.3 100 110 -10.0 0.01
5/14/2001 1950 8.9 8.5 0.4 109 155 -46.0 0.01
7/18/2001 1806 14.9 12.5 2.4 126 129 -3.0 0.01P23 5/15/2001 NR 8.1 9 -0.9 111 163 -52.0 0.01
P24 5/15/2001 1045 8.5 8.3 0.2 111 168 -57.0 0.01
P25 5/15/2001 1130 8.8 8.8 0 111 169 -58.0 0.004P26 9/22/1999 1130 9.4 10.6 -1.2 126 160 -34.0 -0.02
10/14/1999 1536 9.8 — — 139 — — -0.02
4/11/2001 1600 10.1 7 3.1 90 100 -10.0 -0.01
5/15/2001 910 7.8 8.4 -0.6 110 177 -67.0 -0.03
7/18/2001 1330 12.5 11.8 0.7 125 158 -33.0 -0.01
P27 5/15/2001 1235 9.3 9.4 -0.1 111 118 -7.0 -0.03
7/18/2001 NR 12.5 13 -0.5 125 124 1.0 -0.02
Table 2. Summary of surface- and ground-water data collected during in-stream mini-piezometer surveys for the lower Dungeness River on the Sequim-Dungeness peninsula, Clallam County, Washington—Continued
Mini-piezometer
numberDate Time
Temperature oCSpecific conductance
µS/cm@25oCVertical
hydraulic gradient
(ft/ft)RiverGround water
Difference RiverGround water
Difference
Surface Water-Ground Water Interactions Along the Lower Dungeness River, Clallam County, Washington, Sept. 1999-July 2001
Off-Stream Well Transects
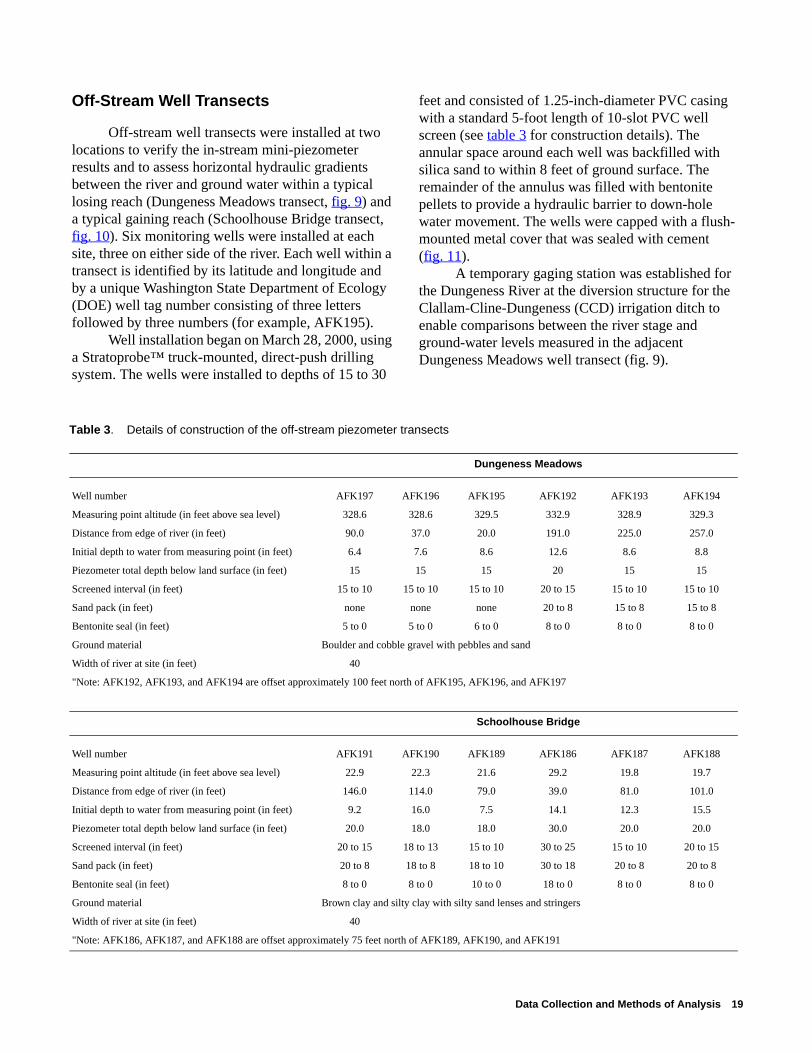
Off-stream well transects were installed at two locations to verify the in-stream mini-piezometer results and to assess horizontal hydraulic gradients between the river and ground water within a typical losing reach (Dungeness Meadows transect, fig. 9) and a typical gaining reach (Schoolhouse Bridge transect, fig. 10). Six monitoring wells were installed at each site, three on either side of the river. Each well within a transect is identified by its latitude and longitude and by a unique Washington State Department of Ecology (DOE) well tag number consisting of three letters followed by three numbers (for example, AFK195).
Well installation began on March 28, 2000, using a Stratoprobe™ truck-mounted, direct-push drilling system. The wells were installed to depths of 15 to 30
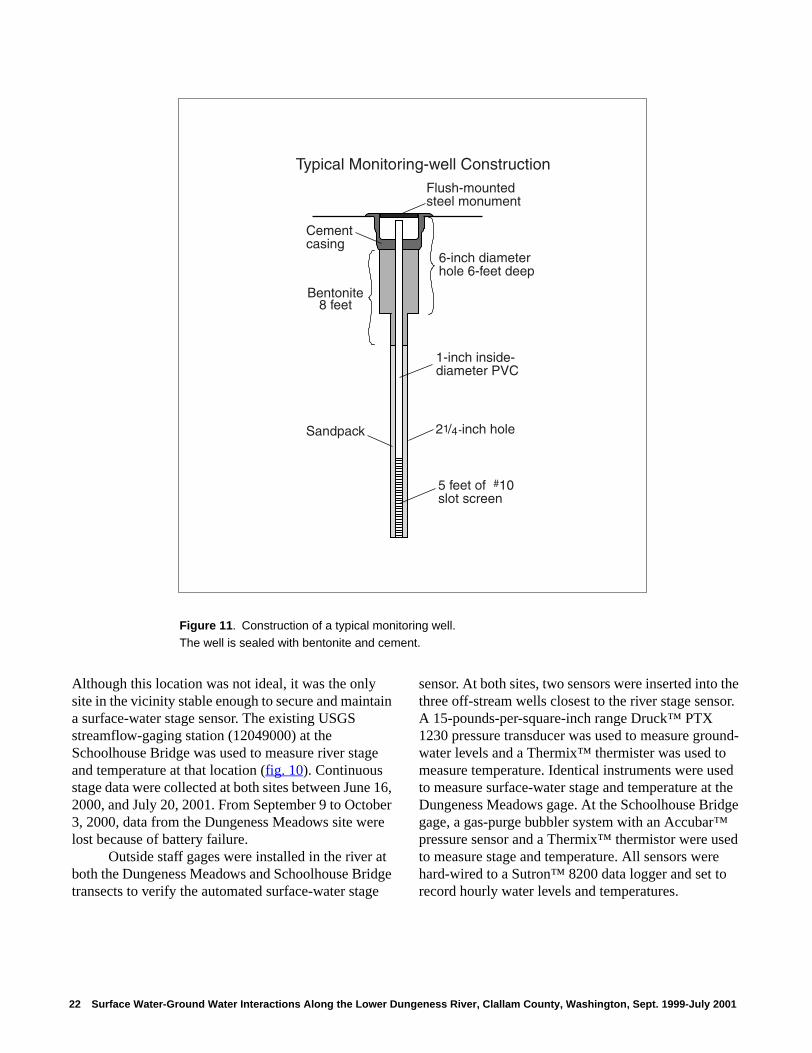
feet and consisted of 1.25-inch-diameter PVC casing with a standard 5-foot length of 10-slot PVC well screen (see table 3 for construction details). The annular space around each well was backfilled with silica sand to within 8 feet of ground surface. The remainder of the annulus was filled with bentonite pellets to provide a hydraulic barrier to down-hole water movement. The wells were capped with a flush-mounted metal cover that was sealed with cement (fig. 11).
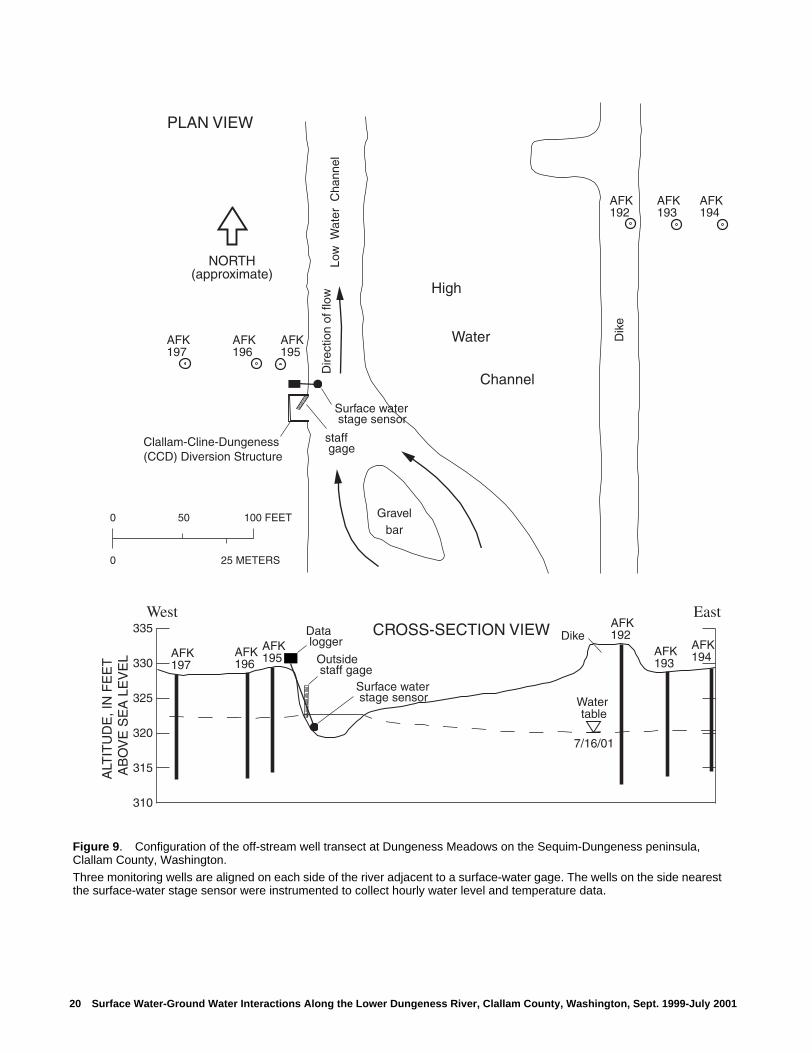
A temporary gaging station was established for the Dungeness River at the diversion structure for the Clallam-Cline-Dungeness (CCD) irrigation ditch to enable comparisons between the river stage and ground-water levels measured in the adjacent Dungeness Meadows well transect (fig. 9).
Table 3. Details of construction of the off-stream piezometer transects
Dungeness Meadows
Well number AFK197 AFK196 AFK195 AFK192 AFK193 AFK194
Measuring point altitude (in feet above sea level) 328.6 328.6 329.5 332.9 328.9 329.3
Distance from edge of river (in feet) 90.0 37.0 20.0 191.0 225.0 257.0
Initial depth to water from measuring point (in feet) 6.4 7.6 8.6 12.6 8.6 8.8
Piezometer total depth below land surface (in feet) 15 15 15 20 15 15
Screened interval (in feet) 15 to 10 15 to 10 15 to 10 20 to 15 15 to 10 15 to 10
Sand pack (in feet) none none none 20 to 8 15 to 8 15 to 8
Bentonite seal (in feet) 5 to 0 5 to 0 6 to 0 8 to 0 8 to 0 8 to 0
Ground material Boulder and cobble gravel with pebbles and sand
Width of river at site (in feet) 40
"Note: AFK192, AFK193, and AFK194 are offset approximately 100 feet north of AFK195, AFK196, and AFK197
Schoolhouse Bridge
Well number AFK191 AFK190 AFK189 AFK186 AFK187 AFK188
Measuring point altitude (in feet above sea level) 22.9 22.3 21.6 29.2 19.8 19.7
Distance from edge of river (in feet) 146.0 114.0 79.0 39.0 81.0 101.0
Initial depth to water from measuring point (in feet) 9.2 16.0 7.5 14.1 12.3 15.5
Piezometer total depth below land surface (in feet) 20.0 18.0 18.0 30.0 20.0 20.0
Screened interval (in feet) 20 to 15 18 to 13 15 to 10 30 to 25 15 to 10 20 to 15
Sand pack (in feet) 20 to 8 18 to 8 18 to 10 30 to 18 20 to 8 20 to 8
Bentonite seal (in feet) 8 to 0 8 to 0 10 to 0 18 to 0 8 to 0 8 to 0
Ground material Brown clay and silty clay with silty sand lenses and stringers
Width of river at site (in feet) 40
"Note: AFK186, AFK187, and AFK188 are offset approximately 75 feet north of AFK189, AFK190, and AFK191
Data Collection and Methods of Analysis 19
Water table
CROSS-SECTION VIEW
PLAN VIEW
NORTH(approximate)
High
Gravelbar
Water
Channel
AFK195
AFK196
AFK197
AFK194
AFK193
AFK192
Low
Wat
er C
hann
el
Surface water stage sensor
staff gage
Dik
e
Dire
ctio
n of
flow
Clallam-Cline-Dungeness (CCD) Diversion Structure
ALT
ITU
DE
, IN
FE
ET
AB
OV
E S
EA
LE
VE
L
335
330
325
320
315
310
AFK192
AFK193
AFK194
AFK195AFK
196AFK197
Dike
Outside staff gage
Surface water stage sensor
Data logger
7/16/01
West East
25 METERS
0 50
0
100 FEET
Figure 9. Configuration of the off-stream well transect at Dungeness Meadows on the Sequim-Dungeness peninsula, Clallam County, Washington.
Three monitoring wells are aligned on each side of the river adjacent to a surface-water gage. The wells on the side nearest the surface-water stage sensor were instrumented to collect hourly water level and temperature data.
20 Surface Water-Ground Water Interactions Along the Lower Dungeness River, Clallam County, Washington, Sept. 1999-July 2001
West East
AFK189
AFK190
AFK191
AFK189
AFK190
AFK191
AFK186
AFK186
AFK187
AFK188
AFK187
AFK188
SCHOOL HOUSE BRIDGEE
LEV
ATIO
N, I
N F
EE
T A
BO
VE
SE
A L
EV
EL 30
35
25
20
15
10
5
-5
0
7/16/01
School House Bridge
Outside staff gage
Outside staff gage
USGS gage
USGSstreamflow
gage12049000
Surface water sensor
Surface water sensor
Water table
Dike
Directi
on of flow
25 METERS
0 50
0
100 FEET
CROSS-SECTION VIEW
PLAN VIEW
NORTH(approximate)
Dik
e
LowW
aterC
hann
elHigh
Wat
erC
hann
el
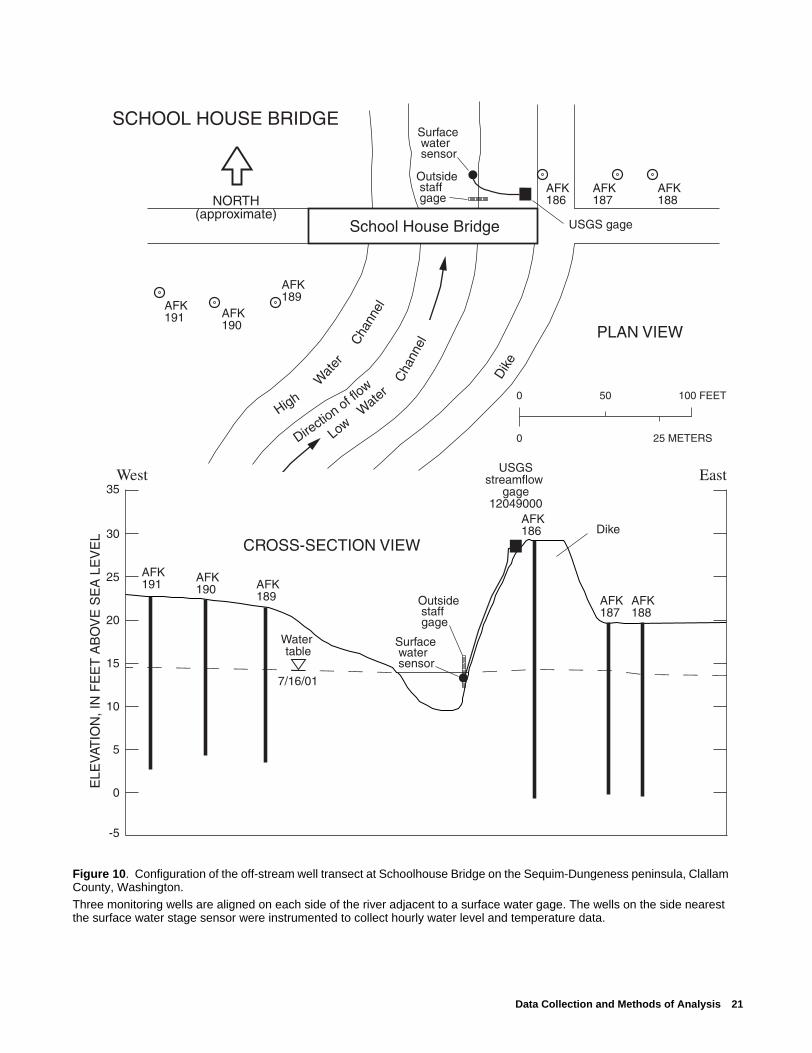
Figure 10. Configuration of the off-stream well transect at Schoolhouse Bridge on the Sequim-Dungeness peninsula, Clallam County, Washington. Three monitoring wells are aligned on each side of the river adjacent to a surface water gage. The wells on the side nearest the surface water stage sensor were instrumented to collect hourly water level and temperature data.
Data Collection and Methods of Analysis 21
2
Flush-mountedsteel monument
Cementcasing
Bentonite
Sandpack
1-inch inside-diameter PVC
21/4 -inch hole
5 feet of #10slot screen
8 feet
6-inch diameterhole 6-feet deep
Typical Monitoring-well Construction
2 Surface Water-G
Figure 11. Construction of a typical monitoring well.
The well is sealed with bentonite and cement.
Although this location was not ideal, it was the only site in the vicinity stable enough to secure and maintain a surface-water stage sensor. The existing USGS streamflow-gaging station (12049000) at the Schoolhouse Bridge was used to measure river stage and temperature at that location (fig. 10). Continuous stage data were collected at both sites between June 16, 2000, and July 20, 2001. From September 9 to October 3, 2000, data from the Dungeness Meadows site were lost because of battery failure.
Outside staff gages were installed in the river at both the Dungeness Meadows and Schoolhouse Bridge transects to verify the automated surface-water stage
sensor. At both sites, two sensors were inserted into the three off-stream wells closest to the river stage sensor. A 15-pounds-per-square-inch range Druck™ PTX 1230 pressure transducer was used to measure ground-water levels and a Thermix™ thermister was used to measure temperature. Identical instruments were used to measure surface-water stage and temperature at the Dungeness Meadows gage. At the Schoolhouse Bridge gage, a gas-purge bubbler system with an Accubar™ pressure sensor and a Thermix™ thermistor were used to measure stage and temperature. All sensors were hard-wired to a Sutron™ 8200 data logger and set to record hourly water levels and temperatures.
round Water Interactions Along the Lower Dungeness River, Clallam County, Washington, Sept. 1999-July 2001
The off-stream well transects were visited monthly to retrieve data and to conduct confirmatory "hand" measurements at the outside staff gages and transect wells. The transect wells with water-level recorders were measured with a steel tape. Those without instrumentation were measured with a Solinst™ water-level E-tape. For non-instrumented wells, temperature and specific conductance were measured using the multi-probe attachments on the Solinst™ meter. The data collected for the monthly confirmatory measurements are compiled in table 8 (at back of report). The monthly hand measurements were used to construct water level profiles of the river and ground water at both well transects.
The continuous river-stage, ground-water altitude, and temperature data for the river and transect wells were entered into the USGS National Water Information System (NWIS) database. The monthly ground-water level and temperature measurements were entered into the USGS Ground Water Site Inventory (GWSI) database. Datum corrections were made (as necessary) to the continuous river-stage and ground-water level data to compensate for instrument drift.
Measuring-point altitudes for the staff gage and off-stream wells at the Schoolhouse Bridge transect were determined using a Wild™ surveyor's level. Measuring points were referenced to a local benchmark of known altitude to an accuracy of +/-0.02 foot. At the Dungeness Meadows site, measuring-point altitudes were determined using differential GPS techniques and are considered accurate to approximately 0.33 foot (Donald Lindorfer, Clallam County Road Department, 2/8-9/2001, written commun.).
INTERACTION BETWEEN THE LOWER DUNGENESS RIVER AND THE WATER-TABLE AQUIFER
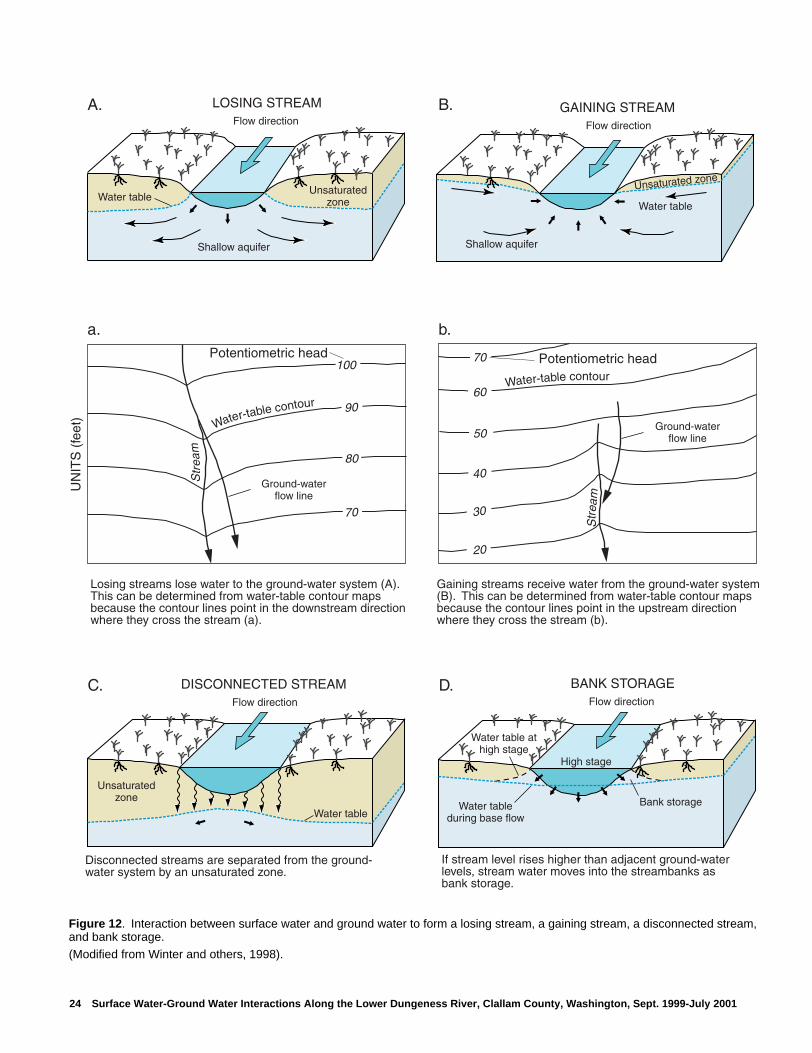
Direct exchanges of water between streams (or rivers) and ground water occur in three basic ways. Streams can gain water from ground-water inflow through their streambed, they can lose water through their streambed to ground water, or they may do both: gaining water in some reaches and losing it in others (Winter and others, 1998).
Water loss from a stream can occur whenever the stream stage exceeds the adjacent ground-water head, regardless of whether the stream and ground water are connected by saturated materials (fig. 12A) or are separated by a zone of unsaturated material (fig. 12C). In order for a stream to gain water directly from ground water, two conditions must exist. First, there must be a saturated connection between the stream and ground water, and second, the ground-water head adjacent to the stream must be higher than the stream surface (stream stage) (fig. 12B).
The rate of water exchange between a stream and ground water depends on several factors, including the vertical hydraulic conductivity of the streambed materials, the vertical hydraulic gradient between the stream and ground water, and the saturated area of the streambed across which flow occurs. When streams are separated from ground water by an unsaturated zone, the rate of streamflow loss depends primarily on the stream depth and the vertical hydraulic conductivity and geometry of the streambed (fig. 12C).
The simplistic depictions of stream and ground-water interchange shown in figures 12A, B, and C are in actuality complicated by the natural heterogeneity of streambed sediments and underlying geologic deposits. Under gaining conditions, lenses or beds of coarse material within finer-gained sediments can preferen-tially transmit and discharge ground water to a stream. When lenses or beds of coarse material occur within a losing stream reach, they may coincide with areas of unusually high water loss. In addition, a stream or stream reach may temporarily change from gaining to losing conditions when snowmelt or precipitation runoff temporarily elevates the river stage and causes it to exceed the head in the surrounding ground water. When the stream stage rises, surface water may be stored in the stream bank adjacent to the river, contributing to a local rise in the water table that persists until streamflow returns to a lower level (fig. 12D).
In the following discussion, surface water and groundwater exchange processes are evaluated in detail for each of the five seepage reaches examined during this study.
Interaction Between the Lower Dungeness River and the Water-Table Aquifer 23
90
80
70
100
40
30
20
50
60
70
Water-table contour
Water-table contour
Ground-waterflow line
Ground-waterflow line
Str
eam
Str
eam
Water table
Shallow aquifer
Flow direction
LOSING STREAM
Unsaturatedzone
Potentiometric head Potentiometric head
A.
a. b.
Losing streams lose water to the ground-water system (A).This can be determined from water-table contour mapsbecause the contour lines point in the downstream direction where they cross the stream (a).
Gaining streams receive water from the ground-water system(B). This can be determined from water-table contour mapsbecause the contour lines point in the upstream direction where they cross the stream (b).
Water table
Shallow aquifer
Flow direction
GAINING STREAM
Unsaturated zone
C.
UN
ITS
(fe
et)
Flow direction
BANK STORAGE
Water tableduring base flow
Bank storage
High stage
Water table athigh stage
D.
If stream level rises higher than adjacent ground-waterlevels, stream water moves into the streambanks asbank storage.
DISCONNECTED STREAMFlow direction
Water table
Unsaturatedzone
B.
Disconnected streams are separated from the ground-water system by an unsaturated zone.
Figure 12. Interaction between surface water and ground water to form a losing stream, a gaining stream, a disconnected stream, and bank storage.
(Modified from Winter and others, 1998).
24 Surface Water-Ground Water Interactions Along the Lower Dungeness River, Clallam County, Washington, Sept. 1999-July 2001
Seepage Reach 1
Seepage reach 1 is approximately 3.7 miles in length and extends from river mile 11.8, at the USGS streamgaging station near Sequim (12048000), to the upper end of the Dungeness Meadows development at river mile 8.1 (fig. 13). The upper 0.7 mile of reach 1 lies within an alluvium-filled bedrock channel. The river flows directly over bedrock just below piezometer P2, where it is confined by a short bedrock constriction (fig. 14). Below the constriction the river widens and flows across poorly sorted deposits of coarse gravel and boulders that define the southern extent of the regional ground-water flow system for the Sequim-Dungeness Peninsula. Several small private levees protect homes from flooding within this reach.
Based on the results of three seepage runs, the river showed a net loss of 2.1 to 4.1 ft3/s per river mile through reach 1. The largest loss occurred during the seepage run on April 10-11, 2000, when the river lost approximately 15 ft3/s, or 4.6 percent of its total flow through this reach (fig. 13). The smallest loss occurred during the seepage run on October 4, 2000, when the river lost approximately 8 ft3/s, or 5.9 percent of its total flow. The rate of streamflow loss for the three seepage runs was correlated with the river discharge and increased with increasing river flows (fig. 15). However, with only three data points, this correlation may not be statistically significant, and it is uncertain if this correlation is valid at higher flows.
Data from the mini-piezometers in reach 1 generally support these seepage results (fig. 13). Mini-piezometers P1, P3, and P4 exhibited negative hydraulic gradients ranging from -0.04 to -1.04 ft/ft. The average gradient for these piezometers was -0.15, -0.86, and -0.16 ft/ft for piezometers P1, P3, and P4 respectively (table 4). In contrast to the other piezometers in reach 1, piezometer P2 had an average gradient of about +0.04 ft/ft and consistently indicated a slight positive gradient, or ground-water discharge conditions. The positive gradients observed at piezometer P2 likely result from a bedrock constriction just downstream of this site that forces ground water to the surface as it moves down the river valley.
Together, the seepage run and mini-piezometer data suggest that the Dungeness River consistently loses water through reach 1 except in the vicinity of piezometer P2, where ground water is forced to the surface for a short distance as it passes a bedrock constriction.
Seepage Reach 2
Seepage reach 2 is approximately 2.6 miles in length and extends from the upstream end of the Dungeness Meadows Subdivision at river mile 8.1 to just above the Railroad Bridge Park at river mile 5.5. In this reach, the river flows across coarse deposits of poorly sorted gravel and cobbles. The channel is braided with numerous bars and islands and alternating pools and riffles. The river is restricted from a portion of its floodplain by a levee on the right bank that protects the Dungeness Meadows Subdivision from flooding. The levee prevents the river channel from migrating eastward and creates a straight reach where pools are filled in and large longitudinal cobble bars are common. Below the Dungeness Meadows levee, scouring and gravel deposition allow the channel to return to its braided configuration.
Based on three seepage runs, the river showed a net gain of approximately 0.23 to 3.5 ft3/s per river mile through reach 2. The largest gain occurred during the seepage run on April 10-11, 2000, when the river gained approximately 9 ft3/s, or approximately 3 percent of the total flow measured at the upper seepage transect (fig. 13). The smallest gain occurred during the seepage run on October 4, 2000, when the river gained approximately 0.6 ft3/s, or approximately 0.5 percent of its total flow. Like reach 1, the rate of stream-flow loss was correlated with the river discharge and increased with increasing river flows (fig. 15). Again, this correlation may not be statistically significant and it is uncertain if the correlation is valid at higher flows.
Interaction Between the Lower Dungeness River and the Water-Table Aquifer 25
Figure 13. Results of the seepage runs on the five study reaches of the lower Dungeness River on the Sequim-Dungeness peninsula, Clallam County, Washington, April 11 and October 4, 2000, and April 12, 2001.
Dunge
ness
Bay
DU
NG
EN
ES
S
RIV
ER
DU
NG
EN
ES
S
RIV
ER
Mat
riotti
C
r.
Hu
rd
Cre
ek
Cas
sale ry
C
r.
Gier i n
C
r.
Bell Creek
Jo
hnson
Cre
ek
Mea
dow
bro
ok
Cr
Bea
r
Cr
C
a ny
on C
r
US101
Sequim
R. 4 W. R. 3 W.
T.31N.
T.30N.
T.29N.
DungenessMeadows
SchoolhouseBridge
S11
S15
S12
S10
S5
S7S8
S1
S2 S3
S4
S6
S9
S13 S14
4-11-0010-4-00
4-12-01
-11.6-6.6
-4.7
4-11-00
10-4-004-12-01
+16.0
-5.1+9.3
4-11-0010-4-004-12-01
+9.2+0.6+2.8
4-11-00
10-4-004-12-01
-23.9
-1.1-10.4
4-11-00
10-4-00
4-12-01
-15.1
-8.0
-9.1
Reach 1
Reach 2
Reach 3
Reach 4
Reach 5
Date
Gains/Losses, in cubic feet per second
Date
Gains/Losses, in cubic feet per second
Date
Gains/Losses, in cubic feet per second
Date
Gains/Losses, in cubic feet per second
Date
Gains/Losses, in cubic feet per second
EXPLANATION
Seepage-reach-extent measurement site (Results shown in bold are less than 5 percent of the measured flow)
Off-stream well transect
RiverTributary InputsIrrigation Outtakes
1 2 MILES
0
0
1 2 KILOMETERS
26 Surface Water-Ground Water Interactions Along the Lower Dungeness River, Clallam County, Washington, Sept. 1999-July 2001
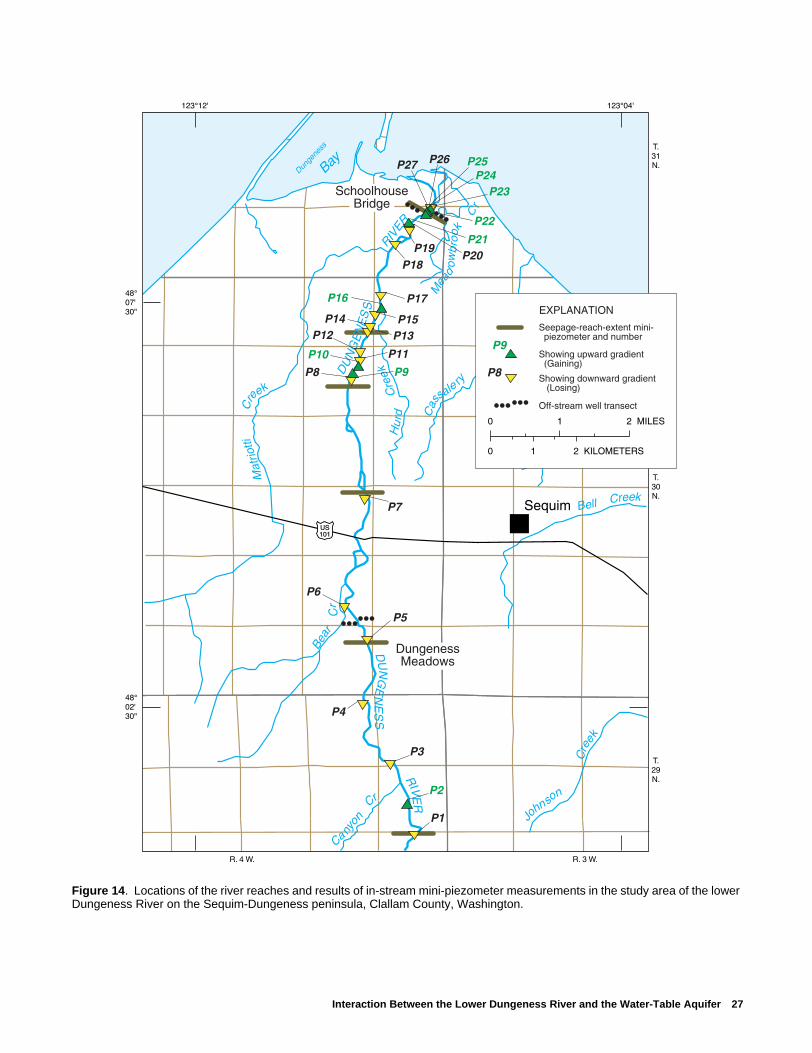
Figure 14. Locations of the river reaches and results of in-stream mini-piezometer measurements in the study area of the lower Dungeness River on the Sequim-Dungeness peninsula, Clallam County, Washington.
Dunge
ness
Bay
US101
Sequim
R. 4 W. R. 3 W.
T.31N.
T.30N.
T.29N.
DungenessMeadows
SchoolhouseBridge
Mat
riotti
C
re
ekH
urd
C
reek
Cas
sale ry
C
re
ek
Gier i n
C
re
ek
Bell Creek
Jo
hnson
Cre
ek
Mea
dow
bro
ok
Cr
Bea
r
Cr
C
a ny
on C
r
DU
NG
EN
ES
S
R
IVER
DU
NG
EN
ES
S
RIV
ER
P8
P7
P6
P5
P4
P1
P20P19
P18
P17
P15P14P13P12
P11
P26P27
P3
P9
P21
P24P25
P16
P10
P23
P22
P2
EXPLANATION
Showing upward gradient (Gaining)
Showing downward gradient (Losing)
Seepage-reach-extent mini- piezometer and number
Off-stream well transect
1 2 MILES
0
0
1 2 KILOMETERS
P9
P8
Interaction Between the Lower Dungeness River and the Water-Table Aquifer 27
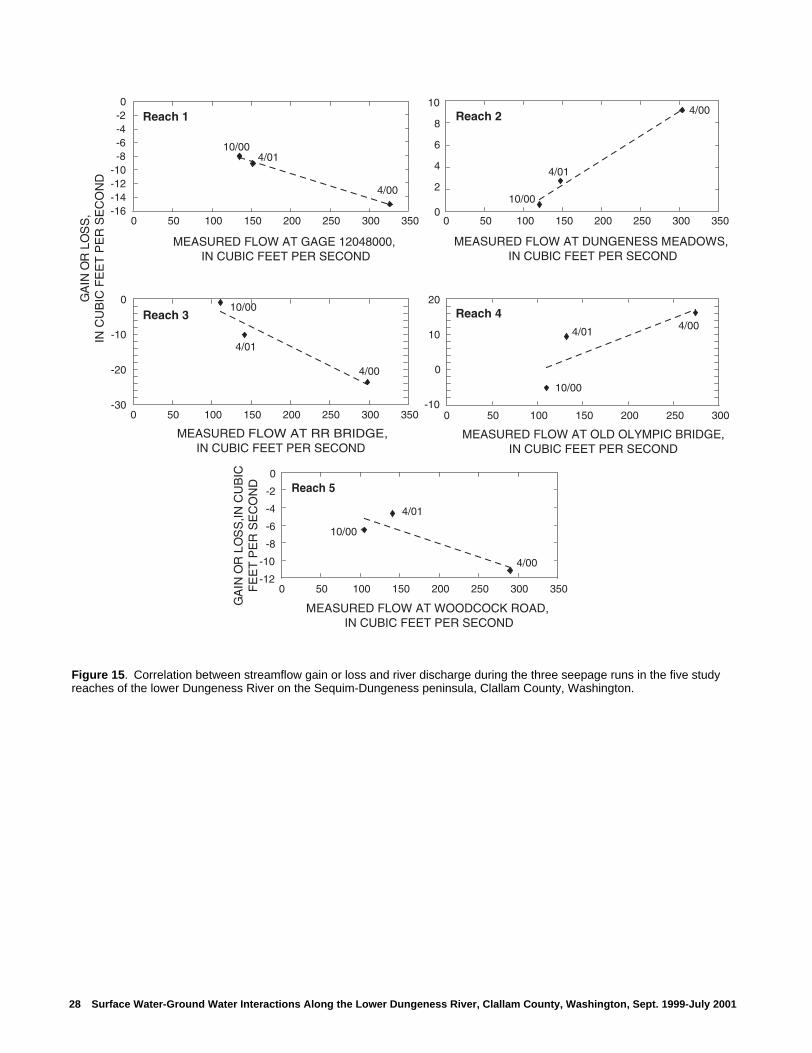
-16-14-12-10-8-6-4-20
0 50 100 150 200 250 300 350
MEASURED FLOW AT GAGE 12048000, IN CUBIC FEET PER SECOND
0 50 100 150 200 250 300 350
MEASURED FLOW AT DUNGENESS MEADOWS, IN CUBIC FEET PER SECOND
-30
-20
-10
0
0 50 100 150 200 250 300 350
MEASURED FLOW AT RR BRIDGE,IN CUBIC FEET PER SECOND
GA
IN O
R L
OS
S,
IN C
UB
IC F
EE
T P
ER
SE
CO
ND
GA
IN O
R L
OS
S,IN
CU
BIC
F
EE
T P
ER
SE
CO
ND
0 50 100 150 200 250 300
MEASURED FLOW AT OLD OLYMPIC BRIDGE,IN CUBIC FEET PER SECOND
-12
-10
-8
-6
-4
-2
0
0 50 100 150 200 250 300 350
MEASURED FLOW AT WOODCOCK ROAD, IN CUBIC FEET PER SECOND
Reach 1 Reach 2
Reach 3 Reach 4
Reach 5
4/00
4/00
4/00
4/00
4/01
10/00
4/01
4/014/01
4/01
10/00
10/00
10/00
10/00
0
2
4
6
8
10
-10
0
10
20
4/00
Figure 15. Correlation between streamflow gain or loss and river discharge during the three seepage runs in the five study reaches of the lower Dungeness River on the Sequim-Dungeness peninsula, Clallam County, Washington.
28 Surface Water-Ground Water Interactions Along the Lower Dungeness River, Clallam County, Washington, Sept. 1999-July 2001
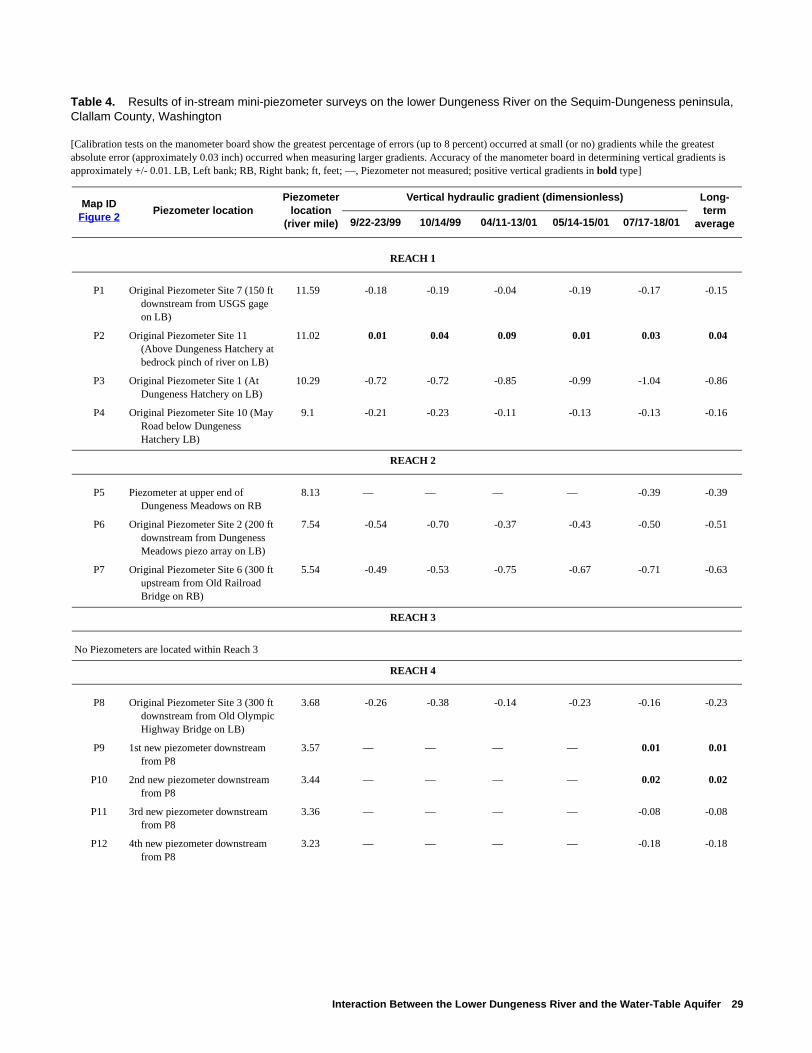
Table 4. Results of in-stream mini-piezometer surveys on the lower Dungeness River on the Sequim-Dungeness peninsula,
Table 4. Results of in-stream mini-piezometer surveys on the lower Dungeness River on the Sequim-Dungeness peninsula, Clallam County, Washington—Continued
Map IDFigure 2
Piezometer locationPiezometer
location (river mile)
Vertical hydraulic gradient (dimensionless) Long- term
average9/22-23/99 10/14/99 04/11-13/01 05/14-15/01 07/17-18/01
REACH 1
P1 Original Piezometer Site 7 (150 ft downstream from USGS gage on LB)
11.59 -0.18 -0.19 -0.04 -0.19 -0.17 -0.15
P2 Original Piezometer Site 11 (Above Dungeness Hatchery at bedrock pinch of river on LB)
11.02 0.01 0.04 0.09 0.01 0.03 0.04
P3 Original Piezometer Site 1 (At Dungeness Hatchery on LB)
10.29 -0.72 -0.72 -0.85 -0.99 -1.04 -0.86
P4 Original Piezometer Site 10 (May Road below Dungeness Hatchery LB)
9.1 -0.21 -0.23 -0.11 -0.13 -0.13 -0.16
REACH 2
P5 Piezometer at upper end of Dungeness Meadows on RB
8.13 — — — — -0.39 -0.39
P6 Original Piezometer Site 2 (200 ft downstream from Dungeness Meadows piezo array on LB)
7.54 -0.54 -0.70 -0.37 -0.43 -0.50 -0.51
P7 Original Piezometer Site 6 (300 ft upstream from Old Railroad Bridge on RB)
5.54 -0.49 -0.53 -0.75 -0.67 -0.71 -0.63
REACH 3
No Piezometers are located within Reach 3
REACH 4
P8 Original Piezometer Site 3 (300 ft downstream from Old Olympic Highway Bridge on LB)
3.68 -0.26 -0.38 -0.14 -0.23 -0.16 -0.23
P9 1st new piezometer downstream from P8
3.57 — — — — 0.01 0.01
P10 2nd new piezometer downstream from P8
3.44 — — — — 0.02 0.02
P11 3rd new piezometer downstream from P8
3.36 — — — — -0.08 -0.08
P12 4th new piezometer downstream from P8
3.23 — — — — -0.18 -0.18
Clallam County, Washington
[Calibration tests on the manometer board show the greatest percentage of errors (up to 8 percent) occurred at small (or no) gradients while the greatest absolute error (approximately 0.03 inch) occurred when measuring larger gradients. Accuracy of the manometer board in determining vertical gradients is approximately +/- 0.01. LB, Left bank; RB, Right bank; ft, feet; —, Piezometer not measured; positive vertical gradients in bold type]
Interaction Between the Lower Dungeness River and the Water-Table Aquifer 29
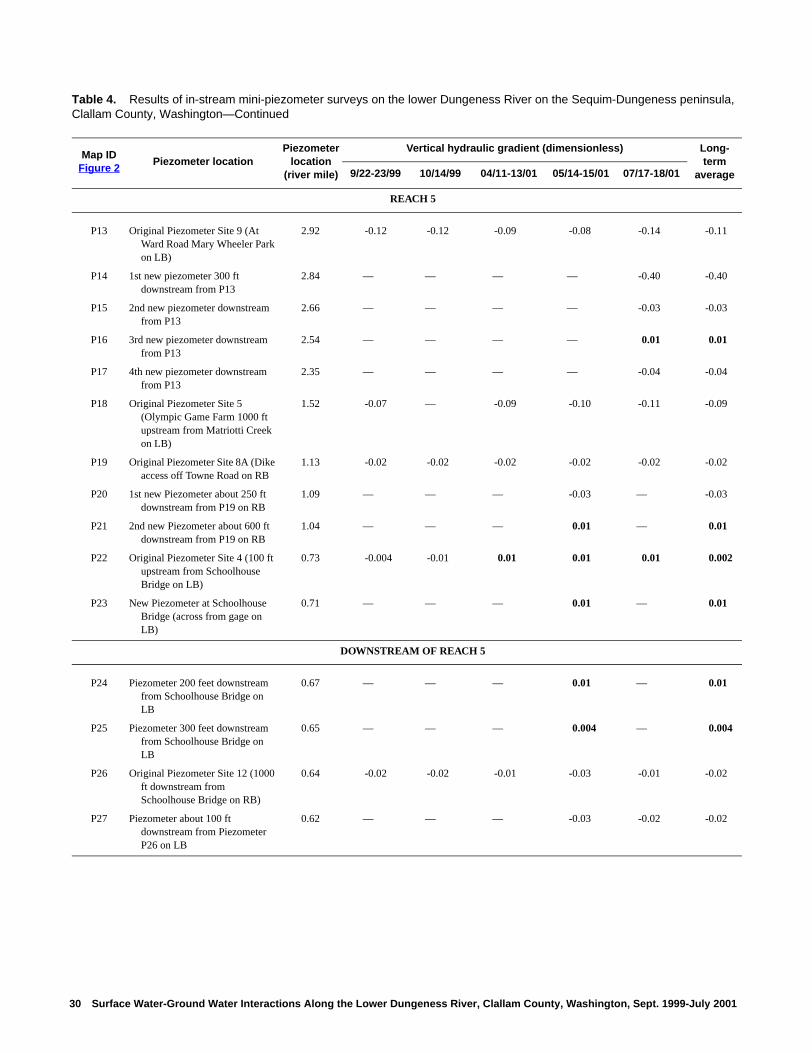
REACH 5
P13 Original Piezometer Site 9 (At Ward Road Mary Wheeler Park on LB)
2.92 -0.12 -0.12 -0.09 -0.08 -0.14 -0.11
P14 1st new piezometer 300 ft downstream from P13
2.84 — — — — -0.40 -0.40
P15 2nd new piezometer downstream from P13
2.66 — — — — -0.03 -0.03
P16 3rd new piezometer downstream from P13
2.54 — — — — 0.01 0.01
P17 4th new piezometer downstream from P13
2.35 — — — — -0.04 -0.04
P18 Original Piezometer Site 5 (Olympic Game Farm 1000 ft upstream from Matriotti Creek on LB)
1.52 -0.07 — -0.09 -0.10 -0.11 -0.09
P19 Original Piezometer Site 8A (Dike access off Towne Road on RB
1.13 -0.02 -0.02 -0.02 -0.02 -0.02 -0.02
P20 1st new Piezometer about 250 ft downstream from P19 on RB
1.09 — — — -0.03 — -0.03
P21 2nd new Piezometer about 600 ft downstream from P19 on RB
1.04 — — — 0.01 — 0.01
P22 Original Piezometer Site 4 (100 ft upstream from Schoolhouse Bridge on LB)
0.73 -0.004 -0.01 0.01 0.01 0.01 0.002
P23 New Piezometer at Schoolhouse Bridge (across from gage on LB)
0.71 — — — 0.01 — 0.01
DOWNSTREAM OF REACH 5
P24 Piezometer 200 feet downstream from Schoolhouse Bridge on LB
0.67 — — — 0.01 — 0.01
P25 Piezometer 300 feet downstream from Schoolhouse Bridge on LB
0.65 — — — 0.004 — 0.004
P26 Original Piezometer Site 12 (1000 ft downstream from Schoolhouse Bridge on RB)
0.64 -0.02 -0.02 -0.01 -0.03 -0.01 -0.02
P27 Piezometer about 100 ft downstream from Piezometer P26 on LB
0.62 — — — -0.03 -0.02 -0.02
Table 4. Results of in-stream mini-piezometer surveys on the lower Dungeness River on the Sequim-Dungeness peninsula, Clallam County, Washington—Continued
Map IDFigure 2
Piezometer locationPiezometer
location (river mile)
Vertical hydraulic gradient (dimensionless) Long- term
average9/22-23/99 10/14/99 04/11-13/01 05/14-15/01 07/17-18/01
30 Surface Water-Ground Water Interactions Along the Lower Dungeness River, Clallam County, Washington, Sept. 1999-July 2001
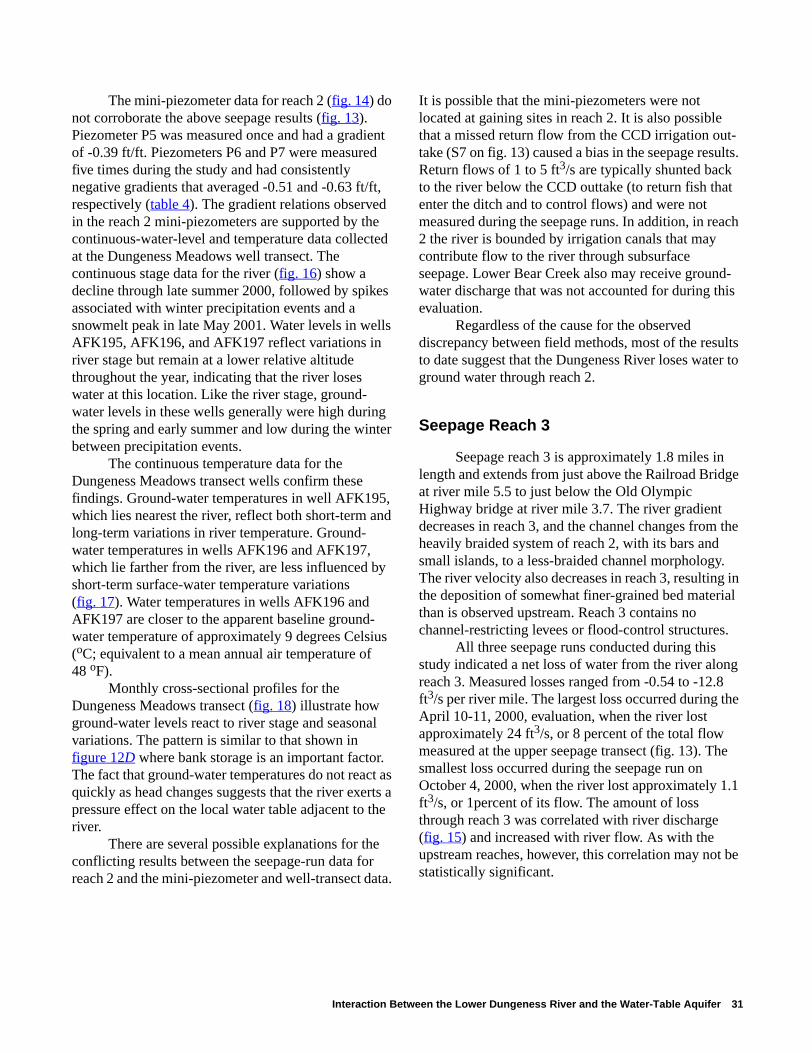
The mini-piezometer data for reach 2 (fig. 14) do not corroborate the above seepage results (fig. 13). Piezometer P5 was measured once and had a gradient of -0.39 ft/ft. Piezometers P6 and P7 were measured five times during the study and had consistently negative gradients that averaged -0.51 and -0.63 ft/ft, respectively (table 4). The gradient relations observed in the reach 2 mini-piezometers are supported by the continuous-water-level and temperature data collected at the Dungeness Meadows well transect. The continuous stage data for the river (fig. 16) show a decline through late summer 2000, followed by spikes associated with winter precipitation events and a snowmelt peak in late May 2001. Water levels in wells AFK195, AFK196, and AFK197 reflect variations in river stage but remain at a lower relative altitude throughout the year, indicating that the river loses water at this location. Like the river stage, ground-water levels in these wells generally were high during the spring and early summer and low during the winter between precipitation events.
The continuous temperature data for the Dungeness Meadows transect wells confirm these findings. Ground-water temperatures in well AFK195, which lies nearest the river, reflect both short-term and long-term variations in river temperature. Ground-water temperatures in wells AFK196 and AFK197, which lie farther from the river, are less influenced by short-term surface-water temperature variations (fig. 17). Water temperatures in wells AFK196 and AFK197 are closer to the apparent baseline ground-water temperature of approximately 9 degrees Celsius (oC; equivalent to a mean annual air temperature of 48 oF).
Monthly cross-sectional profiles for the Dungeness Meadows transect (fig. 18) illustrate how ground-water levels react to river stage and seasonal variations. The pattern is similar to that shown in figure 12D where bank storage is an important factor. The fact that ground-water temperatures do not react as quickly as head changes suggests that the river exerts a pressure effect on the local water table adjacent to the river.
There are several possible explanations for the conflicting results between the seepage-run data for reach 2 and the mini-piezometer and well-transect data.
It is possible that the mini-piezometers were not located at gaining sites in reach 2. It is also possible that a missed return flow from the CCD irrigation out-take (S7 on fig. 13) caused a bias in the seepage results. Return flows of 1 to 5 ft3/s are typically shunted back to the river below the CCD outtake (to return fish that enter the ditch and to control flows) and were not measured during the seepage runs. In addition, in reach 2 the river is bounded by irrigation canals that may contribute flow to the river through subsurface seepage. Lower Bear Creek also may receive ground-water discharge that was not accounted for during this evaluation.
Regardless of the cause for the observed discrepancy between field methods, most of the results to date suggest that the Dungeness River loses water to ground water through reach 2.
Seepage Reach 3
Seepage reach 3 is approximately 1.8 miles in length and extends from just above the Railroad Bridge at river mile 5.5 to just below the Old Olympic Highway bridge at river mile 3.7. The river gradient decreases in reach 3, and the channel changes from the heavily braided system of reach 2, with its bars and small islands, to a less-braided channel morphology. The river velocity also decreases in reach 3, resulting in the deposition of somewhat finer-grained bed material than is observed upstream. Reach 3 contains no channel-restricting levees or flood-control structures.
All three seepage runs conducted during this study indicated a net loss of water from the river along reach 3. Measured losses ranged from -0.54 to -12.8 ft3/s per river mile. The largest loss occurred during the April 10-11, 2000, evaluation, when the river lost approximately 24 ft3/s, or 8 percent of the total flow measured at the upper seepage transect (fig. 13). The smallest loss occurred during the seepage run on October 4, 2000, when the river lost approximately 1.1 ft3/s, or 1percent of its flow. The amount of loss through reach 3 was correlated with river discharge (fig. 15) and increased with river flow. As with the upstream reaches, however, this correlation may not be statistically significant.
Interaction Between the Lower Dungeness River and the Water-Table Aquifer 31
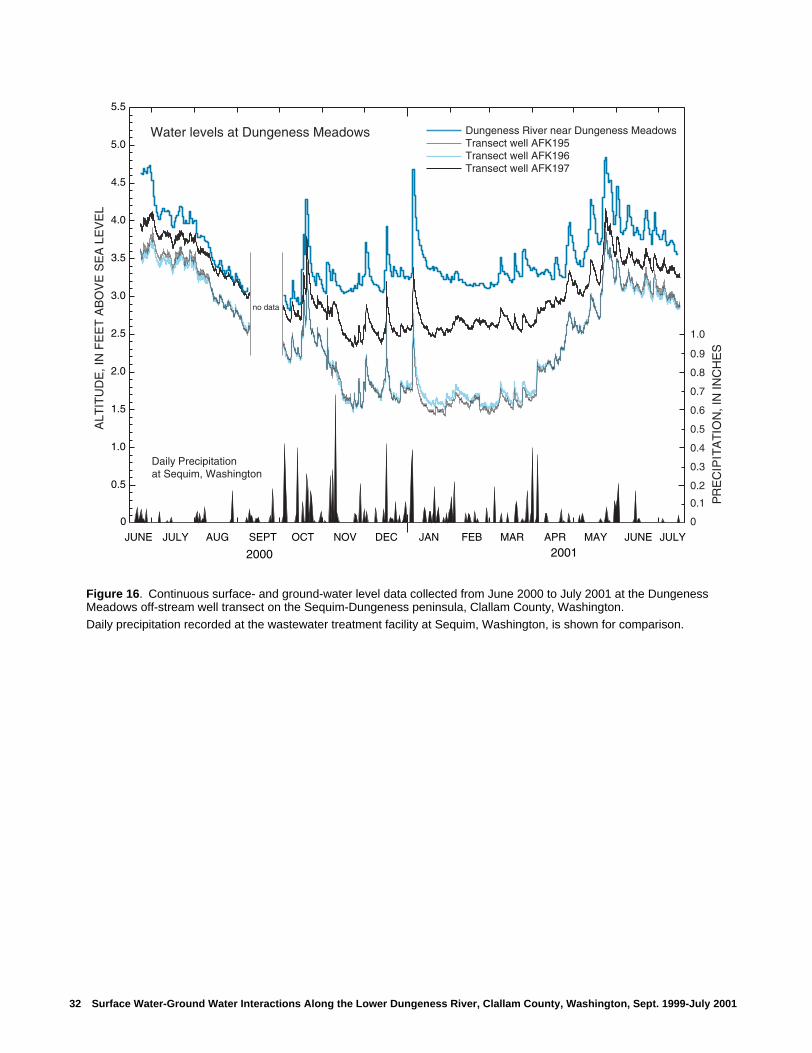
2000
JUNE JULY AUG SEPT OCT NOV DEC
2001JAN FEB MAR APR MAY JUNE JULY
0.5
0
1.0
1.5
2.0
2.5
3.0
3.5
4.0
4.5
5.0
5.5
no data
PR
EC
IPIT
AT
ION
, IN
INC
HE
S
Water levels at Dungeness Meadows
ALT
ITU
DE
, IN
FE
ET
AB
OV
E S
EA
LE
VE
L
Dungeness River near Dungeness MeadowsTransect well AFK195Transect well AFK196Transect well AFK197
Daily Precipitation at Sequim, Washington
0.1
0
0.2
0.3
0.4
0.5
0.6
0.7
0.8
0.9
1.0
3
Figure 16. Continuous surface- and ground-water level data collected from June 2000 to July 2001 at the Dungeness Meadows off-stream well transect on the Sequim-Dungeness peninsula, Clallam County, Washington.
Daily precipitation recorded at the wastewater treatment facility at Sequim, Washington, is shown for comparison.
2 Surface Water-Ground Water Interactions Along the Lower Dungeness River, Clallam County, Washington, Sept. 1999-July 2001
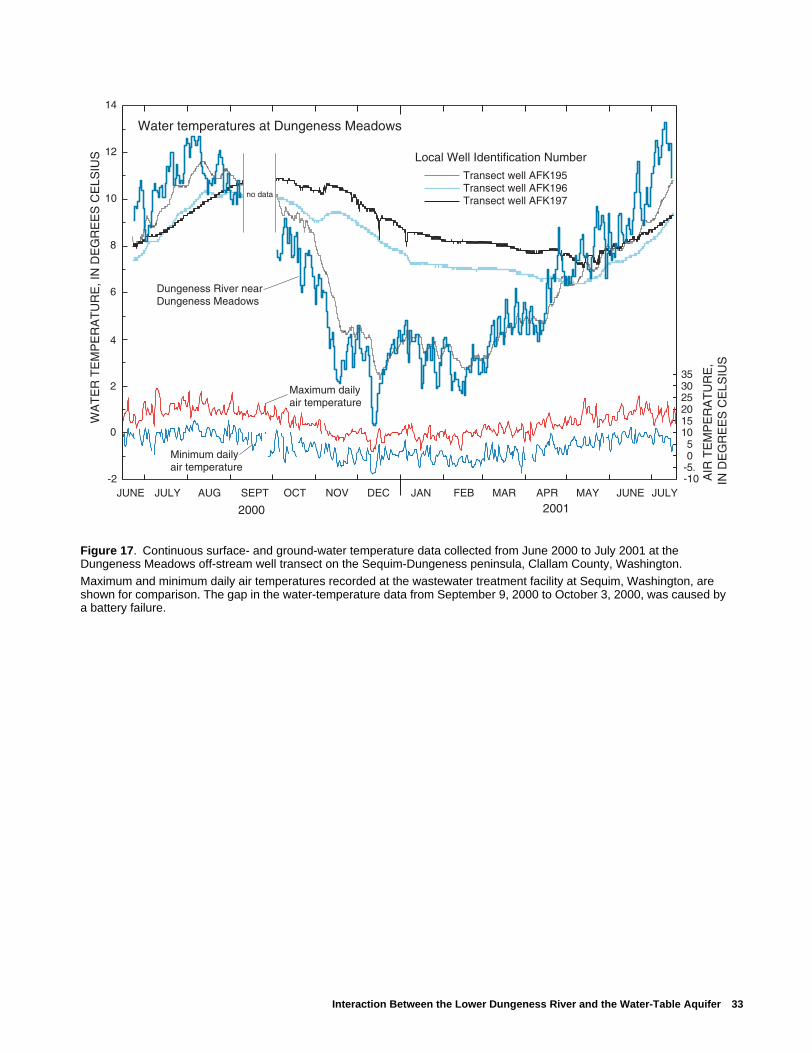
6
4
2
-2
0
8
10
12
14
no data
WA
TE
R T
EM
PE
RA
TU
RE
, IN
DE
GR
EE
S C
ELS
IUS
AIR
TE
MP
ER
AT
UR
E,
IN D
EG
RE
ES
CE
LSIU
S
-5.-10
05
101520253035
Maximum daily air temperature
Minimum daily air temperature
2000
JUNE JULY AUG SEPT OCT NOV DEC
2001JAN FEB MAR APR MAY JUNE JULY
Water temperatures at Dungeness Meadows
Dungeness River nearDungeness Meadows
Local Well Identification Number
Transect well AFK195Transect well AFK196Transect well AFK197
Figure 17. Continuous surface- and ground-water temperature data collected from June 2000 to July 2001 at the Dungeness Meadows off-stream well transect on the Sequim-Dungeness peninsula, Clallam County, Washington.
Maximum and minimum daily air temperatures recorded at the wastewater treatment facility at Sequim, Washington, are shown for comparison. The gap in the water-temperature data from September 9, 2000 to October 3, 2000, was caused by a battery failure.
Interaction Between the Lower Dungeness River and the Water-Table Aquifer 33
AFK197
AFK196AFK195
AFK192
AFK193
AFK194
July
16,
200
1
AFK197
AFK196AFK195
AFK192
AFK193
AFK194
June
19,
200
1
AFK197
AFK196AFK195
AFK192
AFK193
AFK194
May
14,
200
1
AFK197
AFK196AFK195
AFK192
AFK193
AFK194
Apr
il 11
, 200
1
AFK197
AFK196AFK195
AFK192
AFK193
AFK194
Mar
ch 1
4, 2
001
AFK197
AFK196AFK195
AFK192
AFK193
AFK194
Feb
ruar
y 15
, 200
1
AFK197
AFK196AFK195
AFK192
AFK193
AFK194
Janu
ary
16, 2
001
AFK197
AFK196AFK195
AFK192
AFK193
AFK194
Dec
embe
r 12
, 200
0
AFK197
AFK196AFK195
AFK192
AFK193
AFK194
Nov
embe
r 10
, 200
0
AFK197
AFK196AFK195
AFK192
AFK193
AFK194
Oct
ober
3, 2
000
AFK197
AFK196AFK195
AFK192
AFK193
AFK194
Sep
tem
ber
8, 2
000
AFK197
AFK196AFK195
AFK192
AFK193
AFK194
Aug
ust 1
0, 2
000
AFK197
AFK196AFK195
AFK192
AFK193
AFK194
June
20,
200
0
AFK197
AFK196AFK195
AFK192
AFK193
AFK194
May
17,
200
0
AFK197
AFK196AFK195
AFK192
AFK193
AFK194
May
2, 2
000
335
330
325
320
315
310
335
330
325
320
315
310
335
330
325
320
315
310
335
330
325
320
315
310
AFK197
AFK196AFK195
AFK192
AFK193
AFK194
Mar
ch 2
9, 2
000
ELEVATION, IN FEET ABOVE SEA LEVEL
34 Surface Water-Ground Water Interactions Along the Lower Dungeness River, Clallam County, Washington, Sept. 1999-
Fig
ure
18.
Wat
er-le
vel p
rofil
es o
f the
wat
er-t
able
aqu
ifer,
con
stru
cted
from
mon
thly
wat
er-le
vel m
easu
rem
ents
at t
he D
unge
ness
Mea
dow
s of
f-st
ream
w
ell t
rans
ect o
n th
e S
equi
m-D
unge
ness
pen
insu
la, C
lalla
m C
ount
y, W
ashi
ngto
n.M
onito
ring
wel
ls o
n th
e rig
ht s
ide
of th
e pr
ofile
are
offs
et a
ppro
xim
atel
y 10
0 fe
et d
owns
trea
m fr
om w
ells
on
the
left
side
. The
wat
er-le
vel d
ata
are
show
n in
ta
ble
8 . A
pro
file
for
Aug
ust 1
, 200
0, is
not
incl
uded
bec
ause
of q
uest
iona
ble
data
.
July 2001

Reach 3 contained no in-stream mini-piezometers. However, piezometers P7 and P8, installed just beyond the upper and lower ends of the reach, indicated negative hydraulic gradients, supporting the losses observed during the seepage evaluations (fig. 14). Both mini-piezometers consistently exhibited strong negative hydraulic gradients during each of five measurements, and had average gradients of -0.63 and -0.23 ft/ft for piezometers P7 and P8, respectively, suggesting that the river consistently loses water through this reach.
Seepage Reach 4
Seepage reach 4 is approximately 0.8 mile in length and extends from just below the Old Olympic Highway Bridge at river mile 3.7 to just below the Woodcock Road Bridge at river mile 2.9. The active channel of reach 4 tends to be narrower than any of the upstream reaches, despite the absence of bounding levees or flood-control structures. The streambed within this reach is characterized by an abundance of sand, coarse gravel, and small cobbles (Jenifer Bountry, Bureau of Reclamation, Oct. 25, 2001, oral communication).
The seepage-run and mini-piezometer data suggest the occurrence of short, interspersed gaining and losing stream segments throughout reach 4. Net streamflow gains of 12.2 to 21.1 ft3/s per river mile were observed during two seepage runs of reach 4, whereas the third seepage run showed a net loss of -6.7 ft3/s per river mile. The largest gain, 16 ft3/s, occurred during the seepage run on April 10-11, 2000, and represented 5.8 percent of the total river flow measured at the upper seepage transect (fig. 13). The smallest gain, 9.3 ft3/s, occurred during the seepage run on April 12, 2001, and represented about 7 percent of the river flow. A loss of -5.1 ft3/s was observed during the seepage run on October 4, 2000, and represented about 4.6 percent of the river flow. The relation between seepage rate and river discharge was less clear for reach 4 than it was for reaches 1 and 3 where the river consistently lost water (fig. 15).
The in-stream mini-piezometers within reach 4 (P8-P12) reveal alternating positive and negative gradients over distances of less than a third of a mile (fig. 14). Piezometers P9 and P10 had slight upward gradients ranging from +0.01 to +0.02 ft/ft. Piezometers P8, P11, and P12 had negative gradients ranging from -0.08 to -0.23 ft/ft. The presence of positive and negative gradients in the mini-piezometers over relatively short distances may be attributable in part to locally high ground-water levels in the vicinity. Springs that feed lower Hurd Creek are evidence of near-surface ground water that locally may contribute flow to the Dungeness River through this reach.
Seepage Reach 5
Seepage reach 5 is approximately 2.2 miles long and extends from river mile 2.9, below the Woodcock Road Bridge, to the Schoolhouse Road Bridge at river mile 0.7. Like reach 4, the streambed in reach 5 is composed of relatively fined-grained sand, coarse gravel, and small cobbles. The east side of the river is entirely bounded by a levee, and the west side is partially bounded by a levee and a prominent bluff of glacial outwash. These features restrict the position of the active channel and prevent over-bank deposition of sediment load, resulting in aggradation of the streambed (Jenifer Bountry, Bureau of Reclamation, Oct. 25, 2001, oral communication). At present, the streambed within reach 5 is locally elevated above the adjacent floodplain.
The in-stream mini-piezometer data in reach 5 showed alternating positive and negative gradients (gaining and losing conditions) over distances of less than a third of a mile (fig. 14). Most of the piezometers had negative gradients ranging from -0.02 to -0.40 ft/ft. Piezometers P16, P21, and P23 showed small positive gradients of +0.01 ft/ft. Piezometer P22 changed from negative to positive gradients (-0.04 to +0.01 ft/ft) between September 22, 1999, and May 15, 2001. Piezometer P22 had to be reinstalled during subsequent measurements and showed small positive gradients of +0.01 ft/ft during the last two sampling events (table 4).
Interaction Between the Lower Dungeness River and the Water-Table Aquifer 35
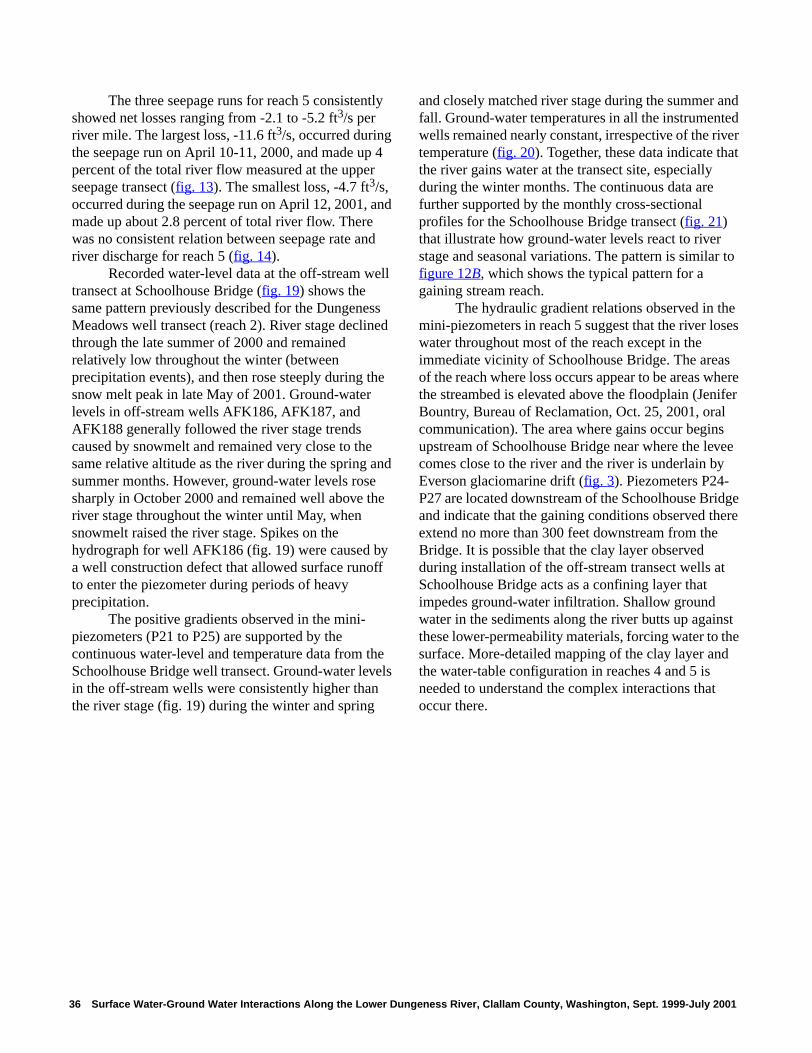
The three seepage runs for reach 5 consistently showed net losses ranging from -2.1 to -5.2 ft3/s per river mile. The largest loss, -11.6 ft3/s, occurred during the seepage run on April 10-11, 2000, and made up 4 percent of the total river flow measured at the upper seepage transect (fig. 13). The smallest loss, -4.7 ft3/s, occurred during the seepage run on April 12, 2001, and made up about 2.8 percent of total river flow. There was no consistent relation between seepage rate and river discharge for reach 5 (fig. 14).
Recorded water-level data at the off-stream well transect at Schoolhouse Bridge (fig. 19) shows the same pattern previously described for the Dungeness Meadows well transect (reach 2). River stage declined through the late summer of 2000 and remained relatively low throughout the winter (between precipitation events), and then rose steeply during the snow melt peak in late May of 2001. Ground-water levels in off-stream wells AFK186, AFK187, and AFK188 generally followed the river stage trends caused by snowmelt and remained very close to the same relative altitude as the river during the spring and summer months. However, ground-water levels rose sharply in October 2000 and remained well above the river stage throughout the winter until May, when snowmelt raised the river stage. Spikes on the hydrograph for well AFK186 (fig. 19) were caused by a well construction defect that allowed surface runoff to enter the piezometer during periods of heavy precipitation.
The positive gradients observed in the mini-piezometers (P21 to P25) are supported by the continuous water-level and temperature data from the Schoolhouse Bridge well transect. Ground-water levels in the off-stream wells were consistently higher than the river stage (fig. 19) during the winter and spring
and closely matched river stage during the summer and fall. Ground-water temperatures in all the instrumented wells remained nearly constant, irrespective of the river temperature (fig. 20). Together, these data indicate that the river gains water at the transect site, especially during the winter months. The continuous data are further supported by the monthly cross-sectional profiles for the Schoolhouse Bridge transect (fig. 21) that illustrate how ground-water levels react to river stage and seasonal variations. The pattern is similar to figure 12B, which shows the typical pattern for a gaining stream reach.
The hydraulic gradient relations observed in the mini-piezometers in reach 5 suggest that the river loses water throughout most of the reach except in the immediate vicinity of Schoolhouse Bridge. The areas of the reach where loss occurs appear to be areas where the streambed is elevated above the floodplain (Jenifer Bountry, Bureau of Reclamation, Oct. 25, 2001, oral communication). The area where gains occur begins upstream of Schoolhouse Bridge near where the levee comes close to the river and the river is underlain by Everson glaciomarine drift (fig. 3). Piezometers P24-P27 are located downstream of the Schoolhouse Bridge and indicate that the gaining conditions observed there extend no more than 300 feet downstream from the Bridge. It is possible that the clay layer observed during installation of the off-stream transect wells at Schoolhouse Bridge acts as a confining layer that impedes ground-water infiltration. Shallow ground water in the sediments along the river butts up against these lower-permeability materials, forcing water to the surface. More-detailed mapping of the clay layer and the water-table configuration in reaches 4 and 5 is needed to understand the complex interactions that occur there.
36 Surface Water-Ground Water Interactions Along the Lower Dungeness River, Clallam County, Washington, Sept. 1999-July 2001
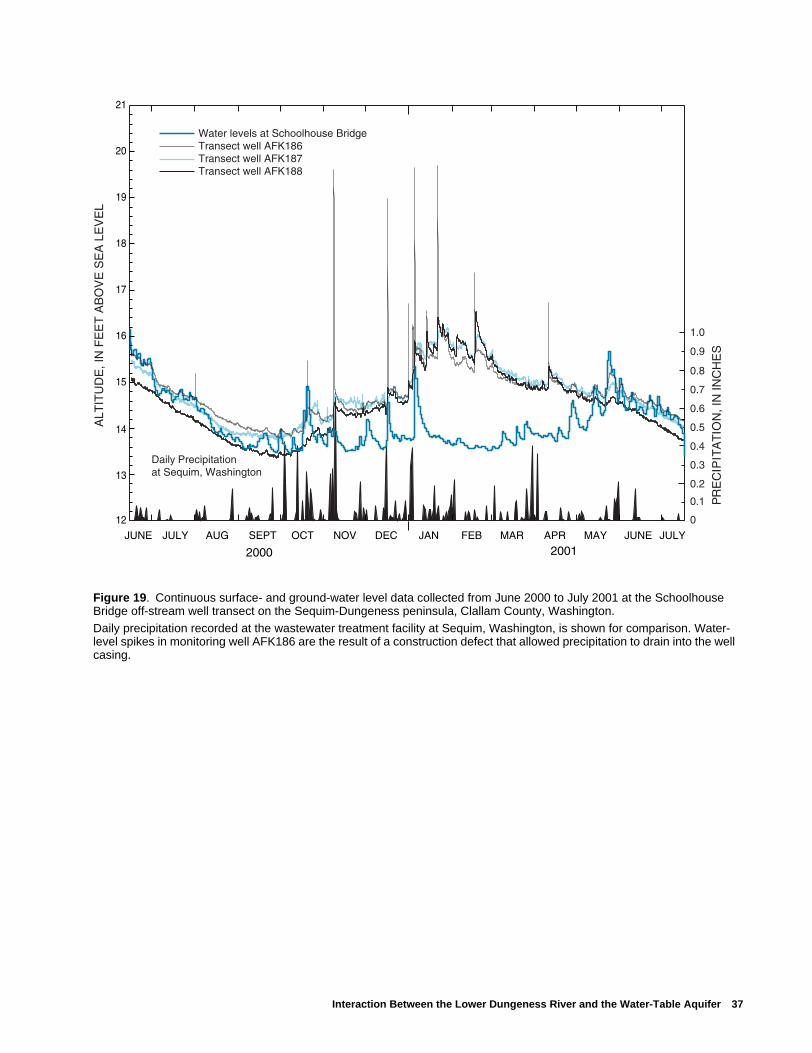
Daily Precipitation at Sequim, Washington
0.1
0
0.2
0.3
0.4
0.5
0.6
0.7
0.8
0.9
1.0
2000
JUNE JULY AUG SEPT OCT NOV DEC
2001JAN FEB MAR APR MAY JUNE JULY
PR
EC
IPIT
AT
ION
, IN
INC
HE
S
ALT
ITU
DE
, IN
FE
ET
AB
OV
E S
EA
LE
VE
L
14
13
12
15
16
17
18
19
20
21
Water levels at Schoolhouse BridgeTransect well AFK186Transect well AFK187Transect well AFK188
Figure 19. Continuous surface- and ground-water level data collected from June 2000 to July 2001 at the Schoolhouse Bridge off-stream well transect on the Sequim-Dungeness peninsula, Clallam County, Washington. Daily precipitation recorded at the wastewater treatment facility at Sequim, Washington, is shown for comparison. Water-level spikes in monitoring well AFK186 are the result of a construction defect that allowed precipitation to drain into the well casing.
Interaction Between the Lower Dungeness River and the Water-Table Aquifer 37
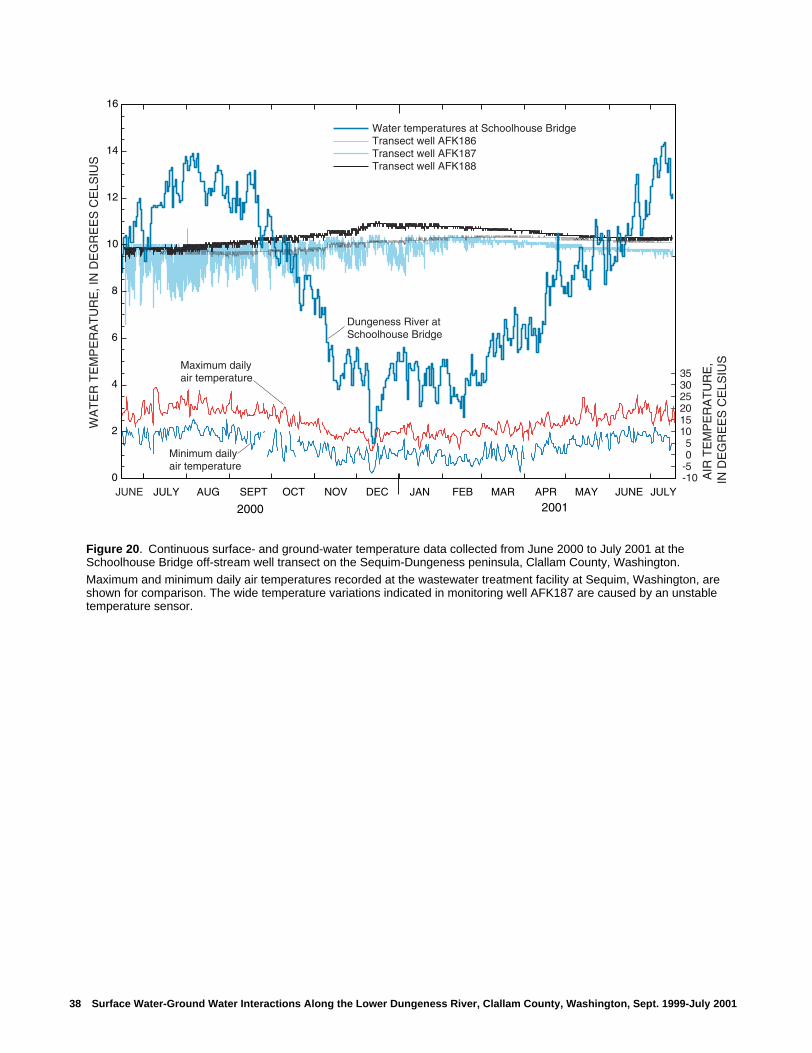
-5-10
05
101520253035
Maximum daily air temperature
Minimum daily air temperature
2000
JUNE JULY AUG SEPT OCT NOV DEC
2001JAN FEB MAR APR MAY JUNE JULY
0
2
4
6
8
10
12
14
16W
AT
ER
TE
MP
ER
AT
UR
E, I
N D
EG
RE
ES
CE
LSIU
S
AIR
TE
MP
ER
AT
UR
E,
IN D
EG
RE
ES
CE
LSIU
S
Dungeness River atSchoolhouse Bridge
Water temperatures at Schoolhouse BridgeTransect well AFK186Transect well AFK187Transect well AFK188
3
Figure 20. Continuous surface- and ground-water temperature data collected from June 2000 to July 2001 at the Schoolhouse Bridge off-stream well transect on the Sequim-Dungeness peninsula, Clallam County, Washington.
Maximum and minimum daily air temperatures recorded at the wastewater treatment facility at Sequim, Washington, are shown for comparison. The wide temperature variations indicated in monitoring well AFK187 are caused by an unstable temperature sensor.
8 Surface Water-Ground Water Interactions Along the Lower Dungeness River, Clallam County, Washington, Sept. 1999-July 2001
July
16,
200
1
AFK191
AFK190
AFK189
AFK186
AFK187AFK188
Mar
ch 1
4, 2
001
AFK191
AFK190
AFK189
AFK186
AFK187AFK188
Nov
embe
r 10
, 200
0
AFK191
AFK190
AFK189
AFK186
AFK187AFK188
Aug
ust 1
, 200
0
AFK191
AFK190
AFK189
AFK186
AFK187AFK188
June
19,
200
1
AFK191
AFK190
AFK189
AFK186
AFK187AFK188
Feb
ruar
y 15
, 200
1
AFK191
AFK190
AFK189
AFK186
AFK187AFK188
Oct
ober
3, 2
000
AFK191
AFK190
AFK189
AFK186
AFK187AFK188
May
17,
200
0
AFK191
AFK190
AFK189
AFK186
AFK187AFK188
May
14,
200
1
AFK191
AFK190
AFK189
AFK186
AFK187AFK188
Janu
ary
16, 2
001
AFK191
AFK190
AFK189
AFK186
AFK187AFK188
Sep
tem
ber
8, 2
000
AFK191
AFK190
AFK189
AFK186
AFK187AFK188
May
2, 2
000
AFK191
AFK190
AFK189
AFK186
AFK187AFK188
Apr
il 11
, 200
1
AFK191
AFK190
AFK189
AFK186
AFK187AFK188
30 25 20 15 10 5
Dec
embe
r 12
, 200
0
AFK191
AFK190
AFK189
AFK186
AFK187AFK188
30 25 20 15 10 5
Aug
ust 1
1, 2
000
AFK191
AFK190
AFK189
AFK186
AFK187AFK188
30 25 20 15 10 5
Mar
ch 2
9, 2
000
AFK191
AFK190
AFK189
AFK186
AFK187AFK188
30 25 20 15 10 5
2.9
4.3
3.6
-0.8
-0.2
-0.3
Dep
th o
f tru
ncat
ed w
ells
ELEVATION, IN FEET ABOVE SEA LEVEL
Interaction Between the Lower Dungeness River and the Water-Table Aquif
Fig
ure
21.
Wat
er-le
vel p
rofil
es o
f the
wat
er-t
able
aqu
ifer,
con
stru
cted
from
mon
thly
wat
er-le
vel m
easu
rem
ents
at t
he S
choo
lhou
se B
ridge
off-
stre
am
wel
l tra
nsec
t on
the
Seq
uim
-Dun
gene
ss p
enin
sula
, Cla
llam
Cou
nty,
Was
hing
ton.
Mon
itorin
g w
ells
on
the
right
sid
e of
the
prof
ile a
re o
ffset
app
roxi
mat
ely
70 fe
et d
owns
trea
m fr
om w
ells
on
the
left
side
. The
wat
er-le
vel d
ata
are
show
n in
tabl
e 8.
A p
rofil
e fo
r Ju
ne 1
6, 2
000,
is n
ot in
clud
ed b
ecau
se o
f que
stio
nabl
e da
ta.
er 39
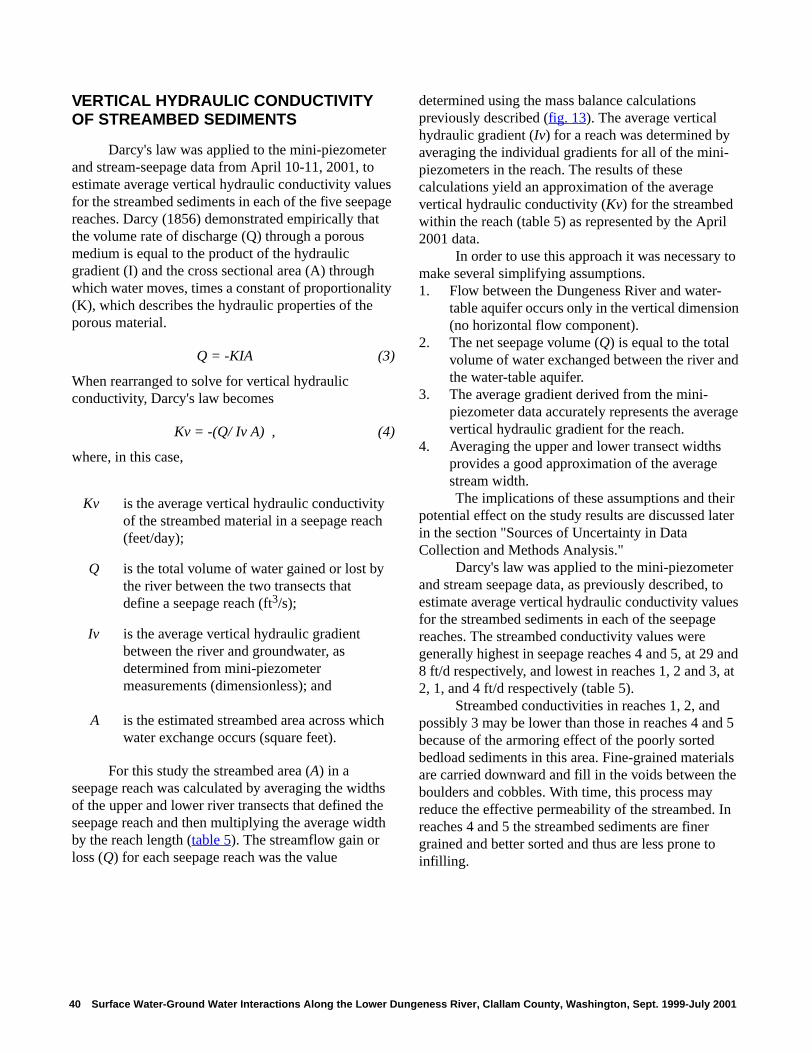
VERTICAL HYDRAULIC CONDUCTIVITY OF STREAMBED SEDIMENTS
Darcy's law was applied to the mini-piezometer and stream-seepage data from April 10-11, 2001, to estimate average vertical hydraulic conductivity values for the streambed sediments in each of the five seepage reaches. Darcy (1856) demonstrated empirically that the volume rate of discharge (Q) through a porous medium is equal to the product of the hydraulic gradient (I) and the cross sectional area (A) through which water moves, times a constant of proportionality (K), which describes the hydraulic properties of the porous material.
Q = -KIA (3)
When rearranged to solve for vertical hydraulic conductivity, Darcy's law becomes
Kv = -(Q/ Iv A) , (4)
where, in this case,
For this study the streambed area (A) in a seepage reach was calculated by averaging the widths of the upper and lower river transects that defined the seepage reach and then multiplying the average width by the reach length (table 5). The streamflow gain or loss (Q) for each seepage reach was the value
determined using the mass balance calculations previously described (fig. 13). The average vertical hydraulic gradient (Iv) for a reach was determined by averaging the individual gradients for all of the mini-piezometers in the reach. The results of these calculations yield an approximation of the average vertical hydraulic conductivity (Kv) for the streambed within the reach (table 5) as represented by the April 2001 data.
In order to use this approach it was necessary to make several simplifying assumptions.1. Flow between the Dungeness River and water-
table aquifer occurs only in the vertical dimension (no horizontal flow component).
2. The net seepage volume (Q) is equal to the total volume of water exchanged between the river and the water-table aquifer.
3. The average gradient derived from the mini-piezometer data accurately represents the average vertical hydraulic gradient for the reach.
4. Averaging the upper and lower transect widths provides a good approximation of the average stream width.The implications of these assumptions and their
potential effect on the study results are discussed later in the section "Sources of Uncertainty in Data Collection and Methods Analysis."
Darcy's law was applied to the mini-piezometer and stream seepage data, as previously described, to estimate average vertical hydraulic conductivity values for the streambed sediments in each of the seepage reaches. The streambed conductivity values were generally highest in seepage reaches 4 and 5, at 29 and 8 ft/d respectively, and lowest in reaches 1, 2 and 3, at 2, 1, and 4 ft/d respectively (table 5).
Streambed conductivities in reaches 1, 2, and possibly 3 may be lower than those in reaches 4 and 5 because of the armoring effect of the poorly sorted bedload sediments in this area. Fine-grained materials are carried downward and fill in the voids between the boulders and cobbles. With time, this process may reduce the effective permeability of the streambed. In reaches 4 and 5 the streambed sediments are finer grained and better sorted and thus are less prone to infilling.
Kv is the average vertical hydraulic conductivity of the streambed material in a seepage reach (feet/day);
Q is the total volume of water gained or lost by the river between the two transects that define a seepage reach (ft3/s);
Iv is the average vertical hydraulic gradient between the river and groundwater, as determined from mini-piezometer measurements (dimensionless); and
A is the estimated streambed area across which water exchange occurs (square feet).
40 Surface Water-Ground Water Interactions Along the Lower Dungeness River, Clallam County, Washington, Sept. 1999-July 2001
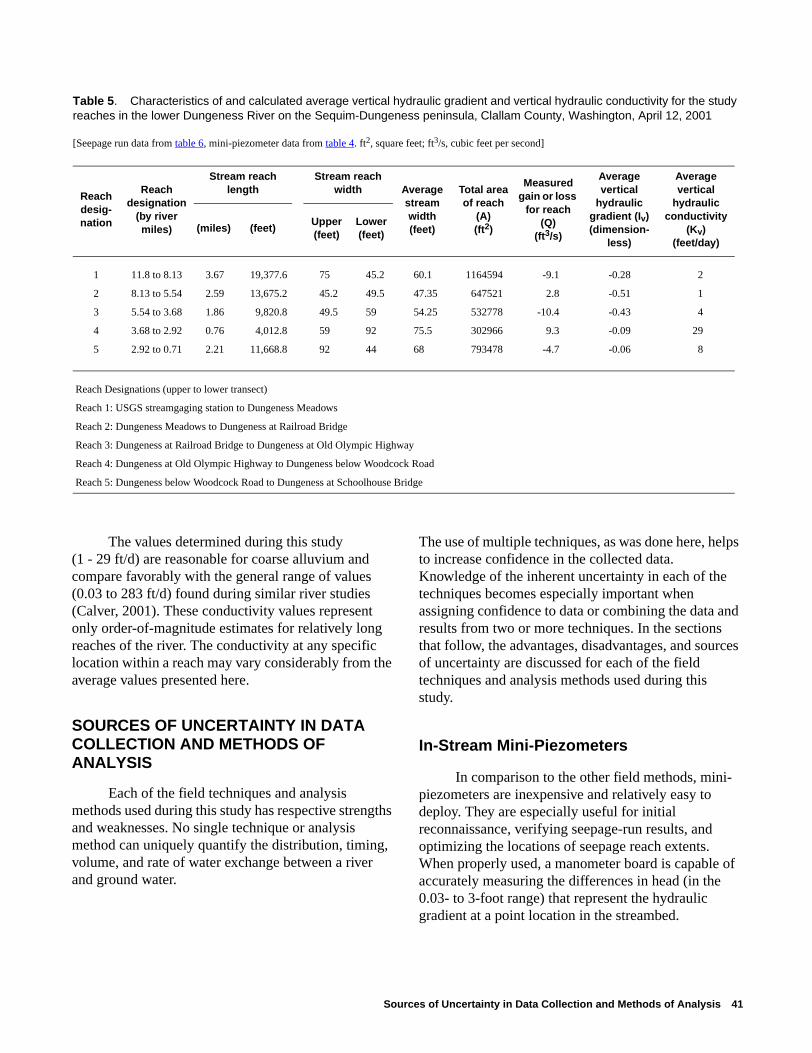
Table 5. Characteristics of and calculated average vertical hydraulic gradient and vertical hydraulic conductivity for the study reaches in the lower Dungeness River on the Sequim-Dungeness peninsula, Clallam County, Washington, April 12, 2001
[Seepage run data from table 6, mini-piezometer data from table 4. ft2, square feet; ft3/s, cubic feet per second]
Reach desig-nation
Reach designation
(by river miles)
Stream reach length
Stream reach width Average
stream width(feet)
Total area of reach
(A)(ft2)
Measured gain or loss
for reach (Q)
(ft3/s)
Average vertical
hydraulic gradient (Iv)(dimension-
less)
Average vertical
hydraulic conductivity
(Kv)(feet/day)
(miles) (feet)Upper (feet)
Lower (feet)
1 11.8 to 8.13 3.67 19,377.6 75 45.2 60.1 1164594 -9.1 -0.28 2
2 8.13 to 5.54 2.59 13,675.2 45.2 49.5 47.35 647521 2.8 -0.51 1
3 5.54 to 3.68 1.86 9,820.8 49.5 59 54.25 532778 -10.4 -0.43 4
4 3.68 to 2.92 0.76 4,012.8 59 92 75.5 302966 9.3 -0.09 29
5 2.92 to 0.71 2.21 11,668.8 92 44 68 793478 -4.7 -0.06 8
Reach Designations (upper to lower transect)
Reach 1: USGS streamgaging station to Dungeness Meadows
Reach 2: Dungeness Meadows to Dungeness at Railroad Bridge
Reach 3: Dungeness at Railroad Bridge to Dungeness at Old Olympic Highway
Reach 4: Dungeness at Old Olympic Highway to Dungeness below Woodcock Road
Reach 5: Dungeness below Woodcock Road to Dungeness at Schoolhouse Bridge
The values determined during this study (1 - 29 ft/d) are reasonable for coarse alluvium and compare favorably with the general range of values (0.03 to 283 ft/d) found during similar river studies (Calver, 2001). These conductivity values represent only order-of-magnitude estimates for relatively long reaches of the river. The conductivity at any specific location within a reach may vary considerably from the average values presented here.
SOURCES OF UNCERTAINTY IN DATA COLLECTION AND METHODS OF ANALYSIS
Each of the field techniques and analysis methods used during this study has respective strengths and weaknesses. No single technique or analysis method can uniquely quantify the distribution, timing, volume, and rate of water exchange between a river and ground water.
The use of multiple techniques, as was done here, helps to increase confidence in the collected data. Knowledge of the inherent uncertainty in each of the techniques becomes especially important when assigning confidence to data or combining the data and results from two or more techniques. In the sections that follow, the advantages, disadvantages, and sources of uncertainty are discussed for each of the field techniques and analysis methods used during this study.
In-Stream Mini-Piezometers
In comparison to the other field methods, mini-piezometers are inexpensive and relatively easy to deploy. They are especially useful for initial reconnaissance, verifying seepage-run results, and optimizing the locations of seepage reach extents. When properly used, a manometer board is capable of accurately measuring the differences in head (in the 0.03- to 3-foot range) that represent the hydraulic gradient at a point location in the streambed.
Sources of Uncertainty in Data Collection and Methods of Analysis 41
In-stream mini-piezometers that were installed close together showed similar head differences during this study. This suggests (for this study at least) that the vertical hydraulic gradient between the river and ground water did not vary greatly over distances of a few hundred feet or less. In addition, hydraulic gradients in the original mini-piezometers did not change much over the course of the study (see table 4 and table 6, at back of report). Plots of the calculated hydraulic gradient verses river mile (fig. 22) illustrate how the magnitude of the gradient varied slightly over time but remained consistent with regard to direction. The one exception is piezometer P22, which reversed from a negative to positive gradient on April 11, 2001, before it was destroyed. Subsequent measurements at site P22 were made using a new piezometer installed at a shallower depth and indicated consistent upward flow.
The major disadvantage of in-stream mini-piezometers is that, individually, they provide information for only one point within the streambed. Thus, many mini-piezometers are required to adequately characterize the longitudinal distribution and sign (positive or negative) of streambed hydraulic gradients. The manometer board is not good at measuring small head differences (in the 0 to 0.03-foot range), and care must be taken to ensure a good seal around the mini-piezometer so that a head difference can be measured. The question of whether the mini-piezometer is measuring flow within the streambed material (hyporheic flow) or ground-water flow can be addressed by comparing temperature and specific conductivity from the mini-piezometer with that of the river (Winter and others, 1999). Ground water, particularly in gaining reaches, can have temperature and specific conductance values that differ greatly from the river. In losing reaches the temperature and specific conductance from the mini-piezometer can be similar to the river.
Seepage Runs
Seepage runs are labor intensive and expensive to conduct, but provide estimates of the net gain or loss across larger reaches of the river (0.8 to 3.7 miles in this case). Because they provide only net estimates of water exchange, seepage evaluations reveal nothing
about the distribution of local gains or losses that may occur within a seepage reach. Care must be taken in defining the reach boundaries. Ideally, the seepage-measurement transects should coincide with gaining and losing reach boundaries and all inflows and outflows within the reach should be accounted for. The seepage-measurement transects also should be far enough apart that the measured fluxes exceed the inherent measurement error.
Although duplicate discharge measurements are conducted to ensure precision, the uncertainty in seepage evaluations can be significant if the stream discharge is large compared to the loss or gain in seepage along the stream reach. The inherent error in a good discharge measurement in a natural river environment is estimated to be ± 3 percent (Rantz and others, 1982). Thus, the calculated seepage over a reach could range considerably. The range of seepage rates can be narrowed, however, by applying the findings from other techniques. Head relations from mini-piezometers and off-stream well transects provide additional data that help reduce uncertainty in seepage rates at the time of measurement.
The disadvantage of seepage runs, particularly on the Dungeness River, is that good measurement sites are few and far between. Wading discharge measurements become dangerous to impossible at river flows of 350 ft3/s or higher. Thus, seepage runs cannot be conducted at high flows, and the relation between seepage rate and river discharge cannot be confirmed.
Off-Stream Well Transects
Off-stream well transects are an expensive but reliable technique for gathering ground-water data adjacent to the river. Continuous ground-water levels from multiple wells along the transect yield a wealth of information when compared with nearby surface-water stage data or the data from in-stream mini-piezometers (figs. 16 and 19). An attempt was made to compare observed ground-water levels with analytical model simulations in order to calculate hydraulic properties of the aquifer and stream bank and to estimate seepage rates and bank-storage volumes resulting from flood waves (Barlow and others, 2000). Unfortunately, this analytical technique did not yield conclusive results.
42 Surface Water-Ground Water Interactions Along the Lower Dungeness River, Clallam County, Washington, Sept. 1999-July 2001
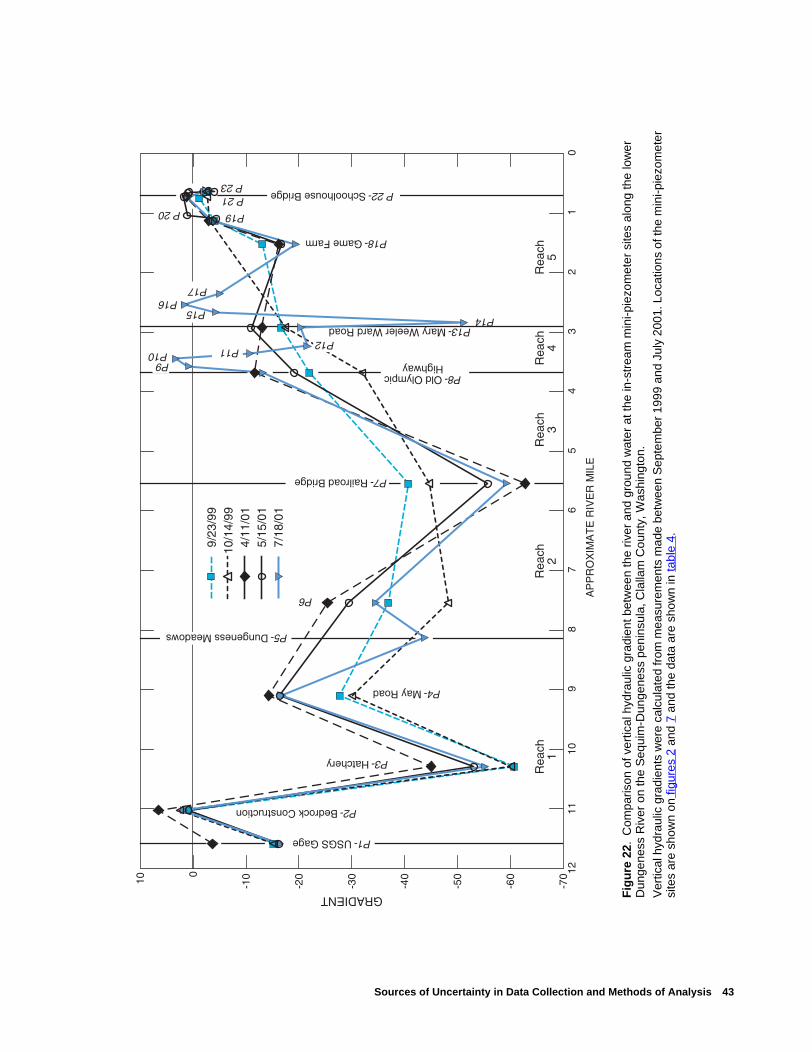
01
23
45
67
89
1011
12
AP
PR
OX
IMA
TE
RIV
ER
MIL
E
-70
-60
-50
-40
-30
-20
-100
10GRADIENT
Rea
ch4
Rea
ch3
Rea
ch2
Rea
ch1
Rea
ch5
9/2
3/99
10/1
4/99
4/1
1/01
5/1
5/01
7/1
8/01
P1- USGS Gage
P2- Bedrock Construction
P3- Hatchery
P4- May Road
P5- Dungeness Meadows
P6
P7- Railroad Bridge
P8- Old OlympicHighwayP9
P11P12
P10
P19P 20P 21 P 22- Schoolhouse BridgeP 23
P15P14
P16P17
P13- Mary Weeler Ward Road
P18- Game Farm
Sources of Uncertainty in Data Collection and M
Fig
ure
22.
Com
paris
on o
f ver
tical
hyd
raul
ic g
radi
ent b
etw
een
the
river
and
gro
und
wat
er a
t the
in-s
trea
m m
ini-p
iezo
met
er s
ites
alon
g th
e lo
wer
D
unge
ness
Riv
er o
n th
e S
equi
m-D
unge
ness
pen
insu
la, C
lalla
m C
ount
y, W
ashi
ngto
n.
Ver
tical
hyd
raul
ic g
radi
ents
wer
e ca
lcul
ated
from
mea
sure
men
ts m
ade
betw
een
Sep
tem
ber
1999
and
Jul
y 20
01. L
ocat
ions
of t
he m
ini-p
iezo
met
er
site
s ar
e sh
own
on fi
gure
s 2
and
7 an
d th
e da
ta a
re s
how
n in
tabl
e 4.
ethods of Analysis 43
The fact that ground-water flow directions are parallel to the river at both transect sites introduced an unacceptable level of uncertainty in the Barlow model. An attempt also was made to use temperature data (figs. 17 and 20) to estimate ground-water flow directions and fluxes using the techniques developed by Constantz and others (1999). Although the direction of ground-water flow could be determined from the data, the lack of vertical hydraulic head and temperature data prevented the calculation of flux using temperature as a tracer.
One disadvantage of off-stream well transects is that installation typically requires site access by a truck-mounted drill rig, which can limit the possible locations for the transect. Check measurements need to be made to verify that the recorded data are accurate and to quantify the small amount of instrument drift that can occur. Like the mini-piezometers, the well transects provide information only for a single transect within a reach.
Calculation of Streambed Hydraulic Conductivity Values
Uncertainties in the in-stream mini-piezometer data and seepage run data are compounded when the data are combined to estimate streambed vertical hydraulic conductivity. Additional uncertainty is introduced by the assumptions that are used to simplify the calculations. The assumption that there is no horizontal exchange of flow between the streambed and water-table aquifer is contrary to what is seen in the off stream well transects. What is not known is which component of flow is dominant, horizontal or vertical. Due to the anisotrophic nature of aquifer materials, in most cases, horizontal ground-water flow is assumed to be 5 to 10 times that of vertical flow. The calculated vertical hydraulic conductivities (1-29 ft/d) would suggest horizontal conductivities of 5 to 290 ft/d; values similar to those reported by Thomas and others (1999).
The representativeness of point measurements of vertical hydraulic gradients within a given reach is another source of uncertainty. Although there are other ways of statistically weighting individual point measurements, in this study, point measurements were simply averaged within a given stream reach. Multiple measurements at in-stream mini-piezometers indicated slight variations in the magnitude of vertical gradients but no changes in the direction of flow (fig. 22).
The assumption that the net seepage volume (Q) is equal to the total volume of water exchanged between the river and the water-table aquifer is more problematic. In reach 5, for example, which contains both gaining and losing stretches, for net exchange to be negative, losing stream segments must lose more water than is gained through gaining segments. Thus, actual gross gains could be large if they were offset by large losses. Such large gains or losses, however, were not evident at the points where the in-stream mini-piezometers were located.
To assess the impact of these uncertainties a sensitivity analysis was conducted. Vertical streambed hydraulic conductivities were calculated while varying the average vertical hydraulic gradient (Iv), the net seepage volume (Q), and the total area of the reach (A) within reasonable limits. The sensitivity analysis resulted in a relatively small range of calculated vertical streambed hydraulic conductivities. The sensitivity analysis suggests that although there are many uncertainties and sources of inherent error when using Darcy's law with in-stream mini-piezometer and seepage-run data, the results represent reasonable order-of-magnitude estimates of vertical hydraulic conductivities for the streambed of the lower Dungeness River.
In this study, it was useful to view data from in-stream mini-piezometers, seepage runs, and off-stream well transects together. The results of each of these techniques are complimentary and provide a more complete perspective of water exchange than could be derived from the methods individually.
44 Surface Water-Ground Water Interactions Along the Lower Dungeness River, Clallam County, Washington, Sept. 1999-July 2001
SUMMARY AND CONCLUSIONS
Three field techniques were used during this study to evaluate and document surface-water and ground-water interactions along the lower 11.8 miles of the Dungeness River corridor. Mini-piezometers were driven into the active stream channel at 27 locations along the river and provided point estimates of the vertical hydraulic gradient and the direction of water movement into or out of the river. Seepage runs were used to quantify net water exchanges between the river and ground water within five seepage reaches. Continuous water-level and water-temperature monitoring at two off-stream well transects provided horizontal hydraulic gradient information and revealed temporal patterns of water exchange within a representative gaining and losing stream reach.
Results for seepage reaches 1 and 3 (river miles 11.8-8.1 and 5.5-3.7) reveal that the river consistently lost water, with the exception of a short segment near river mile 11.0. There, the river is narrowly confined by a bedrock constriction that locally forces ground water into the river. Vertical hydraulic gradients in the mini-piezometers within these reaches generally decreased in the downstream direction from an average of -0.86 at river mile 10.3 to -0.23 at river mile 3.7. Repeat measurements of the piezometers at different times and flow conditions yielded some variation in the gradient estimates, but produced consistent results with regard to gradient direction. Net seepage losses through reach 1 confirmed the piezometer results and ranged from 2.1 to 4.1 ft3/s per /river mile and made up 4.6 to 5.9 percent of the total river flow. Seepage losses for reach 3 ranged from 0.54 to 12.8 ft3/s per river mile and made up between 1 and 8 percent of total river flow. The rate of water loss in reaches 1 and 3 appears to be correlated with river discharge and increases with increasing streamflow.
Seepage results for reach 2 (river miles 8.1 to 5.5) ranged from 0.23 to 3.5 ft3/s per river mile and made up about 0.5 to 3 percent of total river flow. These results contradict the gradients observed in the mini-piezometers, which ranged from -0.39 to -0.63 ft/ft through reach 2. The reasons for this discrepancy are not well understood. However, ground-water levels at an off-stream well transect within this reach (near Dungeness Meadows) were consistently below the river stage and support the mini-piezometer results.
The mini-piezometer and seepage run data suggest the presence of small gaining and losing stream segments within the broader context of reach 4 (river miles 3.7 to 2.9). Net seepage between the river and ground water varied from -6.7 to 21.1 ft3/s per river mile and made up 4.6 and 5.8 percent of total river flow, respectively, within reach 4. Piezometers P9 and P10 (river miles 3.57 and 3.44 respectively) exhibited positive gradients ranging from +0.01 to +0.02 ft/ft. Piezometers P8, P11, and P12 (river miles 3.68, 3.36, and 3.23) exhibited negative gradients ranging from -0.08 to -0.23 ft/ft.
Seepage reach 5 (river miles 2.9 to 0.7) showed a continuation of the interspersed gains and losses observed within reach 4. The seepage runs for reach 5 consistently showed net losses ranging from -2.1 to -5.2 ft3/s per river mile and made up 2.8 to 4 percent of total river flow. Most of the mini-piezometers in reach 5 confirmed these results and exhibited negative hydraulic gradients ranging from -0.01 to -0.04 ft/ft. Piezometers P16, P21, and P23 (river miles 2.54,1.04, and 0.71, respectively) had consistently positive but small gradients of approximately +0.01 ft/ft, suggesting localized areas of stream flow gain. Localized zones of ground-water discharge to the river are confirmed by data collected at the off-stream well transect near Schoolhouse Bridge, where ground-water levels were consistently higher than the river stage.
In addition to providing a convenient means of verifying the mini-piezometer results, the off-stream well transects provide continuous water-level and water-temperature data that can be used to evaluate how near-stream ground-water levels respond to snow melt and precipitation. Ground-water levels at both transects increased during sustained periods of high river stage (such as spring snow melt), regardless of the overall streamflow gain/loss relation for the reach. At the Dungeness Meadows transect, where losing conditions prevailed, ground-water levels closely resembled river stage but remained at a lower relative altitude than the river throughout the study. As expected, ground-water temperatures in the well nearest the river closely tracked the river temperature. This effect decreased with distance from the river.
Summary and Conclusions 45
At the Schoolhouse Bridge well transect, where ground water discharges into the river, ground-water levels also followed the river stage trends caused by snow melt. However, ground-water levels rose sharply in the fall and remained well above the river stage throughout the winter months. Ground-water temperatures at the Schoolhouse Bridge transect remained nearly constant (about 10 degrees C) and were relatively unaffected by variations in river temperature. Ground-water temperatures did not peak in the transect wells until early October (at Dungeness Meadows) and mid December (at the Schoolhouse Bridge), long after the early August peak in river temperatures. The greater lag time at Schoolhouse Bridge may be due to the low hydraulic conductivity of the clay layer that underlies the site.
Average vertical hydraulic conductivity values for the streambed sediments within the five seepage reaches ranged from 1 to 29 feet per day (ft/d). Streambed conductivity values were highest in reaches 4 and 5, where values ranged from 29 to 8 ft/d, and lowest in reaches 1, 2, and 3, where values ranged from 2, 1, and 4 ft/d. The streambed conductivity values determined during this study compare favorably with the general range of values (0.03 to 283 ft/d) found during similar studies. The reported values represent order-of-magnitude estimates for relatively long reaches of the river. The conductivity at any particular location along the river may vary considerably from the average values presented here.
Each of the data collection and analysis techniques used during this study is subject to various degrees of uncertainty. Thus, none of the techniques or analysis methods can uniquely quantify surface-water and ground-water exchanges. Using multiple techniques, as was done during this study, provides several lines of evidence upon which to base findings, and provides greater certainty to those anticipating subsequent data analysis and modeling exercises.
REFERENCES
Barlow, P.M., Desimone, L.A., and Moench, A.F., 2000, Aquifer response to stream-stage and recharge variations. II. Convolution method and applications: Journal of Hydrology, v. 230, p. 211-229.
Calver, A., 2001, Riverbed permeabilities; information from pooled data: Ground Water, v. 39, no. 4, p. 546-553.
Clallam County Department of Community Development, 1994, Sequim-Dungeness groundwater protection strategy: Port Angeles, Washington, Clallam County Department of Community Development, 102 p.
Constantz, J., Niswonger, R., and Stewart, A.E., 1999, The use of heat as a tracer to estimate recharge beneath streams and artificial recharge ponds: in Bartlett, R.D., ed., Artificial Recharge of Groundwater: American Society of Civil Engineers, p. 193-203.
Darcy, H., 1856, Les fontaines publiques de la ville de Dijon, Paris: Victor Dalmont, 647 p.
Drost, B.W., 1983, Impact of changes in land use on the ground-water system in the Sequim-Dungeness Peninsula, Clallam County, Washington: U.S. Geological Survey Water-Resources Investigations Report 83-4094, 61 p.
Fryar, A.E., Wallin, E.J., and Brown, D.L., 2000, Spatial and temporal variability in seepage between a contaminated aquifer and tributaries to the Ohio River: Ground-Water Monitoring and Remediation v. 20, no. 3, p. 129-146.
Jamestown S'Klallam Tribe, 1994, The DQ Plan-the Dungeness-Quilcene water resources management plan, a plan submitted the State of Washington Department of Ecology under the Chelan Agreement: Sequim Washington, Jamestown S'Klallam Tribe, about 570 p.
Jones, M.A., 1996a, Unconsolidated thickness of unconsolidated deposits in the Puget Sound Lowland, Washington and British Columbia: U.S. Geological Survey Water Resources Investigations Report 94-4133, 1 sheet.
———1996b, Delineation of hydrogeologic units in the lower Dungeness River Basin, Clallam County, Washington: U.S. Geological Survey Water Resources Investigations Report 95-4008, 11 p.
46 Surface Water-Ground Water Interactions Along the Lower Dungeness River, Clallam County, Washington, Sept. 1999-July 2001
Lindorfer, Don, 2001, Clallam County Road Department, 2/8-9/2001, written communication)
National Oceanic and Atmospheric Administration, 1982, Monthly normals of temperature, precipitation, and heating and cooling degree days, 1951-80: Asheville North Carolina, Climatography of the United States no. 81 (Washington), 17 p.
Noble, J.B., 1960, A preliminary report of the geology and ground water resources of the Sequim-Dungeness area Clallam County, Washington: Washington State Department of Conservation, Division of Water Resources, Water Supply Bulletin No. 11, 43 p.
Othberg, K.L., and Palmer, P., 1980a, Preliminary surficial geologic map of the Carlsborg quadrangle, Clallam County, Washington: Division of Geology and Earth Resources, Open-file Report 79-20, 1 p.
———1980b, Preliminary surficial geologic map of the Dungeness quadrangle, Clallam County, Washington: Division of Geology and Earth Resources, Open-file Report 79-17, 3 p.
———1980c, Preliminary surficial geologic map of the Sequim quadrangle, Clallam County, Washington: Division of Geology and Earth Resources, Open-file Report 79-18, 4 p.
Rantz, S.E., and others, 1982, Measurement and computation of streamflow: Volume 1. Measurement of stage and discharge: U.S. Geological Survey, Water Supply Paper 2175, 284 p.
Sweet-Edwards/EMCON, Inc., 1991a, Sequim-Dungeness ground water characterization study: Bothell, Washington, Sweet-Edwards and EMCON, Inc., 150 p.
———1991b, Recharge potential mapping criteria and rationale: Bothell, Washington, Sweet-Edwards and EMCON, Inc., unpaginated.
———1991c, Hydrologic sensitive area criteria and rationale: Bothell, Washington, Sweet-Edwards and EMCON, Inc., 39 p
Tabor, R.W., and Cady, W.M., 1978, Geologic map of the Olympic peninsula, Washington: U.S. Geological Survey Miscellaneous Investigations series, Map I-994.
Thomas, B.E., Goodman, L.A., and Olsen, T.D., 1999, Hydrogeologic assessment of the Sequim-Dungeness Area, Clallam County, Washington: U.S. Geological Survey, Water-Resources Investigations Report 99-4048, 165 p.
U.S. Forest Service, 1995, Dungeness watershed analysis: Olympia, Washington, Olympia National Forest, 233 p.
Winter, T.C., Harvey, J.W., Franke O.L., and Alley, W.M., 1998, Ground water and surface water - a single resource: U.S. Geological Survey Circular 1139, 79 p.
Winter, T.C., LaBaugh, J.W., and Rosenberry, D.O., 1988, The design and use of a hydraulic potentiometer for direct measurement of differences in hydraulic head between groundwater and surface water: Limonology and Oceanography, v. 33. no. 5, p. 1209-1214.
References 47

48 Tables 6 through 8
Tables 6 through 8
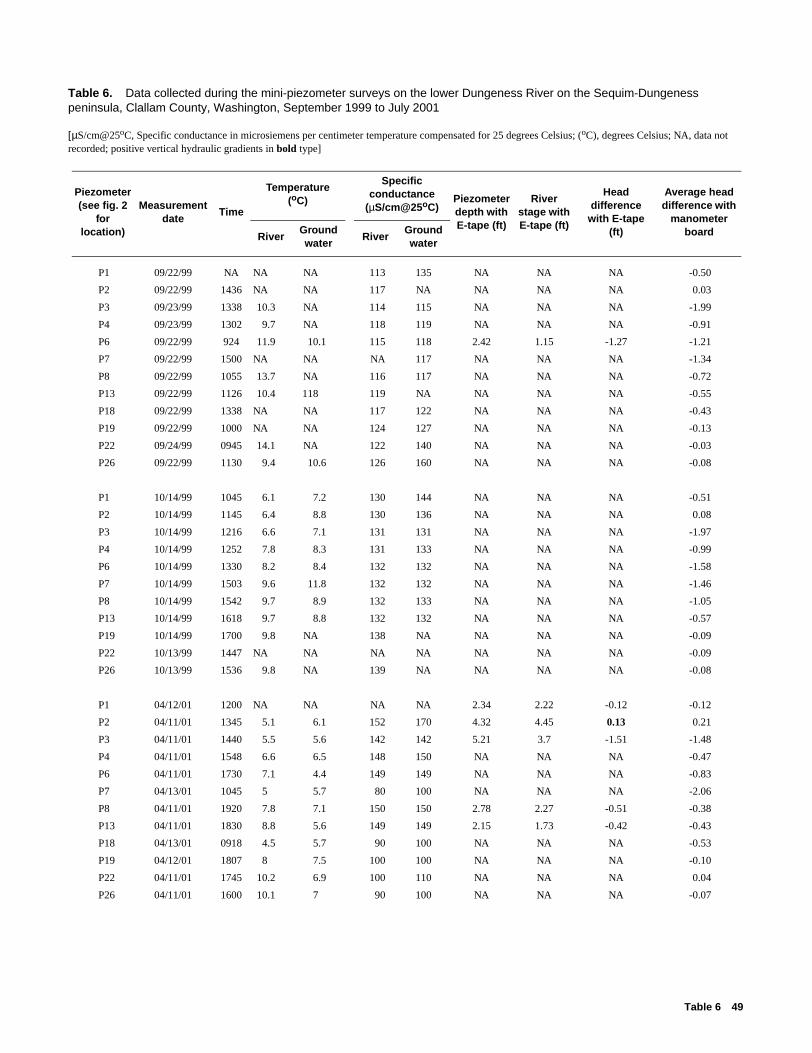
Table 6. Data collected during the mini-piezometer surveys on the lower Dungeness River on the Sequim-Dungeness peninsula, Clallam County, Washington, September 1999 to July 2001—Continued
Piezometer (see fig. 2
for location)
Measurement date
Time
Temperature (oC)
Specific conductance
(µS/cm@25oC)Piezometer depth with E-tape (ft)
River stage with E-tape (ft)
Head difference
with E-tape (ft)
Average head difference with
manometer boardRiver
Ground water
RiverGround water
P1 09/22/99 NA NA NA 113 135 NA NA NA -0.50
P2 09/22/99 1436 NA NA 117 NA NA NA NA 0.03
P3 09/23/99 1338 10.3 NA 114 115 NA NA NA -1.99
P4 09/23/99 1302 9.7 NA 118 119 NA NA NA -0.91
P6 09/22/99 924 11.9 10.1 115 118 2.42 1.15 -1.27 -1.21
P7 09/22/99 1500 NA NA NA 117 NA NA NA -1.34
P8 09/22/99 1055 13.7 NA 116 117 NA NA NA -0.72
P13 09/22/99 1126 10.4 118 119 NA NA NA NA -0.55
P18 09/22/99 1338 NA NA 117 122 NA NA NA -0.43
P19 09/22/99 1000 NA NA 124 127 NA NA NA -0.13
P22 09/24/99 0945 14.1 NA 122 140 NA NA NA -0.03
P26 09/22/99 1130 9.4 10.6 126 160 NA NA NA -0.08
P1 10/14/99 1045 6.1 7.2 130 144 NA NA NA -0.51
P2 10/14/99 1145 6.4 8.8 130 136 NA NA NA 0.08
P3 10/14/99 1216 6.6 7.1 131 131 NA NA NA -1.97
P4 10/14/99 1252 7.8 8.3 131 133 NA NA NA -0.99
P6 10/14/99 1330 8.2 8.4 132 132 NA NA NA -1.58
P7 10/14/99 1503 9.6 11.8 132 132 NA NA NA -1.46
P8 10/14/99 1542 9.7 8.9 132 133 NA NA NA -1.05
P13 10/14/99 1618 9.7 8.8 132 132 NA NA NA -0.57
P19 10/14/99 1700 9.8 NA 138 NA NA NA NA -0.09
P22 10/13/99 1447 NA NA NA NA NA NA NA -0.09
P26 10/13/99 1536 9.8 NA 139 NA NA NA NA -0.08
P1 04/12/01 1200 NA NA NA NA 2.34 2.22 -0.12 -0.12
P2 04/11/01 1345 5.1 6.1 152 170 4.32 4.45 0.13 0.21
P3 04/11/01 1440 5.5 5.6 142 142 5.21 3.7 -1.51 -1.48
P4 04/11/01 1548 6.6 6.5 148 150 NA NA NA -0.47
P6 04/11/01 1730 7.1 4.4 149 149 NA NA NA -0.83
P7 04/13/01 1045 5 5.7 80 100 NA NA NA -2.06
P8 04/11/01 1920 7.8 7.1 150 150 2.78 2.27 -0.51 -0.38
P13 04/11/01 1830 8.8 5.6 149 149 2.15 1.73 -0.42 -0.43
P18 04/13/01 0918 4.5 5.7 90 100 NA NA NA -0.53
P19 04/12/01 1807 8 7.5 100 100 NA NA NA -0.10
P22 04/11/01 1745 10.2 6.9 100 110 NA NA NA 0.04
P26 04/11/01 1600 10.1 7 90 100 NA NA NA -0.07
Table 6. Data collected during the mini-piezometer surveys on the lower Dungeness River on the Sequim-Dungeness peninsula, Clallam County, Washington, September 1999 to July 2001
[µS/cm@25oC, Specific conductance in microsiemens per centimeter temperature compensated for 25 degrees Celsius; (oC), degrees Celsius; NA, data not recorded; positive vertical hydraulic gradients in bold type]
Table 6 49
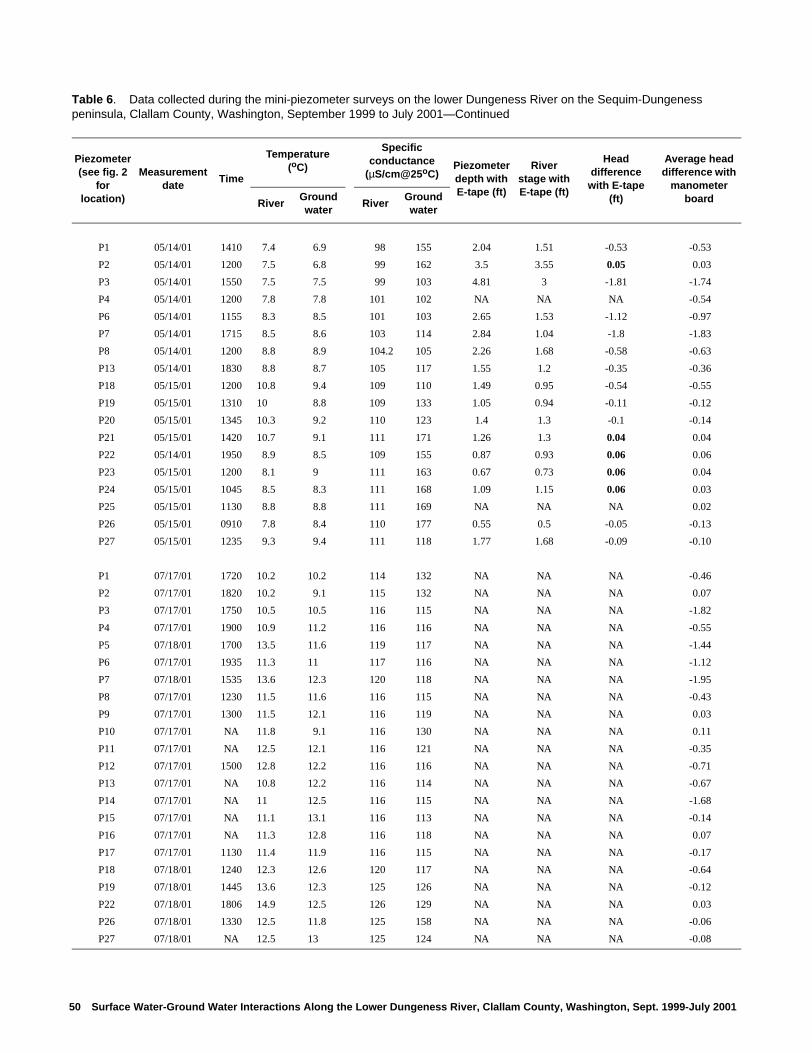
P1 05/14/01 1410 7.4 6.9 98 155 2.04 1.51 -0.53 -0.53
P2 05/14/01 1200 7.5 6.8 99 162 3.5 3.55 0.05 0.03
P3 05/14/01 1550 7.5 7.5 99 103 4.81 3 -1.81 -1.74
P4 05/14/01 1200 7.8 7.8 101 102 NA NA NA -0.54
P6 05/14/01 1155 8.3 8.5 101 103 2.65 1.53 -1.12 -0.97
P7 05/14/01 1715 8.5 8.6 103 114 2.84 1.04 -1.8 -1.83
P8 05/14/01 1200 8.8 8.9 104.2 105 2.26 1.68 -0.58 -0.63
P13 05/14/01 1830 8.8 8.7 105 117 1.55 1.2 -0.35 -0.36
P18 05/15/01 1200 10.8 9.4 109 110 1.49 0.95 -0.54 -0.55
P19 05/15/01 1310 10 8.8 109 133 1.05 0.94 -0.11 -0.12
P20 05/15/01 1345 10.3 9.2 110 123 1.4 1.3 -0.1 -0.14
P21 05/15/01 1420 10.7 9.1 111 171 1.26 1.3 0.04 0.04
P22 05/14/01 1950 8.9 8.5 109 155 0.87 0.93 0.06 0.06
P23 05/15/01 1200 8.1 9 111 163 0.67 0.73 0.06 0.04
P24 05/15/01 1045 8.5 8.3 111 168 1.09 1.15 0.06 0.03
P25 05/15/01 1130 8.8 8.8 111 169 NA NA NA 0.02
P26 05/15/01 0910 7.8 8.4 110 177 0.55 0.5 -0.05 -0.13
P27 05/15/01 1235 9.3 9.4 111 118 1.77 1.68 -0.09 -0.10
P1 07/17/01 1720 10.2 10.2 114 132 NA NA NA -0.46
P2 07/17/01 1820 10.2 9.1 115 132 NA NA NA 0.07
P3 07/17/01 1750 10.5 10.5 116 115 NA NA NA -1.82
P4 07/17/01 1900 10.9 11.2 116 116 NA NA NA -0.55
P5 07/18/01 1700 13.5 11.6 119 117 NA NA NA -1.44
P6 07/17/01 1935 11.3 11 117 116 NA NA NA -1.12
P7 07/18/01 1535 13.6 12.3 120 118 NA NA NA -1.95
P8 07/17/01 1230 11.5 11.6 116 115 NA NA NA -0.43
P9 07/17/01 1300 11.5 12.1 116 119 NA NA NA 0.03
P10 07/17/01 NA 11.8 9.1 116 130 NA NA NA 0.11
P11 07/17/01 NA 12.5 12.1 116 121 NA NA NA -0.35
P12 07/17/01 1500 12.8 12.2 116 116 NA NA NA -0.71
P13 07/17/01 NA 10.8 12.2 116 114 NA NA NA -0.67
P14 07/17/01 NA 11 12.5 116 115 NA NA NA -1.68
P15 07/17/01 NA 11.1 13.1 116 113 NA NA NA -0.14
P16 07/17/01 NA 11.3 12.8 116 118 NA NA NA 0.07
P17 07/17/01 1130 11.4 11.9 116 115 NA NA NA -0.17
P18 07/18/01 1240 12.3 12.6 120 117 NA NA NA -0.64
P19 07/18/01 1445 13.6 12.3 125 126 NA NA NA -0.12
P22 07/18/01 1806 14.9 12.5 126 129 NA NA NA 0.03
P26 07/18/01 1330 12.5 11.8 125 158 NA NA NA -0.06
P27 07/18/01 NA 12.5 13 125 124 NA NA NA -0.08
Table 6. Data collected during the mini-piezometer surveys on the lower Dungeness River on the Sequim-Dungeness peninsula, Clallam County, Washington, September 1999 to July 2001—Continued
Piezometer (see fig. 2
for location)
Measurement date
Time
Temperature (oC)
Specific conductance
(µS/cm@25oC)Piezometer depth with E-tape (ft)
River stage with E-tape (ft)
Head difference
with E-tape (ft)
Average head difference with
manometer boardRiver
Ground water
RiverGround water
50 Surface Water-Ground Water Interactions Along the Lower Dungeness River, Clallam County, Washington, Sept. 1999-July 2001
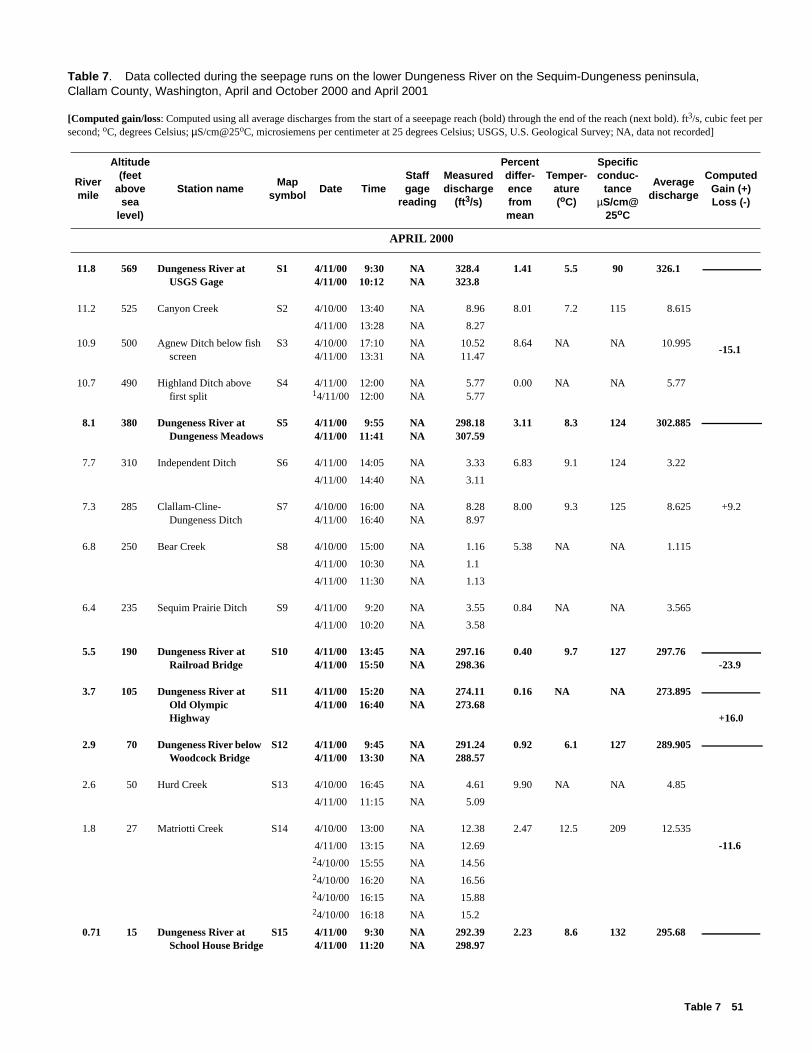
Table 7. Data collected during the seepage runs on the lower Dungeness River on the Sequim-Dungeness peninsula,
r
Table 7. Data collected during the seepage runs on the lower Dungeness River on the Sequim-Dungeness peninsula, Clallam County, Washington, April and October 2000 and April 2001—ContinuedRiver mile
Altitude (feet
above sea
level)
Station nameMap
symbolDate Time
Staff gage
reading
Measured discharge
(ft3/s)
Percent differ-ence from mean
Temper-ature (oC)
Specific conduc-
tance µS/cm@
25oC
Average discharge
ComputedGain (+) Loss (-)
APRIL 2000
11.8 569 Dungeness River at USGS Gage
S1 4/11/004/11/00
9:3010:12
NANA
328.4323.8
1.41 5.5 90 326.1
11.2 525 Canyon Creek S2 4/10/00 13:40 NA 8.96 8.01 7.2 115 8.615
4/11/00 13:28 NA 8.27
10.9 500 Agnew Ditch below fish screen
S3 4/10/004/11/00
17:1013:31
NANA
10.5211.47
8.64 NA NA 10.995-15.1
10.7 490 Highland Ditch above first split
S4 4/11/0014/11/00
12:0012:00
NANA
5.775.77
0.00 NA NA 5.77
8.1 380 Dungeness River at Dungeness Meadows
S5 4/11/004/11/00
9:5511:41
NANA
298.18307.59
3.11 8.3 124 302.885
7.7 310 Independent Ditch S6 4/11/00 14:05 NA 3.33 6.83 9.1 124 3.22
4/11/00 14:40 NA 3.11
7.3 285 Clallam-Cline-Dungeness Ditch
S7 4/10/004/11/00
16:0016:40
NANA
8.288.97
8.00 9.3 125 8.625 +9.2
6.8 250 Bear Creek S8 4/10/00 15:00 NA 1.16 5.38 NA NA 1.115
4/11/00 10:30 NA 1.1
4/11/00 11:30 NA 1.13
6.4 235 Sequim Prairie Ditch S9 4/11/00 9:20 NA 3.55 0.84 NA NA 3.565
4/11/00 10:20 NA 3.58
5.5 190 Dungeness River at Railroad Bridge
S10 4/11/004/11/00
13:4515:50
NANA
297.16298.36
0.40 9.7 127 297.76-23.9
3.7 105 Dungeness River at Old Olympic Highway
S11 4/11/004/11/00
15:2016:40
NANA
274.11273.68
0.16 NA NA 273.895
+16.0
2.9 70 Dungeness River below Woodcock Bridge
S12 4/11/004/11/00
9:4513:30
NANA
291.24288.57
0.92 6.1 127 289.905
2.6 50 Hurd Creek S13 4/10/00 16:45 NA 4.61 9.90 NA NA 4.85
4/11/00 11:15 NA 5.09
1.8 27 Matriotti Creek S14 4/10/00 13:00 NA 12.38 2.47 12.5 209 12.535
4/11/00 13:15 NA 12.69 -11.624/10/00 15:55 NA 14.5624/10/00 16:20 NA 16.5624/10/00 16:15 NA 15.8824/10/00 16:18 NA 15.2
0.71 15 Dungeness River at School House Bridge
S15 4/11/004/11/00
9:3011:20
NANA
292.39298.97
2.23 8.6 132 295.68
Clallam County, Washington, April and October 2000 and April 2001
[Computed gain/loss: Computed using all average discharges from the start of a seeepage reach (bold) through the end of the reach (next bold). ft3/s, cubic feet pesecond; oC, degrees Celsius; µS/cm@25oC, microsiemens per centimeter at 25 degrees Celsius; USGS, U.S. Geological Survey; NA, data not recorded]
Table 7 51
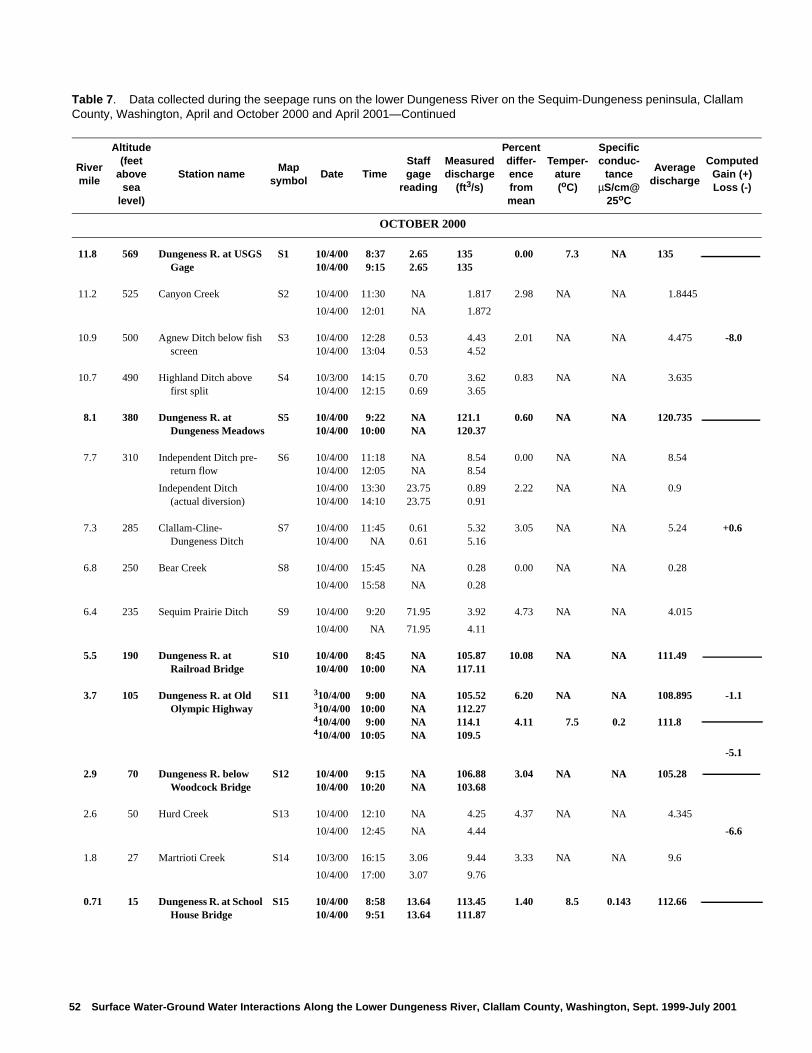
OCTOBER 2000
11.8 569 Dungeness R. at USGS Gage
S1 10/4/0010/4/00
8:379:15
2.652.65
135135
0.00 7.3 NA 135
11.2 525 Canyon Creek S2 10/4/00 11:30 NA 1.817 2.98 NA NA 1.8445
10/4/00 12:01 NA 1.872
10.9 500 Agnew Ditch below fish screen
S3 10/4/0010/4/00
12:2813:04
0.530.53
4.434.52
2.01 NA NA 4.475 -8.0
10.7 490 Highland Ditch above first split
S4 10/3/0010/4/00
14:1512:15
0.700.69
3.623.65
0.83 NA NA 3.635
8.1 380 Dungeness R. at Dungeness Meadows
S5 10/4/0010/4/00
9:2210:00
NANA
121.1120.37
0.60 NA NA 120.735
7.7 310 Independent Ditch pre- return flow
S6 10/4/0010/4/00
11:1812:05
NANA
8.548.54
0.00 NA NA 8.54
Independent Ditch (actual diversion)
10/4/0010/4/00
13:3014:10
23.7523.75
0.890.91
2.22 NA NA 0.9
7.3 285 Clallam-Cline-Dungeness Ditch
S7 10/4/0010/4/00
11:45NA
0.610.61
5.325.16
3.05 NA NA 5.24 +0.6
6.8 250 Bear Creek S8 10/4/00 15:45 NA 0.28 0.00 NA NA 0.28
10/4/00 15:58 NA 0.28
6.4 235 Sequim Prairie Ditch S9 10/4/00 9:20 71.95 3.92 4.73 NA NA 4.015
10/4/00 NA 71.95 4.11
5.5 190 Dungeness R. at Railroad Bridge
S10 10/4/0010/4/00
8:4510:00
NANA
105.87117.11
10.08 NA NA 111.49
3.7 105 Dungeness R. at Old Olympic Highway
S11 310/4/00310/4/00410/4/00410/4/00
9:0010:00
9:0010:05
NANANANA
105.52112.27114.1109.5
6.20
4.11
NA
7.5
NA
0.2
108.895
111.8
-1.1
-5.1
2.9 70 Dungeness R. below Woodcock Bridge
S12 10/4/0010/4/00
9:1510:20
NANA
106.88103.68
3.04 NA NA 105.28
2.6 50 Hurd Creek S13 10/4/00 12:10 NA 4.25 4.37 NA NA 4.345
10/4/00 12:45 NA 4.44 -6.6
1.8 27 Martrioti Creek S14 10/3/00 16:15 3.06 9.44 3.33 NA NA 9.6
10/4/00 17:00 3.07 9.76
0.71 15 Dungeness R. at School House Bridge
S15 10/4/0010/4/00
8:589:51
13.6413.64
113.45111.87
1.40 8.5 0.143 112.66
Table 7. Data collected during the seepage runs on the lower Dungeness River on the Sequim-Dungeness peninsula, Clallam County, Washington, April and October 2000 and April 2001—Continued
River mile
Altitude (feet
above sea
level)
Station nameMap
symbolDate Time
Staff gage
reading
Measured discharge
(ft3/s)
Percent differ-ence from mean
Temper-ature (oC)
Specific conduc-
tance µS/cm@
25oC
Average discharge
Computed Gain (+) Loss (-)
52 Surface Water-Ground Water Interactions Along the Lower Dungeness River, Clallam County, Washington, Sept. 1999-July 2001
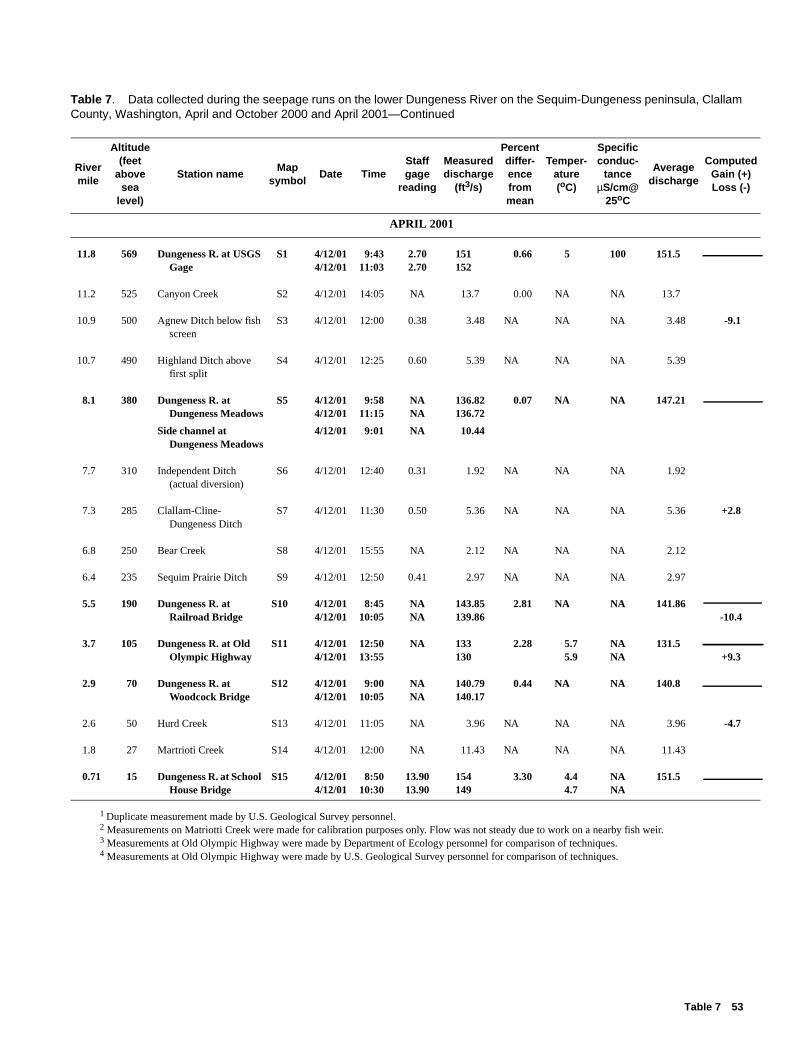
APRIL 2001
11.8 569 Dungeness R. at USGS Gage
S1 4/12/014/12/01
9:4311:03
2.702.70
151152
0.66 5 100 151.5
11.2 525 Canyon Creek S2 4/12/01 14:05 NA 13.7 0.00 NA NA 13.7
10.9 500 Agnew Ditch below fish screen
S3 4/12/01 12:00 0.38 3.48 NA NA NA 3.48 -9.1
10.7 490 Highland Ditch above first split
S4 4/12/01 12:25 0.60 5.39 NA NA NA 5.39
8.1 380 Dungeness R. at Dungeness Meadows
S5 4/12/014/12/01
9:5811:15
NANA
136.82136.72
0.07 NA NA 147.21
Side channel at Dungeness Meadows
4/12/01 9:01 NA 10.44
7.7 310 Independent Ditch (actual diversion)
S6 4/12/01 12:40 0.31 1.92 NA NA NA 1.92
7.3 285 Clallam-Cline-Dungeness Ditch
S7 4/12/01 11:30 0.50 5.36 NA NA NA 5.36 +2.8
6.8 250 Bear Creek S8 4/12/01 15:55 NA 2.12 NA NA NA 2.12
6.4 235 Sequim Prairie Ditch S9 4/12/01 12:50 0.41 2.97 NA NA NA 2.97
5.5 190 Dungeness R. at Railroad Bridge
S10 4/12/014/12/01
8:4510:05
NANA
143.85139.86
2.81 NA NA 141.86-10.4
3.7 105 Dungeness R. at Old Olympic Highway
S11 4/12/014/12/01
12:5013:55
NA 133130
2.28 5.75.9
NANA
131.5+9.3
2.9 70 Dungeness R. at Woodcock Bridge
S12 4/12/014/12/01
9:0010:05
NANA
140.79140.17
0.44 NA NA 140.8
2.6 50 Hurd Creek S13 4/12/01 11:05 NA 3.96 NA NA NA 3.96 -4.7
1.8 27 Martrioti Creek S14 4/12/01 12:00 NA 11.43 NA NA NA 11.43
0.71 15 Dungeness R. at School House Bridge
S15 4/12/014/12/01
8:5010:30
13.9013.90
154149
3.30 4.44.7
NANA
151.5
1 Duplicate measurement made by U.S. Geological Survey personnel. 2 Measurements on Matriotti Creek were made for calibration purposes only. Flow was not steady due to work on a nearby fish weir.3 Measurements at Old Olympic Highway were made by Department of Ecology personnel for comparison of techniques.4 Measurements at Old Olympic Highway were made by U.S. Geological Survey personnel for comparison of techniques.
Table 7. Data collected during the seepage runs on the lower Dungeness River on the Sequim-Dungeness peninsula, Clallam County, Washington, April and October 2000 and April 2001—Continued
River mile
Altitude (feet
above sea
level)
Station nameMap
symbolDate Time
Staff gage
reading
Measured discharge
(ft3/s)
Percent differ-ence from mean
Temper-ature (oC)
Specific conduc-
tance µS/cm@
25oC
Average discharge
ComputedGain (+) Loss (-)
Table 7 53
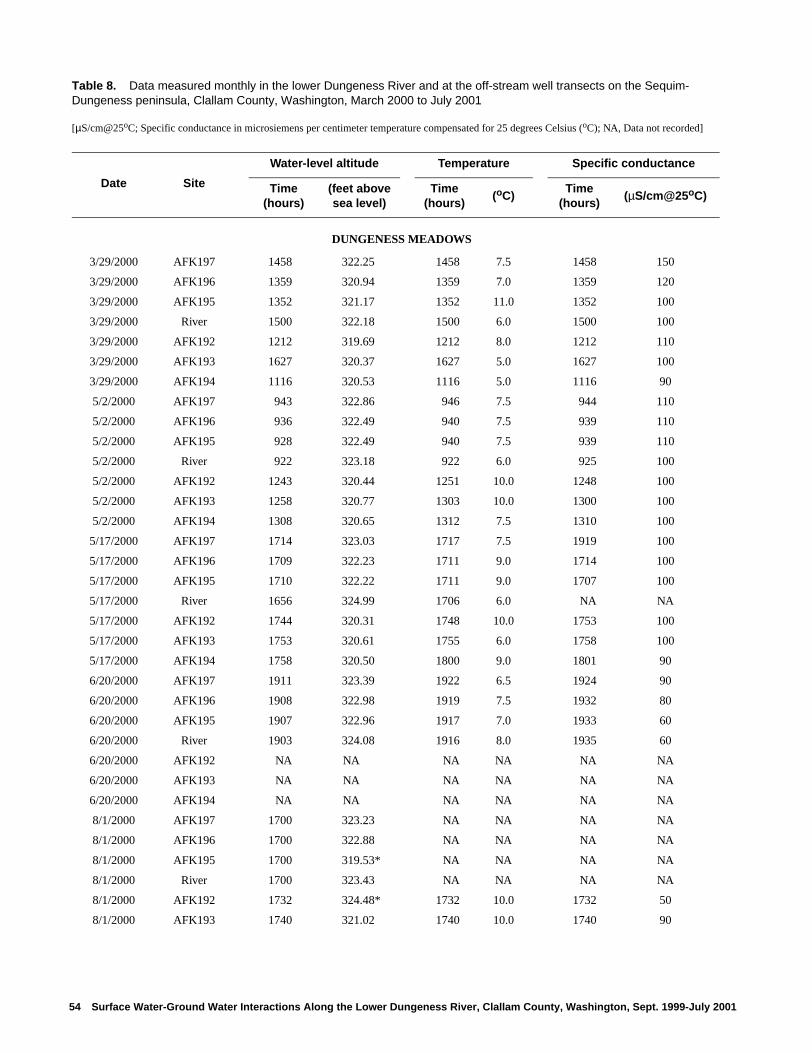
Table 8. Data measured monthly in the lower Dungeness River and at the off-stream well transects on the Sequim-Dungeness peninsula, Clallam County, Washington, March 2000 to July 2001—Continued
Date Site
Water-level altitude Temperature Specific conductance
Time (hours)
(feet above sea level)
Time (hours)
(oC)Time
(hours)(µS/cm@25oC)
DUNGENESS MEADOWS
3/29/2000 AFK197 1458 322.25 1458 7.5 1458 150
3/29/2000 AFK196 1359 320.94 1359 7.0 1359 120
3/29/2000 AFK195 1352 321.17 1352 11.0 1352 100
3/29/2000 River 1500 322.18 1500 6.0 1500 100
3/29/2000 AFK192 1212 319.69 1212 8.0 1212 110
3/29/2000 AFK193 1627 320.37 1627 5.0 1627 100
3/29/2000 AFK194 1116 320.53 1116 5.0 1116 90
5/2/2000 AFK197 943 322.86 946 7.5 944 110
5/2/2000 AFK196 936 322.49 940 7.5 939 110
5/2/2000 AFK195 928 322.49 940 7.5 939 110
5/2/2000 River 922 323.18 922 6.0 925 100
5/2/2000 AFK192 1243 320.44 1251 10.0 1248 100
5/2/2000 AFK193 1258 320.77 1303 10.0 1300 100
5/2/2000 AFK194 1308 320.65 1312 7.5 1310 100
5/17/2000 AFK197 1714 323.03 1717 7.5 1919 100
5/17/2000 AFK196 1709 322.23 1711 9.0 1714 100
5/17/2000 AFK195 1710 322.22 1711 9.0 1707 100
5/17/2000 River 1656 324.99 1706 6.0 NA NA
5/17/2000 AFK192 1744 320.31 1748 10.0 1753 100
5/17/2000 AFK193 1753 320.61 1755 6.0 1758 100
5/17/2000 AFK194 1758 320.50 1800 9.0 1801 90
6/20/2000 AFK197 1911 323.39 1922 6.5 1924 90
6/20/2000 AFK196 1908 322.98 1919 7.5 1932 80
6/20/2000 AFK195 1907 322.96 1917 7.0 1933 60
6/20/2000 River 1903 324.08 1916 8.0 1935 60
6/20/2000 AFK192 NA NA NA NA NA NA
6/20/2000 AFK193 NA NA NA NA NA NA
6/20/2000 AFK194 NA NA NA NA NA NA
8/1/2000 AFK197 1700 323.23 NA NA NA NA
8/1/2000 AFK196 1700 322.88 NA NA NA NA
8/1/2000 AFK195 1700 319.53* NA NA NA NA
8/1/2000 River 1700 323.43 NA NA NA NA
8/1/2000 AFK192 1732 324.48* 1732 10.0 1732 50
8/1/2000 AFK193 1740 321.02 1740 10.0 1740 90
Table 8. Data measured monthly in the lower Dungeness River and at the off-stream well transects on the Sequim-Dungeness peninsula, Clallam County, Washington, March 2000 to July 2001
[µS/cm@25oC; Specific conductance in microsiemens per centimeter temperature compensated for 25 degrees Celsius (oC); NA, Data not recorded]
54 Surface Water-Ground Water Interactions Along the Lower Dungeness River, Clallam County, Washington, Sept. 1999-July 2001
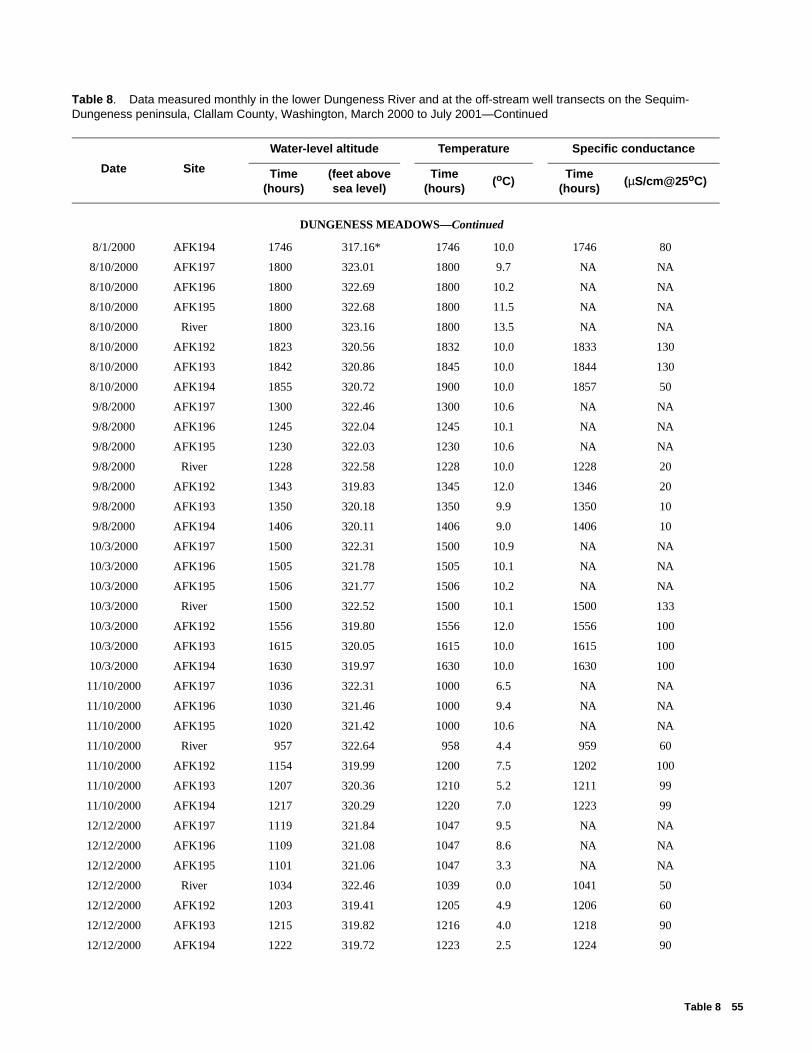
DUNGENESS MEADOWS—Continued
8/1/2000 AFK194 1746 317.16* 1746 10.0 1746 80
8/10/2000 AFK197 1800 323.01 1800 9.7 NA NA
8/10/2000 AFK196 1800 322.69 1800 10.2 NA NA
8/10/2000 AFK195 1800 322.68 1800 11.5 NA NA
8/10/2000 River 1800 323.16 1800 13.5 NA NA
8/10/2000 AFK192 1823 320.56 1832 10.0 1833 130
8/10/2000 AFK193 1842 320.86 1845 10.0 1844 130
8/10/2000 AFK194 1855 320.72 1900 10.0 1857 50
9/8/2000 AFK197 1300 322.46 1300 10.6 NA NA
9/8/2000 AFK196 1245 322.04 1245 10.1 NA NA
9/8/2000 AFK195 1230 322.03 1230 10.6 NA NA
9/8/2000 River 1228 322.58 1228 10.0 1228 20
9/8/2000 AFK192 1343 319.83 1345 12.0 1346 20
9/8/2000 AFK193 1350 320.18 1350 9.9 1350 10
9/8/2000 AFK194 1406 320.11 1406 9.0 1406 10
10/3/2000 AFK197 1500 322.31 1500 10.9 NA NA
10/3/2000 AFK196 1505 321.78 1505 10.1 NA NA
10/3/2000 AFK195 1506 321.77 1506 10.2 NA NA
10/3/2000 River 1500 322.52 1500 10.1 1500 133
10/3/2000 AFK192 1556 319.80 1556 12.0 1556 100
10/3/2000 AFK193 1615 320.05 1615 10.0 1615 100
10/3/2000 AFK194 1630 319.97 1630 10.0 1630 100
11/10/2000 AFK197 1036 322.31 1000 6.5 NA NA
11/10/2000 AFK196 1030 321.46 1000 9.4 NA NA
11/10/2000 AFK195 1020 321.42 1000 10.6 NA NA
11/10/2000 River 957 322.64 958 4.4 959 60
11/10/2000 AFK192 1154 319.99 1200 7.5 1202 100
11/10/2000 AFK193 1207 320.36 1210 5.2 1211 99
11/10/2000 AFK194 1217 320.29 1220 7.0 1223 99
12/12/2000 AFK197 1119 321.84 1047 9.5 NA NA
12/12/2000 AFK196 1109 321.08 1047 8.6 NA NA
12/12/2000 AFK195 1101 321.06 1047 3.3 NA NA
12/12/2000 River 1034 322.46 1039 0.0 1041 50
12/12/2000 AFK192 1203 319.41 1205 4.9 1206 60
12/12/2000 AFK193 1215 319.82 1216 4.0 1218 90
12/12/2000 AFK194 1222 319.72 1223 2.5 1224 90
Table 8. Data measured monthly in the lower Dungeness River and at the off-stream well transects on the Sequim-Dungeness peninsula, Clallam County, Washington, March 2000 to July 2001—Continued
Date Site
Water-level altitude Temperature Specific conductance
Time (hours)
(feet above sea level)
Time (hours)
(oC)Time
(hours)(µS/cm@25oC)
Table 8 55
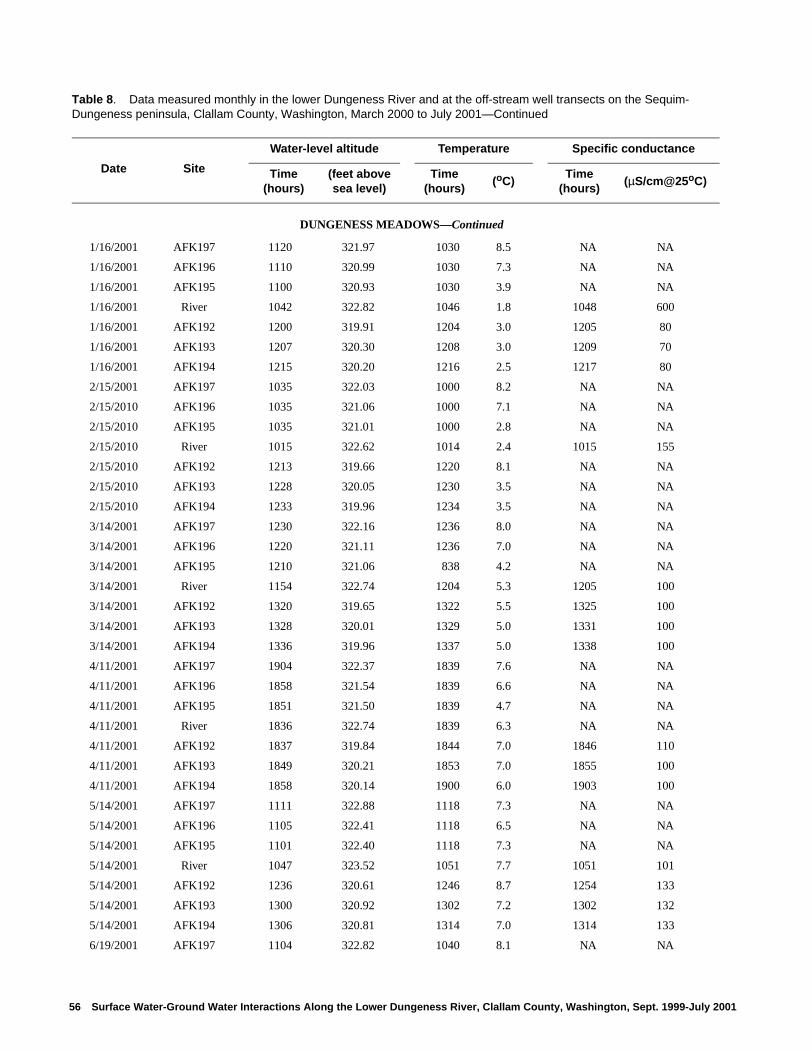
DUNGENESS MEADOWS—Continued
1/16/2001 AFK197 1120 321.97 1030 8.5 NA NA
1/16/2001 AFK196 1110 320.99 1030 7.3 NA NA
1/16/2001 AFK195 1100 320.93 1030 3.9 NA NA
1/16/2001 River 1042 322.82 1046 1.8 1048 600
1/16/2001 AFK192 1200 319.91 1204 3.0 1205 80
1/16/2001 AFK193 1207 320.30 1208 3.0 1209 70
1/16/2001 AFK194 1215 320.20 1216 2.5 1217 80
2/15/2001 AFK197 1035 322.03 1000 8.2 NA NA
2/15/2010 AFK196 1035 321.06 1000 7.1 NA NA
2/15/2010 AFK195 1035 321.01 1000 2.8 NA NA
2/15/2010 River 1015 322.62 1014 2.4 1015 155
2/15/2010 AFK192 1213 319.66 1220 8.1 NA NA
2/15/2010 AFK193 1228 320.05 1230 3.5 NA NA
2/15/2010 AFK194 1233 319.96 1234 3.5 NA NA
3/14/2001 AFK197 1230 322.16 1236 8.0 NA NA
3/14/2001 AFK196 1220 321.11 1236 7.0 NA NA
3/14/2001 AFK195 1210 321.06 838 4.2 NA NA
3/14/2001 River 1154 322.74 1204 5.3 1205 100
3/14/2001 AFK192 1320 319.65 1322 5.5 1325 100
3/14/2001 AFK193 1328 320.01 1329 5.0 1331 100
3/14/2001 AFK194 1336 319.96 1337 5.0 1338 100
4/11/2001 AFK197 1904 322.37 1839 7.6 NA NA
4/11/2001 AFK196 1858 321.54 1839 6.6 NA NA
4/11/2001 AFK195 1851 321.50 1839 4.7 NA NA
4/11/2001 River 1836 322.74 1839 6.3 NA NA
4/11/2001 AFK192 1837 319.84 1844 7.0 1846 110
4/11/2001 AFK193 1849 320.21 1853 7.0 1855 100
4/11/2001 AFK194 1858 320.14 1900 6.0 1903 100
5/14/2001 AFK197 1111 322.88 1118 7.3 NA NA
5/14/2001 AFK196 1105 322.41 1118 6.5 NA NA
5/14/2001 AFK195 1101 322.40 1118 7.3 NA NA
5/14/2001 River 1047 323.52 1051 7.7 1051 101
5/14/2001 AFK192 1236 320.61 1246 8.7 1254 133
5/14/2001 AFK193 1300 320.92 1302 7.2 1302 132
5/14/2001 AFK194 1306 320.81 1314 7.0 1314 133
6/19/2001 AFK197 1104 322.82 1040 8.1 NA NA
Table 8. Data measured monthly in the lower Dungeness River and at the off-stream well transects on the Sequim-Dungeness peninsula, Clallam County, Washington, March 2000 to July 2001—Continued
Date Site
Water-level altitude Temperature Specific conductance
Time (hours)
(feet above sea level)
Time (hours)
(oC)Time
(hours)(µS/cm@25oC)
56 Surface Water-Ground Water Interactions Along the Lower Dungeness River, Clallam County, Washington, Sept. 1999-July 2001
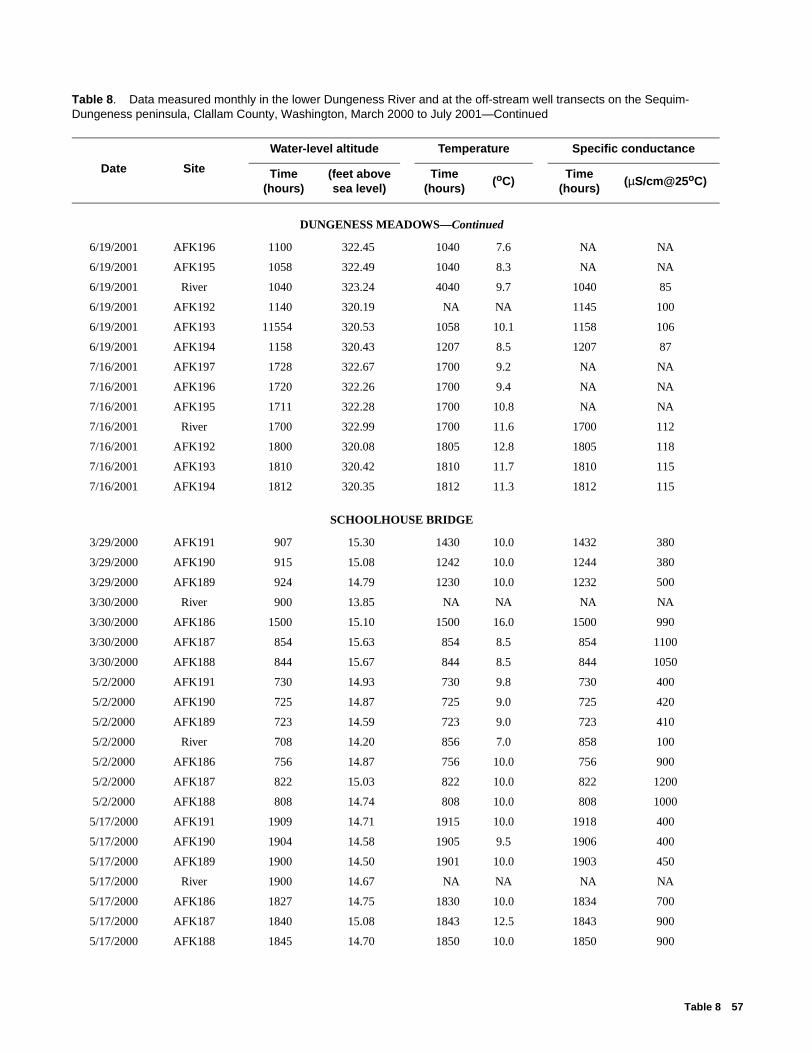
DUNGENESS MEADOWS—Continued
6/19/2001 AFK196 1100 322.45 1040 7.6 NA NA
6/19/2001 AFK195 1058 322.49 1040 8.3 NA NA
6/19/2001 River 1040 323.24 4040 9.7 1040 85
6/19/2001 AFK192 1140 320.19 NA NA 1145 100
6/19/2001 AFK193 11554 320.53 1058 10.1 1158 106
6/19/2001 AFK194 1158 320.43 1207 8.5 1207 87
7/16/2001 AFK197 1728 322.67 1700 9.2 NA NA
7/16/2001 AFK196 1720 322.26 1700 9.4 NA NA
7/16/2001 AFK195 1711 322.28 1700 10.8 NA NA
7/16/2001 River 1700 322.99 1700 11.6 1700 112
7/16/2001 AFK192 1800 320.08 1805 12.8 1805 118
7/16/2001 AFK193 1810 320.42 1810 11.7 1810 115
7/16/2001 AFK194 1812 320.35 1812 11.3 1812 115
SCHOOLHOUSE BRIDGE
3/29/2000 AFK191 907 15.30 1430 10.0 1432 380
3/29/2000 AFK190 915 15.08 1242 10.0 1244 380
3/29/2000 AFK189 924 14.79 1230 10.0 1232 500
3/30/2000 River 900 13.85 NA NA NA NA
3/30/2000 AFK186 1500 15.10 1500 16.0 1500 990
3/30/2000 AFK187 854 15.63 854 8.5 854 1100
3/30/2000 AFK188 844 15.67 844 8.5 844 1050
5/2/2000 AFK191 730 14.93 730 9.8 730 400
5/2/2000 AFK190 725 14.87 725 9.0 725 420
5/2/2000 AFK189 723 14.59 723 9.0 723 410
5/2/2000 River 708 14.20 856 7.0 858 100
5/2/2000 AFK186 756 14.87 756 10.0 756 900
5/2/2000 AFK187 822 15.03 822 10.0 822 1200
5/2/2000 AFK188 808 14.74 808 10.0 808 1000
5/17/2000 AFK191 1909 14.71 1915 10.0 1918 400
5/17/2000 AFK190 1904 14.58 1905 9.5 1906 400
5/17/2000 AFK189 1900 14.50 1901 10.0 1903 450
5/17/2000 River 1900 14.67 NA NA NA NA
5/17/2000 AFK186 1827 14.75 1830 10.0 1834 700
5/17/2000 AFK187 1840 15.08 1843 12.5 1843 900
5/17/2000 AFK188 1845 14.70 1850 10.0 1850 900
Table 8. Data measured monthly in the lower Dungeness River and at the off-stream well transects on the Sequim-Dungeness peninsula, Clallam County, Washington, March 2000 to July 2001—Continued
Date Site
Water-level altitude Temperature Specific conductance
Time (hours)
(feet above sea level)
Time (hours)
(oC)Time
(hours)(µS/cm@25oC)
Table 8 57
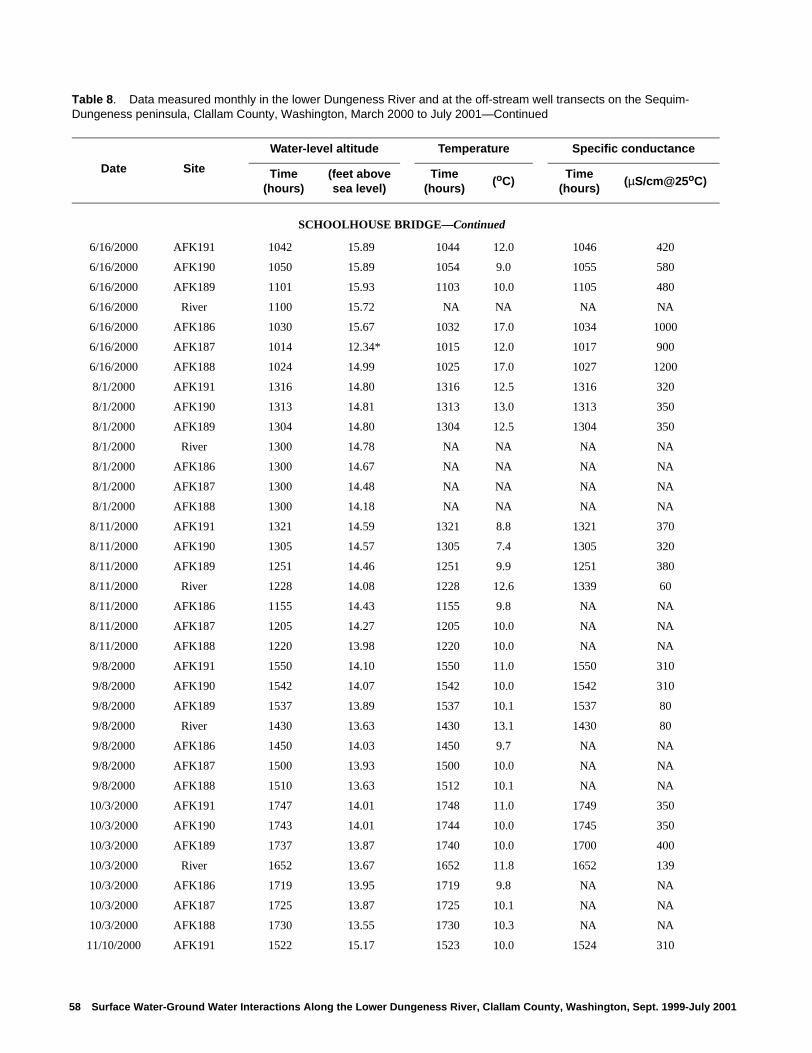
SCHOOLHOUSE BRIDGE—Continued
6/16/2000 AFK191 1042 15.89 1044 12.0 1046 420
6/16/2000 AFK190 1050 15.89 1054 9.0 1055 580
6/16/2000 AFK189 1101 15.93 1103 10.0 1105 480
6/16/2000 River 1100 15.72 NA NA NA NA
6/16/2000 AFK186 1030 15.67 1032 17.0 1034 1000
6/16/2000 AFK187 1014 12.34* 1015 12.0 1017 900
6/16/2000 AFK188 1024 14.99 1025 17.0 1027 1200
8/1/2000 AFK191 1316 14.80 1316 12.5 1316 320
8/1/2000 AFK190 1313 14.81 1313 13.0 1313 350
8/1/2000 AFK189 1304 14.80 1304 12.5 1304 350
8/1/2000 River 1300 14.78 NA NA NA NA
8/1/2000 AFK186 1300 14.67 NA NA NA NA
8/1/2000 AFK187 1300 14.48 NA NA NA NA
8/1/2000 AFK188 1300 14.18 NA NA NA NA
8/11/2000 AFK191 1321 14.59 1321 8.8 1321 370
8/11/2000 AFK190 1305 14.57 1305 7.4 1305 320
8/11/2000 AFK189 1251 14.46 1251 9.9 1251 380
8/11/2000 River 1228 14.08 1228 12.6 1339 60
8/11/2000 AFK186 1155 14.43 1155 9.8 NA NA
8/11/2000 AFK187 1205 14.27 1205 10.0 NA NA
8/11/2000 AFK188 1220 13.98 1220 10.0 NA NA
9/8/2000 AFK191 1550 14.10 1550 11.0 1550 310
9/8/2000 AFK190 1542 14.07 1542 10.0 1542 310
9/8/2000 AFK189 1537 13.89 1537 10.1 1537 80
9/8/2000 River 1430 13.63 1430 13.1 1430 80
9/8/2000 AFK186 1450 14.03 1450 9.7 NA NA
9/8/2000 AFK187 1500 13.93 1500 10.0 NA NA
9/8/2000 AFK188 1510 13.63 1512 10.1 NA NA
10/3/2000 AFK191 1747 14.01 1748 11.0 1749 350
10/3/2000 AFK190 1743 14.01 1744 10.0 1745 350
10/3/2000 AFK189 1737 13.87 1740 10.0 1700 400
10/3/2000 River 1652 13.67 1652 11.8 1652 139
10/3/2000 AFK186 1719 13.95 1719 9.8 NA NA
10/3/2000 AFK187 1725 13.87 1725 10.1 NA NA
10/3/2000 AFK188 1730 13.55 1730 10.3 NA NA
11/10/2000 AFK191 1522 15.17 1523 10.0 1524 310
Table 8. Data measured monthly in the lower Dungeness River and at the off-stream well transects on the Sequim-Dungeness peninsula, Clallam County, Washington, March 2000 to July 2001—Continued
Date Site
Water-level altitude Temperature Specific conductance
Time (hours)
(feet above sea level)
Time (hours)
(oC)Time
(hours)(µS/cm@25oC)
58 Surface Water-Ground Water Interactions Along the Lower Dungeness River, Clallam County, Washington, Sept. 1999-July 2001
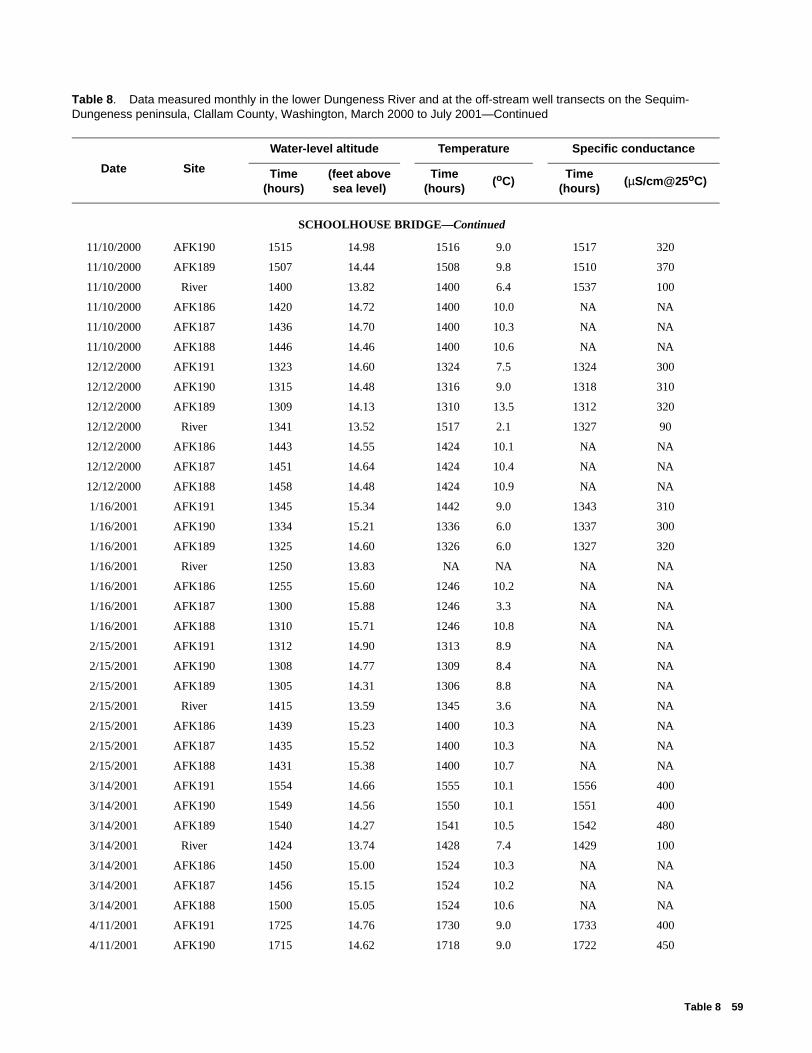
SCHOOLHOUSE BRIDGE—Continued
11/10/2000 AFK190 1515 14.98 1516 9.0 1517 320
11/10/2000 AFK189 1507 14.44 1508 9.8 1510 370
11/10/2000 River 1400 13.82 1400 6.4 1537 100
11/10/2000 AFK186 1420 14.72 1400 10.0 NA NA
11/10/2000 AFK187 1436 14.70 1400 10.3 NA NA
11/10/2000 AFK188 1446 14.46 1400 10.6 NA NA
12/12/2000 AFK191 1323 14.60 1324 7.5 1324 300
12/12/2000 AFK190 1315 14.48 1316 9.0 1318 310
12/12/2000 AFK189 1309 14.13 1310 13.5 1312 320
12/12/2000 River 1341 13.52 1517 2.1 1327 90
12/12/2000 AFK186 1443 14.55 1424 10.1 NA NA
12/12/2000 AFK187 1451 14.64 1424 10.4 NA NA
12/12/2000 AFK188 1458 14.48 1424 10.9 NA NA
1/16/2001 AFK191 1345 15.34 1442 9.0 1343 310
1/16/2001 AFK190 1334 15.21 1336 6.0 1337 300
1/16/2001 AFK189 1325 14.60 1326 6.0 1327 320
1/16/2001 River 1250 13.83 NA NA NA NA
1/16/2001 AFK186 1255 15.60 1246 10.2 NA NA
1/16/2001 AFK187 1300 15.88 1246 3.3 NA NA
1/16/2001 AFK188 1310 15.71 1246 10.8 NA NA
2/15/2001 AFK191 1312 14.90 1313 8.9 NA NA
2/15/2001 AFK190 1308 14.77 1309 8.4 NA NA
2/15/2001 AFK189 1305 14.31 1306 8.8 NA NA
2/15/2001 River 1415 13.59 1345 3.6 NA NA
2/15/2001 AFK186 1439 15.23 1400 10.3 NA NA
2/15/2001 AFK187 1435 15.52 1400 10.3 NA NA
2/15/2001 AFK188 1431 15.38 1400 10.7 NA NA
3/14/2001 AFK191 1554 14.66 1555 10.1 1556 400
3/14/2001 AFK190 1549 14.56 1550 10.1 1551 400
3/14/2001 AFK189 1540 14.27 1541 10.5 1542 480
3/14/2001 River 1424 13.74 1428 7.4 1429 100
3/14/2001 AFK186 1450 15.00 1524 10.3 NA NA
3/14/2001 AFK187 1456 15.15 1524 10.2 NA NA
3/14/2001 AFK188 1500 15.05 1524 10.6 NA NA
4/11/2001 AFK191 1725 14.76 1730 9.0 1733 400
4/11/2001 AFK190 1715 14.62 1718 9.0 1722 450
Table 8. Data measured monthly in the lower Dungeness River and at the off-stream well transects on the Sequim-Dungeness peninsula, Clallam County, Washington, March 2000 to July 2001—Continued
Date Site
Water-level altitude Temperature Specific conductance
Time (hours)
(feet above sea level)
Time (hours)
(oC)Time
(hours)(µS/cm@25oC)
Table 8 59
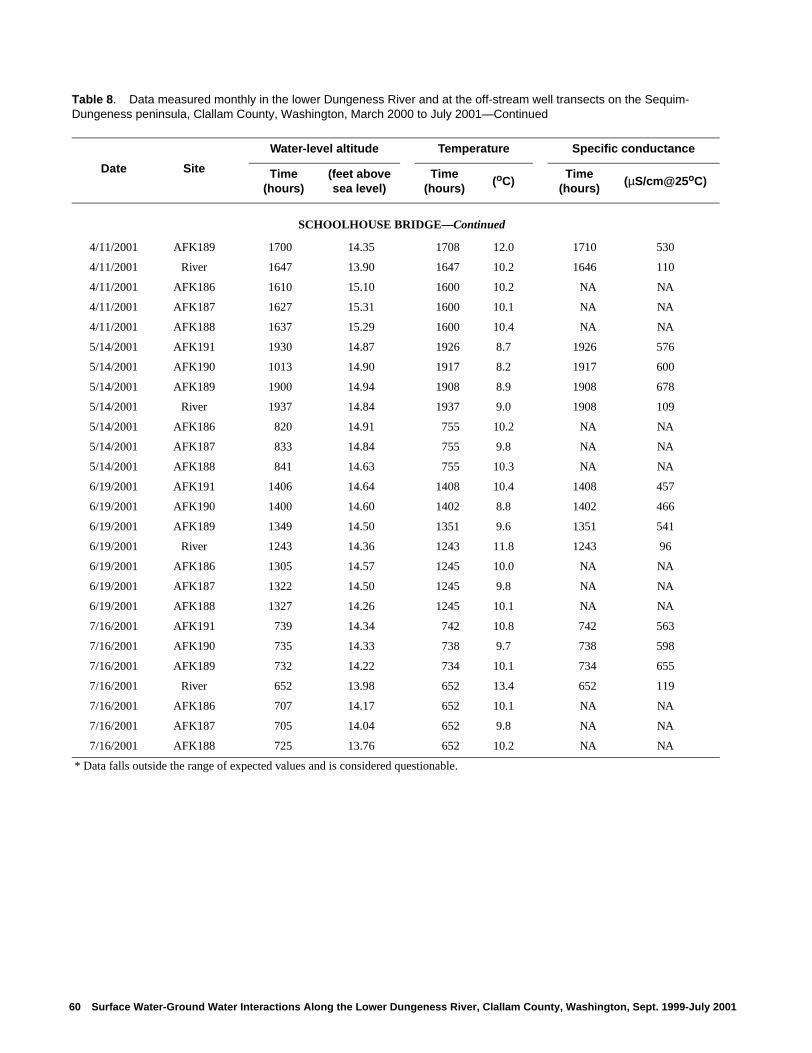
SCHOOLHOUSE BRIDGE—Continued
4/11/2001 AFK189 1700 14.35 1708 12.0 1710 530
4/11/2001 River 1647 13.90 1647 10.2 1646 110
4/11/2001 AFK186 1610 15.10 1600 10.2 NA NA
4/11/2001 AFK187 1627 15.31 1600 10.1 NA NA
4/11/2001 AFK188 1637 15.29 1600 10.4 NA NA
5/14/2001 AFK191 1930 14.87 1926 8.7 1926 576
5/14/2001 AFK190 1013 14.90 1917 8.2 1917 600
5/14/2001 AFK189 1900 14.94 1908 8.9 1908 678
5/14/2001 River 1937 14.84 1937 9.0 1908 109
5/14/2001 AFK186 820 14.91 755 10.2 NA NA
5/14/2001 AFK187 833 14.84 755 9.8 NA NA
5/14/2001 AFK188 841 14.63 755 10.3 NA NA
6/19/2001 AFK191 1406 14.64 1408 10.4 1408 457
6/19/2001 AFK190 1400 14.60 1402 8.8 1402 466
6/19/2001 AFK189 1349 14.50 1351 9.6 1351 541
6/19/2001 River 1243 14.36 1243 11.8 1243 96
6/19/2001 AFK186 1305 14.57 1245 10.0 NA NA
6/19/2001 AFK187 1322 14.50 1245 9.8 NA NA
6/19/2001 AFK188 1327 14.26 1245 10.1 NA NA
7/16/2001 AFK191 739 14.34 742 10.8 742 563
7/16/2001 AFK190 735 14.33 738 9.7 738 598
7/16/2001 AFK189 732 14.22 734 10.1 734 655
7/16/2001 River 652 13.98 652 13.4 652 119
7/16/2001 AFK186 707 14.17 652 10.1 NA NA
7/16/2001 AFK187 705 14.04 652 9.8 NA NA
7/16/2001 AFK188 725 13.76 652 10.2 NA NA
* Data falls outside the range of expected values and is considered questionable.
Table 8. Data measured monthly in the lower Dungeness River and at the off-stream well transects on the Sequim-Dungeness peninsula, Clallam County, Washington, March 2000 to July 2001—Continued
Date Site
Water-level altitude Temperature Specific conductance
Time (hours)
(feet above sea level)
Time (hours)
(oC)Time
(hours)(µS/cm@25oC)
60 Surface Water-Ground Water Interactions Along the Lower Dungeness River, Clallam County, Washington, Sept. 1999-July 2001

Surface Water-Ground W
ater Interactions Along the Lower Dungeness River, W
ASim
onds and Sinclair W
RIR 02-4161
Printed on recycled paper