Embed Size (px)
Citation preview

Save 21.11.04/ Print 22.11.04 EF C:\Documents and Settings\Ellen Fassbeck\My Documents \My Temp Files\GMPT\TC\GMPT Surface texture MSA in qs-Stat_eb.doc
© 2004 Q-DAS Inc., Q-DAS GmbH [email protected] ü Tel. 248-299-4910
Surface Texture Gage study in the qs-STAT Measurement System Analysis
Module
Q-DAS Library Living Documentation
Last edited: 11/22/2004 Version: EB

®
Surface Texture Gage
Evaluation
Save 21.11.04/ Print 22.11.04 EF GMPT Surface texture MSA in qs-Stat_eb.doc
© 2004 Q-DAS Inc., Q-DAS GmbH [email protected] ü Tel. 248-299-4910
2
Table of Contents
1 PROCEDURE ................................ ................................ ................................ ................................ 3
1.1 CALIBRATION STUDY ................................ ................................ ................................ ............... 3 1.2 PREPARATORY STUDY ................................ ................................ ................................ .............. 3 1.3 TYPE 2 STUDY ................................ ................................ ................................ ......................... 4
2 REQUIRED SETUP IN QS-STAT ................................ ................................ ................................ 5
3 EXAMPLE FOR A SURFACE TEXTURE STUDY IN QS-STAT................................ ............ 12
3.1 CALIBRATION STUDY ................................ ................................ ................................ ............ 12 3.2 PREPARATORY STUDY ................................ ................................ ................................ ........... 13 3.3 TYPE-2 ANOVA GR&R STUDY ................................ ................................ ......................... 14 3.4 SURFACE TEXTURE STUDY IN QS-STAT ................................ ................................ ................. 15

®
Surface Texture Gage
Evaluation
Save 21.11.04/ Print 22.11.04 EF GMPT Surface texture MSA in qs-Stat_eb.doc
© 2004 Q-DAS Inc., Q-DAS GmbH [email protected] ü Tel. 248-299-4910
3
1 Procedure
1.1 Calibration study “The system must be checked for proper function and calibrated before starting the Study, using a 3 patch precision reference standard and where required an appropriate calibration fixture. Verify the system by checking 5 times on each patch and calculate the average of the readings. This average must be within 5% of the known calibrated value. Calibration to the first patch sets gain, the second patch verifies linearity and the third patch validates the stylus. Completion of these tests shall demonstrate the instruments’ Accuracy and Linearity.” (quote from SP-Q-EMS-GLOBAL, chapter 3.10.1 Surface texture gages)
1.2 Preparatory study A preparatory study for each to be evaluated feature is conducted. Features are for example: Ra, Rmax, Rz, Wt, etc. “Surface Texture gages present a unique challenge to measurement systems analysis in that the variation in the parts may be large in comparison to the specification tolerance. Therefore, a preparatory study must be conducted to quantify the piece variation. Select a part that is a representative of the process to be analyzed by the
instrument. Measure 25 traces in one position (Do not move part or instrument). From
these trace results, calculate the instrument standard deviation si. Repeat step 2 with a minor incremental movement of the stylus relative to the
part, each time perpendicular to the lay. Measure 25 traces. From these trace results, calculate the total deviation st.
Calculate standard deviation within part ss ” (quote from SP-Q-EMS-GLOBAL, chapter 3.10.1 Surface texture gages) The standard deviation surface Ss for each feature is calculated with:
ss = 2 2ts is-

®
Surface Texture Gage
Evaluation
Save 21.11.04/ Print 22.11.04 EF GMPT Surface texture MSA in qs-Stat_eb.doc
© 2004 Q-DAS Inc., Q-DAS GmbH [email protected] ü Tel. 248-299-4910
4
1.3 Type 2 study Then a type 2 study is conducted. As it is impossible to eliminate the surface variation during the study, the calculated Surface Variation SV is subtracted from the “normal” R&R result. The resulting Surface Variation is calculated out of the R&R value with RR=(EV2+AV2+IA2-SV2)0.5
With SV=5.15*Ss (SV=Surface Variation; variation range of 99%) and EV (Equipment Variation), AV (Appraiser Variation) and IA (InterAction) calculated according the ANOVA method. Reference figure for the %G&R is the tolerance of each feature Requirements are Measurement system capable: %R&R </= 20% Measurement System conditionally capable: 20% </= %R&R </= 30%

®
Surface Texture Gage
Evaluation
Save 21.11.04/ Print 22.11.04 EF GMPT Surface texture MSA in qs-Stat_eb.doc
© 2004 Q-DAS Inc., Q-DAS GmbH [email protected] ü Tel. 248-299-4910
5
2 Required Setup in qs-STAT
1. Switch to the Measurement System Analysis module
2. call up or create an evaluation strategy under OPTIONS/CONFIGURATION OF EVALUATION
which includes the following three study types: SURFACES – CALIBRATION, SURFACES-PREPARATORY and TYPE 2 STUDY

®
Surface Texture Gage
Evaluation
Save 21.11.04/ Print 22.11.04 EF GMPT Surface texture MSA in qs-Stat_eb.doc
© 2004 Q-DAS Inc., Q-DAS GmbH [email protected] ü Tel. 248-299-4910
6
3. settings for SURFACES-CALIBRATION:

®
Surface Texture Gage
Evaluation
Save 21.11.04/ Print 22.11.04 EF GMPT Surface texture MSA in qs-Stat_eb.doc
© 2004 Q-DAS Inc., Q-DAS GmbH [email protected] ü Tel. 248-299-4910
7
4. settings for SURFACES-PREPARATORY

®
Surface Texture Gage
Evaluation
Save 21.11.04/ Print 22.11.04 EF GMPT Surface texture MSA in qs-Stat_eb.doc
© 2004 Q-DAS Inc., Q-DAS GmbH [email protected] ü Tel. 248-299-4910
8

®
Surface Texture Gage
Evaluation
Save 21.11.04/ Print 22.11.04 EF GMPT Surface texture MSA in qs-Stat_eb.doc
© 2004 Q-DAS Inc., Q-DAS GmbH [email protected] ü Tel. 248-299-4910
9
5. settings TYPE 2 STUDY

®
Surface Texture Gage
Evaluation
Save 21.11.04/ Print 22.11.04 EF GMPT Surface texture MSA in qs-Stat_eb.doc
© 2004 Q-DAS Inc., Q-DAS GmbH [email protected] ü Tel. 248-299-4910
10

®
Surface Texture Gage
Evaluation
Save 21.11.04/ Print 22.11.04 EF GMPT Surface texture MSA in qs-Stat_eb.doc
© 2004 Q-DAS Inc., Q-DAS GmbH [email protected] ü Tel. 248-299-4910
11
The so configured evaluation strategy needs to be selected before starting a new surface texture study file.
®
Surface Texture Gage
Evaluation
Save 21.11.04/ Print 22.11.04 EF GMPT Surface texture MSA in qs-Stat_eb.doc
© 2004 Q-DAS Inc., Q-DAS GmbH [email protected] ü Tel. 248-299-4910
12
3 Example for a Surface Texture Study in qs-STAT
3.1 Calibration Study CALIBRATION STUDY DATA FOR Ra ONLY
Trace # Calibration Patch
Linearity Patch
Stylus Check Patch*
1 0.002988 0.000315 0.0004062 0.002993 0.000317 0.0004383 0.002995 0.000316 0.0004364 0.002997 0.000316 0.0004425 0.002992 0.000316 0.000405Average 0.002993 0.000316 0.000398Certified Patch Value 0.00297 0.00031 0.00043Certified Value +5% 0.003119 0.000326 0.0005Certified Value -5% 0.002822 0.000295 0.0003
Is average within
Certified Value +/-
5%?,
YES YES YES
*Note: If using a 5 micron radius stylus on a PDR-6 Precision, Reference Standard (from Precision Devices, Inc.) Stylus Check patch, add 0.04 micron to the certified patch value. This correction applies to only the Stylus Check patch., , , , , , , , , ,
If the average of the measurements are within +/-5% of the Certified Patch Value, proceed with the preparatory study. Remark: the Calibration study results in this table were calculated in Excel.

®
Surface Texture Gage
Evaluation
Save 21.11.04/ Print 22.11.04 EF GMPT Surface texture MSA in qs-Stat_eb.doc
© 2004 Q-DAS Inc., Q-DAS GmbH [email protected] ü Tel. 248-299-4910
13
3.2 Preparatory Study Example data for 2 features: Rz and Wt 25 traces in 1 position 25 traces with repositioning after
each Trace # Rz [mm] Wt [mm] Trace # Rz [mm] Wt [mm] 1 0.000627 0.000666 1 0.000462 0.000343
2 0.000744 0.000625 2 0.000653 0.0003963 0.000479 0.000471 3 0.00063 0.0004374 0.000546 0.000495 4 0.000461 0.0004015 0.000502 0.000408 5 0.001482 0.0004736 0.000422 0.000367 6 0.000507 0.000412
7 0.000478 0.00038 7 0.000568 0.0004058 0.000278 0.000439 8 0.001087 0.00081
9 0.000569 0.000412 9 0.000384 0.00049310 0.00043 0.000427 10 0.000808 0.0004911 0.000628 0.00038 11 0.000888 0.000457
12 0.000633 0.000448 12 0.000959 0.00057813 0.000633 0.000426 13 0.000395 0.000387
14 0.00057 0.000386 14 0.00202 0.00072715 0.000553 0.000417 15 0.000956 0.00053716 0.000478 0.000367 16 0.000502 0.000541
17 0.000493 0.000417 17 0.001103 0.00050518 0.000498 0.00038 18 0.000088 0.00058619 0.00048 0.000368 19 0.000701 0.000416
20 0.000452 0.000365 20 0.002395 0.00094721 0.00046 0.00042 21 0.00083 0.000463
22 0.000404 0.000355 22 0.000101 0.00045523 0.000527 0.000392 23 0.001092 0.00062324 0.000498 0.000396 24 0.000893 0.000403
25 0.000403 0.000359 25 0.000942 0.000717Si = 0.000627 0.000666 St = 0.000462 0.000343

®
Surface Texture Gage
Evaluation
Save 21.11.04/ Print 22.11.04 EF GMPT Surface texture MSA in qs-Stat_eb.doc
© 2004 Q-DAS Inc., Q-DAS GmbH [email protected] ü Tel. 248-299-4910
14
3.3 TYPE-2 ANOVA GR&R STUDY for 5 parts, 2 operators and 3 trials Feature 1: Rz [mm]
Operator A Operator A Operator A Operator B Operator B Operator B Piece # Trial 1 Trial 2 Trial 3 Trial 1 Trial 2 Trial 3 1 0.000609 0.001812 0.002492 0.00038 0.002079 0.0001142 0.001109 0.001004 0.000743 0.001591 0.00166 0.0016843 0.002887 0.003366 0.002618 0.003927 0.004123 0.0040094 0.002146 0.001651 0.002556 0.00124 0.001452 0.0013775 0.003305 0.003713 0.006362 0.005451 0.005742 0.005917 Feature 2: Wt [mm]
Operator A Operator A Operator A Operator B Operator B Operator B Piece # Trial 1 Trial 2 Trial 3 Trial 1 Trial 2 Trial 3 1 0.000613 0.000649 0.000848 0.000588 0.001 0.0005082 0.000586 0.000592 0.000477 0.000708 0.000712 0.0007013 0.001104 0.001197 0.001219 0.000995 0.00101 0.0010264 0.000831 0.000623 0.000879 0.000655 0.000822 0.0006025 0.001905 0.001983 0.002658 0.002573 0.002532 0.002515

®
Surface Texture Gage
Evaluation
Save 21.11.04/ Print 22.11.04 EF GMPT Surface texture MSA in qs-Stat_eb.doc
© 2004 Q-DAS Inc., Q-DAS GmbH [email protected] ü Tel. 248-299-4910
15
3.4 Surface Texture Study in qs-STAT
1. select the menu function FILE / FILE NEW
2. Pick 1 characteristics for the “Surfaces – Overall Evaluation” and, here, 2 characteristics for each the “Surfaces – Preparatory” and “Type 2 study” (Rz and Wt):

®
Surface Texture Gage
Evaluation
Save 21.11.04/ Print 22.11.04 EF GMPT Surface texture MSA in qs-Stat_eb.doc
© 2004 Q-DAS Inc., Q-DAS GmbH [email protected] ü Tel. 248-299-4910
16
3. A blank parts and characteristics mask appear on the screen. First, the parts mask should be filled out.
4. After the parts data is entered, the parts mask can be closed. Only the characteristics mask is left on the screen and can be filled out. The active characteristic should be the first one , the” Overall - Evaluation”:

®
Surface Texture Gage
Evaluation
Save 21.11.04/ Print 22.11.04 EF GMPT Surface texture MSA in qs-Stat_eb.doc
© 2004 Q-DAS Inc., Q-DAS GmbH [email protected] ü Tel. 248-299-4910
17
5. If you want to perform a calibration study in addition to the preparatory and
type 2 study, please open up a “Parts-/ characteristics list” from the “Summary” menu item
6. Insert a new characteristic for the calibration study in front of the preparatory study with a right mouse-click

®
Surface Texture Gage
Evaluation
Save 21.11.04/ Print 22.11.04 EF GMPT Surface texture MSA in qs-Stat_eb.doc
© 2004 Q-DAS Inc., Q-DAS GmbH [email protected] ü Tel. 248-299-4910
18
7. Hit the “Execute evaluation” icon, close the “Parts-/ characteristics list and go back to the Characteristics Mask. In order to get a better overview over the available characteristics, a “Characteristics List” can also be shown in the characteristics mask. To do so, make sure the characteristics
mask is active and click on the “Info” - button Check the box for “Characteristic list”
8. The list in the can be used to navigate through the different characteristics. To fill out the information for the Calibration study, click on the second characteristi c in the list. A blank characteristic mask should come up. Double check the setting under “Evaluation type” whether it displays “Surfaces - Calibration” and fille out the required information . Set the number of parts to 3 the number of reference measureme nts to 1 and the number of repetitions to 5. Confirm each entry with the “Enter” key. The Unit for all characteristics and values should be “mm”.
®
Surface Texture Gage
Evaluation
Save 21.11.04/ Print 22.11.04 EF GMPT Surface texture MSA in qs-Stat_eb.doc
© 2004 Q-DAS Inc., Q-DAS GmbH [email protected] ü Tel. 248-299-4910
19
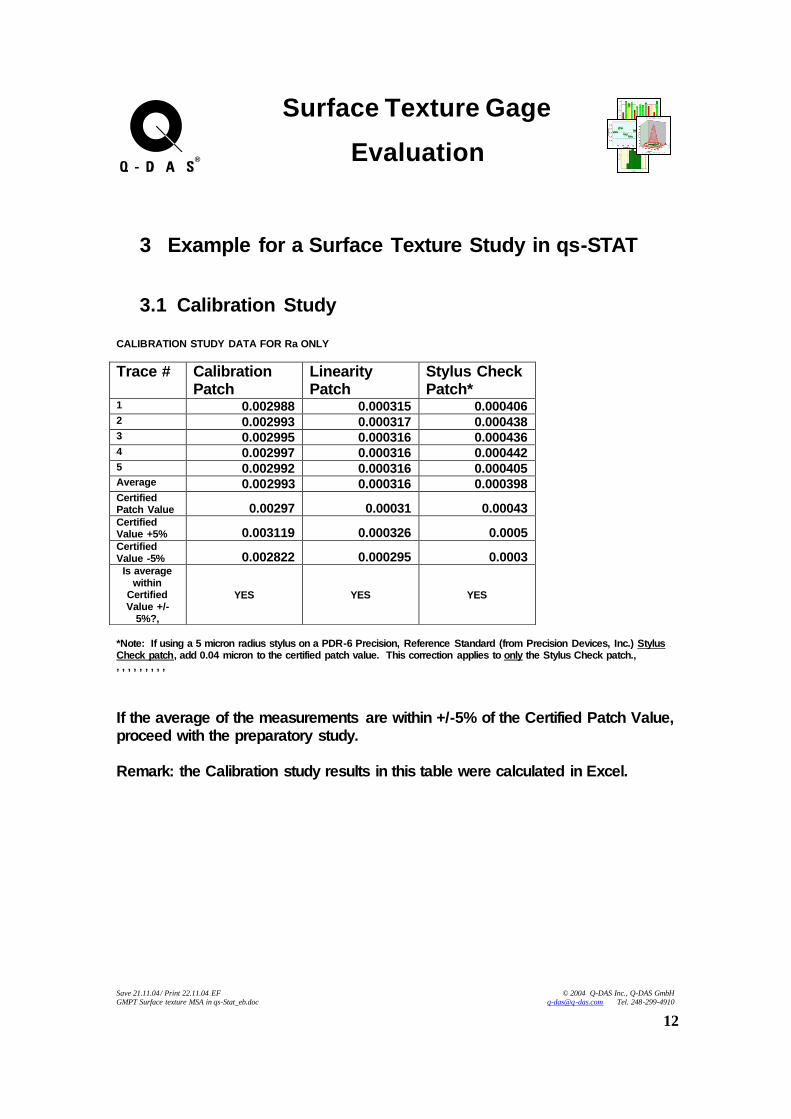
9. Rz Preparatory study.
Double check the settings for evaluation type whether it is set to “Preparatory study”. Set the “Number of marks” and “number of Repetitions” to 25. Enter Characteristic number, description, Nominal and Upper and lower Specification limits and gage resolution.
For a Surface Texture Study, it is very important to set the Measured Quantity” to “Rz …”. The information of the measured quantity is used to connect the preparatory study and the type 2 study characteristics.
10. Switch the characteristic and fill out the mask for the Rz Type 2 study.
The information for the measured quantity needs to be set the same as it is set in the associated preparatory study.

®
Surface Texture Gage
Evaluation
Save 21.11.04/ Print 22.11.04 EF GMPT Surface texture MSA in qs-Stat_eb.doc
© 2004 Q-DAS Inc., Q-DAS GmbH [email protected] ü Tel. 248-299-4910
20
11. Switch to the Characteristics Mask for the Wt characteristic and fill out the
information for the preparatory and the Type 2 study accordingly.
12. Close the Characteristics Mask

®
Surface Texture Gage
Evaluation
Save 21.11.04/ Print 22.11.04 EF GMPT Surface texture MSA in qs-Stat_eb.doc
© 2004 Q-DAS Inc., Q-DAS GmbH [email protected] ü Tel. 248-299-4910
21
13. Enter or Copy and paste the Measurement Values for each characteristic
into the Values Mask (unit: mm)
14. Close the Values Mask.
15. Define the Characteristics Structure: The characteristics for the “Overall Evaluation” needs to be set as an superimposed Characteristic. To do this, please open up a “Parts-/Characteristics list”.
®
Surface Texture Gage
Evaluation
Save 21.11.04/ Print 22.11.04 EF GMPT Surface texture MSA in qs-Stat_eb.doc
© 2004 Q-DAS Inc., Q-DAS GmbH [email protected] ü Tel. 248-299-4910
22
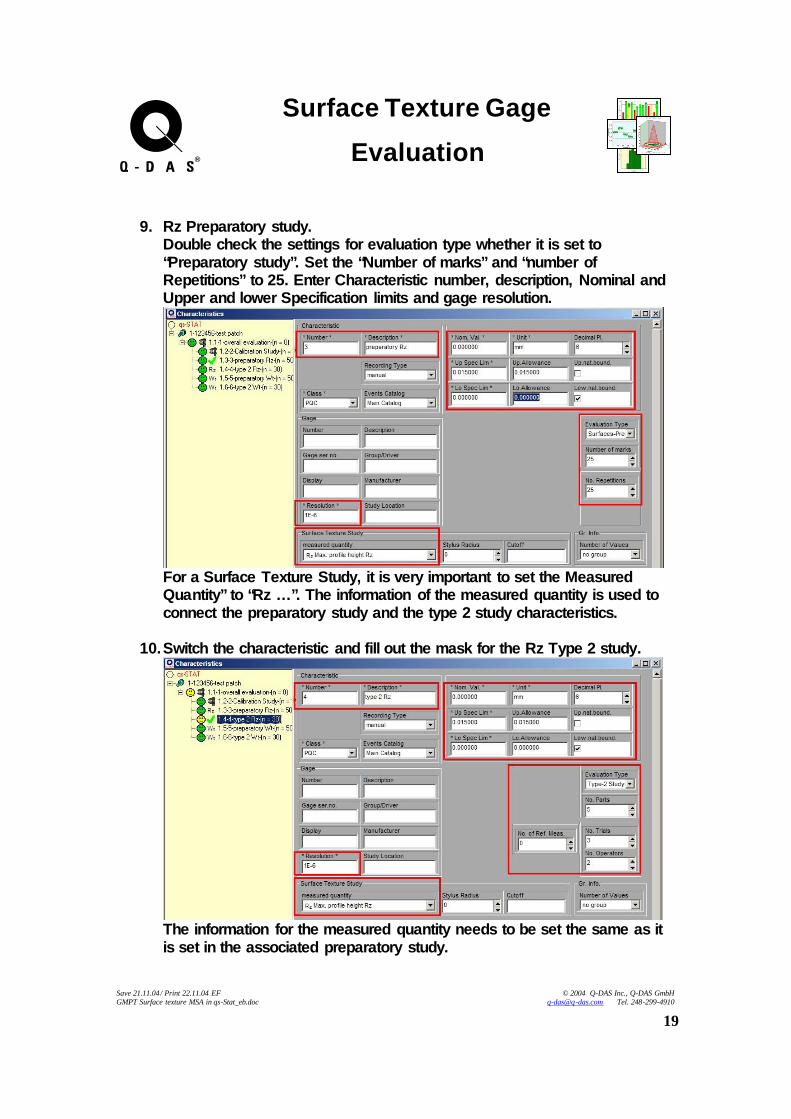
16. Drag and drop all other characteristics under the “overall evaluation”
characteristic:
if a characteristic for the calibration study was added, this characteristic needs to b “dragged and dropped” under the “overall evaluation” characteristic as well so that all characteristics are sub-ordinate to the “overall evaluation” characteristic.
17. The characteristics structure should look like this:
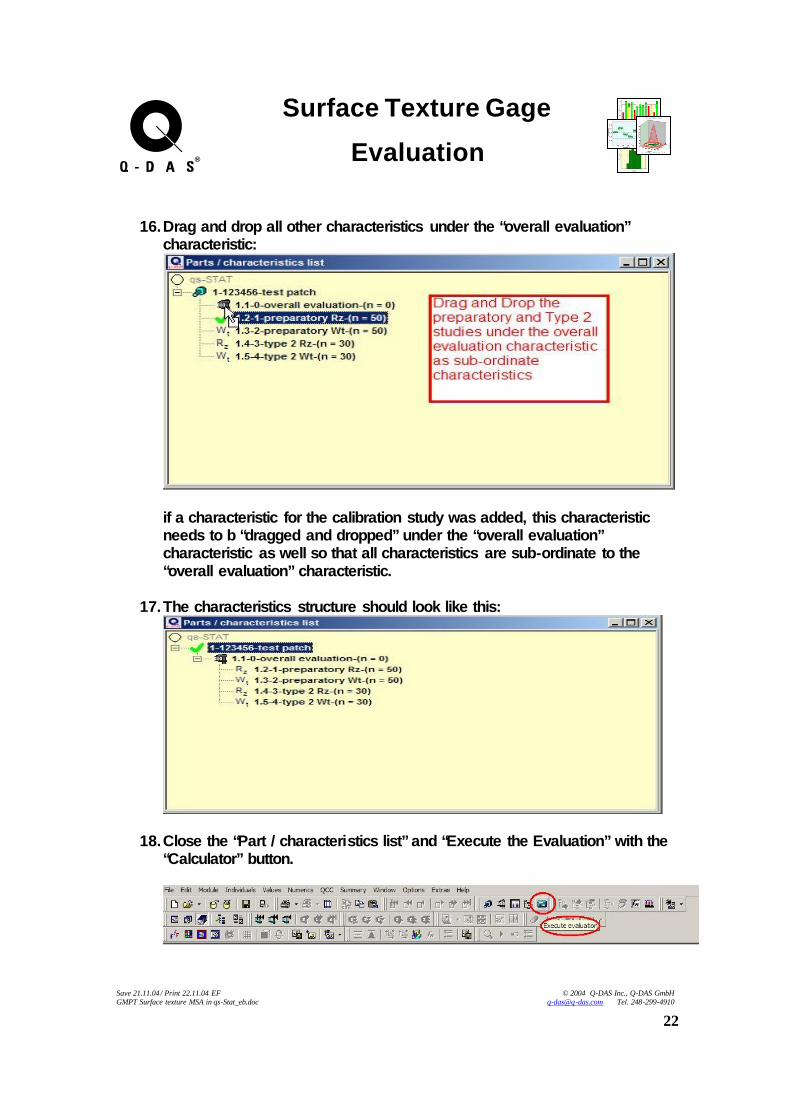
18. Close the “Part / characteristics list” and “Execute the Evaluation” with the “Calculator” button.

®
Surface Texture Gage
Evaluation
Save 21.11.04/ Print 22.11.04 EF GMPT Surface texture MSA in qs-Stat_eb.doc
© 2004 Q-DAS Inc., Q-DAS GmbH [email protected] ü Tel. 248-299-4910
23
19. Bring up the Charts, for example the Form Sheet 3 for the first “Overall
result” characteristic. It will only display a “Smiley face” if all studies have been passed. A question mark appears, if one or more characteristics are conditionally capable and all others are capable and a frowny face will be displayed, if one characteristic did not pass.
20. Switch to the next characteristic and bring up the Charts, for example the Value Chart Individuals, the Individual Values Chart (under “Numerics”) and the Form 3 for the Calibration study
The displayed results in the Form 3 refer to the maximum deviation of all three calibration patches. If one calibration patch fails, the whole calibration study is failed.

®
Surface Texture Gage
Evaluation
Save 21.11.04/ Print 22.11.04 EF GMPT Surface texture MSA in qs-Stat_eb.doc
© 2004 Q-DAS Inc., Q-DAS GmbH [email protected] ü Tel. 248-299-4910
24
21. The Value Chart Individuals and the Form 3 for the Preparatory study:
The numerical values Si, St and the Standard deviation Surface Ss have been calculated and are available on the Form 3.

®
Surface Texture Gage
Evaluation
Save 21.11.04/ Print 22.11.04 EF GMPT Surface texture MSA in qs-Stat_eb.doc
© 2004 Q-DAS Inc., Q-DAS GmbH [email protected] ü Tel. 248-299-4910
25
22. Switch to the Type 2 studies.
The Surface Variation SV has been calculated using the Ss from the associated preparatory study. The GR&R value is calculated with RR=(EV2+AV2+IA2-SV2)0.5