Embed Size (px)
Citation preview
Surface Science 208 (1989) 267-284
North-Holland, Amsterdam
267
SURFACE SEGREGATION OF Ba IN MgO
M. COTTER, S. CAMPBELL, L.L. CA0 *, R.G. EGDELL * *
Department of Chemistry, Imperial College, London S W7 2A Z, UK
and
W.C. MACKRODT
ICI PLC, Polymers and Chemicals Group, P.O. Box 8, The Heath, Runcorn, Cheshire, UK
Received 18 July 1988; accepted for publication 6 October 1988
Surface segregation of Ba in doped polycrystalline and single crystal MgO has been studied by
XPS. There is little variation in surface coverage of Ba over a range of bulk doping levels from 7
to 7000 ppm in ceramic pellets equilibrated at 1630 K. This remarkable behaviour is shown to be
consistent with surface coverage calculated from heats of segregation derived from ionic model
simulations of the surface if due account is taken of the strong variation of the segregation energy
with coverage. The coverage of Ba on a MgO(OO1) single crystal surface doped by indiffusion of
Ba deposited onto the crystal from a getter source can be made similar to that of the polycrystal-
line material. The Ba-segregated MgO(001) surface exhibits a complex LEED pattern.
1. Introduction
A growing interest in the surface segregation of dopants in metal oxides has been stimulated in recent years by the realisation that the properties of ceramic materials are governed to a large extent by the prescence of impurities and by the structure and stability of surfaces and grain boundary interfaces. Isovalent cation dopants in the alkaline earth rocksalt monoxides represent prototype systems for theoretical and experimental study. The high ionicity of MgO and the other group IIA oxides gives theoretical simulation procedures based on the ionic model the opportunity to play an important role in this area.
Calculated bulk substitution energies of isovalent dopants in MgO depend to a large extent on the size of the dopant ion [l-3]. Thus the small Be*+ ion
* On leave from: Department of Chemistry, Tsinghua University, Beijing, Peoples’ Rep. of
China. * * To whom correspondence should be addressed.
0039-6028/89/$03.50 0 Elsevier Science Publishers B.V. (North-Holland Physics Publishing Division)
has a negative substitution energy of -385 kJ/mol, whereas the substitution energy for the much larger Ba *+ ion is + 1123 kJ/mol, over half the energy required to form an anion vacancy in MgO [3]. The strain introduced into the lattice by the large cation can be relieved to some extent if the dopant is removed to a surface site. Thus there is a substantial heat of segregation from bulk to surface sites. In the series Ca”, Sr*+, Ba7+ the heat of segregation in MgO is roughly proportional to the mismatch in ionic size between Mg2+ and the dopant ion [3].
There has been disappointingly little experimental work in this area but the pioneering experiments of McCune and Wynblatt on Ca2+ segregation in MgO [4] stand as a benchmark for future efforts. These authors used low energy ion scattering spectroscopy and Auger spectroscopy to measure the equilibrium surface coverage of Ca*+ on a doped MgO(001) crystal at various temperatures between 900 ’ C and 1450 o C. A heat of segregation of about 50 kJ/mol was obtained from analysis of the data in terms of a simple Clausius-Clapeyron equation, in excellent agreement with the calculated value. These experiments were by no means trivial to perform, requiring equilibration of the crystal surface in the spectrometer for periods of up to 9 days at the lower end of the temperature range studied. In a rather less ambitious project, Cimino and deAngelis showed that in MgO/NiO solid solutions the surface Mg/Ni ratio differed little from its bulk value [5]. This accords with the similar ionic sizes of Mg2+ and Ni2+.
To date the behaviour of Ba2+ in MgO has not been studied experimentally. In simulation studies several aspects of this system are of interest [3]. The heat of segregation of Ba2+ to MgO(001) decreases from - 376.25 kJ/mol at zero coverage to the positive value to +28.94 kJ/mol at full coverage of an unreconstructed MgO(001) surface. However if the BaO monolayer is allowed to reconstruct to produce a rumpled fi x 6 surface layer, a negative heat of segregation of - 136.03 kJ/mol is recovered. Accompanying the large heat of segregation it was found that there is a large decrease in the surface energy of 2.40 J/m2 for Ba*+/MgO(OOl) and 4.85 J/m’ for Ba”+/MgO(OOl). The energies for these two surfaces for the pure crystal are respectively 1.06 and 2.79 J/m*. Thus there is the surprising prediction that the Ba segregated surfaces have a negative surface energy, with a thermodynamic barrier to sintering. It is also predicted that Ba segregated MgO(110) is stable with respect to the MgO(001) surface.
We have addressed the problem of the surface structure of BaO on MgO in a recent paper [6] and have found that instead of forming rumpled monolayers at the MgO lattice spacing, BaO layers grow on MgO with the lattice spacing characteristic of bulk BaO [3,7]. In the present paper we study the surface composition of Ba-doped MgO ceramics over a wide range of bulk doping levels. For comparison a study of a Ba-doped MgO(001) single crystal surface is also included. To support the experimental work surface coverages of Ba
M. Cotter et al. / Surface segregation of Ba in MgO 269
have been estimated from heats of segregation derived from ionic model
simulations of the surface. Careful consideration is given to the most ap- propriate form for the interionic potentials at heavily Ba segregated surfaces. Due account is also taken of the strong variation of heat of segregation with coverage using recently derived thermodynamic relations [8]. The theoretical studies provide a pleasing rationale of the experimental data.
2. Experimental
Most spectroscopic experiments were conducted in a VG ESCALAB Mark II electron spectrometer with facilities for excitation of spectra with Al KLY or Mg Ka X-rays. The preparation chamber of the spectrometer was equipped with 3 grid LEED optics, a Penning ion gun and and a water cooled copper work coil coupled to a Radyne 1.5 kW RF generator for radiofrequency heating of samples. ESCALAB XPS spectra were all taken at normal emission. The angular variation of XPS intensities was studied in a PHI 5100 X-ray photoelectron spectrometer. Both spectrometers incorporate 150 mm spherical sector analysers with lens input systems.
Polycrystalline Ba doped MgO powders were prepared from Ba(NO,), and Mg(NO,), .0.25H,O (Johnson Matthey Specpure Grade). Solutions of the nitrates were mixed to give the required doping level. The solutions were then
cautiously evaporated to dryness and the resulting powders heated to 1273 K in a temperature programmable furnace at a controlled heating rate of 1 K/mm to ensure smooth decomposition of the nitrates. The samples were then pressed into 13 mm diameter pellets between tungsten carbide dies at a pressure of 10 tons/cm2. The pellets were fired at 1633 K in recrystallised alumina boats for at least 48 h in a clean muffle furnace and then were allowed to cool rapidly back to room temperature by removal from the furnace. Pellets were mounted in tantalum trays spot-welded to molybdenum stubs and were cleaned in the preparation chamber of the spectrometer by heating the tray to 1073 K for several minutes with the RF heater. At this modest temperature cation mobility is very low [4] and the surface cation distribution is not expected to be altered over short time intervals. However the in situ annealing serves to remove surface carbonate and hydroxide contamination.
A MgO crystal slice doped with Ba in the surface region was prepared as follows. A slice of MgO with (100) orientation was cleaved from a block of single crystal material and mounted on a Ta tray on an MO stub. The sample was inserted into the spectrometer and cleaned by heating the Ta tray to around 1473 K with the aid of the RF heater. Several monolayers of Ba metal were deposited onto the crystal surface from a shrouded getter source in the spectrometer preparation chamber followed by exposure to 300 L oxygen at
270 hf. Cotter et al. / Surface segregation of Ba in MgO
lop6 Torr to oxidise the deposit. At the highest temperature available to us in situ in the spectrometer (about 1473 K) there was no indication of diffusion of BaO into the MgO over times up to an hour. The BaO coated crystals were therefore removed to a muffle furnace where they were heated to 1633 K to allow diffusion of Ba 2+ into the MgO. After reinsertion into the spectrometer the crystals were cleaned by heating the Ta mounting tray to around 1073 K in the usual way. It was established empirically that ex situ high temperature
annealing at 1633 K for about 4 h gave surface Ba coverages on the single crystal MgO similar to that for the polycrystalline samples.
3. Experimental results and discussion
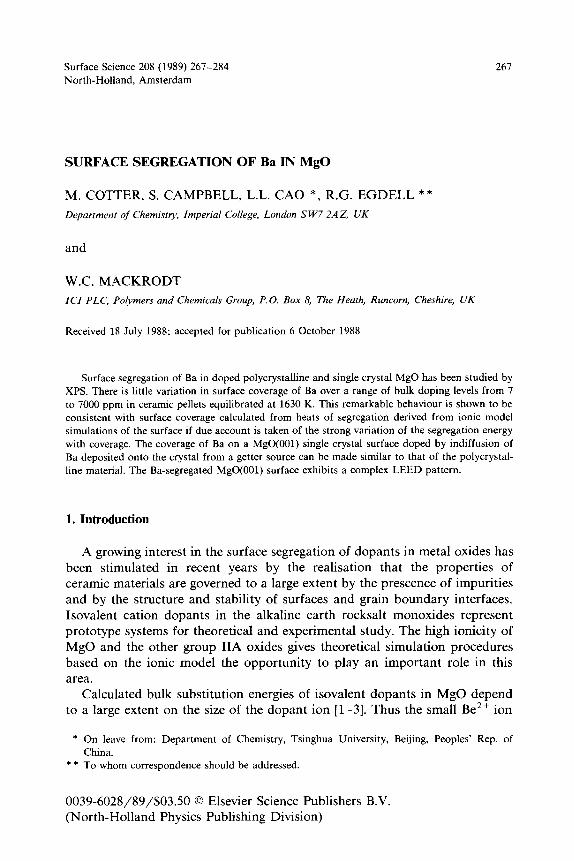
The strongest core level peaks for Ba relate to ionisation of the 3d levels and a prominent Ba 3d feature was observed in all XPS spectra of Ba-doped MgO (fig. 1). Detailed scans of this region of the spectra showed the shape of
lg 2P
\ Mg 2s
\ I’
‘.tg KLL
7
(b)
I / I
200 400 600 800 1
BindIng EnergyleV
Fig. 1. Widescan XPS excited with Al Ka radiation for Ba doped MgO ceramic pellets at two different bulk doping levels (a) 7 ppm (b) 7000 ppm.
M. Cotter et al. / Surface segregation of Ba in MgO 271
780 ml 810
BIndIng Energy /eV
820 830
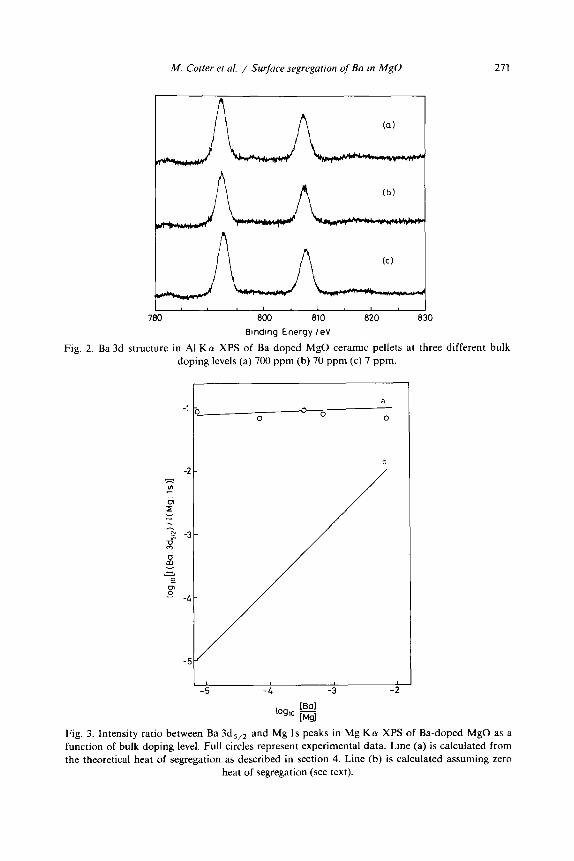
Fig. 2. Ba 3d structure in Al Kol XPS of Ba doped MgO ceramic pellets at three different bulk doping levels (a) 700 ppm (b) 70 ppm (c) 7 ppm.
Fig. 3. Intensity ratio between Ba 3d,,, and Mg 1s peaks in Mg Ka XPS of Ba-doped MgO as a
function of bulk doping level. Full circles represent experimental data. Line (a) is calculated from
the theoretical heat of segregation as described in section 4. Line (b) is calculated assuming zero heat of segregation (see text).
212 M. Cotter et al. / Surface segregation of Ba in MgO
the Ba 3d structure to be essentially invariant with bulk doping level in the range 7 to 7000 ppm (fig. 2). The Ba surface concentration was quantified in
terms of the area ratio between Ba 3d,,, and Mg Is core level peaks in Al Ka
XPS, following subtraction of X-ray satellite structure and linear backgrounds. It is evident from fig. 3 that this ratio shows little variation despite three orders magnitude change in bulk doping level.
Also shown in fig. 3 is the Ba 3d,,,/Mg Is intensity ratio expected from the bulk doping level. This line is based on a separate series of experiments in which a thick (> 100 A) BaO overlayer was grown on MgO(001) by cycles of evaporation of Ba metal from a getter source, followed by oxygen exposure and annealing. The BaO prepared in this way provides a more reproducible
reference for quantification than a BaO pellet prepared along the lines of the MgO pellets because hydroxide and carbonate contamination of the BaO is exceptionally difficult to remove by in situ thermal treatment. The Mg Is intensity from the clean crystal and the Ba 3d,,, intensity from the overlayer can then each be referenced to the intensity of the 0 1s peak.
The ratio R, between these two quantities is then related to ionisation cross sections u, electron pathlengths A, lattice parameters u and analyser transmis- sion functions T through the expression:
R,= Z(Ba 3d,,,)/Z(O Is, BaO)
I(Mg ls),‘l(O Is, MgO)
a(Ba 3d,,,) 1 - exp[ -a(Mg0)/2h(Mg Is, MgO)]
a(Mg Is) 1 - exp[ -a(Ba0)/2X(Ba 3d,,,, BaO)]
1 - exp[ -a(Ba0)/2h(O Is, BaO)]
’ 1 - exp[ -a(Mg0)/2X(O Is, MgO)]
T(Ba 3d,,,)
T(Mg 1s) . (1)
The experimental value for R, is 1.56 & 0.05. Consider now a crystal with a fraction x of the Mg sites replaced by Ba. The intensity ratio between Ba and Mg peaks in the absence of segregation is given by R, where:
x u(Ba 3ds,,) T(Ba 3dsj2) Rx= l- x +k 1s) T(Mg 1s)
x
1 - -a(MgO)/2X(Mg Is, MgO)]
exp[ 1 - exp[ -a(Mg0)/2X(Ba 3d,,,, MgO)] .
Hence:
x Rx=-
l-x
R, 1 - exp[ -u(MgO)JLX(O Is, MgO)]
’ 1 - exp[ -u(BaO), 2h(O Is, BaO)]
X 1 - exp[ -u(Ba0)/2X(Ba 3d,,2, BaO)]
1 - exp[ -u(Mg0)/2h(Ba 3d,,,, MgO)] .
(2)
(3)
M. Cotter ef al. / Surface segregation of Ba in MgO 273
Eq. (3) thus provides a basis for estimating the Ba 3d,,,/Mg 1s intensity ratio in the absence of segregation effects using only the experiments ratio R,
and electron pathlengths. The latter were derived from the model of Leckey and coworkers [9,10] and are as follows:
X(Mg 1s MgO) = 5.1 A,
X(Ba 3d,,,, BaO) = 13.6 A,
X(Ba 3d,,,, MgO) = 14.7 A,
X(0 Is, MgO) = 18.5 A,
h(0 Is, BaO) = 17.1 A.
Our model is strictly applicable only to (001) single crystal surfaces and ignores the possibility of photoelectron diffraction effects in the calibration factor R,. But the difference between observed and estimated intensities is so large that we must recognise that there is striking segregation of barium over the full range of bulk doping levels.
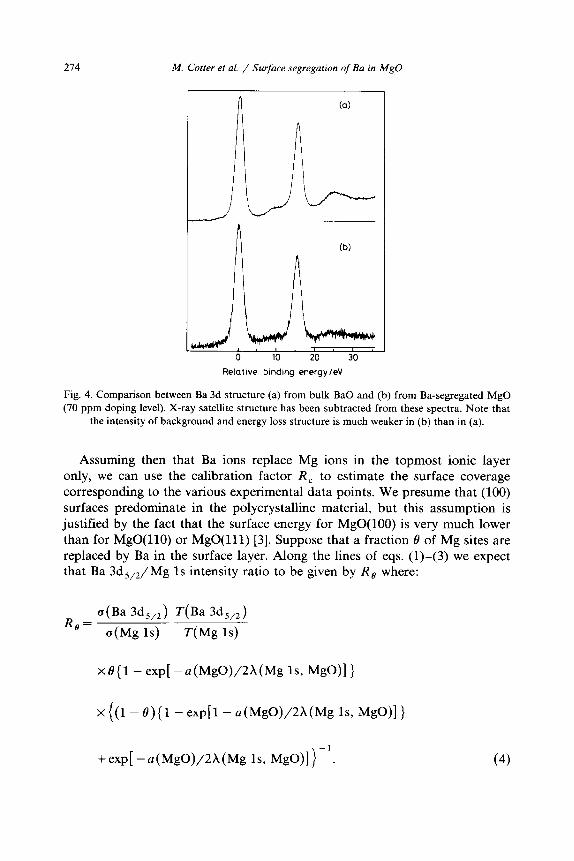
To quantify the surface Ba coverage it is necessary to adopt some model for the Ba depth distribution at the surface of MgO. In ionic model simulations, the site potential and substitution energy for impurities is in general found to be significantly different from the bulk value only in the topmost ionic layer [l-3]. Thus one expects segregation to be restricted to the top ionic layer with an abrupt return to the bulk composition in the next ionic layer below the surface. Three experimental observations are consistent with this idea. First it was found that mild argon ion bombardment of the ceramic surface (2 keV ions at 5 l.~A/crn’ for 5 min) led to drastic reduction in the intensity of the Ba signals. However owing to atomic scale mixing under ion bombardment it is not possible to obtain depth profile information from the ion bombardment experiments in specific atomic layer by atomic layer detail. Secondly it was found that the extra background intensity and satellite loss intensity associ- ated with the Ba core level peaks is very weak. To emphasise this point we show in fig. 4 the Ba 3d core peaks from a Ba-segregated ceramic alongside the core peaks from a “bulk” BaO sample. The satellite and loss intensity is roughly a factor of two weaker for the Ba-segregated sample. If we assume that half of the overall satellite intensity of the bulk sample comes from an extrinsic mechanism [ll], this suggests that segregant ions reside on the surface of the Ba-segregated sample and escape from the sample without suffering extrinsic inelastic loss, all of the satellite intensity being provided by an intrinsic mechanism [12]. Finally the Ba 3d,,,/Mg 1s intensity ratio showed the expected increase with increasing electron takeoff angle, as shown in fig. 5 for two of the samples. If segregation produced a homogeneously Ba enriched surface layer whose thickness was large compared with electron pathlengths we would expect to see no angular variation in the XPS intensity ratios.
274 M. Cotter et al. / Surface segregation of Ba in MgO
0 10 20 30
Relative binding energyleV
Fig. 4. Comparison between Ba 3d structure (a) from bulk BaO and (b) from Ba-segregated MgO
(70 ppm doping level). X-ray satellite structure has been subtracted from these spectra. Note that
the intensity of background and energy loss structure is much weaker in (b) than in (a).
Assuming then that Ba ions replace Mg ions in the topmost ionic layer only, we can use the calibration factor R, to estimate the surface coverage
corresponding to the various experimental data points. We presume that (100) surfaces predominate in the polycrystalline material, but this assumption is justified by the fact that the surface energy for MgO(100) is very much lower than for MgO(110) or MgO(ll1) [3]. Suppose that a fraction 8 of Mg sites are replaced by Ba in the surface layer. Along the lines of eqs. (l)-(3) we expect that Ba 3d,,,/ Mg 1s intensity ratio to be given by R, where:
R,= a(Ba 3d,,,) @a 3d5,,) a@% 1s) T(Mg 1s)
x0(1 - exp[ -a(MgO)/2X(Mg Is, MgO)]}
x((l-_){I-exp[l-o(MgO)/2A(MgkMgO)]}
+exp[ -a(Mg0)/2h(Mg Is, MgO)])-‘. (4)
M. Cotter et al. / Surface segregation of Ba in MgO 215
0,5-
g 04-
P
< o-3- m x
i 0.2-
0.1 -
I. 1. 1. I. I. I
0 0.2 04 0.6 08 1.0
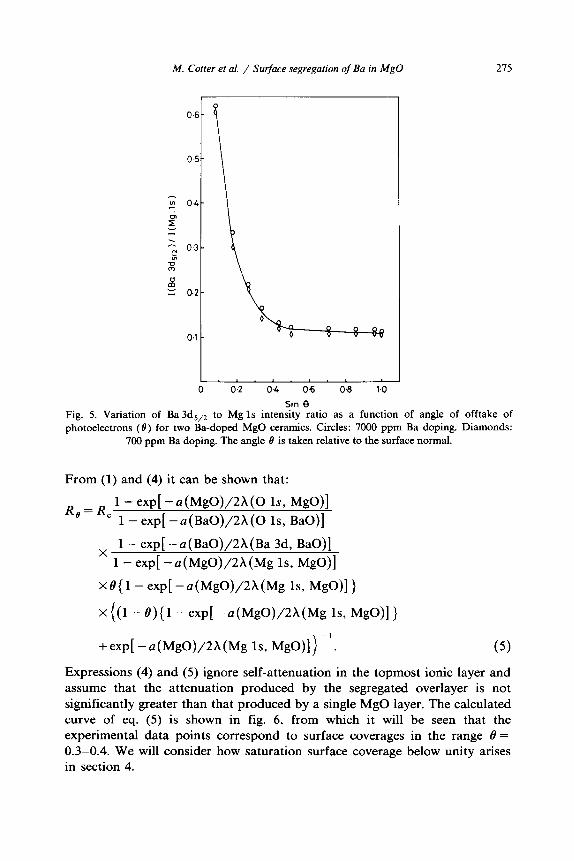
Sm e Fig. 5. Variation of Ba 3ds,, to Mg 1s intensity ratio as a function of angle of offtake of photoelectrons (0) for two Ba-doped MgO ceramics. Circles: 7000 ppm Ba doping. Diamonds:
700 ppm Ba doping. The angle 8 is taken relative to the surface normal.
From (1) and (4) it can be shown that:
R
6
= R 1 - exp[ -a(Mg0)/2h(O Is, I%@)] ’ 1 - exp[ -a(Ba0)/2X(O Is, BaO)]
1 - exp[ -a(Ba0)/2X(Ba 3d, BaO)]
’ 1 - exp[ -a(MgO)/2X(Mg Is, MgO)]
X8(1 - exp[ -a(Mg0)/2A(Mg Is, MgO)])
X ((1 - e){l - exp[ -u(MgO)/2X(Mg Is, MgO)] }
+exp[ -u(Mg0)/2X(Mg Is, MgO)])-‘. (9
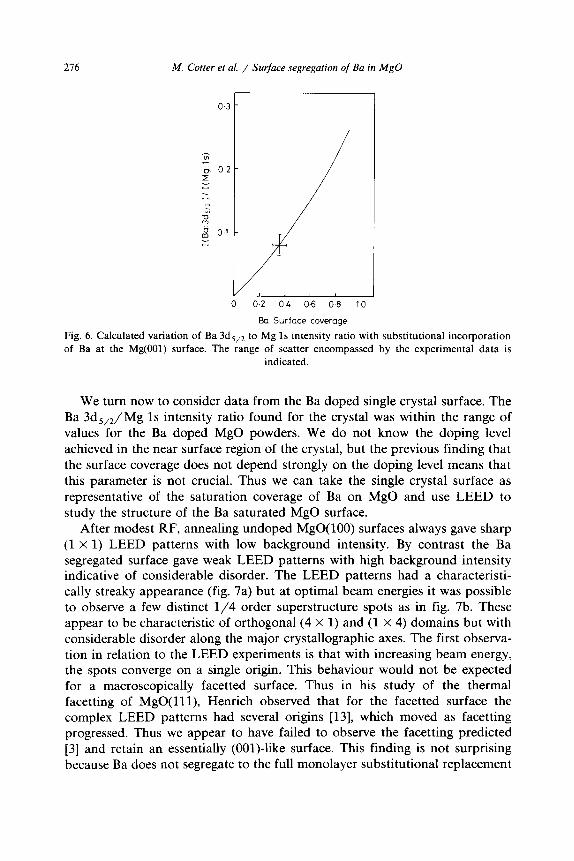
Expressions (4) and (5) ignore self-attenuation in the topmost ionic layer and assume that the attenuation produced by the segregated overlayer is not significantly greater than that produced by a single MgO layer. The calculated curve of eq. (5) is shown in fig. 6, from which it will be seen that the experimental data points correspond to surface coverages in the range 8 = 0.3-0.4. We will consider how saturation surface coverage below unity arises in section 4.
216 M. Cotter et al. / Surface segregation of Ba in MgO
0 0.2 04 0.6 08 1.0
@a Surface coverage
Fig. 6. Calculated variation of Ba 3d,,, to Mg Is intensity ratio with substitutional incorporation
of Ba at the Mg(OO1) surface. The range of scatter encompassed by the experimental data is
indicated.
We turn now to consider data from the Ba doped single crystal surface. The Ba 3d,,,/Mg 1s intensity ratio found for the crystal was within the range of values for the Ba doped MgO powders. We do not know the doping level achieved in the near surface region of the crystal, but the previous finding that the surface coverage does not depend strongly on the doping level means that this parameter is not crucial. Thus we can take the single crystal surface as representative of the saturation coverage of Ba on MgO and use LEED to study the structure of the Ba saturated MgO surface.
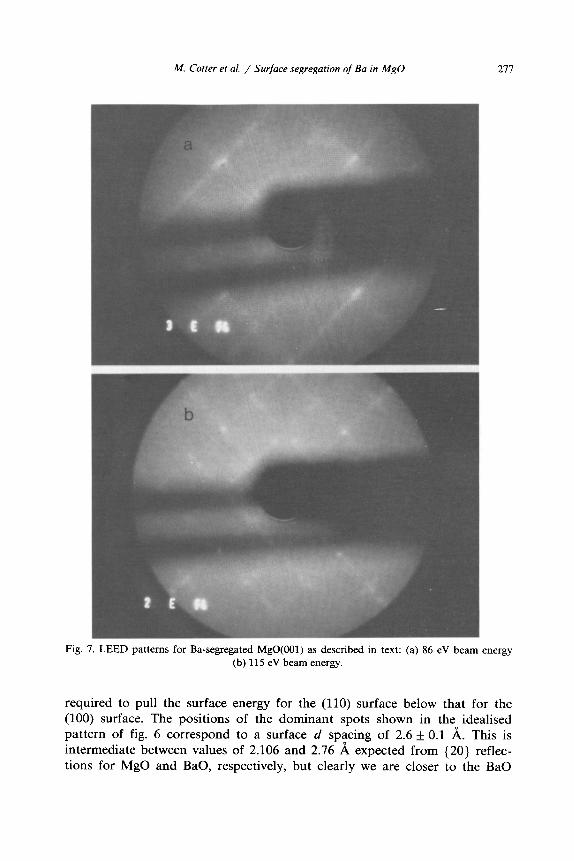
After modest RF, annealing undoped MgO(100) surfaces always gave sharp (1 x 1) LEED patterns with low background intensity. By contrast the Ba segregated surface gave weak LEED patterns with high background intensity indicative of considerable disorder. The LEED patterns had a characteristi- cally streaky appearance (fig. 7a) but at optimal beam energies it was possible to observe a few distinct l/4 order superstructure spots as in fig. 7b. These appear to be characteristic of orthogonal (4 X 1) and (1 X 4) domains but with considerable disorder along the major crystallographic axes. The first observa- tion in relation to the LEED experiments is that with increasing beam energy, the spots converge on a single origin. This behaviour would not be expected for a macroscopically facetted surface. Thus in his study of the thermal facetting of MgO(lll), Henrich observed that for the facetted surface the complex LEED patterns had several origins [13], which moved as facetting progressed. Thus we appear to have failed to observe the facetting predicted [3] and retain an essentially (OOl)-like surface. This finding is not surprising because Ba does not segregate to the full monolayer substitutional replacement
M. Cotter et al. / Surface segregation of Ba in MgO
Fig. 7. LEED patterns for Ba-segregated MgO(OO1) as described in text: (a) 86 eV beam energy (b) 115 eV beam energy.
required to pull the surface energy for the (110) surface below that for the (100) surface. The positions of the dominant spots shown in the idealised pattern of fig. 6 correspond to a surface d spacing of 2.6 + 0.1 A. This is intermediate between values of 2.106 and 2.76 A expected from {20} reflec- tions for MgO and BaO, respectively, but clearly we are closer to the BaO
278 M. Cotter et al. / Surface segregation of Ba in MgO
limit. Note that the (20) overlayer spots are rotated by 45 o relative to those of the substrate. Assuming a linear VCgard relationship in the surface layer it appears that LEED is probing an essentially BaO-like overlayer of composi- tion Ba, _,Mg,O with x = 0.2. Given that the 2D concentration of cation sites in BaO is approximately l/2 that in MgO, the LEED data thus appear consistent with a surface coverage 8 = 0.3-0.4 implied by XPS. The quality of the LEED data is too poor for us to speculate on the origin of the superstruc- ture spots.
4. Theoretical studies of segregation of Ba in MgO
4.1. Potentials
Our theoretical study of segregation of Ba in MgO is based on atomistic simulations of Ba dopant in the bulk and at the surface of MgO [14,15]. The interionic potentials include both a long range Coulombic component and a short range repulsive term. The latter is derived from ab initio Hartree-Fock calculations based on free ion wavefunctions. Of course O*- is stable only in an ionic lattice so to obtain the O*- wavefunction it is necessary to include a spherical Madelung potential around the O*- ions. Due to the differing Madelung potentials for MgO and BaO, the oxygen wavefunctions and hence the interionic potentials are thus different for the two oxides. For this reason we distinguish between MgO potentials and BaO potentials. There is no rigorous method of deciding as to which potential is “best” for a given situation but we can be guided by the following considerations. In MgO itself it is clear MgO potentials are appropriate and these potentials must also be used to treat small bulk doping of Ba in MgO. For small surface coverages of Ba on MgO the MgO potentials are again appropriate, but if we build up a complete BaO monolayer of MgO a switchover to BaO potentials is probably justified for inter-ionic interactions within this layer.
4.2. The heat of segregation
The atomistic definition of the heat of segregation is as the difference in energy between an isolated Ba ion in the bulk of MgO and at the surface of a given coverage. The substitution energy for Ba in the bulk of MgO is 11.64 eV, but at the surface at zero coverage the substitution energy is only 7.74 eV. Thus the heat of segregation at zero coverage is - 3.90 eV. The surface substitution energy increases to 8.63 eV at l/4 coverage due to steric crowding effects and thus the heat of segregation decreases to - 3.01 eV. With increas- ing coverage major relaxations are necessary to accommodate the large Ba
M. Cotter et al. / Surface segregation of Ba in MgO 219
ions. At half coverage we first considered the Ba ions to be constrained to replace Mg ions substitutionally but allowed free relaxation in the surface layers normal to the surface. Two local energy minima corresponding to segregation energies of -2.18 and - 1.14 eV were found with the MgO potentials. With BaO potentials the corresponding energies are -0.42 and +0.65 eV. Here we are in a regime where it is unclear as to which potentials are most appropriate and we cannot be guided by a variational principle which would favour the lowest energy structure.
At l/2 coverage the possibility of more radical structural reorganisation must be considered. Firstly we note that the lattice parameter of bulk BaO is 5.52 A, whereas fia(Mg0) = 5.96 A, so there is only a 10% mismatch. Thus we are led to consider a BaO layer on top of the MgO with a 2D lattice parameter conforming to the relationship a(Ba0) = fia(Mg0). The overlayer is rotated by 45” relative to the substrate. If in this structure the Ba and 0 ions occupy on-top positions, there are equal numbers of nearest neighbour repulsive interaction between ions of the same charge and favourable attrac- tive interactions. Nonetheless with BaO potentials the average energy per Ba ion in this structure is -29.82 eV. The lattice energy of MgO is - 40.73 eV and the bulk defect energy of Ba in MgO is 11.64 eV (both based on MgO potentials) so that the energy per Ba ion in MgO is (- 40.73 + 11.64) eV = - 29.09 eV. Thus the heat of segregation to give a commensurate monolayer is ( - 29.82 + 29.09) eV = - 0.73 eV. This is lower than for direct substitutional replacement at l/2 coverage and thus the overlayer structure is actually favoured despite lengthening of the Ba-0 bonds above the natural value and the unfavourable repulsions between ions of the same charge. With progressive buildup of commensurate “fi” BaO monolayers the heat of segregation becomes even more favourable.
We are unable to treat fully in our calculation overlayers of BaO on the MgO surface adopting the lattice spacing characteristic of bulk BaO because the non-commensurate relationship between fia(Mg0) and a(Ba0) would necessitate use of a prohibitively large 2D surface unit cell. However, we can calculate the energy per Ba ion in a free BaO monolayer. This turns out to be - 30.76 eV, lower than the value for the commensurate layer bound to MgO. The value must be further lowered if we were able to take account of interaction with the MgO surface, but probably not by much. One monolayer of BaO at its own characteristic lattice spacing corresponds to a surface coverage of 0.58 in terms of substitutional replacement of Mg, so we finally come to the conclusion that as we move through l/2 coverage the lowest energy structure is one in which an overlayer of BaO at its own natural lattice spacing sits on top of the MgO. The coverage regime where we switch over from substitutional replacement of Mg to formation of the BaO overlayer is exceedingly difficult to treat theoretically, but the LEED observation of a surface layer with lattice parameter just below that of BaO apparently arising
280 M. Cotter et al. / Surface segregatron of Bcr in MgO
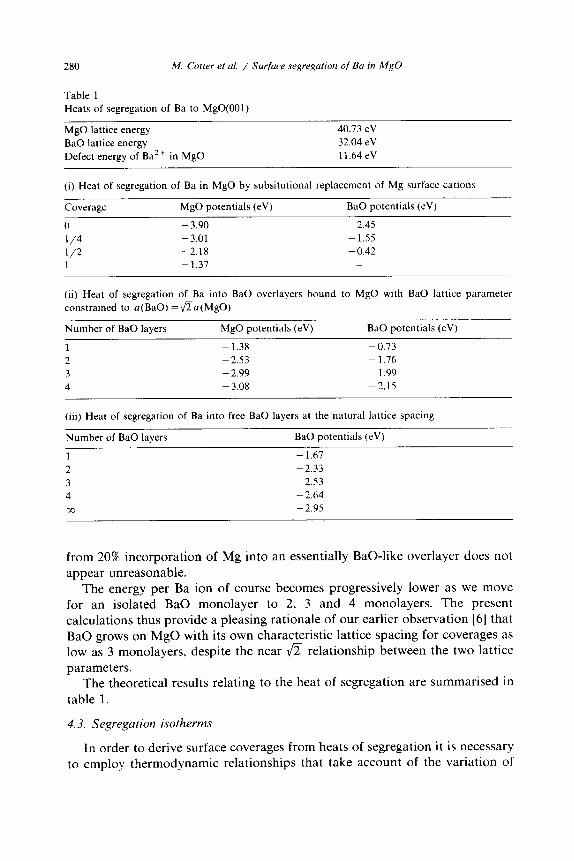
Table 1
Heats of segregation of Ba to MgO(001)
MgO lattice energy
BaO lattice energy
Defect energy of Ba* + in MgO
40.73 eV
32.04 eV
11.64 eV
(i) Heat of segregation of Ba in MgO by subsitutionai replacement of Mg surface cations
Coverage MgO potentials (eV) BaO potentials (eV)
0 - 3.90 - 2.45 T/4 - 3.01 -1.55 l/2 -2.18 - 0.42 1 - 1.37
(ii) Heat of segregation of Ba into BaO overlayers bound to MgO with BaO lattice parameter
constrained to a(Ba0) = fi-a(MgO)
Number of BaO layers MgO potentials (eV) BaO potentials (eV)
1 -1.38 - 0.73 2 - 2.53 - 1.76 3 - 2.99 -1.99 4 - 3.08 -2.15
(iii) Heat of segregation of Ba into free BaO layers at the natural lattice spacing
Number of BaO layers BaO potentials (eV)
1 - 1.67 2 - 2.33 3 - 2.53 4 - 2.64 cc - 2.95
from 20% incorporation of Mg into an essentially BaO-like overlayer does not appear unreasonable.
The energy per Ba ion of course becomes progressively lower as we move for an isolated BaO monolayer to 2, 3 and 4 monolayers. The present calculations thus provide a pleasing rationale of our earlier observation [6] that BaO grows on MgO with its own characteristic lattice spacing for coverages as low as 3 monolayers, despite the near fi relationship between the two lattice parameters.
The theoretical results relating to the heat of segregation are summarised in
table 1.
4.3. Segregation isotherms
In order to derive surface coverages from heats of segregation it is necessary to employ thermodynamic relationships that take account of the variation of
M. Cotter et al. / Surface segregation of Ba in MgO 281
heat of segregation with coverage. Here we provide a brief account only of
these relationships. Further details are given elsewhere [8]. Consider a two component system with bulk (b) and surface (s) sites
available to Mg and Ba cations. We use gb and gS to denote free energies of cations in bulk and surface sites and nb and rz5 for the number of ions in bulk and surface sites. Using subscripts Mg and Ba to distinguish between the cations the total free energy of the system is given by G where:
where k In fi represents the configurational entropy of the system. We define a free energy of segregation Ag excluding configurational entropy terms:
Ag= (&-As,,) - (gh&). (7) The symbol r is used for the ratio between Ba and Mg cations at bulk and surface sites:
rb = ni,/nh,, (8)
rb = n”,,/n&,. (9)
We recognise that the free energy of segregation depends on r” by using Ag(r”) in place of Ag from now on. At equilibrium dg/dnL, = 0, from which
it follows after a little manipulation that:
r”=r’exp{[-Ag(r”)+r”(l +r5) d Ag(r”)/dr”]/kT}. (10)
We assume that the vibrational entropy of segregation is small compared with the enthalpy of segregation Ah. There are few studies to justify this assump- tion, although for heavily Ca segregated MgO, Masri et al. [16] found that at 1000 K, TAs was only of the order of a few percent of Ah. Thus we have:
rs=rbexp’{[-Ah(r”)+r”(l+r”)d Ah(rs)/drs]/kT}. (11)
Eq. (11) must be solved numerically to obtain r” from rb and the known variation of Ah(rs) with rs. We have done this for both the MgO and BaO potentials discussed in section 4.1. The results are summarised in fig. 8 as plots of ln rs against 104/T.
Three features of these plots deserve comment. Firstly, the equilibrium surface coverage depends significantly on the potentials used in the calcula- tions. It is thus necessary to consider carefully the most appropriate form for the potentials before comparison can be made with experimental data. As discussed in section 4.1, we feel that true variation of Ah with coverage is probably best represented by a switchover from MgO potentials at low coverage to BaO potentials at l/2 coverage. The structure assumed at l/2 coverage is the “natural” BaO monolayer discussed in section 4.2. As expected the surface coverages for these intermediate potentials are intermediate be-
282 M. Carter et al. / Surface segregation of Ba in MgO
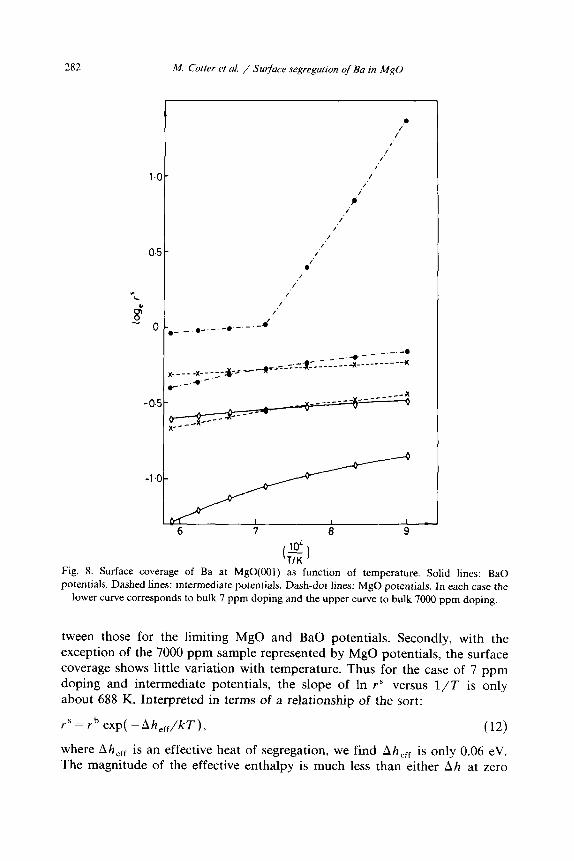
-l,olI&dLcL 6 7 8 9
Fig. 8. Surface coverage of Ba at MgO(OO1) as function of temperature. Solid lines: BaO
potentials. Dashed lines: intermediate potentials. Dash-dot lines: MgO potentials. In each case the
lower curve corresponds to bulk 7 ppm doping and the upper curve to bulk 7000 ppm doping.
tween those for the limiting MgO and BaO potentials. Secondly, with the exception of the 7000 ppm sample represented by MgO potentials, the surface coverage shows little variation with temperature. Thus for the case of 7 ppm doping and intermediate potentials, the slope of In rs versus l/T is only about 688 K. Interpreted in terms of a relationship of the sort:
r’= rh exp( -Ah.,/kT), (12)
where Ah,,, is an effective heat of segregation, we find Ah.,, is only 0.06 eV. The magnitude of the effective enthalpy is much less than either Ah at zero
M. Cotter et al. / Surface segregation of Ba in MgO 283
coverage or Ah at the equilibrium surface coverage. This is because the slope
of plots of In Y’ against 104/T depend on Ah(?) + r’(l + r”)d Ah(rs)/dr5. Whereas the first term is negative, the second provides an opposing positive contribution that reduces the dependence of r’ on temperature. The positive term is greatest for the intermediate potentials and in that case we find the most muted variation of coverage with temperature. The third and final point is that the calculated surface coverage is remarkably insensitive to the huge change of bulk doping level between 7 and 7000 ppm. To emphasise this point we have added to fig. 3 a line showing the expected variation of Ba 3d,,,/Mg 1s intensity ratio with bulk doping level. This line is derived from heats of segregation calculated with intermediate potentials and the calibration curve of fig. 6. The slope of the plot is very small in relation to the large change in bulk doping level. It is gratifying that the observed intensity ratios agree very well with the observed values in an absolute sense and the theoretical curve passes through the admittedly scattered experimental data. The only disappointment to us is that the scatter of the data is too large to allow observation of the predicted small increase of surface coverage with bulk
doping level.
Acknowledgements
The equipment used was funded by the SERC who also provided a postdoctoral research assistantship to S.C. M.C. thanks the ICI New Science Group for the award of a CASE studentship. L.L.C. thanks the British Council for the award of a Visiting Fellowship.
References
[l] E.A. Colbourn and W.C. Mackrodt, J. Mater. Sci. 17 (1982) 3021.
[2] E.A. Colbourn, W.C. Mackrodt and P.W. Tasker, J. Mater. Sci. 18 (1983) 1917.
[3] P.W. Tasker, E.A. Colboum and W.C. Mackrodt, J. Am. Ceram. Sot. 68 (1985) 74.
[4] R.C. McCune and P. Wynblatt, J. Am. Ceram. Sot. 66 (1983) 111. [5] A. Cimino, B.A. deAngel& G. Minelli, T. Persini and P. Scarpini, J. Solid State Chem. 33
(1980) 403.
[6] M. Cotter, S. Campbell, R.G. EgdeII and W.C. Mackrodt, Surface Sci. 197 (1988) 208.
[7] E.A. Colboum, W.C. Mackrodt and P.W. Tasker, Physica B 131 (1985) 41.
[8] W.C. Mackrodt and P.W. Tasker, Surface Sci., submitted.
[9] J. Szajaman and R.C.G. Leckey, J. Electron Spectrosc. Related Phenomena 23 (1981) 83.
[lo] J. Szajaman, J. Liesegang, J.G. Jenkin and R.C.G. Leckey, J. Electron Spectrosc. Related
Phenomena 23 (1981) 97. [ll] G.K. Wertheim, in: Solid State Chemistry: Techniques, Eds. A.K. Cheetham and P. Day
(Clarendon, Oxford, 1987).
[12] S. Tougaard and A. Ignatiev, Surface Sci. 129 (1983) 355. [13] V.E. Henrich, Surface Sci. 57 (1976) 385.
284 M. Cotter et al. / Surface segregatron of Ba rn MgO
[14] C.R.A. Catlow and W.C. Mackrodt. Eds., Computer Simulation of Solids (Springer. Berlin,
1982).
[15] C.R.A. Catlow, in: Solid State Chemistry: Techniques, Eds. A.K. Cheetham and P. Day
(Clarendon. Oxford, 1987).
[16] P. Masri, P.W. Tasker, J.P. Hoare and J.H. Harding, Surface Sci. 173 (1986) 439.