Embed Size (px)
Citation preview
www.elsevier.com/locate/apsusc
Applied Surface Science 253 (2006) 2244–2250
Surface segregation in HAYNES 230 alloy
D. Pop *, K. Wolski
Ecole Nationale Superieure des Mines de Saint-Etienne, Centre SMS, 158, cours Fauriel, 42023 Saint-Etienne Cedex 02, France
Received 6 February 2006; received in revised form 12 April 2006; accepted 12 April 2006
Available online 23 May 2006
Abstract
The surface segregation in the Ni-based alloy HAYNES 230 was studied by Auger Electron Spectroscopy and X-ray Photoelectron
Spectroscopy between 400 and 1100 8C. The qualitative variations of the surface contents of S, P, W, Mo, N, Si, and Mn were determined
as a function of annealing temperature and time. It was found that at 925 8C the maximum coverage of sulphur at the alloy surface is in the range
0.06–0.15 monolayers. Chromium evaporation from the HAYNES 230 surface under UHV conditions is clearly evidenced for annealing at
1100 8C.
# 2006 Elsevier B.V. All rights reserved.
PACS: 68.35Dv; 81.05Bx; 82.80Pv
Keywords: HTR; High temperature reactor; Ni-based alloys; Inconel 617; HAYNES 230; AES; XPS; High-temperature corrosion; Surface segregation; Site
competition
1. Introduction
Nowadays it is well known that the physical processes at
surfaces have technological importance for multiple applica-
tions. In the case of materials used at high temperatures the
segregation processes become significant and consequently the
material surface can be enriched in certain elements or
impurities. This change in surface composition can negatively
affect a series of mechanical and chemical properties, in
particular the adhesion of oxide scales.
However, the comprehensive studies of surface segregation in
superalloys are relatively scarce. HAYNES 230 is a Ni-based
alloy with potential for use in the fabrication of heat exchangers
in the next generation of nuclear reactors—Very High
Temperature Reactors (VHTR), that are envisaged to work at
temperatures above 900 8C. Such a material must be resistant to
the corrosion processes that occur in the impure helium
environment of the nuclear reactor and which influence
especially its mechanical properties. The main process that
has to be taken into account in such an environment is the
formation of the protective oxide scale in order to control either
carburization (which would result in low temperature brittleness)
* Corresponding author. Tel.: +33 4 77 42 02 15; fax: +33 4 77 42 01 57.
E-mail address: [email protected] (D. Pop).
0169-4332/$ – see front matter # 2006 Elsevier B.V. All rights reserved.
doi:10.1016/j.apsusc.2006.04.026
or decarburization (which strongly affects creep properties). The
adhesion of the oxide film is controlled by its chemical
composition, the morphology of the oxide/metal interface, and
the type of segregation species [1].
The aim of this work was to determine the type of segregating
atoms in the absence of any oxidation-driven phenomena. Under
these conditions, obtained in ultra-high vacuum (UHV)
environment, the only driving force results from the free
enthalpy of segregation. The same driving force will act under
VHTR oxidizing environment, presumably leading to similar
segregation phenomena at the metal/oxide interface.
Knowledge of the segregation characteristics of HAYNES
230 becomes thus important for assessing the potential of this
material for nuclear applications. We have used Auger Electron
Spectroscopy (AES) and X-ray Photoelectron Spectroscopy
(XPS) under UHV of about 5 � 10�10 mbar to investigate the
changes in the surface composition of this alloy at temperatures
between 400 and 1100 8C. These studies in ultra-high vacuum
represent a preliminary step for the understanding of the
processes that can lead to material degradation in the aggressive
environment of the nuclear reactor.
2. Experimental
The nominal composition of the HAYNES 230 alloy studied
in this work is given in Table 1 and compared to the
D. Pop, K. Wolski / Applied Surface Science 253 (2006) 2244–2250 2245
Table 1
Composition of the studied HAYNES 230 alloy compared to the composition of Inconel 617 alloy
C Ni Fe Cr Mn Ti Cu Si Al Mo Co W S
Haynes 230 (wt%) 0.10 Bulk 1.41 21.76 0.50 0.10 0.01 0.39 0.30 1.30 0.18 14.21 0.001
IN617 (wt%) 0.06 54.19 1.13 22.3 0.06 0.35 0.1 0.11 1.26 8.7 11.7 / 0.001
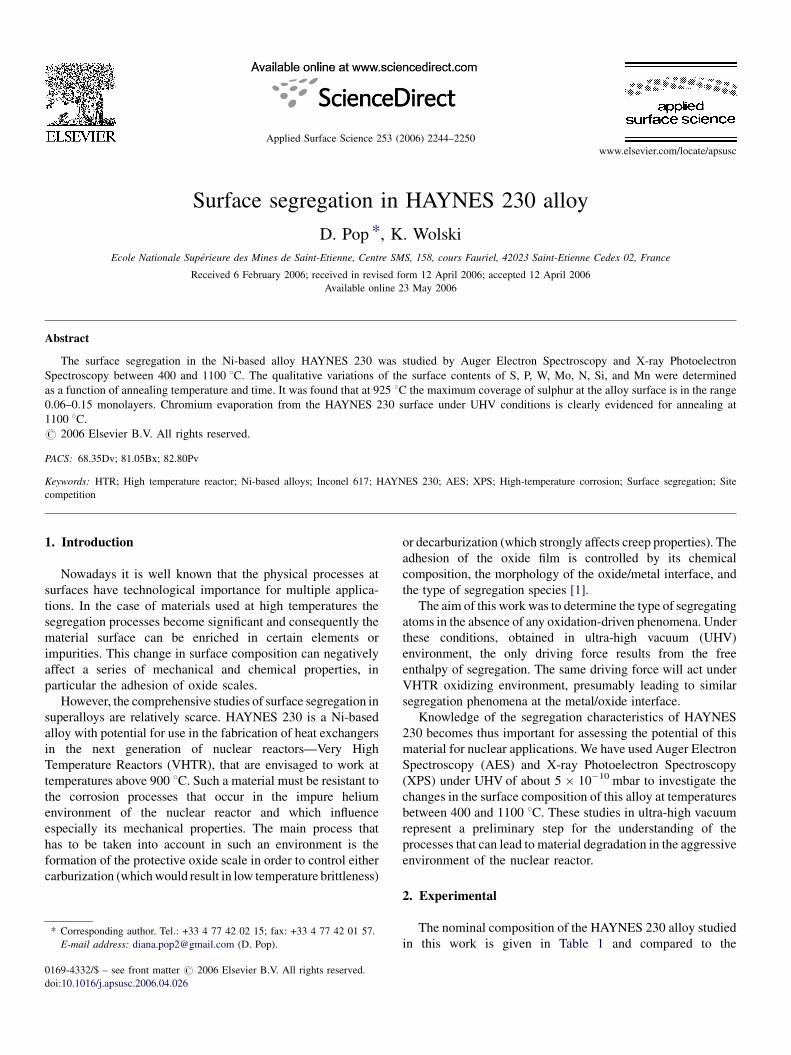
Fig. 1. Qualitative variation of the sulphur surface content as a function of
temperature after 30, 60, and 105 min annealing.
composition of Inconel 617 alloy, used in the past in a series of
High Temperature Reactors (HTR) operating in the 800 8Ctemperature range.
The chemical analysis of minor elements performed in our
laboratory by combustion and infrared absorption (system
LECA CS-444LS) confirmed the given percentages for C and S.
Analysis based on the sample fusion under flowing helium gas
stream and measurement by a thermal conductivity cell (system
LECA TC-436) indicated also the existence of 0.06% N in the
alloy.
The samples consisted of discs with a diameter of 10 mm
and a thickness of approximately 0.3 mm. The front faces of
these discs were mechanically polished down to 0.25 mm.
The experiments were performed in an ultrahigh vacuum
chamber (base pressure �5 � 10�10 mbar) equipped with a
cylindrical electron energy analyzer (Cameca, MAC III), an
X-ray source (Cameca CX 700), an electron gun (VG
LEG200), and an ion sputter gun (Cameca, model ACI). A
resistive heating system placed at the rear side of the sample
allowed to obtain temperatures up to 1100 8C. The
temperature measurements were realized with a thermo-
couple spot-welded on the front face of the sample. The
Auger spectra were obtained using a 5 keV electron beam
with a 10 mm spot diameter. These spectra were recorded in
the direct acquisition mode with a resolution of 1 eV and a
step of 0.25 eV. Complementary XPS analysis were per-
formed using the Mg Ka radiation (1253.6 eV) with a beam
diameter of ca. 1 cm, the data being measured in similar
conditions to the Auger ones. Auger electron spectroscopy
was the main technique used for the quantitative and
qualitative analysis due to the relatively small spot of the
incident electron beam, which allowed the study of the
regions homogeneous in terms of temperature.
Two samples were analyzed. First of them was studied
subsequent to annealing at 400, 500, 600, 700, 780, 875, 905,
925, 960, 990, 1035, and 1100 8C. The second sample was
annealed for more than 30 min only at 910 and 925 8C. Prior to
analysis at a certain temperature, the sample surface was
cleaned at room temperature by sputtering with Ar+ ions of 3–
4 keV energy and reference spectra were recorded. Afterwards
the samples were annealed at the desired temperature for a
given time, cooled down to approximately 100 8C, and the data
were collected. For a certain temperature, several cycles of
annealing and spectra recording were performed, which
allowed to study the surface segregation as a function of
annealing time. The time for reaching the annealing
temperature was maintained in the order of several minutes,
in order to limit the effects on surface stoichiometry. For the
same reason, after annealing the heating source was switched
off immediately.
3. Results and discussions
To investigate the surface segregation of the different alloy
elements and impurities, the intensities of the corresponding
Auger lines were analyzed. In order to emphasize the changes
in the surface concentration with increasing annealing
temperature and time, and at the same time to compensate
for possible differences in the intensity of the primary electron
beam (which would lead to a change in the intensity of all
Auger lines in a spectrum), the signals of interest were
calculated relative to the intensity of the Ni 844 eVAuger peak.
Nickel is considered to not segregate or evaporate when the
sample is thermally treated. However, it should be mentioned
that these ratios are influenced by the decrease of the Ni signal
at the surface, which is likely to occur when impurities or one of
the alloy components segregate significantly.
The modifications in surface composition found after an
annealing cycle include also the changes that occur during the
time needed to reach the desired temperature and the changes
that occur during sample cooling. Provided that these time
intervals are relatively short, the associated modifications in the
surface stoichiometry (which cannot be quantified in the
present experiments) are of a much smaller importance than
those occurring during annealing.
3.1. Sulphur segregation
Segregation of sulphur can result in the spallation of the
surface region of Ni-based alloys, even if the bulk concentration
of this element is only several ppm [2]. For the materials used in
the particular environment of a nuclear reactor this can lead to
an accelerated alteration of mechanical properties due to the
enhancement of carburization effects [1].
D. Pop, K. Wolski / Applied Surface Science 253 (2006) 2244–22502246
In HAYNES 230 sulphur segregation is observed already for
annealing the alloy at 230 8C, which was the sample
temperature when the chamber was heated for obtaining the
ultrahigh vacuum. Fig. 1 shows the variation of the sulphur
content at the surface as a function of annealing temperature,
after three annealing times. The dependence was obtained by
calculating the ratio between the intensity of the S 146 eV
Auger line and the intensity of the Ni 844 eV signal. The data
indicate that the sulphur amount at the alloy surface generally
raises with temperature, suffering a dramatic increase for
annealing above 700 8C.
3.2. Maximum thickness of the segregated sulphur layer at
925 8C
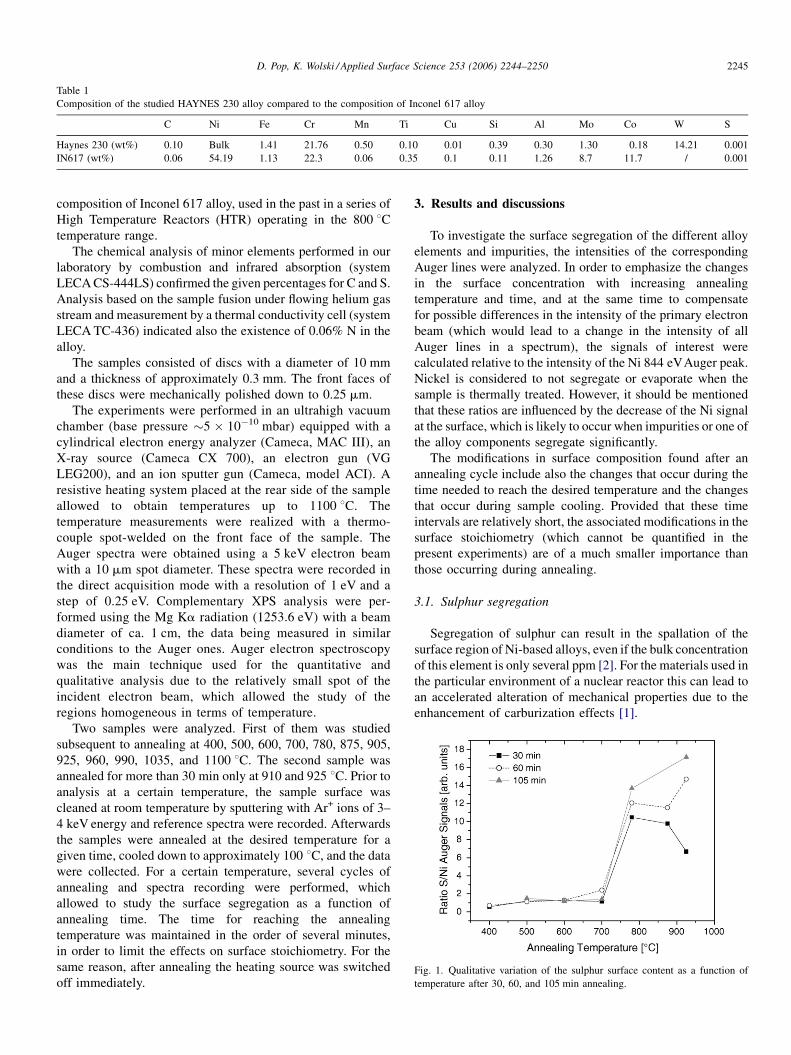
Fig. 2 presents the variation in the amount of sulphur at the
alloy surface as a function of annealing time at 925 8C. The
error bars for the ratios between S and Ni Auger signals at
925 8C are maximum 10%. One can note that up to 1000 min
the sulphur content varies strongly with time, while for longer
annealing this variation is very slow. For 2700 min a saturation
level is reached.
To estimate the amount of sulphur at the HAYNES 230
surface that corresponds to this saturation regime (parameter
that will be further denoted as ‘e’), a bicomponent standard
sample—FeS was also analyzed and the quantification was
made using the method presented in [3,4] and references
therein. Hence, the intensities of S and Fe Auger signals in the
spectra of HAYNES 230 alloy (after 2735 min annealing) and
in the spectra of the standard material FeS were measured.
Considering that subsequent to annealing at 925 8C, a
uniform layer of sulphur is covering the alloy surface, and that
by Auger Electron Spectroscopy we probe both this sulphur
layer and a part of the HAYNES 230 alloy underneath the
segregant layer, the intensities of the Auger signals for S and Fe
can be written as
IS ¼ KaSRalloyS N0
Sl0Sð1� k0
SÞ cos u
IFe ¼ KaFeRalloyFe Nalloy
Fe lalloyFe kFe cos u
: (1)
Fig. 2. Variation of the sulphur surface content with annealing time at 925 8C.
In the above formulae the subscripts are relative to the elements
and the superscripts relative to the matrix (‘0’ for pure material
and ‘alloy’ for HAYNES 230). The parameter K depends on the
instrumental factors and analysis conditions, while a is the
product of ionization cross-section, probability of Auger elec-
tron emission, and transmission efficiency of the analyzer. R
represents a backscattering term and was calculated using the
relation
R ¼ 1þ ð4:35� 3:93Z0:1Þ ��
EP
EL
��0:25
þ 4:85Z0:1 � 5:45;
(2)
where Z is the average atomic number of the matrix (33.6 for
the alloy), EP the primary electron energy (5 keV), and EL is the
binding energy of the core level involved in the Auger transition
(162.5 eV for S and 707 eV for Fe). The values obtained in this
way were RalloyS ¼ 1:92 and Ralloy
Fe ¼ 1:68. The parameter N
designates the number of atoms per unit volume. Using the
densities of S and HAYNES 230 alloy we have determined that
N0S ¼ 3:68� 1028 atoms=m3 and Nalloy
Fe ¼ 1� 1027 atoms=m3.
The parameter l represents the attenuation length, which can be
calculated according to the relation
l ¼ 538E�2C þ 0:41
ffiffiffiffiffiffiffiffiffiffiffiffiffiffid � EC
p: (3)
In this formula EC is the Auger electron kinetic energy (146 eV
for S and 700 eV for Fe) and d is the monolayer thickness of the
matrix. Considering that d for S is the cubic root of the atomic
volume (0.295 nm) and approximating that for the alloy d is an
average of the monolayer thickness of the constituents
(accounting for the percentage contribution of each element
in the alloy – 0.228 nm) the obtained values are l0S ¼
2:72 monolayers and lalloyFe ¼ 5:18 monolayers. The para-
meters denoted k0S and kFe are the attenuation factors for S
and Fe. They can be calculated according to the formula
k ¼ expð�e=ðl cos uÞÞ, where l is the attenuation length, u
the collection angle with respect to the surface normal (408 in
the case of the present system), and e is the thickness of the
segregated layer. Thus
k0S ¼ exp
�� e
2:08
�and kFe ¼ exp
�� e
4:51
�:
Using these values, the ratio between the intensities of S and Fe
Auger signals becomes:
IS
IFe
¼ aS
aFe
� 21:96� 1� expð�e=2:08Þexpð�e=4:51Þ : (4)
The value IS/IFe, determined using the intensities of the S and Fe
Auger lines in the spectra corresponding to saturation condi-
tions at 925 8C, is 227 � 35. The unknown aS/aFe ratio includes
the transmission efficiencies of the analyzer and therefore was
determined from reference measurements with the same ana-
lyzer. In order to obtain this value the Auger spectra of the
standard material FeS were measured.
D. Pop, K. Wolski / Applied Surface Science 253 (2006) 2244–2250 2247
The Auger intensities of Fe and S in the spectra of
homogeneous FeS can be expressed as:
I�S ¼ K 0aSR�SN�Sl�S cos u0
I�Fe ¼ K 0aFeR�FeN�Fel�Fe cos u0
where the factor K0 is identical for both elements because the
data are obtained during the same experiment. The values for
R�S and R�Fe, determined using formula (2), are 1.71 and 1.53,
respectively, whereas the ratio N�S=N�Fe for FeS is taken to be 1.
Considering that the monolayer thickness of FeS is equal to the
cubic root of the ratio between the unit cell volume and the
number of atoms per cell (4 atoms/cell), we obtained that l�Sand l�Fe are 2.48 and 5.38 monolayers, respectively. With all
these parameters and the values determined for I�S and I�Fe from
the Auger spectra, we calculate that ðaS=aFeÞ ¼ ðI�S=I�FeÞ�ððR�FeN�Fel
�FeÞ=ðR�SN�Sl�SÞÞ ¼ ð116� 35Þ � 1:93. The larger
relative uncertainty in the I�S=I�Fe value is caused by the fact
that the surface of this sample was not perfectly flat, so that data
measured on different spots had a larger dispersion. Using this
value in Eq. (4), it is obtained that at 925 8C the maximum
thickness e of the sulphur layer is in the range 0.06–0.15
monolayers.
Sulphur segregation has been extensively studied in the past.
In the particular case of a commercial purity nickel (99.3%) the
equilibrium surface concentration of sulphur, between 700 and
800 8C, was found to be 44% [5]. The fact that the value
determined in the present measurements on HAYNES 230 is
considerably smaller than the one reported in Ref. [5] can be
due to the following factors: (i) at 925 8C, P and Si still
segregate and thus occupy some of the available surface sites,
(ii) in the frame of McLean’s theory, it is possible that at 925 8Ca desegregation process is already taking place, and (iii) the
occurrence of a certain sulphur evaporation.
3.3. P segregation
A second alloy impurity that shows strong segregation,
clearly observed for annealing temperatures higher or equal to
700 8C, is phosphorus. This element is reported to generate
embrittlement in Ni–Cr steels [6].
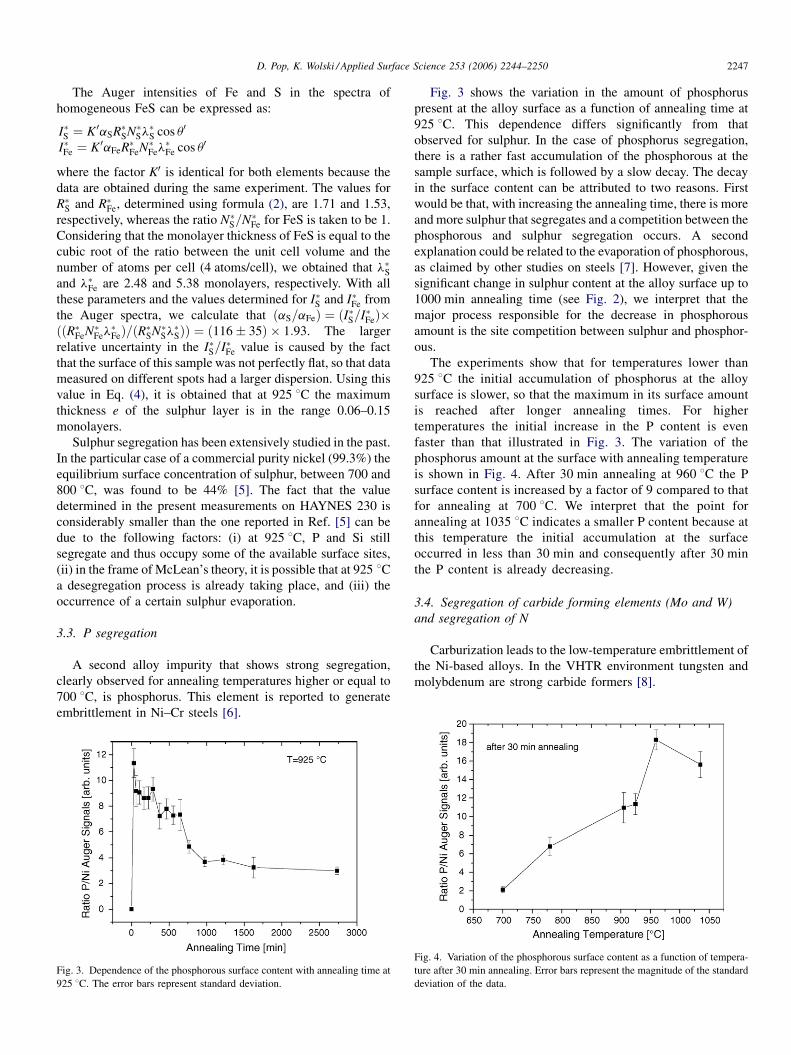
Fig. 3. Dependence of the phosphorous surface content with annealing time at
925 8C. The error bars represent standard deviation.
Fig. 3 shows the variation in the amount of phosphorus
present at the alloy surface as a function of annealing time at
925 8C. This dependence differs significantly from that
observed for sulphur. In the case of phosphorus segregation,
there is a rather fast accumulation of the phosphorous at the
sample surface, which is followed by a slow decay. The decay
in the surface content can be attributed to two reasons. First
would be that, with increasing the annealing time, there is more
and more sulphur that segregates and a competition between the
phosphorous and sulphur segregation occurs. A second
explanation could be related to the evaporation of phosphorous,
as claimed by other studies on steels [7]. However, given the
significant change in sulphur content at the alloy surface up to
1000 min annealing time (see Fig. 2), we interpret that the
major process responsible for the decrease in phosphorous
amount is the site competition between sulphur and phosphor-
ous.
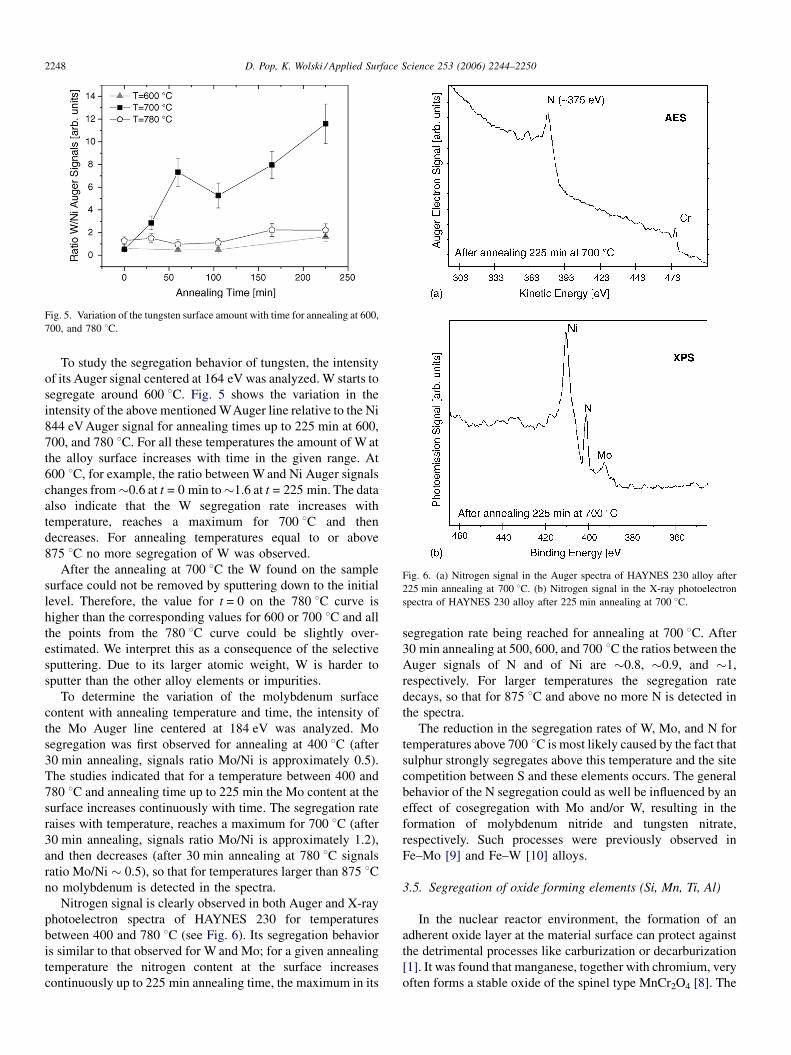
The experiments show that for temperatures lower than
925 8C the initial accumulation of phosphorus at the alloy
surface is slower, so that the maximum in its surface amount
is reached after longer annealing times. For higher
temperatures the initial increase in the P content is even
faster than that illustrated in Fig. 3. The variation of the
phosphorus amount at the surface with annealing temperature
is shown in Fig. 4. After 30 min annealing at 960 8C the P
surface content is increased by a factor of 9 compared to that
for annealing at 700 8C. We interpret that the point for
annealing at 1035 8C indicates a smaller P content because at
this temperature the initial accumulation at the surface
occurred in less than 30 min and consequently after 30 min
the P content is already decreasing.
3.4. Segregation of carbide forming elements (Mo and W)
and segregation of N
Carburization leads to the low-temperature embrittlement of
the Ni-based alloys. In the VHTR environment tungsten and
molybdenum are strong carbide formers [8].
Fig. 4. Variation of the phosphorous surface content as a function of tempera-
ture after 30 min annealing. Error bars represent the magnitude of the standard
deviation of the data.
D. Pop, K. Wolski / Applied Surface Science 253 (2006) 2244–22502248
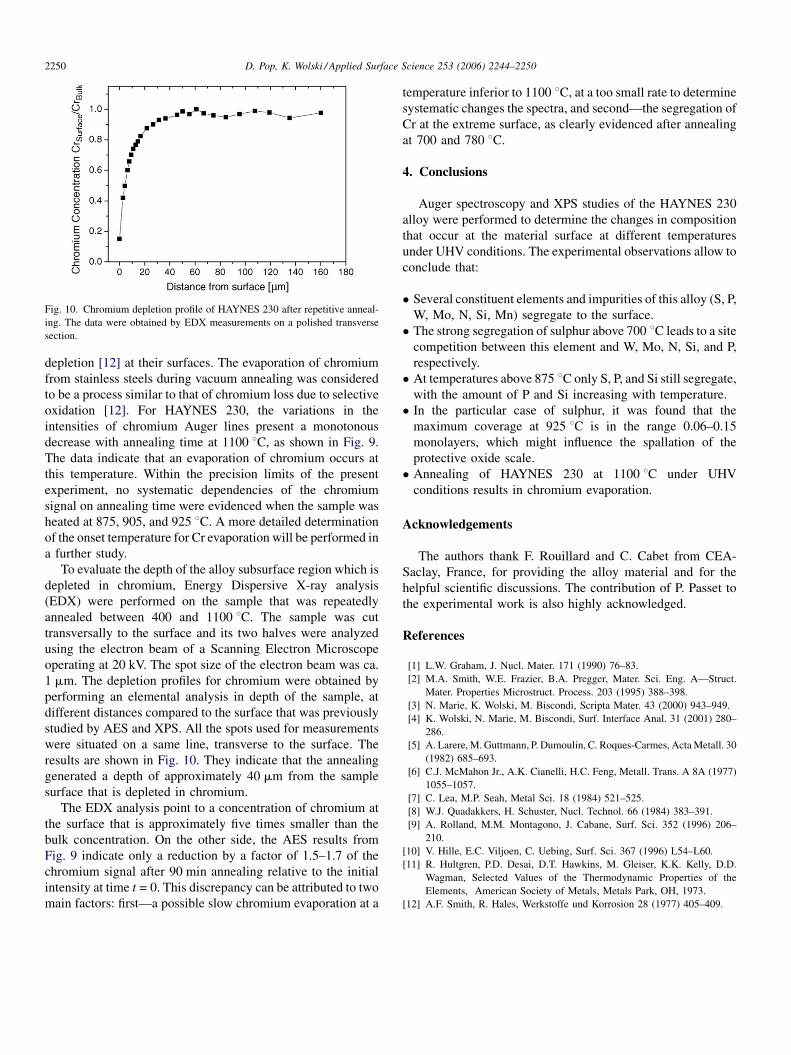
Fig. 6. (a) Nitrogen signal in the Auger spectra of HAYNES 230 alloy after
225 min annealing at 700 8C. (b) Nitrogen signal in the X-ray photoelectron
spectra of HAYNES 230 alloy after 225 min annealing at 700 8C.
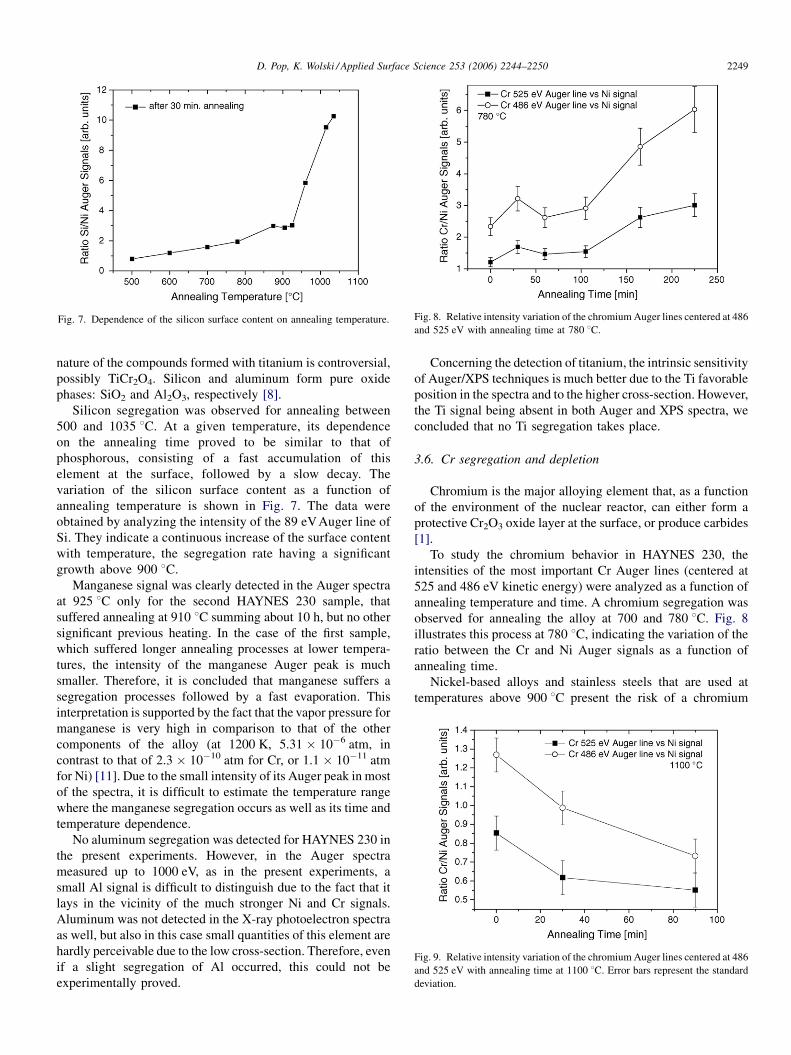
Fig. 5. Variation of the tungsten surface amount with time for annealing at 600,
700, and 780 8C.
To study the segregation behavior of tungsten, the intensity
of its Auger signal centered at 164 eV was analyzed. W starts to
segregate around 600 8C. Fig. 5 shows the variation in the
intensity of the above mentioned WAuger line relative to the Ni
844 eV Auger signal for annealing times up to 225 min at 600,
700, and 780 8C. For all these temperatures the amount of W at
the alloy surface increases with time in the given range. At
600 8C, for example, the ratio between W and Ni Auger signals
changes from�0.6 at t = 0 min to�1.6 at t = 225 min. The data
also indicate that the W segregation rate increases with
temperature, reaches a maximum for 700 8C and then
decreases. For annealing temperatures equal to or above
875 8C no more segregation of W was observed.
After the annealing at 700 8C the W found on the sample
surface could not be removed by sputtering down to the initial
level. Therefore, the value for t = 0 on the 780 8C curve is
higher than the corresponding values for 600 or 700 8C and all
the points from the 780 8C curve could be slightly over-
estimated. We interpret this as a consequence of the selective
sputtering. Due to its larger atomic weight, W is harder to
sputter than the other alloy elements or impurities.
To determine the variation of the molybdenum surface
content with annealing temperature and time, the intensity of
the Mo Auger line centered at 184 eV was analyzed. Mo
segregation was first observed for annealing at 400 8C (after
30 min annealing, signals ratio Mo/Ni is approximately 0.5).
The studies indicated that for a temperature between 400 and
780 8C and annealing time up to 225 min the Mo content at the
surface increases continuously with time. The segregation rate
raises with temperature, reaches a maximum for 700 8C (after
30 min annealing, signals ratio Mo/Ni is approximately 1.2),
and then decreases (after 30 min annealing at 780 8C signals
ratio Mo/Ni � 0.5), so that for temperatures larger than 875 8Cno molybdenum is detected in the spectra.
Nitrogen signal is clearly observed in both Auger and X-ray
photoelectron spectra of HAYNES 230 for temperatures
between 400 and 780 8C (see Fig. 6). Its segregation behavior
is similar to that observed for W and Mo; for a given annealing
temperature the nitrogen content at the surface increases
continuously up to 225 min annealing time, the maximum in its
segregation rate being reached for annealing at 700 8C. After
30 min annealing at 500, 600, and 700 8C the ratios between the
Auger signals of N and of Ni are �0.8, �0.9, and �1,
respectively. For larger temperatures the segregation rate
decays, so that for 875 8C and above no more N is detected in
the spectra.
The reduction in the segregation rates of W, Mo, and N for
temperatures above 700 8C is most likely caused by the fact that
sulphur strongly segregates above this temperature and the site
competition between S and these elements occurs. The general
behavior of the N segregation could as well be influenced by an
effect of cosegregation with Mo and/or W, resulting in the
formation of molybdenum nitride and tungsten nitrate,
respectively. Such processes were previously observed in
Fe–Mo [9] and Fe–W [10] alloys.
3.5. Segregation of oxide forming elements (Si, Mn, Ti, Al)
In the nuclear reactor environment, the formation of an
adherent oxide layer at the material surface can protect against
the detrimental processes like carburization or decarburization
[1]. It was found that manganese, together with chromium, very
often forms a stable oxide of the spinel type MnCr2O4 [8]. The
D. Pop, K. Wolski / Applied Surface Science 253 (2006) 2244–2250 2249
Fig. 7. Dependence of the silicon surface content on annealing temperature. Fig. 8. Relative intensity variation of the chromium Auger lines centered at 486
and 525 eV with annealing time at 780 8C.
Fig. 9. Relative intensity variation of the chromium Auger lines centered at 486
and 525 eV with annealing time at 1100 8C. Error bars represent the standard
deviation.
nature of the compounds formed with titanium is controversial,
possibly TiCr2O4. Silicon and aluminum form pure oxide
phases: SiO2 and Al2O3, respectively [8].
Silicon segregation was observed for annealing between
500 and 1035 8C. At a given temperature, its dependence
on the annealing time proved to be similar to that of
phosphorous, consisting of a fast accumulation of this
element at the surface, followed by a slow decay. The
variation of the silicon surface content as a function of
annealing temperature is shown in Fig. 7. The data were
obtained by analyzing the intensity of the 89 eVAuger line of
Si. They indicate a continuous increase of the surface content
with temperature, the segregation rate having a significant
growth above 900 8C.
Manganese signal was clearly detected in the Auger spectra
at 925 8C only for the second HAYNES 230 sample, that
suffered annealing at 910 8C summing about 10 h, but no other
significant previous heating. In the case of the first sample,
which suffered longer annealing processes at lower tempera-
tures, the intensity of the manganese Auger peak is much
smaller. Therefore, it is concluded that manganese suffers a
segregation processes followed by a fast evaporation. This
interpretation is supported by the fact that the vapor pressure for
manganese is very high in comparison to that of the other
components of the alloy (at 1200 K, 5.31 � 10�6 atm, in
contrast to that of 2.3 � 10�10 atm for Cr, or 1.1 � 10�11 atm
for Ni) [11]. Due to the small intensity of its Auger peak in most
of the spectra, it is difficult to estimate the temperature range
where the manganese segregation occurs as well as its time and
temperature dependence.
No aluminum segregation was detected for HAYNES 230 in
the present experiments. However, in the Auger spectra
measured up to 1000 eV, as in the present experiments, a
small Al signal is difficult to distinguish due to the fact that it
lays in the vicinity of the much stronger Ni and Cr signals.
Aluminum was not detected in the X-ray photoelectron spectra
as well, but also in this case small quantities of this element are
hardly perceivable due to the low cross-section. Therefore, even
if a slight segregation of Al occurred, this could not be
experimentally proved.
Concerning the detection of titanium, the intrinsic sensitivity
of Auger/XPS techniques is much better due to the Ti favorable
position in the spectra and to the higher cross-section. However,
the Ti signal being absent in both Auger and XPS spectra, we
concluded that no Ti segregation takes place.
3.6. Cr segregation and depletion
Chromium is the major alloying element that, as a function
of the environment of the nuclear reactor, can either form a
protective Cr2O3 oxide layer at the surface, or produce carbides
[1].
To study the chromium behavior in HAYNES 230, the
intensities of the most important Cr Auger lines (centered at
525 and 486 eV kinetic energy) were analyzed as a function of
annealing temperature and time. A chromium segregation was
observed for annealing the alloy at 700 and 780 8C. Fig. 8
illustrates this process at 780 8C, indicating the variation of the
ratio between the Cr and Ni Auger signals as a function of
annealing time.
Nickel-based alloys and stainless steels that are used at
temperatures above 900 8C present the risk of a chromium
D. Pop, K. Wolski / Applied Surface Science 253 (2006) 2244–22502250
Fig. 10. Chromium depletion profile of HAYNES 230 after repetitive anneal-
ing. The data were obtained by EDX measurements on a polished transverse
section.
depletion [12] at their surfaces. The evaporation of chromium
from stainless steels during vacuum annealing was considered
to be a process similar to that of chromium loss due to selective
oxidation [12]. For HAYNES 230, the variations in the
intensities of chromium Auger lines present a monotonous
decrease with annealing time at 1100 8C, as shown in Fig. 9.
The data indicate that an evaporation of chromium occurs at
this temperature. Within the precision limits of the present
experiment, no systematic dependencies of the chromium
signal on annealing time were evidenced when the sample was
heated at 875, 905, and 925 8C. A more detailed determination
of the onset temperature for Cr evaporation will be performed in
a further study.
To evaluate the depth of the alloy subsurface region which is
depleted in chromium, Energy Dispersive X-ray analysis
(EDX) were performed on the sample that was repeatedly
annealed between 400 and 1100 8C. The sample was cut
transversally to the surface and its two halves were analyzed
using the electron beam of a Scanning Electron Microscope
operating at 20 kV. The spot size of the electron beam was ca.
1 mm. The depletion profiles for chromium were obtained by
performing an elemental analysis in depth of the sample, at
different distances compared to the surface that was previously
studied by AES and XPS. All the spots used for measurements
were situated on a same line, transverse to the surface. The
results are shown in Fig. 10. They indicate that the annealing
generated a depth of approximately 40 mm from the sample
surface that is depleted in chromium.
The EDX analysis point to a concentration of chromium at
the surface that is approximately five times smaller than the
bulk concentration. On the other side, the AES results from
Fig. 9 indicate only a reduction by a factor of 1.5–1.7 of the
chromium signal after 90 min annealing relative to the initial
intensity at time t = 0. This discrepancy can be attributed to two
main factors: first—a possible slow chromium evaporation at a
temperature inferior to 1100 8C, at a too small rate to determine
systematic changes the spectra, and second—the segregation of
Cr at the extreme surface, as clearly evidenced after annealing
at 700 and 780 8C.
4. Conclusions
Auger spectroscopy and XPS studies of the HAYNES 230
alloy were performed to determine the changes in composition
that occur at the material surface at different temperatures
under UHV conditions. The experimental observations allow to
conclude that:
� S
everal constituent elements and impurities of this alloy (S, P,W, Mo, N, Si, Mn) segregate to the surface.
� T
he strong segregation of sulphur above 700 8C leads to a sitecompetition between this element and W, Mo, N, Si, and P,
respectively.
� A
t temperatures above 875 8C only S, P, and Si still segregate,with the amount of P and Si increasing with temperature.
� I
n the particular case of sulphur, it was found that themaximum coverage at 925 8C is in the range 0.06–0.15
monolayers, which might influence the spallation of the
protective oxide scale.
� A
nnealing of HAYNES 230 at 1100 8C under UHVconditions results in chromium evaporation.
Acknowledgements
The authors thank F. Rouillard and C. Cabet from CEA-
Saclay, France, for providing the alloy material and for the
helpful scientific discussions. The contribution of P. Passet to
the experimental work is also highly acknowledged.
References
[1] L.W. Graham, J. Nucl. Mater. 171 (1990) 76–83.
[2] M.A. Smith, W.E. Frazier, B.A. Pregger, Mater. Sci. Eng. A—Struct.
Mater. Properties Microstruct. Process. 203 (1995) 388–398.
[3] N. Marie, K. Wolski, M. Biscondi, Scripta Mater. 43 (2000) 943–949.
[4] K. Wolski, N. Marie, M. Biscondi, Surf. Interface Anal. 31 (2001) 280–
286.
[5] A. Larere, M. Guttmann, P. Dumoulin, C. Roques-Carmes, Acta Metall. 30
(1982) 685–693.
[6] C.J. McMahon Jr., A.K. Cianelli, H.C. Feng, Metall. Trans. A 8A (1977)
1055–1057.
[7] C. Lea, M.P. Seah, Metal Sci. 18 (1984) 521–525.
[8] W.J. Quadakkers, H. Schuster, Nucl. Technol. 66 (1984) 383–391.
[9] A. Rolland, M.M. Montagono, J. Cabane, Surf. Sci. 352 (1996) 206–
210.
[10] V. Hille, E.C. Viljoen, C. Uebing, Surf. Sci. 367 (1996) L54–L60.
[11] R. Hultgren, P.D. Desai, D.T. Hawkins, M. Gleiser, K.K. Kelly, D.D.
Wagman, Selected Values of the Thermodynamic Properties of the
Elements, American Society of Metals, Metals Park, OH, 1973.
[12] A.F. Smith, R. Hales, Werkstoffe und Korrosion 28 (1977) 405–409.