Embed Size (px)
Citation preview
Surface Segregation in Austenitic Stainless Steel
C.L. BRIANT and R.A. MULFORD
We report in this paper a study of surface segregation in austenitic stainless steel. Auger electron spectroscopy was used to measure segregation as a function of time and temperature. We have found that P, N, S, Cr, and Ni will all segregate to the surface. However, their presence on the surface often depends on the competitive and attractive interactions between the various elements. We show that thermodynamic data on ternary liquid iron alloys are quite valuable in predicting these interactions. We also discuss possible applications of these studies.
I. INTRODUCTION
THE grain boundaries and surfaces of solids often have significantly different chemical compositions from the bulk. Elements with low bulk solubilities often prefer to occupy sites at these interfaces instead of in the lattice because of the structural irregularity at the interfaces. ~,2,3
With the development of Auger electron spectroscopy 4 it has become possible to study the chemical composition of many of these interfaces. In particular, a number of in- vestigators have studied the chemical composition of grain boundaries and of the vacuum-surface interface. (Refer- ences 2 and 3 review these studies.) In most of these experi- ments segregation of certain elements to these interfaces has been measured as a function of time and heat treatment.
In this paper we report a study of surface segregation in austenitic stainless steels. We will show that phosphorus, sulfur, and nitrogen are the three most common impurity elements that segregate to the surfaces of these steels. Furthermore, a site competition is clearly observed between phosphorus and nitrogen, nitrogen and carbon, and sulfur and phosphorus. Chromium co-segregates with nitrogen and sulfur; nickel segregation is independent of all of the other elements. We also discuss a method to predict these inter- actions and the applicability of these measurements to vari- ous metallurgical problems.
II. E X P E R I M E N T A L
One commercial 304 stainless steel alloy, one commer- cial 316L stainless steel alloy, and four specially made laboratory 304 stainless steel alloys were used for this study. The chemical compositions are given in Table I.
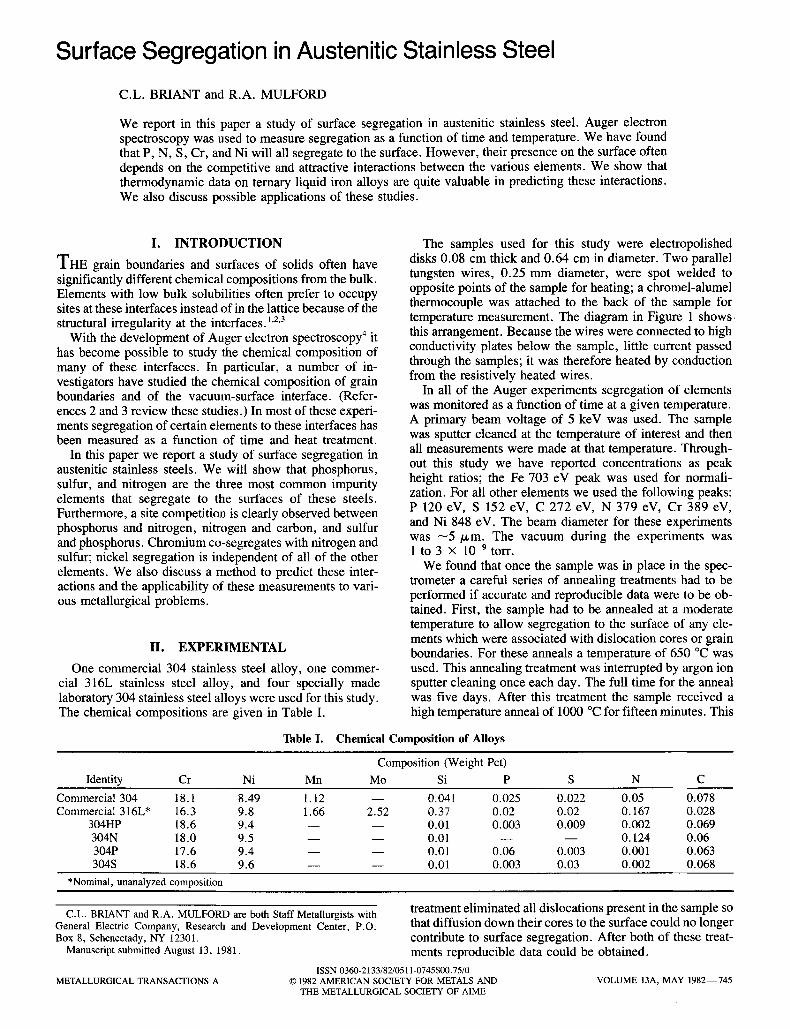
The samples used for this study were electropolished disks 0.08 cm thick and 0.64 cm in diameter. Two parallel tungsten wires, 0.25 mm diameter, were spot welded to opposite points of the sample for heating; a chromel-alumel thermocouple was attached to the back of the sample for temperature measurement. The diagram in Figure 1 shows. this arrangement. Because the wires were connected to high conductivity plates below the sample, little current passed through the samples; it was therefore heated by conduction from the resistively heated wires.
In all of the Auger experiments segregation of elements was monitored as a function of time at a given temperature. A primary beam voltage of 5 keV was used. The sample was sputter cleaned at the temperature of interest and then all measurements were made at that temperature. Through- out this study we have reported concentrations as peak height ratios; the Fe 703 eV peak was used for normali- zation. For all other elements we used the following peaks: P 120 eV, S 152 eV, C 272 eV, N 379 eV, Cr 389 eV, and Ni 848 eV. The beam diameter for these experiments was --5 /xm. The vacuum during the experiments was 1 to 3 • 10 -9 torr.
We found that once the sample was in place in the spec- trometer a careful series of annealing treatments had to be performed if accurate and reproducible data were to be ob- tained. First, the sample had to be annealed at a moderate
temperature to allow segregation to the surface of any ele- ments which were associated with dislocation cores or grain boundaries. For these anneals a temperature of 650 ~ was used. This annealing treatment was interrupted by argon ion sputter cleaning once each day. The full time for the anneal was five days. After this treatment the sample received a high temperature anneal of 1000 ~ for fifteen minutes. This
Table I. Chemical Composition of Alloys
Composition (Weight Pct) Identity Cr Ni Mn Mo Si P S N C
Commercial 304 t8.1 8.49 1.12 - - 0.041 0.025 0.022 0.05 0.078 Commercial 316L* 16.3 9.8 1.66 2.52 0.37 0.02 0.02 0.167 0.028
304HP 18.6 9.4 - - - - 0.01 0.003 0.009 0.002 0.069 304N 18.0 9.5 - - - - 0.01 - - - - 0.124 0.06 304P 17.6 9.4 - - - - 0.01 0.06 0.003 0.001 0.063 304S 18.6 9.6 - - - - 0.01 0.003 0.03 0.002 0.068
*Nominal, unanalyzed composition
C.L. BRIANT and R.A. MULFORD are both Staff Metallurgists wi th treatment eliminated all dislocations, tvresen, in the samv.e,l so General Electric Company, Research and Development Center, P.O. that diffusion down their cores to the surface could no longer Box 8, Schenectady, NY 12301. contribute to surface segregation. After both of these treat-
Manuscript submitted August 13, 1981. ments reproducible data could be obtained.
ISSN 0360-2133/82/0511-0745500.75/0 METALLURGICAL TRANSACTIONS A �9 1982 AMERICAN SOCIETY FOR METALS AND VOLUME 13A, MAY 1982--745
THE METALLURGICAL SOCIETY OF AIME
TO POWER
;ERAMIC B OCK HIGH CONDUCTIVITY PLATES
Fig. 1 - - A schematic diagram of the heating unit. The temperature was measured by a chromel-alumel thermocouple attached to the back of the sample.
Several other points should be made about the Auger experiments. We found that after sputter cleaning at room temperature, even for very long times, oxygen was still present on the surface. However, as soon as the sample was heated to above - 4 0 0 ~ this oxygen disappeared. It was, therefore, never present on the surface during the collection of the data reported here. We also found some spatial vari- ation in the peak height ratios across the surface. This result is presumably a consequence of the different orientations of the various grains. (The grain diameter ranged from 20 to 100/~m among the different alloys.) However, we found the same competitive interactions regardless of where the beam was positioned.
I I I . RESULTS
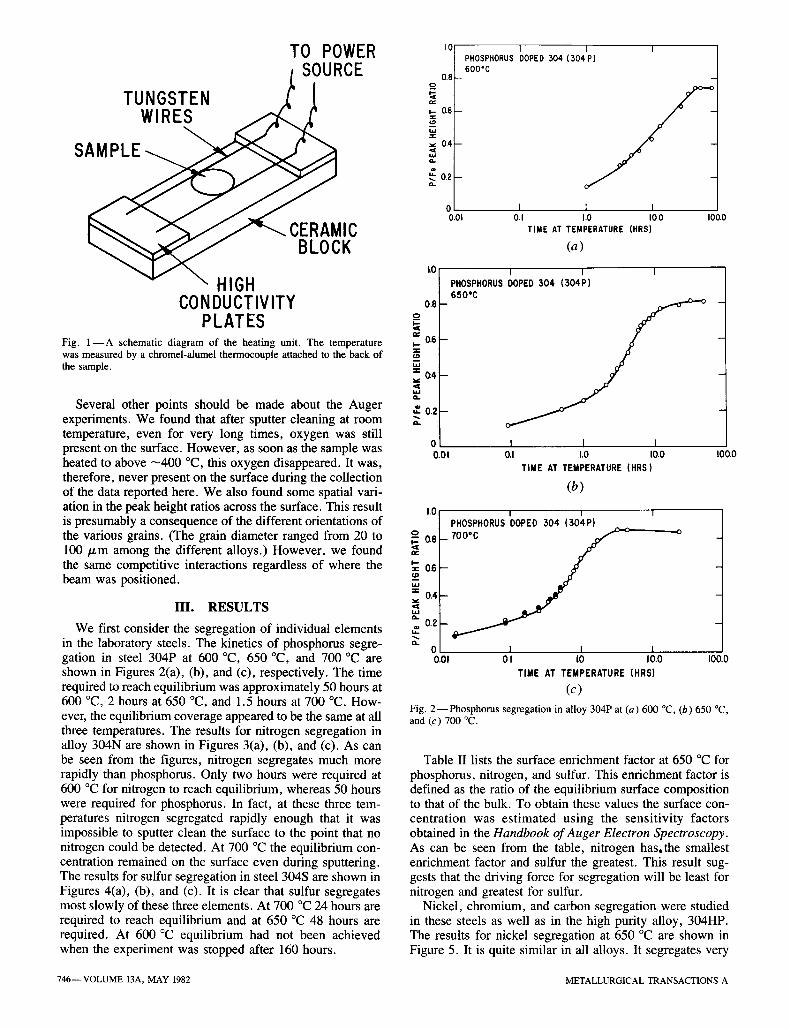
We first consider the segregation of individual elements in the laboratory steels. The kinetics of phosphorus segre- gation in steel 304P at 600 ~ 650 ~ and 700 ~ are shown in Figures 2(a), (b), and (c), respectively. The time required to reach equilibrium was approximately 50 hours at 600 ~ 2 hours at 650 ~ and 1.5 hours at 700 ~ How- ever, the equilibrium coverage appeared to be the same at all three temperatures. The results for nitrogen segregation in alloy 304N are shown in Figures 3(a), (b), and (c). As can be seen from the figures, nitrogen segregates much more rapidly than phosphorus. Only two hours were required at 600 ~ for nitrogen to reach equilibrium, whereas 50 hours were required for phosphorus. In fact, at these three tem- peratures nitrogen segregated rapidly enough that it was impossible to sputter clean the surface to the point that no nitrogen could be detected. At 700 ~ the equilibrium con- centration remained on the surface even during sputtering. The results for sulfur segregation in steel 304S are shown in Figures 4(a), (b), and (c). It is clear that sulfur segregates most slowly of these three elements. At 700 ~ 24 hours are required to reach equilibrium and at 650 ~ 48 hours are required. At 600 ~ equilibrium had not been achieved when the experiment was stopped after 160 hours.
0,8 o
0.6
=< 0,4
o..
~_0.2
10
0.8
0,6 -
0.4 -
�9 - 0 . 2 -
0 0.01
1.0
~ 0 . 8
e v .
De
== 0.4
,.= 0.2
0 0.01
0.01
I 1 PHOSPHORUS DOPED 504 (30 600"C
I 1 I 0.1 1.0 I00 I00.0
TIME AT TEMPERATURE (HRS)
(a)
I I I PHOSPHORUS DOPED 304 (304P) 650~
I I I o.I I.O IO.O
TIME AT TEMPERATURE (HRS)
(b)
I I PHOSPHORUS DOPED 304 (304P)
i I I 1
01 I0 I0.0
TIME AT TEMPERATURE (HRS)
(c)
I
I00.0
I00.0
Fig. 2 - - Phosphorus segregation in alloy 304P at (a) 600 ~ (b) 650 ~ and (c) 700 ~
Table II lists the surface enrichment factor at 650 ~ for phosphorus, nitrogen, and sulfur. This enrichment factor is defined as the ratio of the equilibrium surface composition to that of the bulk. To obtain these values the surface con- centration was estimated using the sensitivity factors obtained in the Handbook of Auger Electron Spectroscopy. As can be seen from the table, nitrogen has.the smallest enrichment factor and sulfur the greatest. This result sug- gests that the driving force for segregation will be least for nitrogen and greatest for sulfur.
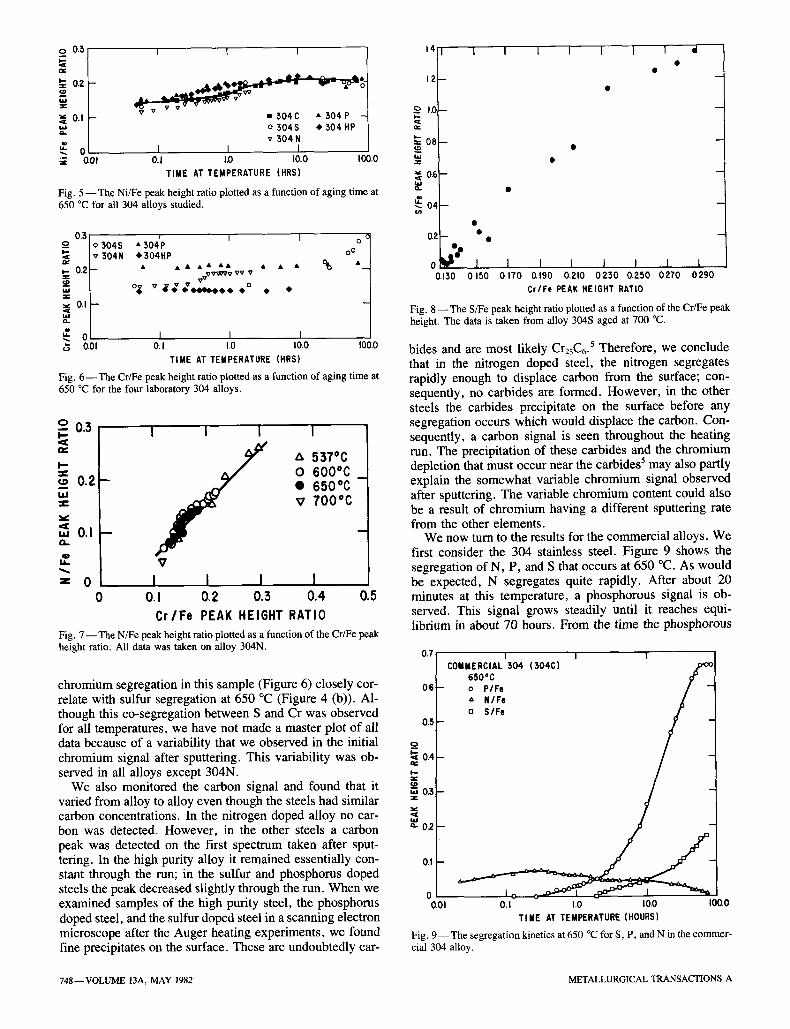
Nickel, chromium, and carbon segregation were studied in these steels as well as in the high purity alloy, 304HP. The results for nickel segregation at 650 ~ are shown in Figure 5. It is quite similar in all alloys. It segregates very
746--VOLUME 13A, MAY 1982 METALLURGICAL TRANSACTIONS A

0.2 1.2
~c2
~, 0.t :z:
==
z 0 0.01
I f NITROGEN DOPED 504 (504N|
O. I 1.0 I0 .0
TIME AT TEMPERATURE (HRS)
(a)
0.2 o
I , -
01
I I NITROGEN DOPED 304 (304N) 650"C
I00.0
0 I I I 0.01 O I I 0 I0.0 I00.0
TIME AT TEMPERATURE (HRS)
(b) 2
: - - - t I NITROGEN DOPED 304 (304N)" | 7 0 0 %
-- 0.05 ~,
O t I i I 0.01 01 I 0 10.o 100.0
~" TIME AT TEMPERATURE (HRS) z
(c) Fig. 3 - - Nitrogen segregation in ahoy 304N at (a) 600 ~ (h) 650 ~ and (c) 700 ~
Tab l e I I , S u r f a c e E n r i c h m e n t F a c t o r s a t 650 ~
E l e m e n t E n r i c h m e n t
N 20 .9 P 494 S 1466
slightly during the first five to eight hours and then remains constant throughout the remainder of the run. Therefore, this element does not co-segregate with any of the impur- ity elements.
The results of chromium segregation at 650 ~ are shown in Figure 6. It is clear that segregation of chromium is different for different alloys. In the phosphorus doped and high purity steels (304P and 304HP) little change is ob- served throughout the heating period. However, in the nitro- gen doped steel (304N) and in the sulfur doped steel (304S) evidence of segregation can be seen, although the kinetics in the two alloys are obviously different. Figure 7 shows the N/Fe peak height ratio plotted as a function of the Cr/Fe peak height ratio for all of the heating runs made on the 304N alloy. These two ratios depend strongly on each other, and it is clear that the two elements must co-segregate. Also,
o I0 F= c ~ = 0.8
r
~-- 0.6
0.4
~' 0.2
0 0.01
1.2
LO
I I I 1
SULFUR DOPED 304 (304S) 600*C
O. I 1.0 I 0 , 0 I 0 0 . 0
TIME AT TEMPERATURE (HRS)
(a)
o
~ _ 0 8 -
0.6-
0.4-
0.2-
O ~ c 001
I I I [
SULFUR DOPED 304 (304S) _650"C
' I I 0 1 1.0 100 1O0.0
TIME AT TEMPERATURE (HRS)
(b)
IO00,O
- q
I000.0
Q m
= w z :
t. iJ o,..
,T_ o'>
1.4
1.2
1.0
08
0.6 -
0 . 4 l
0 . 2 -
0 i i
I I SULFUR DOPED 304 (304S) 700"C
- o S / F e
0.1 1.0 ! I00 I00.0 TIME AT TEMPERATURE (HRS)
(c) Fig. 4 - - S u l f u r segregation in alloy 304S at (a) 600 ~ (b) 650 ~ and (c) 700 ~
the rather rapid increase in the chromium concentration for this steel at 650 ~ shown in Figure 6, closely parallels the kinetics of nitrogen segregation at 650 ~ (Figure 3 (b)). Figure 8 shows the S/Fe peak height ratio plotted as a func- tion of the Cr/Fe peak height ratio for a single heating run. Again, a strong correlation is observed. Also, the kinetics of
METALLURGICAL TRANSACTIONS A VOLUME 13A, MAY 1982--747
o 0.3
~= 0.2 -
==:
0.1 - =,_
-. 0 o.01
I I I
o 304S �9 304 HP v 304 N
I I I 0.1 ID I0.0 I00.0
TIME AT TEMPERATURE (HRS)
Fig. 5 - - The Ni/Fe peak height ratio plotted as a function of aging time at 650 ~ for all 304 alloys studied.
0.3 o o 304S I--
v 304N 0.2-
t,l.I
o J - =.. ,2 o G 0.01
, i I o "304P �9 304HP ~176
�9 �9 & � 9 & � 9 �9 �9 �9 O~ & V V V ~ V VV
V V 0 o~ . # # * ~ � 9 1 4 9 �9 �9 �9
I I I 0.1 1.0 I0.0
TIME AT TEMPERATURE (HRS) I00.0
Fig. 6 - - T h e Cr/Fe peak height ratio plotted as a function of aging time at 650 ~ for the four laboratory 304 alloys.
I I I I o 0.3 I--
I--
0.2
u~ 0.1 n
zx 5370C 0 6 0 0 " C �9 6 5 0 *C V 700~
u_ V
= 0 I I I I 0 0.1 0.2 0.3 0 .4 0.5
C r / F e PEAK HEIGHT RATIO
Fig. 7 - - T h e N/Fe peak height ratio plotted as a function of the Cr/Fe peak height ratio. All data was taken on alloy 304N.
chromium segregation in this sample (Figure 6) closely cor- relate with sulfur segregation at 650 ~ (Figure 4 (b)). Al- though this co-segregation between S and Cr was observed for all temperatures, we have not made a master plot of all data because of a variability that we observed in the initial chromium signal after sputtering. This variability was ob- served in all alloys except 304N.
We also monitored the carbon signal and found that it varied from alloy to alloy even though the steels had similar carbon concentrations. In the nitrogen doped alloy no car- bon was detected. However, in the other steels a carbon peak was detected on the first spectrum taken after sput- tering. In the high purity alloy it remained essentially con- stant through the run; in the sulfur and phosphorus doped steels the peak decreased slightly through the run. When we examined samples of the high purity steel, the phosphorus doped steel, and the sulfur doped steel in a scanning electron microscope after the Auger heating experiments, we found fine precipitates on the surface. These are undoubtedly car-
1.4 I I
12
1.0- O~
oe-
0.6 -
~ 0 4 --
I I I I I d
0 I I I I I I I I 0.130 0150 0170 0.190 0.210 0230 0.250 0270 0290
C r / F e PEAK HEIGHT RATIO
Fig. 8 - - T h e S/Fe peak height ratio plotted as a function of the Cr/Fe peak height. The data is taken from alloy 304S aged at 700 ~
bides and are most likely Cr23C6 .5 Therefore, we conclude that in the nitrogen doped steel, the nitrogen segregates rapidly enough to displace carbon from the surface; con- sequently, no carbides are formed. However, in the other steels the carbides precipitate on the surface before any segregation occurs which would displace the carbon. Con- sequently, a carbon signal is seen throughout the heating run. The precipitation of these carbides and the chromium depletion that must occur near the carbides 5 may also partly explain the somewhat variable chromium signal observed after sputtering. The variable chromium content could also be a result of chromium having a different sputtering rate from the other elements.
We now turn to the results for the commercial alloys. We first consider the 304 stainless steel. Figure 9 shows the segregation of N, P, and S that occurs at 650 ~ As would be expected, N segregates quite rapidly. After about 20 minutes at this temperature, a phosphorous signal is ob- served. This signal grows steadily until it reaches equi- librium in about 70 hours. From the time the phosphorous
0.7 I I I COMMERCIAL 304 (304C) xo ~
6fiO~ / 06 - - o P I F e
e, N / F o
0.5 i
0.1
0 Io ~ t :p :~ - I 0.01 O. I 1.0 I0.0 I00 .0
TIME AT TEMPERATURE (HOURS)
Fig. 9 - - The segregation kinetics at 650 ~ for S, P, and N in the commer- cial 304 alloy.
o 0.4
i -
0.3
~- 0.2
748--VOLUME 13A, MAY 1982 METALLURGICAL TRANSACTIONS A
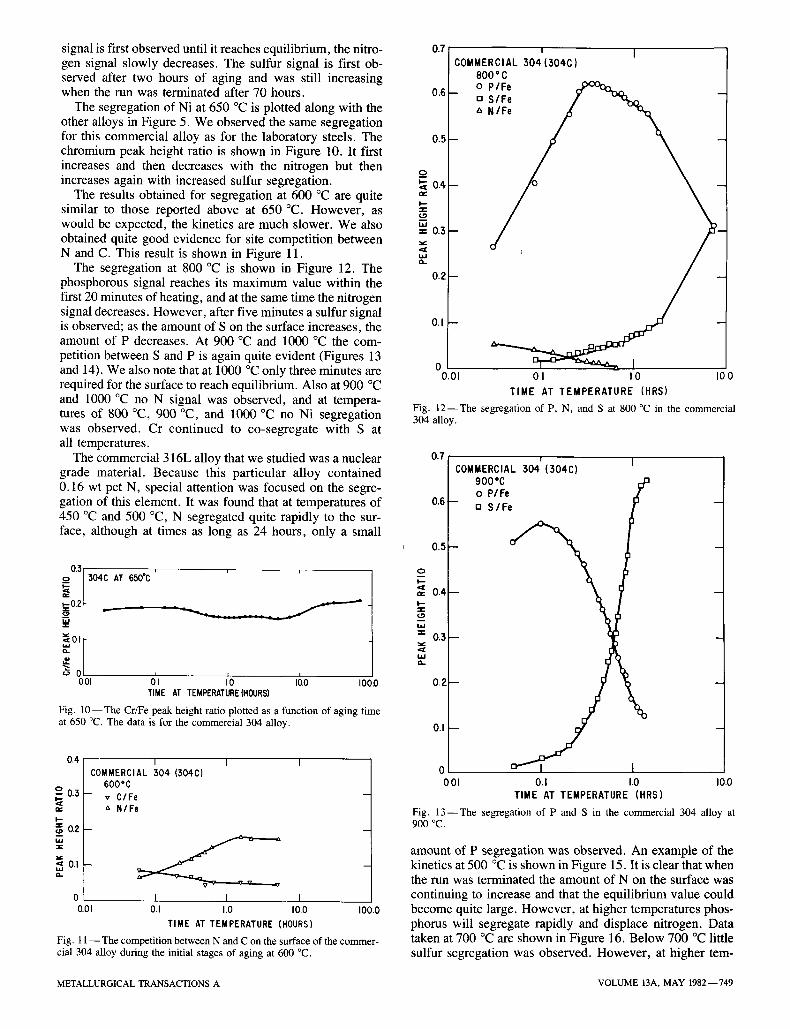
0.71 signal is first observed until it reaches equilibrium, the nitro- gen signal slowly decreases. The sulfur signal is first ob- served after two hours of aging and was still increasing when the run was terminated after 70 hours.
The segregation of Ni at 650 ~ is plotted along with the other alloys in Figure 5. We observed the same segregation for this commercial alloy as for the laboratory steels. The chromium peak height ratio is shown in Figure 10. It first increases and then decreases with the nitrogen but then increases again with increased sulfur segregation.
The results obtained for segregation at 600 ~ are quite similar to those reported above at 650 ~ However, as would be expected, the kinetics are much slower. We also obtained quite good evidence for site competition between N and C. This result is shown in Figure 11.
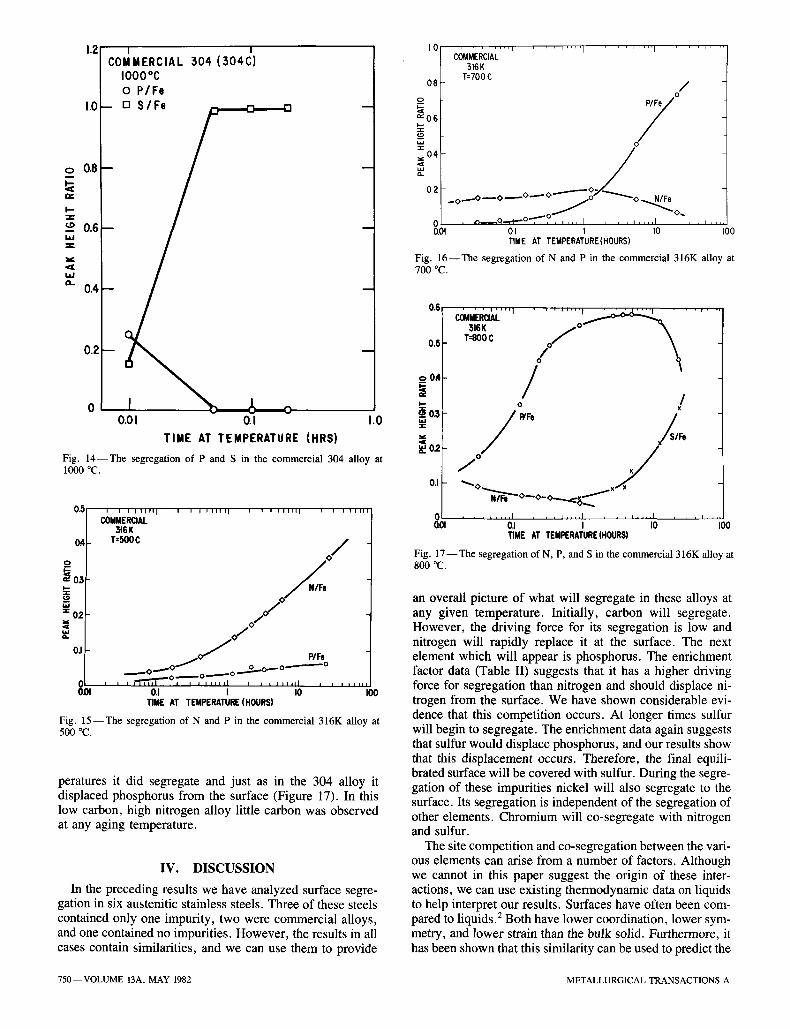
The segregation at 800 ~ is shown in Figure 12. The phosphorous signal reaches its maximum value within the first 20 minutes of heating, and at the same time the nitrogen signal decreases. However, after five minutes a sulfur signal is observed; as the amount of S on the surface increases, the amount of P decreases. At 900 ~ and 1000 ~ the com- petition between S and P is again quite evident (Figures 13 and 14). We also note that at 1000 ~ only three minutes are required for the surface to reach equilibrium. Also at 900 ~ and 1000 ~ no N signal was observed, and at tempera- tures of 800 ~ 900 ~ and 1000 ~ no Ni segregation was observed. Cr continued to co-segregate with S at all temperatures.
The commercial 316L alloy that we studied was a nuclear grade material. Because this particular alloy contained 0.16 wt pct N, special attention was focused on the segre- gation of this element. It was found that at temperatures of 450 ~ and 500 ~ N segregated quite rapidly to the sur- face, although at times as long as 24 hours, only a small
0 , 5 i r
,::, 304C AT 650"C
t--02 . _
o .
~ 0 0,01 0'1 I'0 I0.0 I00.0
TIME AT TEMPERATURE (HOURS)
Fig. 1 0 - - T h e Cr/Fe peak height ratio plotted as a function of aging time at 650 ~ The data is for the commercial 304 alloy.
0.4
o 0.3
~ o . a -
o.i -
0 0.01
I COMMERCIAL 304 (304C)
600"C - - v C / F e
a N/Fe
I I
I I 0.1 1.0 I0.0 I00.0
TIME AT TEMPERATURE (HOURS)
Fig. 11 - - The competition between N and C on the surface of the commer- cial 304 alloy during the initial stages of aging at 600 ~
0 . 6
0 . 5
2 o.4
I , , , - , - . , , i , , -
0.3
0.2
0.1
01- - . 0.01
I
COMMERCIAL 304 (304C) 8 0 0 " C
_ o P / F e o S / F e " N / F e
/
0 1 1.0 10
TIME AT TEMPERATURE (HRS) Fig. 1 2 - - T h e segregation of P, N, and S at 800 ~ in the commercial 304 alloy.
0 . 7 ' I
COMMERCIAL 304 (304C) 9 0 0 " C o PIFe
0 . 6 - n S / F e
,, 0 . 5 - -
_o t , -
0 . 4 - I"-- "T"
hJ
"" 0 . 3 - -
n
0.2-- -
0 . 1 - - -
0 I I 0 01 0. I 1.0 10.0
TIME AT TEMPERATURE ( H R S )
Fig. 1 3 - - T h e segregation of P and S in the commercial 304 alloy at 900 ~
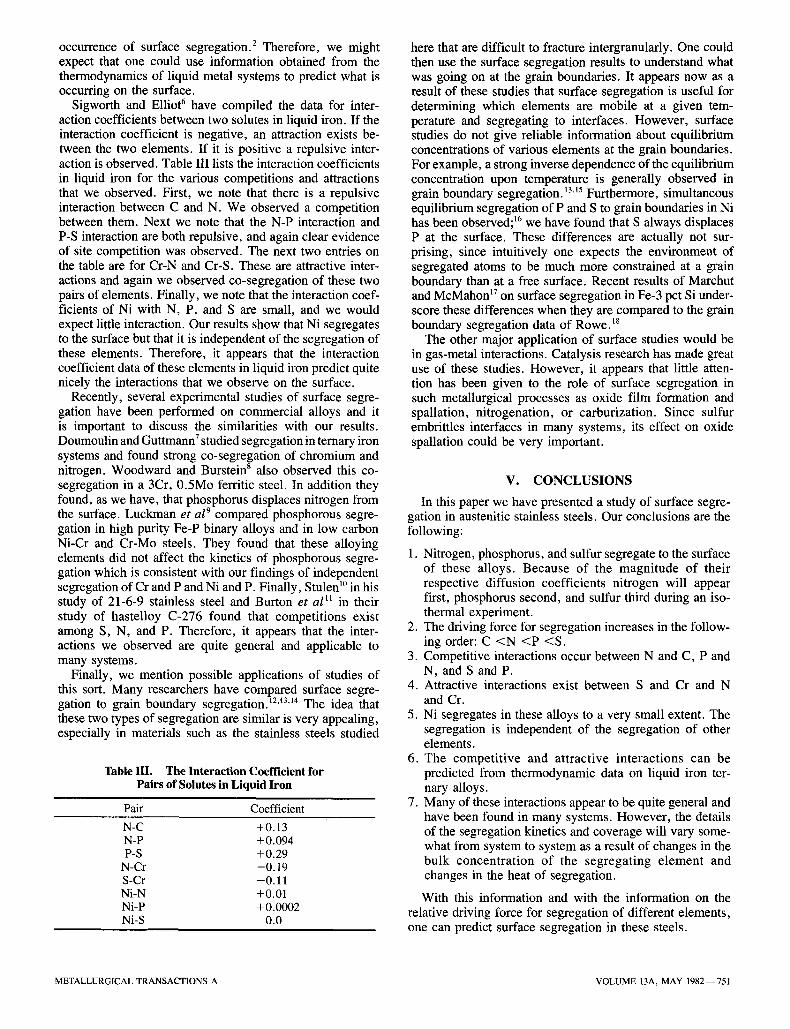
amount of P segregation was observed. An example of the kinetics at 500 ~ is shown in Figure 15. It is clear that when the run was terminated the amount of N on the surface was continuing to increase and that the equilibrium value could become quite large. However, at higher temperatures phos- phorus will segregate rapidly and displace nitrogen. Data taken at 700 ~ are shown in Figure 16. Below 700 ~ little sulfur segregation was observed. However, at higher tem-
METALLURGICAL TRANSACTIONS A VOLUME 13A, MAY 1982--749
o 0.8
I.-
-~ 0.6 l a d - , / -
,1=r IM
0.4
1.2 I COMMERCIAL
1000% o P / F e
1.0- D S / F e
/
I
304 ( 3 0 4 C )
0.2
0 ~ 0.01 0.1 1.0
TIME AT TEMPERATURE (HRS)
Fig. 1 4 - - T h e segregation of P and S in the commercial 304 alloy at 1000 ~
05 i i i t l l l l I i i i l i l l e I i i i i i i i i I r i i i i i i i
COMMERCIAL 316K
2 0.4 T:500C / 0 /
=: 03
..- o / ~ 02
0.,
0 , , , , ' " r "~ '~ ' - ~ . . . . . . i . . . . . . . . i , , , , , , , 0.01 0.1 I I0 I00
TIME AT TEMPERATURE (HOURS)
Fig. 1 5 - - T h e segregation of N and P in the commercial 316K alloy at 500 ~
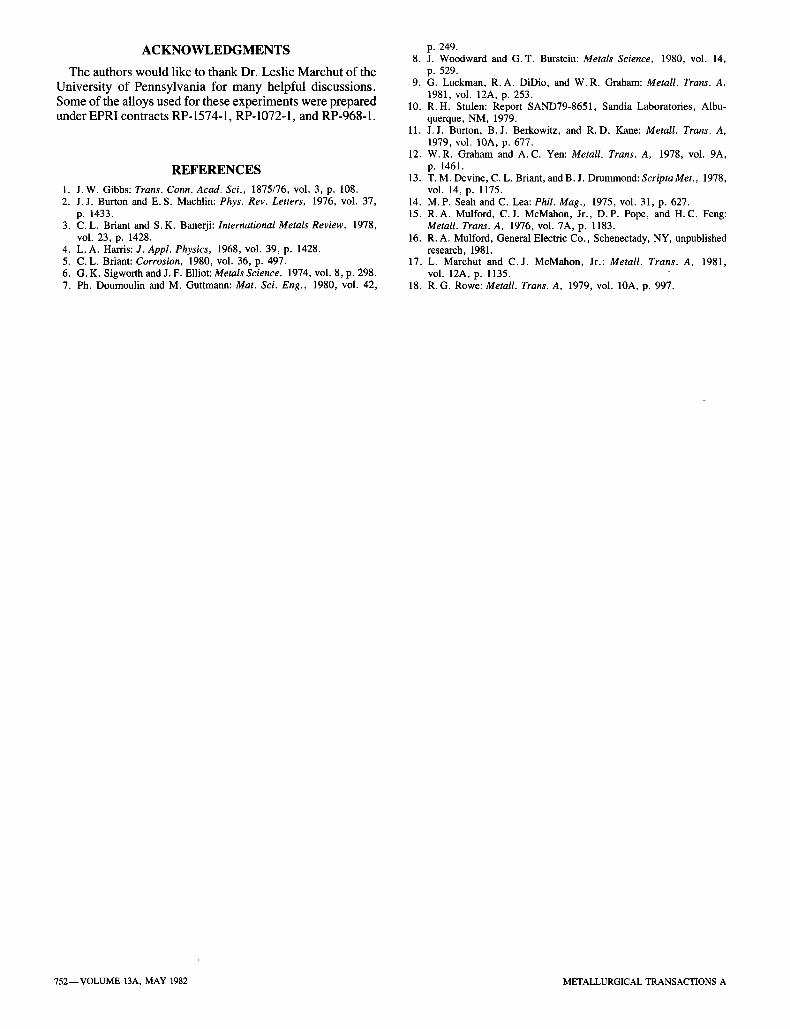
peratures it did segregate and just as in the 304 alloy it displaced phosphorus from the surface (Figure 17). In this low carbon, high nitrogen alloy little carbon was observed at any aging temperature.
IV. DISCUSSION
In the preceding results we have analyzed surface segre- gation in six austenitic stainless steels. Three of these steels contained only one impurity, two were commercial alloys, and one contained no impurities. However, the results in all cases contain similarities, and we can use them to provide
I 0
08
o
~ 0 6
w
~ 0 4
0 2
0
' ' ' ' . . . . 1
COMMERCIAL 316K
T:700 C
' ' ' ' . . . . I ' ' ' ' . . . . I ' ' ' ' ' "
/
/ o
, ~ . . - . Q . . a , - - ~ ' ' ~ , . . . . I , , , , . . . . I , ' , , , , ,
0.01 01 I 10 100 TIME AT TEMPERATURE(HOURS)
Fig. 1 6 - - T h e segregation of N and P in the commercial 316K alloy at 700 ~
0 . 6 , ' , , i ,
COMMERCIAL'"I . . . . . . . . I ' �9 ' , . . . . i ' ' , '
31eK / 0.5 T:800 C
o
0
_o 0.4 /
i- o / --~03 / P / F e / x
-" /
/o / 0.1 ~ r x / ~ X
N/-~'o--o- o . . . . . . ~
0.01 0.1 I I0 I00 TIME AT TEMPERATURE (HOURS)
Fig. 1 7 - - T h e segregation of N, P, and S in the commercial 316K alloy at 800 ~
an overall picture of what will segregate in these alloys at any given temperature. Initially, carbon will segregate. However, the driving force for its segregation is low and nitrogen will rapidly replace it at the surface. The next element which will appear is phosphorus. The enrichment factor data (Table II) suggests that it has a higher driving force for segregation than nitrogen and should displace ni- trogen from the surface. We have shown considerable evi- dence that this competition occurs. At longer times sulfur will begin to segregate. The enrichment data again suggests that sulfur would displace phosphorus, and our results show that this displacement occurs. Therefore, the final equili- brated surface will be covered with sulfur. During the segre- gation of these impurities nickel will also segregate to the surface. Its segregation is independent of the segregation of other elements. Chromium will co-segregate with nitrogen and sulfur.
The site competition and co-segregation between the vari- ous elements can arise from a number of factors. Although we cannot in this paper suggest the origin of these inter- actions, we can use existing thermodynamic data on liquids to help interpret our results. Surfaces have often been com- pared to liquids. 2 Both have lower coordination, lower sym- metry, and lower strain than the bulk solid. Furthermore, it has been shown that this similarity can be used to predict the
750--VOLUME 13A, MAY 1982 METALLURGICAL TRANSACTIONS A
occurrence of surface segregation. 2 Therefore, we might expect that one could use information obtained from the thermodynamics of liquid metal systems to predict what is occurring on the surface.
Sigworth and Elliot 6 have compiled the data for inter- action coefficients between two solutes in liquid iron. If the interaction coefficient is negative, an attraction exists be- tween the two elements. If it is positive a repulsive inter- action is observed. Table III lists the interaction coefficients in liquid iron for the various competitions and attractions that we observed. First, we note that there is a repulsive interaction between C and N. We observed a competition between them. Next we note that the N-P interaction and P-S interaction are both repulsive, and again clear evidence of site competition was observed. The next two entries on the table are for Cr-N and Cr-S. These are attractive inter- actions and again we observed co-segregation of these two pairs of elements. Finally, we note that the interaction coef- ficients of Ni with N, P, and S are small, and we would expect little interaction. Our results show that Ni segregates to the surface but that it is independent of the segregation of these elements. Therefore, it appears that the interaction coefficient data of these elements in liquid iron predict quite nicely the interactions that we observe on the surface.
Recently, several experimental studies of surface segre- gation have been performed on commercial alloys and it is important to discuss the similarities with our results. Doumoulin and Guttmann 7 studied segregation in ternary iron systems and found strong co-segregation of chromium and nitrogen. Woodward and Burstein 8 also observed this co- segregation in a 3Cr, 0.5Mo ferritic steel. In addition they found, as we have, that phosphorus displaces nitrogen from the surface. Luckman et al 9 compared phosphorous segre- gation in high purity Fe-P binary alloys and in low carbon Ni-Cr and Cr-Mo steels. They found that these alloying elements did not affect the kinetics of phosphorous segre- gation which is consistent with our findings of independent segregation of Cr and P and Ni and P. Finally, Stulen 1~ in his study of 21-6-9 stainless steel and Burton et al ll in their study of hastelloy C-276 found that competitions exist among S, N, and P. Therefore, it appears that the inter- actions we observed are quite general and applicable to many systems.
Finally, we mention possible applications of studies of this sort. Many researchers have compared surface segre- gation to grain boundary segregation. 12,13'14 The idea that these two types of segregation are similar is very appealing, especially in materials such as the stainless steels studied
Table III. The Interaction Coefficient for Pairs of Solutes in Liquid Iron
Pair Coefficient
N-C +0.13 N-P +O.O94 P-S +O.29
N-Cr -0.19 S-Cr -0.11 Ni-N +0.01 Ni-P +0.0002 Ni-S 0.0
here that are difficult to fracture intergranularly. One could then use the surface segregation results to understand what was going on at the grain boundaries. It appears now as a result of these studies that surface segregation is useful for determining which elements are mobile at a given tem- perature and segregating to interfaces. However, surface studies do not give reliable information about equilibrium concentrations of various elements at the grain boundaries. For example, a strong inverse dependence of the equilibrium concentration upon temperature is generally observed in grain boundary segregation. 13.15 Furthermore, simultaneous equilibrium segregation of P and S to grain boundaries in Ni has been observed; ~6 we have found that S always displaces P at the surface. These differences are actually not sur- prising, since intuitively one expects the environment of segregated atoms to be much more constrained at a grain boundary than at a free surface. Recent results of Marchut and McMahon 17 on surface segregation in Fe-3 pct Si under- score these differences when they are compared to the grain boundary segregation data of Rowe. 18
The other major application of surface studies would be in gas-metal interactions. Catalysis research has made great use of these studies. However, it appears that little atten- tion has been given to the role of surface segregation in such metallurgical processes as oxide film formation and spallation, nitrogenation, or carburization. Since sulfur embrittles interfaces in many systems, its effect on oxide spallation could be very important.
V. C O N C L U S I O N S
In this paper we have presented a study of surface segre- gation in austenitic stainless steels. Our conclusions are the following:
1. Nitrogen, phosphorus, and sulfur segregate to the surface of these alloys. Because of the magnitude of their respective diffusion coefficients nitrogen will appear first, phosphorus second, and sulfur third during an iso- thermal experiment.
2. The driving force for segregation increases in the follow- ing order: C < N < P <S.
3. Competitive interactions occur between N and C, P and N, and S and P.
4. Attractive interactions exist between S and Cr and N and Cr.
5. Ni segregates in these alloys to a very small extent. The segregation is independent of the segregation of other elements.
6. The competit ive and attractive interactions can be predicted from thermodynamic data on liquid iron ter- nary alloys.
7. Many of these interactions appear to be quite general and have been found in many systems. However, the details of the segregation kinetics and coverage will vary some- what from system to system as a result of changes in the bulk concentration of the segregating element and changes in the heat of segregation.
With this information and with the information on the relative driving force for segregation of different elements, one can predict surface segregation in these steels.
METALLURGICAL TRANSACTIONS A VOLUME 13A, MAY 1982--751
ACKNOWLEDGMENTS
The authors would like to thank Dr. Leslie Marchut of the University of Pennsylvania for many helpful discussions. Some of the alloys used for these experiments were prepared under EPRI contracts RP-1574-1, RP-1072-1, and RP-968-1.
REFERENCES
1. J.W. Gibbs: Trans. Conn. Acad. Sci., 1875/76, vol. 3, p. 108. 2. J.J. Burton and E.S. Machlin: Phys. Rev. Letters, 1976, vol. 37,
p. 1433. 3. C.L. Briant and S.K. Banerji: International Metals Review, 1978,
vol. 23, p. 1428. 4. L.A. Harris: J. Appl. Physics, 1968, vol. 39, p. 1428. 5. C.L. Briant: Corrosion, 1980, vol. 36, p. 497. 6. G.K. Sigworth and J. F. Elliot: Metals Science, 1974, vol. 8, p. 298. 7. Ph. Doumoulin and M. Guttmann: Mat. Sci. Eng., 1980, vol. 42,
p. 249. 8. J. Woodward and G.T. Burstein: Metals Science, 1980, vol. 14,
p. 529. 9. G. Luckman, R.A. DiDio, and W.R. Graham: Metall. Trans. A.
1981, vol. 12A, p. 253. 10. R.H. Stulen: Report SAND79-8651, Sandia Laboratories, Albu-
querque, NM, 1979. 11. J.J. Burton, B.J. Berkowitz, and R.D. Kane: Metall. Trans. A,
1979, vol. 10A, p. 677. 12. W.R. Graham and A.C. Yen: MetaU. Trans. A, 1978, vol. 9A,
p. 1461. 13. T.M. Devine, C. L. Briant, andB. J. Drummond: ScriptaMet., 1978,
vol. 14, p. 1175. 14. M.P. Seah and C. Lea: Phil. Mag., 1975, vol. 31, p. 627. 15. R.A. Mulford, C.J. McMahon, Jr., D.P. Pope, and H.C. Feng:
Metall. Trans. A, 1976, vol. 7A, p. 1183. 16. R.A. Mulford, General Electric Co., Schenectady, NY, unpublished
research, 1981. 17. L. Marchut and C.J. McMahon, Jr.: Metall. Trans. A, 1981,
vol. 12A, p. 1135. 18. R.G. Rowe: Metall. Trans. A, 1979, vol. 10A, p. 997.
752--VOLUME 13A, MAY 1982 METALLURGICAL TRANSACTIONS A