Embed Size (px)
Citation preview
ENGINEERING FOR RURAL DEVELOPMENT Jelgava, 25.-27.05.2016.
687
SURFACE ROUGHNESS MEASURE THAT BEST CORRELATES TO
EASE OF SLIDING
Ernests Jansons, Janis Lungevics, Karlis Agris Gross
Riga Technical University, Latvia [email protected], [email protected], [email protected]
Abstract. Despite the long history on the study of friction and ease of sliding, there are few studies on friction of metal with smooth surfaces such as ice. The aim of this study was to determine the best surface roughness measure that correlates with the ease of sliding. Ice was chosen as the smooth surface since it is easy to produce. Stainless steel blocks were abraded with different grades of sandpaper to produce parallel scratches in the metal surface. Single roughness measures (Ra, Sa, SSk, Sds, Sdq, and RSm) and RSm/Sathat is related to the Criterion for Contact were extracted from a 3D profilometry measurement on metal blocks scratched with 400 to 3000 grades of sandpaper. The scratched metal blocks were slid down an ice-track to determine the sliding speed of blocks with different roughness. The relationship between the roughness parameters and sliding velocity was then investigated. It was shown that the best correlation between the surface roughness and the sliding speed was for the “Criterion for Contact”roughness measure, RSm/Sa. A critical value of roughness was essential for achieving the best sliding. A method was established for measuring and characterizing the roughness of a surface for applications requiring low friction.
Keywords: surface roughness, scratches, surface topography, 3D roughness, slidability.
1. Introduction
If one is planning to investigate how solid objects slide on the ice it is essential to understand that the object surface that comes into contact with ice contains small asperities (otherwise defined as roughness).Asperities first of all penetrate into the underlying ice surface, thus possibly “anchor” the sliding object and secondly they determine wettability characteristics for the specific surface [1-4]. This means that roughness influences the ease of sliding from two important and inseparable aspects. Even though scientists agree that roughness plays an important role in friction processes only few of them have done deeper investigation in this field [3; 5-7].
The first step for doing such research is to make sure that the experimental sample surfaces are properly manufactured and characterized. Literature analysis shows that surface roughness is most likely characterized by using single 2D roughness parameter Ra, but, as shown in Fig. 1, such parameter alone cannot properly characterize the surface texture, therefore, it is important to find a better characterization technique. The first step on finding such technique starts with replacing most commonly used 2D roughness measurements with 3D surface roughness measures, because such approach provides statistically more reliable data than roughness measures obtained from single profiles across a surface. Secondly, one must find, which of these parameters are most likely usable for ice friction surface characterization, therefore, in this article the authors are analyzing different methods of surface characterizations and comparing the obtained roughness measurements with sample slidability on ice.
As important as proper surface characterization is also the development of a method for slidability detection. While most of the studies use different kinds of tribometers, rheometers, etc. [2; 3; 5] for metal and ice friction coefficient measurements, the authors in this a simple incline plane [8] that is equipped with additional optical sensors.Additional sensors on the side of the plane, combined with the data logging and analysing system, allow to maintain experimental sample sliding time measurements along the inclined plane. Time measurements can be used directly or indirectly as sliding velocity, calculated from time measurements and distances between the sensors, for comparing how different surface modifications affect slidability. It is proposed that such device can achieve better detection of roughness influence on slidability, because the result (sliding time or average sliding velocity differences), not the cause of it (friction coefficient change), is measured and compared afterwards.
The objective for this research is to investigate how different surface roughness characterization methods correlate with slidability measurements, which are maintained on inclined plane.

ENGINEERING FOR RURAL DEVELOPMENT Jelgava, 25.-27.05.2016.
688
2. Materials and Methods
Surface roughness characterization
So far known scientific researches in roughness influence on ice friction [3; 5; 6] use only two dimensional (2D) roughness parameters like arithmetical mean deviation of the roughness profile Ra or root mean square deviation of the roughness profile Rz which are calculated from independently measured roughness profiles, but experience shows that individual profile measurements cannot be considered as enough informative data to describe the actual surface texture. For instance, Fig. 1 clearly shows that completely different profile shapes can give same roughness parameter Ra value but it is obviously clear that if such surfaces with so different texture are involved in the sliding process, their slidability will be different. As a result, there are no conditions for the reference plane, and this can be along the top of the surface (Fig. 1B) or along the bottom from which peaks are formed (Fig. 1C). The large degree of freedom for the Ra measure does not adequately describe the surface, and this emphasizes the requirement for investigating other possible measures.
Fig. 1. Roughness profile examples: A – grounded surface; B – honed surface; C – turned surface
In order to improve surface roughness characterization precision, first of all it is more adequate to use three dimensional (3D) roughness measurements to describe the surface texture instead of just measuring 2D profiles. Relatively newly developed 3D roughness standard ISO 25178 [9] defines more than 30 different roughness parameters, which are categorized in four large groups: height parameters, spatial parameters, hybrid parameters and functional parameters. The authors analyzed all the parameters defined on specific standard from surface mechanic aspect and it was concluded that following 3D roughness parameters can be considered for characterizing the surface involved in sliding:
Sa – arithmetical mean height of the scale limited surface; SSk – symmetry of the distribution curve of depth; Sds – density of peaks; Sdq – mean quadratic slope of the surface.
The arithmetic mean is the most commonly used roughness characterization indicator that describes surface asperities in vertical direction, and so it was included. SSk describes the structure of the surface, i.e. it shows whether the surface consists of relatively smooth reference plane, which mostly has pits (similar to Fig. 1B) or peaks (similar to Fig. 1C) on it. As far as the actual surface contact area varies according to the surface peak the density parameter Sds theoretically should allow to characterize this factor. Sdq characterizes how steep the peaks of the surface are, thus allowing to define whether surface asperities are sharp or shallow.
Although 3D roughness parameters seem to provide good characterization for the investigated surfaces, the authors offer to use the Criterion of Contact (KK) (see equation 1) instead [10].
ES
HRKK
a
Sm
⋅
⋅=
µ , (1)
where RSm – mean spacing between the peaks at the mean line, mm; Hµ – surface microhardness, MPa; Sa – arithmetical mean height of the scale limited surface(this parameter can be
theoretically replaced with Ra – the arithmetic average of the absolute values in the roughness profile, but this parameter is statistically less reliable), µm;
Ra = 2.4 µm
Ra = 2.4 µm
Ra = 2.5 µm
A
B
C

ENGINEERING FOR RURAL DEVELOPMENT Jelgava, 25.-27.05.2016.
689
E – Young’s modulus of the metal, MPa.
KK generally was developed to analyze two metallic surface contact to see whether the contact is elastic or plastic, but in this article the authors investigate opportunity to use this criterion simplified version (see Equation 2) for determining how surface roughness affects its slidability. Opportunity for equation 1 simplification arises because KK consists of two fundamentally different parameter groups:
1. surface physical properties (Hµ, E); 2. surface roughness (RSm, Sa).
If all examined surfaces are made of one material, it is possible to consider material property component as identical constant thus allowing the following equation (1) simplification:
a
SmR
S
RKK = , (2)
where KKR – Criterion of Contact roughness parameter component.
Equation 2 contains only two roughness parameters:
1. Sa – arithmetic mean height of the scale limited surface that describes surface roughness level in the asperity direction (shown as H in Fig. 2);
2. RSm – mean spacing between the profile peaks at the mean line (in the sliding direction) that describes surface asperity width (shown as W in Fig. 2).
RSm/Sa defines thesteepness of the asperity and is related to W/H (see Fig. 2), thus combining the surface roughness texture in the vertical and horizontal direction. A larger ratio represents flatter asperities, thus resulting to smoother surface.
Fig. 2. Roughness asperity slope steepness: H – asperity height (Sa in equation 2); W – asperity width (RSm in equation 2)
Surface preparation of experimental samples
Stainless steel with good corrosion resistance was chosen to maintain the surface characteristics during testing. The steel contained Iron (Fe), Carbon (C), Chromium (Cr), Nickel (Ni), Manganese (Mn), Silicon (Si), Vanadium (V) and Sulfur (S). The samples were prepared as rectangular blocks with dimensions of 35x18x14 mm and a weight of 67 ± 0.5 g.
The samples went through threepreparation stages; the blocks were milled, polished and scratched. An automated polisher–a Mecatech 334 TI 15 – finely ground and polished the blocks to an average surface roughness, Sa, value of ~ 8 nm. For obtaining a scratched surface with parallel scratches, the metal blocks were abradedon different grades of sandpaper (400, 600, 2000 and 3000). A special device was made with rails on both sides to guide the block without rotation during the scratching operation (see Fig. 3). A load of 10 N was placed on the block while traversing the scratch path length L (120 mm) in both a forward and backward direction for a total of 20 times to cover the total distance of 2400 mm.
Fig. 3. Sample scratching principle

ENGINEERING FOR RURAL DEVELOPMENT Jelgava, 25.-27.05.2016.
690
After scratching, the surface roughness was measured for the blocks scratched on 400, 600, 2000 and 3000 grades of sand paper andthe scratch lines were also viewed with a BA310Met optical microscope (Motic, CHN) to verify how parallel and evenly districted the grooves appeared from scratching.
Measurement of surface roughness
A Talysurf Intra 50 profilometer (Taylor Hobson, UK) collected data from the travel of the stylus across the sliding surface to characterize the surface roughness. A total of 10 samples were measured for roughness – scratched with different grit size sandpaper (400, 600, 2000 and 3000) taking account the recommendations in [9-11]. The measurement settings are shown in Table 1, but actual Ra, RSm and Sa parameter average values (calculated from separate measurements for statistically reliable data) can be seen in Table 2, where the effect of roughness on the ease of sliding is shown.
Table 1 Surface roughness measurement settings
Stylus Stylus Arm 112/2009, tip radius 2µm Number of points (Y) 400 Data length (Y) 2 mm Number of points (X) 400 Length of traverse (X) 2 mm Measurement speed 0.5 mm·s-1 Cut-off 0.25 mm
3D roughness measures were determined by the following steps:
1. the surface was levelled and the form error was removed to correct for positioning inaccuracy; 2. waviness and roughness were filtered using the same Gaussian filter with a 0.25 mm cut-off
according to the standard ISO 25178; 3. filtered roughness surface 3D parameters were calculated to determine Sa, SSk, Sds and Sdq; 4. ten separate profiles extracted from 3D surface(perpendicular to the sample sliding direction)
were used to calculate Ra; 5. ten separate surface profiles extracted from 3D surface(in the sample sliding direction) were
extracted to calculate RSm.The profiles were located on top of surface asperities, which likely made contact with ice (see Fig. 4);
6. RSm/Sa was calculated by using equation 2.
Fig. 4. Selected profile scan locations
Measurement of metal slidability
To obtain reproducible sliding conditions for the investigated samples,an inclined plane with smooth ice surface was used. The experiments were conducted in a cold room with the temperature set to -5.5 ºC. The samples were placed on a 16o slope and allowed to slide a distance of 3.3 m to measure the sliding time. The time was measured after passing by optical sensors at the start and end of the track. Repetitive measurements showed that a precision of 0.01s was achieved. The experiment was repeated 80 times for each sample to obtain a representative sliding time. For each surface condition, the experiment was repeated with two or three samples prepared in the same way. For sample

ENGINEERING FOR RURAL DEVELOPMENT Jelgava, 25.-27.05.2016.
691
slidability comparison the sample sliding velocity was used instead of the sample total sliding time (see Table 2).
3. Results and discussion
All metal blocks were milled, polished and scratched on different sandpapers. The change in the surface condition can be seen in Figure 5.
Fig. 5. Experimental sample surface during all preparation steps
The surface roughness measurements show that rougher surfaces (from abrasion on sandpaper with larger grains) are more anisotropic. Waviness appears in the sample scratching direction that is particularly evident after treatment on 400 and 600 sandpaper (see Fig. 6). For example, the metal surface abraded with 400 grit paper shows a slow decline over the first 0.45 mm, and then a rise over the next 0.45mm. A ridge is no longer present along this distance and this could be attributed to a small sideways shift of the ridge, or the removal of the metal that is built up on the side of the scratch. Other studies with a scanning electron microscope support the latter interpretation, where built up metal on the side of the scratch is not always present and could be removed as a result of continued abrasion that removed built up metal and superimposes new scratches on top of the existing scratches.
Mechanistically, this change in waviness can be explained by the removal of larger metal volumes by larger grains. There is an accompanying increase in convexity on the side of the scratches that also produces a more uneven surface perpendicular to the scratching direction. The amplitude in the perpendicular direction seems to be about 0.4 microns, with an occasional jump representing locations where the repeated abrasion by the 30 micron particles on the 400 grade sandpaper may excavated deeper valleys or built up metal may remain on the sides. There could be a correlation between sandpaper grit designation and waviness it creates on the metal surface, but this requires further investigations with an accent on the depth of the groove, the height of the built up metal. Furthermore, one should keep in mind that profilometry with a 2 micron tip does not accurately reproduce the true topography in case where the probe end cannot completely survey the detailed vertical oscillations that occur over horizontal distance of less than 1 micron, but for cases when relatively large surfaces need to be scanned (as in the case of sample roughness influence on slidability investigations) profilometry is still the most relevant method.
An increase in surface anisotropy is also observed with the 3D roughness parameter Str – ratio of texture aspect. The value can lie in the interval from 0 to 1. A value closer to 0represents a more anisotropic surface. The parameter Str varied from Str = 0.009 for metal abraded on 400 grade sandpaper to Str = 0.4 for metal abraded on 3000 grade sandpaper. An anisotropic surface meant that the mean spacing between the profile peaks at the mean line RSm was measured in the scratch direction, Fig. 4.
The use of surface roughness Sa seems to be more reliable than the roughness of one profile, Ra. Surfaces scratched with 3000 and 2000 sandpaper were similar and displayed a roughness of Sa ≈ 0.014µm and 0.023µm, respectively. An intermediate roughness from 600 sandpaper provided a 5 time greater roughness (Sa ≈ 0.08µm), but 400 sandpaper showed the greatest roughness Sa ≈ 0.185µm (see Table 2). Roughness Ra when averaged from 10 evenly distributed profiles approached the Sa values. Since Sa is easily determined, and it represents the entire surface, then Sa is recommended as the measure of roughness.
Table 2 also contains information onthe average sliding velocity,v, of metal blocks with a different surface roughness. The sliding velocity is calculated by dividing the separation distance between the sensors (3.3 m) by the time necessary for the sampletoslide this distance. It is important to

ENGINEERING FOR RURAL DEVELOPMENT Jelgava, 25.-27.05.2016.
692
inform that the sample velocity value shown in Table 2 is an average value out of 3 different experiment day measurements and each day experiments consist of 80 individual slidability measurements for each sample, thus meaning that 240 slidability measurements were done for each sample.
Fig. 6. Sample surface after treatment with different sandpapers: S – 3D surface roughness image;
ǁ – profile parallel to treatment direction; ┴ – profile perpendicular to treatment direction
To evaluate the relationship between different roughness measures on the ease of sliding, a graph was constructed to learn about the most informative roughness parameter. Graphs of sliding velocity versus Sa and Ra were constructed in Figure 7, but sliding velocity versus RSm/Ra and RSm/Sa in Figure 8. Less useful roughness measures were discussed.
The simplest search for a correlation between roughness and the sliding velocity starts by plotting the sliding speed versus the roughness parameter, Ra and Sa. The roughness parameter Ra in this case is taken perpendicular to the sample scratching direction as recommended in the ISO 2D roughness standard 4287. Furthermore, the measure of Ra is taken from the 3D profile, and this reduces the variability that would otherwise arise from a line profile. There appears to be a very loose correlation between the roughness and the sliding speed, Fig. 7. The scatter in results is very large.
ENGINEERING FOR RURAL DEVELOPMENT Jelgava, 25.-27.05.2016.
693
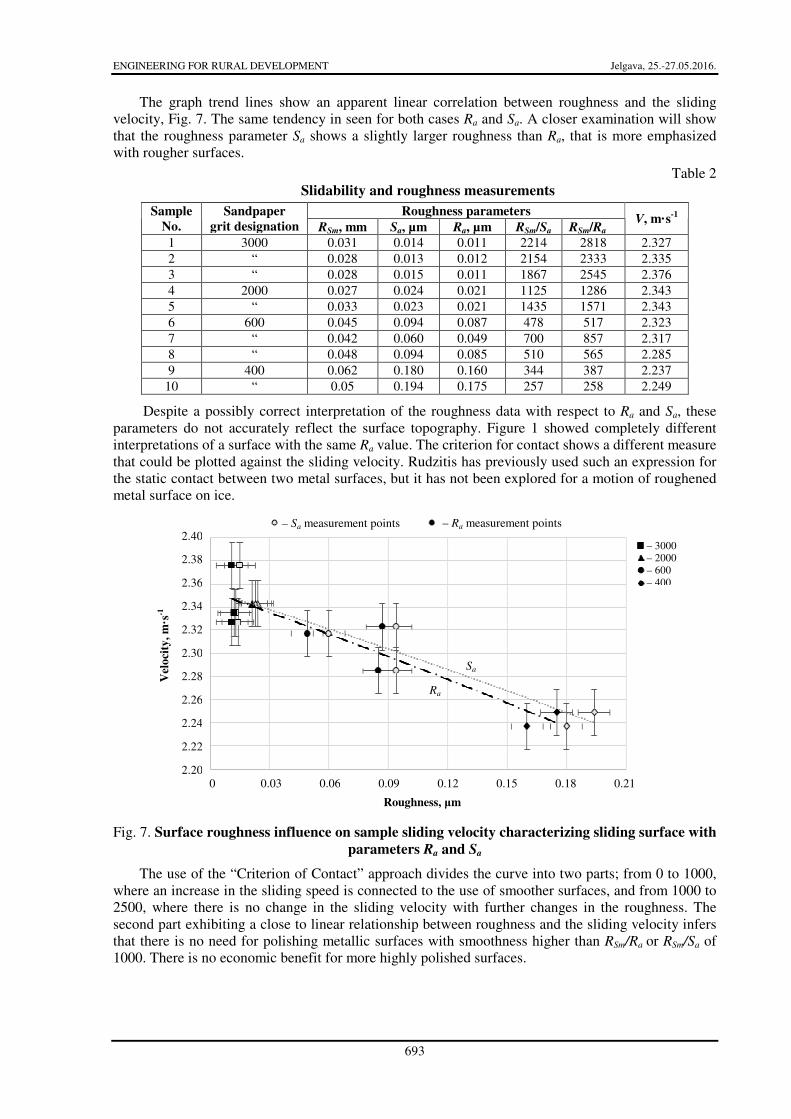
The graph trend lines show an apparent linear correlation between roughness and the sliding velocity, Fig. 7. The same tendency in seen for both cases Ra and Sa. A closer examination will show that the roughness parameter Sa shows a slightly larger roughness than Ra, that is more emphasized with rougher surfaces.
Table 2 Slidability and roughness measurements
Roughness parameters Sample
No.
Sandpaper
grit designation RSm, mm Sa, µm Ra, µm RSm/Sa RSm/Ra V, m·s
-1
1 3000 0.031 0.014 0.011 2214 2818 2.327 2 “ 0.028 0.013 0.012 2154 2333 2.335 3 “ 0.028 0.015 0.011 1867 2545 2.376 4 2000 0.027 0.024 0.021 1125 1286 2.343 5 “ 0.033 0.023 0.021 1435 1571 2.343 6 600 0.045 0.094 0.087 478 517 2.323 7 “ 0.042 0.060 0.049 700 857 2.317 8 “ 0.048 0.094 0.085 510 565 2.285 9 400 0.062 0.180 0.160 344 387 2.237
10 “ 0.05 0.194 0.175 257 258 2.249
Despite a possibly correct interpretation of the roughness data with respect to Ra and Sa, these parameters do not accurately reflect the surface topography. Figure 1 showed completely different interpretations of a surface with the same Ra value. The criterion for contact shows a different measure that could be plotted against the sliding velocity. Rudzitis has previously used such an expression for the static contact between two metal surfaces, but it has not been explored for a motion of roughened metal surface on ice.
Fig. 7. Surface roughness influence on sample sliding velocity characterizing sliding surface with
parameters Ra and Sa
The use of the “Criterion of Contact” approach divides the curve into two parts; from 0 to 1000, where an increase in the sliding speed is connected to the use of smoother surfaces, and from 1000 to 2500, where there is no change in the sliding velocity with further changes in the roughness. The second part exhibiting a close to linear relationship between roughness and the sliding velocity infers that there is no need for polishing metallic surfaces with smoothness higher than RSm/Ra or RSm/Sa of 1000. There is no economic benefit for more highly polished surfaces.
– Sa measurement points – Ra measurement points
– 3000 – 2000 – 600 – 400
Roughness, µm
Vel
oci
ty,
m·s
-1
Sa
Ra
2.40
2.38
2.36
2.34
2.32
2.30
2.28
2.26
2.24
2.22
2.200 0.03 0.06 0.09 0.12 0.15 0.18 0.21

ENGINEERING FOR RURAL DEVELOPMENT Jelgava, 25.-27.05.2016.
694
Fig. 8. Surface roughness influence on sample sliding velocity characterizing sliding surface with
parameter RSm and Ra or Sa ratio (using Criterion of Contact)
Both RSm/Ra or RSm/Sa show similar trendlines suggesting no need for RSm/Sa, where a more time-consuming 3D measurement is necessary. Due to the inability to acquire Rsm parallel to the scratching direction on the top of a ridge in a 2D profile measurement, it is necessary to conduct a 3D measurement. 2D measurements cannot find the ridges and cannot ensure the profile along the ridge. This can be done precisely in a 3D measurement, where the location for determining the roughness can be chosen. Sliding surface characterization thus requires the use of a 3D profilometer.
Further work will investigate the linear region in more detail and determine the location of the turning point in Figure 8. It is possible that a larger surface adhesion results on smoother surfaces will play a larger role on the ease of sliding. These experiments could be conducted with larger loads to verify if the same tendency holds.
The correlation between the roughness parameters SSk, Sds and Sdq and the sliding velocity was also investigated. It was observed that the roughness parameter Sdq shows the same trend as the parameter Sa – this parameter is obtained from the same data from which Sa is calculated. The parameters SSk, Sds do not show any correlation at all. Despite the ability to extract Sdq from the roughness data, it has no practical usefulness, since surfaces cannot be made or controlled to satisfy a given Sdq value.
Conclusions
1. The Criterion of Contact (with roughness measures in the vertical and the sliding direction) is a better indicator of the surface roughness than Ra or Sa, for controlling the sliding velocity;
2. The roughness parameters Sdq and Sa show the same curve with the sliding speed, but there is no practical use for Sdq since surfaces cannot be made according to this surface roughness measure;
3. The parameters SSk, Sds do not show an useful correlation with the sliding velocity; 4. There is no need for polishing metallic surfaces with higher smoothness than RSm/Sa of 1000, as
shown by the horizontal linear region for values greater than 1000.
Acknowledgement
JL and EJ acknowledge the discussions with Janis Rudzitis on the use of the Criterion of Contact, according to the previous studies. This paper was prepared by EJ, JL and KAG.Project “IMATEH: InnovativeMaterialsandSmartTechnologiesforEnvironmental Safety” from the Latvian State Research Programme funded the research for reducing friction of metal surfaces against smooth surfaces.
References
1. Makkonen L., Tikanmaki M. Modeling the friction of ice. Cold Regions Science and Technology 102, 2014, pp. 84-93.
– RSm/Sa – RSm/Ra
– 3000 – 2000 – 600 – 400
Vel
oci
ty,
m·s
-1
2.40
2.38
2.36
2.34
2.32
2.30
2.28
2.26
2.24
2.22
2.20
RSm/Sa
RSm/Ra
Roughness, µm
0 500 1000 1500 2000 2500 3000

ENGINEERING FOR RURAL DEVELOPMENT Jelgava, 25.-27.05.2016.
695
2. Liang H., Martin J.M., Mogne T.L. Experimental investigation of friction on low-temperature ice. Acta Mater. 51, 2003, pp. 2639-2646.
3. Kietzig A.M., Hatzikiriakos S.G., Englezos P. Ice friction: The effects of surface roughness, structure, and hydrophobicity. Journal of Applied Physics 106 (2009) 024303.
4. Bowden F.P., Hughes T.P. The mechanism of sliding on ice and snow. Proc. Roy. Soc. A, 172, 1939, pp. 280-298.
5. Koinar VN., Brushan B., Effect of scan size and surface roughness on microscale friction measurements. Journal of Applied Physics 81, 1997, pp. 2472-2479.
6. Manning D.P., Jones C., Rowland F.J., Roff M. The surface roughness of rubber soling material determines the coefficient of friction on water-lubricated surfaces. Journal of Safety Research 29, 1998, pp. 275-83.
7. Penny A., Lozowski E., Forest T et al. Physics and chemistry of ice. Royal Society of Chemistry, 2009, pp. 495-504.
8. Lungevics J., Kumermanis M., Rudzitis J., Linins O., Avisane A., Boiko I., Lipenitis J. Equipment For Measuring Static Coefficient of Friction and Surface Slip Properties. (2013) Patent No LV 14795 B.
9. Geometrical product specifications (GPS) - Surface texture: Areal - Part 2: Terms, definitions and surface texture parameters (ISO 25178-2:2012).
10. Rudzitis J., Oditis I., Konrads G., Torims T. 3D roughness effects on tribology of sliding surfaces. Proceedings of 10th International Conference "Metrology and Properties of Engineering Surfaces", France, Saint Étienne, 4-7 July, 2005. Saint-Étienne, 2005, pp. 110-112.
11. Ohlson R., Goran B., Westberg J. The interrelationship of 3D surface characterization techniques with standardized 2D techniques. Advanced Techniques for Assessment Surface Topography. ISBN 1903996112, 2003, pp. 197-220.