Embed Size (px)
Citation preview
Re
se
arc
h A
rtic
le
AIMS Materials Science, 6(5): 713–729.
DOI: 10.3934/matersci.2019.5.713
Received: 21 May 2019
Accepted: 16 July 2019
Published: 09 August 2019
http://www.aimspress.com/journal/Materials
Research article
Surface modification of Ti6Al4V alloy for implants by anodization and
electrodeposition
Jie Sun1, Tzvetanka Boiadjieva-Scherzer
1,*,
Hermann Kronberger
2, Kevin Staats
3, Johannes
Holinka3 and Reinhard Windhager
3
1 Centre of Electrochemical Surface Technology GmbH (CEST), Austria
2 Technical University of Vienna, Institute of Chemical Technologies and Analytics, Austria
3 Medical University of Vienna, Department of Orthopedics and Trauma Surgery, Austria
* Correspondence: Email: [email protected].
Abstract: Ti6Al4V alloy and Ti were subjected to anodization, aiming at a defined nano-topography
as a basis for further surface modifications focused on enhancement of the antibacterial properties
and biocompatibility of the material for implants. The anodization parameters (voltage and time), the
electrolyte composition and acidity were varied in order to grow uniform phosphate-doped nano-
tube-shaped structures with a diameter of 100 nm. Subsequently, Se and Se alloys (Ag2Se and Cu2Se)
were uniformly incorporated into the titania nanotubes by pulse electrodeposition. Se-doped
hydroxyapatite top coating was formed by precipitation. The electrochemical respond of modified Ti-
based substrates and the electrodeposition process of Se and Se alloys were studied by cyclic
voltammetry. Electrochemically and chemically treated surfaces were characterized by EDX, SEM,
FIB, Raman spectroscopy and XRD. In vitro experiments with bacteria Staphylococcus epidermidis
were conducted to evaluate the ability of the modified surfaces to prevent biofilm formation. Most
promising results were obtained with Se–pTNT and Cu2Se–pTNT.
Keywords: titania nanotube; selenium; copper selenide; silver selenide; hydroxyapatite
1. Introduction
Titanium metal and its alloys are the second most extensively used materials for fabricating
implants in the biomedical sector after stainless steel [1]. Their suitability for the application arises
from their favorable tensile strength, flexibility, corrosion resistance, high hemo- and
714
AIMS Materials Science Volume 6, Issue 5, 713–729.
biocompatibility properties [2]. Despite their wide use, titanium-based implant materials suffer from
the drawback of susceptibility to bacteria-induced inflammation, which causes loosening of the
implants and other complications [3]. Antibiotic treatment of the inflammations is increasingly
becoming ineffective due to development of drug resistant bacterial strains [4].
An alternative to antibiotics is the creation of a defined nano-topography on the surface of the
implant materials, which inhibits adherence of bacterial cells to them. One of the methods used for
surface nano-structuring of Ti-based materials is anodization in fluoride containing electrolytes,
resulting in formation of nanotubes [5–9]. It has been shown that the presence of nanotubes of 100 nm
diameter promotes osseointegration and antibacterial efficiency even without the use of
pharmaceuticals [6,10,11]. In order to enhance the antibacterial properties, the nanotubes can be
loaded with antibacterial agents like Ag [12], Cu [9], Se [13,14] and zinc selenide [15]. Se in
particular exhibits osteogenic and antimicrobial activity, while suppressing inflammations. Studies
with Se nanoparticles produced from precipitation indicate decrease in the function of adhesion-
mediating proteins, inducing the production of damaging reactive oxygen species and inhibition of
the proliferation of macrophages [14]. Se compounds like copper selenide [7] and silver selenide are
attractive for implant surface modification due to low solubility, making it suited for low long-term
release of antibacterial agents.
The biocompatibility and bioactivity of the implant material can be improved by an additional
coating of a bone like substance of hydroxyapatite (HAp), a hydroxyl containing form of calcium
phosphate, which promotes bone formation and growth [16]. Crystalline HAp provides mechanical
stability, but has been shown to degrade slowly in simulated body fluid leading to insufficient bone
ingrowth [17]. Amorphous HAp has a slightly higher solubility, which promotes faster initial bone
fixation due to resorption and bioactivity [18].
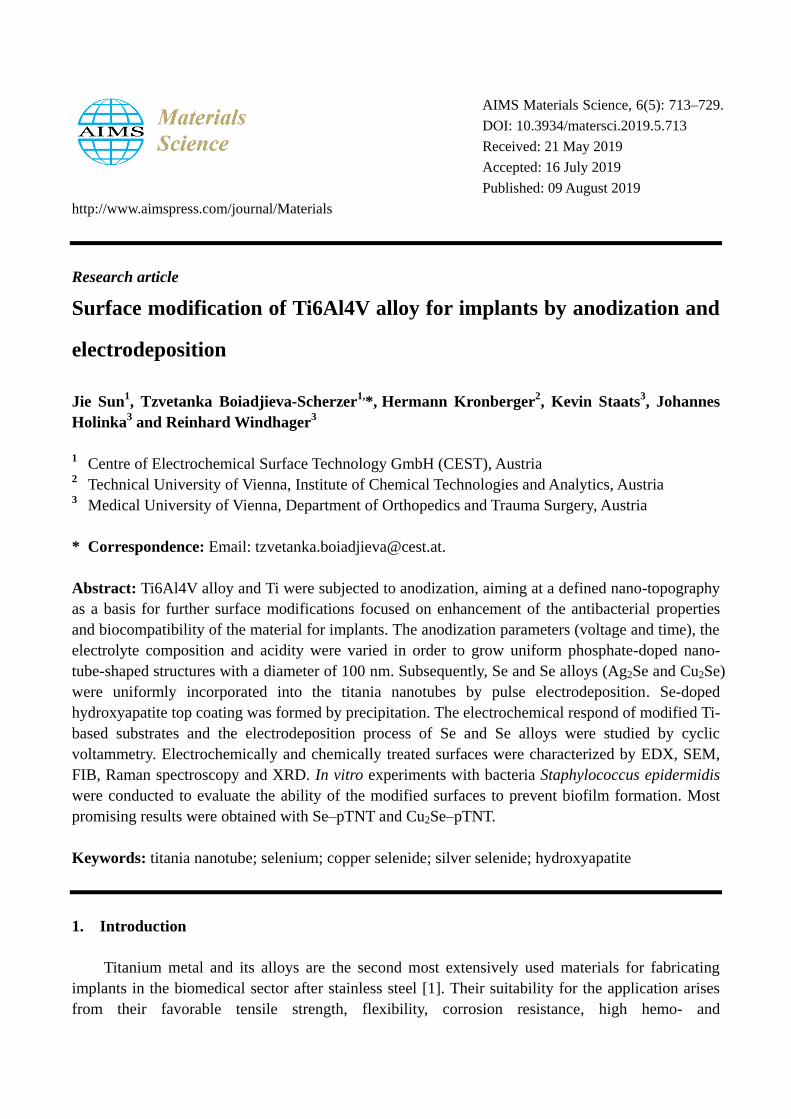
In the present work, the three described approaches (Figure 1) for surface modification were
combined to produce bacteria-resistant titanium-based implants for medical testing. The electrolyte
composition and anodization parameters were varied in order to obtain nano-tube-shaped structures
with a diameter of 100 nm on the surface of pure Ti and Ti6Al4V alloy substrates. The nanotubes
were grown to contain phosphate for the promotion of osseointegration [19] and to be subsequently
filled with antibacterial agents. Electrodeposition processes were used to deposit Se and Se alloys
(Ag2Se and Cu2Se/Cu3Se2) on the nano-structured surfaces and monitored through CVA and constant
voltage polarization techniques.
Figure 1. Schematic illustration of the three different strategies.
715
AIMS Materials Science Volume 6, Issue 5, 713–729.
Electrochemically and chemically treated surfaces were characterized by EDX, SEM, FIB,
RAMAN spectroscopy and XRD.
2. Materials and method
2.1. Nano-structuring of Ti and Ti6Al4V
Ti samples of 99.6% purity (Good Fellow, 10 mm × 5 mm, 2 mm thickness) and Ti6Al4V discs
(10 mm diameter, 2 mm thickness) were grinded, polished, degreased with acetone and ethanol, and
cathodically activated in 1 M H2SO4 for 10 min before anodization. For nanopattering, the
anodization was performed in a two-electrode configuration with the specimen as anode positioned
in 2 cm distance from the Pt foil (10 mm × 15 mm), which served as counter electrode. Ti and
Ti6Al4V samples were anodically polarized in a fluoride containing solution at constant potentials.
Experiments were performed with pure Ti in order to gain a better understanding of the
material’s behavior during anodization without the interferences by alloying elements. The
parameters were then applied on the alloy Ti6Al4V, which is one of the most common implant
materials. Ti6Al4V behaves different during the anodization due to the presence of alpha (stabilized
by Al) and beta phases (stabilized by V). During the anodization β-Ti grains are dissolved to a larger
extend than those containing Al, resulting in gaps in the layer. This occurs because vanadium does
not form oxides resistant to corrosion under these conditions. The reduction of available vanadium at
the surface is a convenient side effect minimizing possible health risks from vanadium.
Aqueous phosphate and ethylene glycol-based electrolytes containing 0.12 M NH4F were
investigated in order to select the better suited for the substrate structuring (formation of uniform
phosphate-doped nano-tubes with a diameter of 100 nm). Overview on the experiments is presented
in Table 1.
Table 1. Experiment table.
Surface modifications Constant parameters Varied parameters
Nanostructuring in an
aqueous electrolyte
Ti/Ti6Al4V, 20 V 2 pH 3.3 pH 4.7 pH
Ti/Ti6Al4V, pH 2 10 V 20 V 30 V
Nanostructuring in an
ethylene based
electrolyte
Ti/Ti6Al4V, 30 V 2 vol% 10 vol% 20 vol%
Ti/Ti6Al4V, 10 vol%
H2O
20 V 30 V 40 V
Nanostructuring in an
organic electrolyte
with phosphate
additive
Ti/Ti6Al4V, EG +
10 vol% H2O, 30 V
10 mM 15 mM
Ti/Ti6Al4V, EG +
20 vol% H2O, 30 V
10 mM 15 mM
Electrodeposition of
Se related coating
nanostructured
Ti/Ti6Al4V substrate
Se Ag2Se Cu2Se
Influence of
substrate’s surface on
the hydroxyapatite
(HAp) deposition
50 ℃ Polished Ti Unannealed pTNT from
aqueous electrolyte (pH
2, 20 V)
Se–HAp on unannealed
pTNT from ethylene glycol
based electrolyte (EG,
10 vol% H2O, 10 mM
phosphate, 30 V)
60 ℃ annealed pTNT from
ethylene glycol
electrolyte (EG,
10 vol% H2O, 10 mM
phosphate, 30 V)
Se-HAp on annealed
pTNT from ethylene
glycol (EG, 10 vol%
H2O, 10 mM phosphate,
30 V)

716
AIMS Materials Science Volume 6, Issue 5, 713–729.
The first samples series was anodized in an aqueous phosphate electrolyte containing 0.5 M
phosphate, as either H3PO4 and/or (NH4)NaH(PO4)·4H2O, pH value 2, 3.3 and 4.7 with voltages 10
V, 20 V and 30 V for 45 min. The second series was obtained by anodization for 1.5 h at voltages 20
V, 30 V and 40 V in an ethylene glycol based electrolyte containing 2 vol%, 10 vol% or 20 vol%
deionized H2O with/without 10 mM or 15 mM (NH4)NaH(PO4)·4H2O. The as-prepared samples
were cleaned by one-minute ultrasonication in ethylene glycol and subsequently annealed in air
(450 °C, 2 h) to transform TiO2 phase(s) into anatase. The electrodes were characterized using SEM,
EDX, FIB, RAMAN spectroscopy and XRD.
2.2. Coatings
Electrochemical studies were carried out in a three-electrode configuration with the phosphate-
doped titania nanotube (pTNT) substrate as working electrode (area of exposure of 0.79 cm2), Pt foil
as counter electrode (1.5 cm2) and a Ag/AgCI (E
0 = 197 mVSHE) reference electrode (RE). The
distance between working and counter electrode was 2 cm. The cyclic voltammetry measurements
have been carried out with a potential advance speed of 10 mV/s. The following coating/filling
experiments were carried out with annealed samples obtained by 1.5 h anodization in ethylene glycol
containing 10 vol% double distilled water, 0.12 M NH4F and 10 mM (NH4)NaH(PO4)·4H2O.
Selenium was deposited by applying cathodic pulses of −0.4 V vs. RE (1000 pulses, 1 pulse/s, 1 s
down time) in an electrolyte containing 2.5 mM Na2SeO3, pH 2, adjusted with nitric acid. Silver
selenide was deposited from an aqueous solution containing 0.5 M NaSCN, 5 mM AgNO3 and
2.5 mM Na2SeO3, pH 2 by applying pulses of −0.5 V (500 pulses, 1 pulse/s, 1 s down time). Copper
selenide was deposited from an aqueous solution containing 0.5 M Cu(CO2CH3)2·H2O and 2.5 mM
Na2SeO3, pH 1 by applying pulses of −0.5 V (500 pulses, 1 pulse/s, 1 s down time).
HAp was formed by electrochemically assisted precipitation from an electrolyte containing
2.5 mM Ca(NO3)2·4H2O and 1.5 mM (NH4)NaH(PO4)·4H2O with and without addition of 2.5 mM
Na2SeO3, at bath temperatures of 50 °C and 60 °C. The pH value of 3 was adjusted with nitric acid
and ammonia. Cathodic polarization was carried out at −5 V for 15 min in a two-electrode
configuration to rapidly increase pH at the sample surface and to trigger precipitation of
hydroxyapatite. The specimens were cleaned with deionized water and dried with pure ethanol for
surface analysis (SEM, XRD).
2.3. Preliminary in vitro experiments
Preliminary in vitro experiments were performed with bacteria Staphylococcus epidermidis,
which colonize the human skin and mucus membranes. Even though its pathogenic potential is
relatively low in human hosts, it is one of the main causes of infections in medical implants [20].
This bacteria stem is the most frequent cause of nosocomial infections due to its resistance against
penicillin and methicillin. Staphylococcus epidermidis ensures its survival by maintaining a balance
of commensalism and low virulence instead of aggressively attacking the host. The interaction of
biofilm formation and highly different subpopulations causing heterogenic gene expression
complicates and dampers possible counter measures [21]. Infections at the biomaterial to bone
interface are often involving Staphylococcus epidermidis [22] and medical treatment is further
impeded by its growing resistance against vancomycin, an alternative antibiotic against multi drug
717
AIMS Materials Science Volume 6, Issue 5, 713–729.
resistant Staphylococcus [23]. Hence, alternatives to antibiotics have been tested on their ability to
inhibit biofilm formation by Staphylococcus epidermidis in this work.
In the present studies, the biofilm was formed by overnight cultures of the bacterial isolates
grown on Columbia agar plates. Bacteria suspension was adjusted to a McFarland 0.5 (average
density of 1 × 10⁶ cells/µL) in 0.9% NaCl solution and diluted to 1:100 in Mueller–Hinton broth. In
each well of a 24-well cell culture plate was 1 mL of bacteria dilution filled and one modified Ti-
discs placed. The bacteria were incubated for 24 hours at 35 °C in ambient air. After incubation,
discs were gently washed in PBS (3 mL, three times), followed by rinsing with methanol (95%) for
10 min to immobilize the bacteria cells and a final washing step with distilled water.
3. Results and discussion
3.1. Titania nanotubes
3.1.1. Aqueous phosphate electrolytes
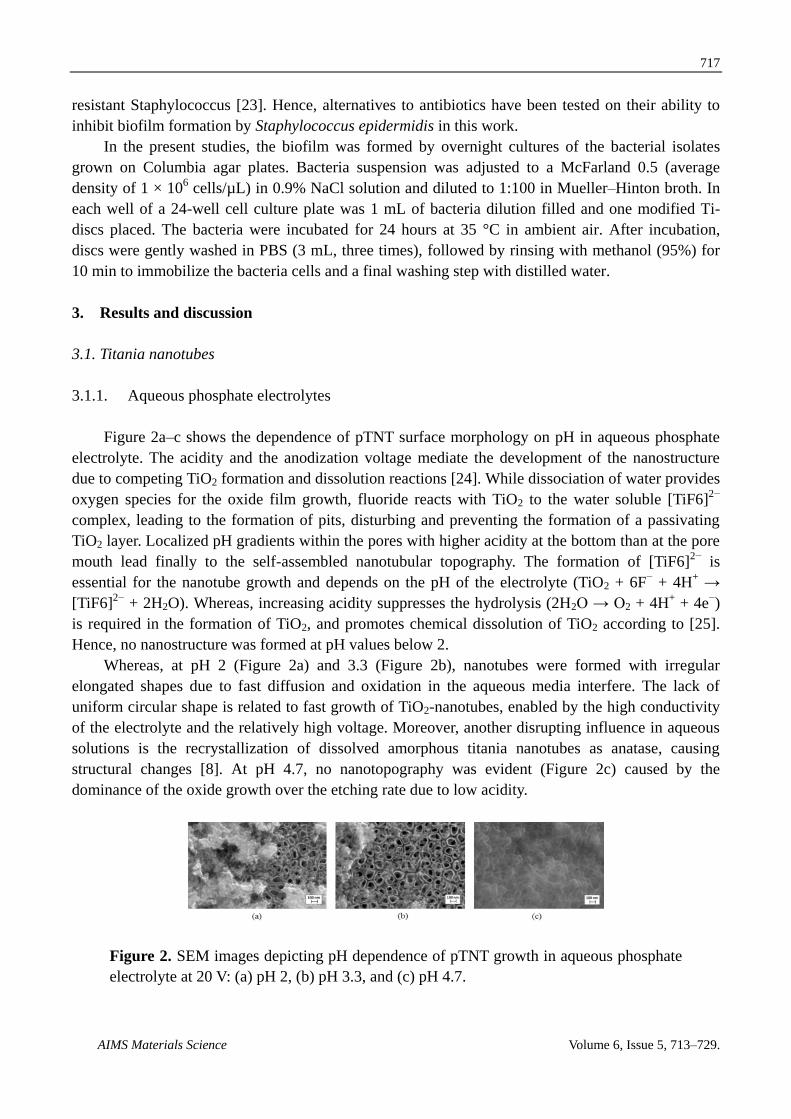
Figure 2a–c shows the dependence of pTNT surface morphology on pH in aqueous phosphate
electrolyte. The acidity and the anodization voltage mediate the development of the nanostructure
due to competing TiO2 formation and dissolution reactions [24]. While dissociation of water provides
oxygen species for the oxide film growth, fluoride reacts with TiO2 to the water soluble [TiF6]2−
complex, leading to the formation of pits, disturbing and preventing the formation of a passivating
TiO2 layer. Localized pH gradients within the pores with higher acidity at the bottom than at the pore
mouth lead finally to the self-assembled nanotubular topography. The formation of [TiF6]2−
is
essential for the nanotube growth and depends on the pH of the electrolyte (TiO2 + 6F− + 4H
+ →
[TiF6]2−
+ 2H2O). Whereas, increasing acidity suppresses the hydrolysis (2H2O → O2 + 4H+ + 4e
−)
is required in the formation of TiO2, and promotes chemical dissolution of TiO2 according to [25].
Hence, no nanostructure was formed at pH values below 2.
Whereas, at pH 2 (Figure 2a) and 3.3 (Figure 2b), nanotubes were formed with irregular
elongated shapes due to fast diffusion and oxidation in the aqueous media interfere. The lack of
uniform circular shape is related to fast growth of TiO2-nanotubes, enabled by the high conductivity
of the electrolyte and the relatively high voltage. Moreover, another disrupting influence in aqueous
solutions is the recrystallization of dissolved amorphous titania nanotubes as anatase, causing
structural changes [8]. At pH 4.7, no nanotopography was evident (Figure 2c) caused by the
dominance of the oxide growth over the etching rate due to low acidity.
Figure 2. SEM images depicting pH dependence of pTNT growth in aqueous phosphate
electrolyte at 20 V: (a) pH 2, (b) pH 3.3, and (c) pH 4.7.
718
AIMS Materials Science Volume 6, Issue 5, 713–729.
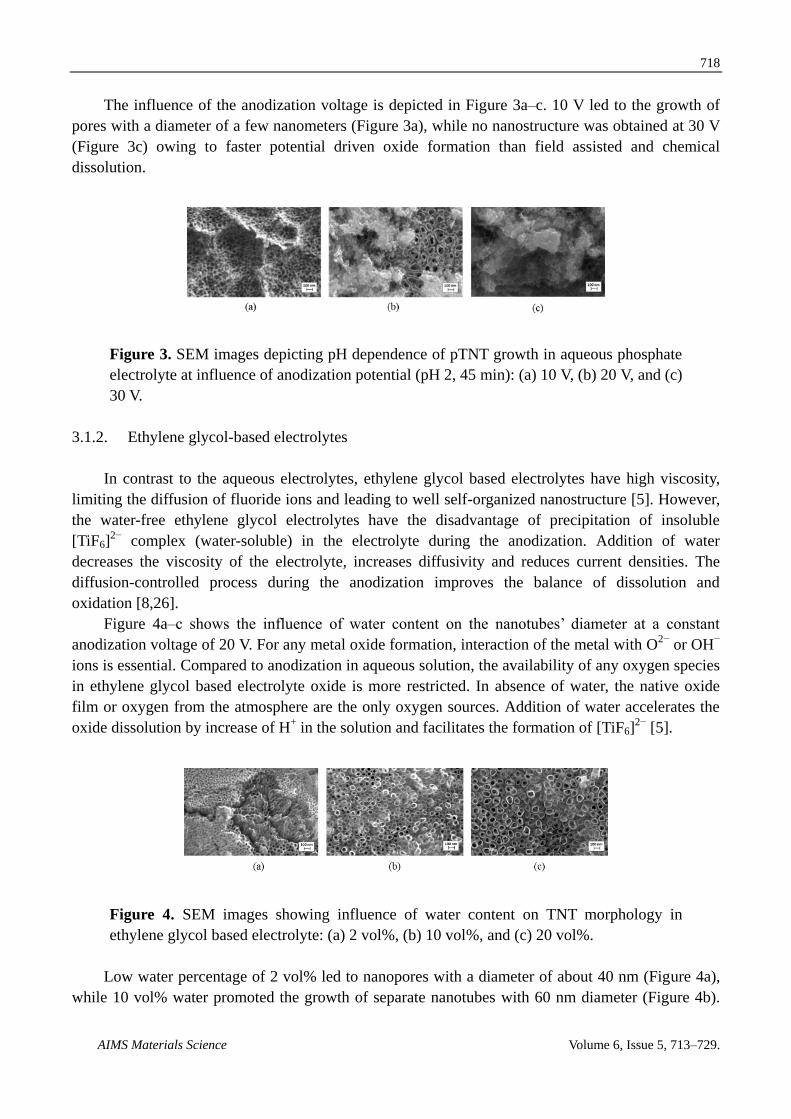
The influence of the anodization voltage is depicted in Figure 3a–c. 10 V led to the growth of
pores with a diameter of a few nanometers (Figure 3a), while no nanostructure was obtained at 30 V
(Figure 3c) owing to faster potential driven oxide formation than field assisted and chemical
dissolution.
Figure 3. SEM images depicting pH dependence of pTNT growth in aqueous phosphate
electrolyte at influence of anodization potential (pH 2, 45 min): (a) 10 V, (b) 20 V, and (c)
30 V.
3.1.2. Ethylene glycol-based electrolytes
In contrast to the aqueous electrolytes, ethylene glycol based electrolytes have high viscosity,
limiting the diffusion of fluoride ions and leading to well self-organized nanostructure [5]. However,
the water-free ethylene glycol electrolytes have the disadvantage of precipitation of insoluble
[TiF6]2−
complex (water-soluble) in the electrolyte during the anodization. Addition of water
decreases the viscosity of the electrolyte, increases diffusivity and reduces current densities. The
diffusion-controlled process during the anodization improves the balance of dissolution and
oxidation [8,26].
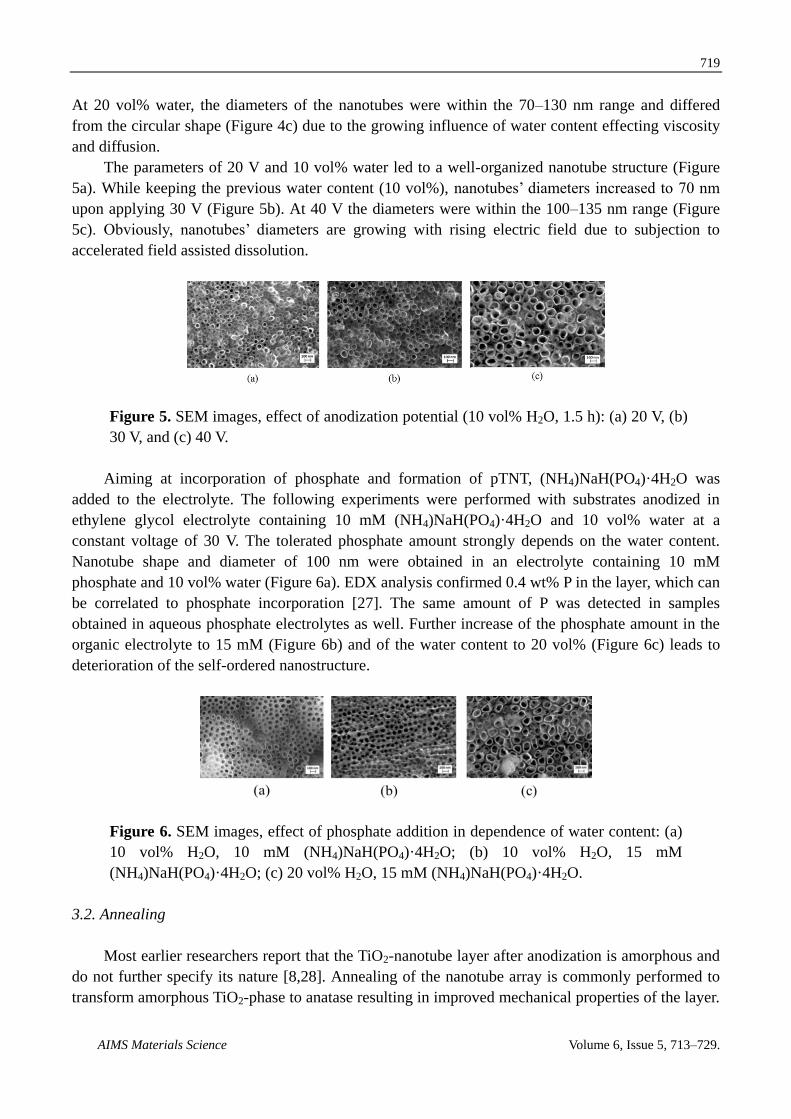
Figure 4a–c shows the influence of water content on the nanotubes’ diameter at a constant
anodization voltage of 20 V. For any metal oxide formation, interaction of the metal with O2−
or OH−
ions is essential. Compared to anodization in aqueous solution, the availability of any oxygen species
in ethylene glycol based electrolyte oxide is more restricted. In absence of water, the native oxide
film or oxygen from the atmosphere are the only oxygen sources. Addition of water accelerates the
oxide dissolution by increase of H+ in the solution and facilitates the formation of [TiF6]
2− [5].
Figure 4. SEM images showing influence of water content on TNT morphology in
ethylene glycol based electrolyte: (a) 2 vol%, (b) 10 vol%, and (c) 20 vol%.
Low water percentage of 2 vol% led to nanopores with a diameter of about 40 nm (Figure 4a),
while 10 vol% water promoted the growth of separate nanotubes with 60 nm diameter (Figure 4b).
719
AIMS Materials Science Volume 6, Issue 5, 713–729.
At 20 vol% water, the diameters of the nanotubes were within the 70–130 nm range and differed
from the circular shape (Figure 4c) due to the growing influence of water content effecting viscosity
and diffusion.
The parameters of 20 V and 10 vol% water led to a well-organized nanotube structure (Figure
5a). While keeping the previous water content (10 vol%), nanotubes’ diameters increased to 70 nm
upon applying 30 V (Figure 5b). At 40 V the diameters were within the 100–135 nm range (Figure
5c). Obviously, nanotubes’ diameters are growing with rising electric field due to subjection to
accelerated field assisted dissolution.
Figure 5. SEM images, effect of anodization potential (10 vol% H2O, 1.5 h): (a) 20 V, (b)
30 V, and (c) 40 V.
Aiming at incorporation of phosphate and formation of pTNT, (NH4)NaH(PO4)·4H2O was
added to the electrolyte. The following experiments were performed with substrates anodized in
ethylene glycol electrolyte containing 10 mM (NH4)NaH(PO4)·4H2O and 10 vol% water at a
constant voltage of 30 V. The tolerated phosphate amount strongly depends on the water content.
Nanotube shape and diameter of 100 nm were obtained in an electrolyte containing 10 mM
phosphate and 10 vol% water (Figure 6a). EDX analysis confirmed 0.4 wt% P in the layer, which can
be correlated to phosphate incorporation [27]. The same amount of P was detected in samples
obtained in aqueous phosphate electrolytes as well. Further increase of the phosphate amount in the
organic electrolyte to 15 mM (Figure 6b) and of the water content to 20 vol% (Figure 6c) leads to
deterioration of the self-ordered nanostructure.
Figure 6. SEM images, effect of phosphate addition in dependence of water content: (a)
10 vol% H2O, 10 mM (NH4)NaH(PO4)·4H2O; (b) 10 vol% H2O, 15 mM
(NH4)NaH(PO4)·4H2O; (c) 20 vol% H2O, 15 mM (NH4)NaH(PO4)·4H2O.
3.2. Annealing
Most earlier researchers report that the TiO2-nanotube layer after anodization is amorphous and
do not further specify its nature [8,28]. Annealing of the nanotube array is commonly performed to
transform amorphous TiO2-phase to anatase resulting in improved mechanical properties of the layer.

720
AIMS Materials Science Volume 6, Issue 5, 713–729.
Furthermore, the TiO2-anatase accelerates the nucleation of apatite due to lower ζ-potential compared
to TiO2-rutile [29].
XRD measurements were insufficient to identify the TiO2 species due to detection limit and
amorphous phase. Hence, Raman spectroscopy was utilized. The bands of both anatase and rutile
phase modifications for samples before heat treatment were identified, although the Raman pattern
was affected by noise due to the nanostructure, defected lattice and fluorescence (Figure 7a).
Therefore, the spectrum was smoothened using the software Peakfit 4.12 s with a fitting correlation
factor r2 of 97.66%. The main anatase peak at 144 cm
−1 shifted to 156 cm
−1 caused by amorphous
portion and oxygen deficiency. Annealing led to a blueshift of 12 cm−1
overlapping with the anatase
reference peak at 144 cm−1
due to crystallization of anatase and oxygen uptake from air. The wide
broadening of the anatase peak at 198 cm−1
was caused by the overlap with the rutile band at 234 cm−1
.
The wave band at 420 cm−1
resulted from the overlap of the characteristic anatase band at 394 cm−1
and the rutile peak at 446 cm−1
. Whereas, the Raman peak at 514 cm−1
showed unambiguously
anatase and the wave band at 609 cm−1
could be assigned to rutile.
According to Su et al.’s XRD study, the anatase portion of anodic TiO2 films increases with
water content, NH4F concentration and applied voltage, but no anatase was detected at 30 V [30]. In
the current work, Raman spectroscopy revealed that samples, anodized at 30 V in this specific
electrolyte composition, contain a mixture of anatase and rutile. The observation confirms the
fluoride induced rutile formation found by Kunze et al. who anodized Ti in aqueous phosphorous
electrolyte, which comprised no anatase but only amorphous and rutile phase [31]. The presence and
ratio of anatase to rutile appears to be dependent on multiple anodization parameters including
electrolyte composition and applied voltage. In order to fully understand the conditions and
mechanism of the phase formations further experiments need to be conducted.
Subsequent annealing in air (450 °C, 2 h) apparently transformed rutile to anatase phase (Figure
7b). Selective vertical growth of the TiO2-nanotubes (indicated by SEM observations) was related to
compensation of oxygen deficiency through oxygen consumption from the atmosphere and
dehydration of titaniumhydroxide.
100 200 300 400 500 600 700
peakfitting
609 c
m-1
446 c
m-1
234 c
m-1
637 c
m-1
514 c
m-1
394 c
m-1
198 c
m-1
TiO2-Anatase reference
TiO2-Rutile reference
(b) annealed TNTInte
nsity (
a.u
.)
Raman Shift (cm-1)
(a) unannealed TNT
144 c
m-1
data
fitted curve
Figure 7. Raman spectroscopy of TNT before (a) and after (b) annealing in air at 450 °C,
including reference data [32].

721
AIMS Materials Science Volume 6, Issue 5, 713–729.
3.3. Voltammetric studies and deposition of coatings
3.3.1. Selenium
Figure 8 presents voltamogramms for pTNT, Se and Ag2Se deposition. After immersion of the
Ti electrode in nitric acid solution at pH 2 (blank electrolyte), the surface is in passive state. Cathodic
reduction of Ti4+
to Ti3+
, according to the Eq 1:
TiOH3+
+ H+ + e
− → Ti
3+ + H2O (1)
takes place at a potential of about −0.252 V [33]. A very low current is seen at re-scaling of the
voltammogram (not shown). It could be suggested that the reduction process occurs at the bottom of
the nanotubes, enhancing the conductivity of the layer. At more negative potentials, the rate of the
cathodic reaction strongly increases due to reduction of TiO2 (Eq 2, E0 = −0.699 V):
TiO2 + 4H+ + 2e
− → Ti
2+ + 2H2O (2)
and the accompanying hydrogen evolution reaction at potentials more negative than −0.750 mV [34].
In the presence of Se in the electrolyte (added as Na2SeO3), a maximum at about −0.4 V was
recorded and referred to bulk deposition of Se (Figure 8). The wave from −0.5 to −0.6 V could be
associated with the hydrogen selenide formation according to the Eqs 3–4 [35]:
Se0 + 2H
+ + 2e
− → H2Se (3)
H2SeO3 + 6e− + 6H
+ → H2Se + 3H2O (4)
The formation of selenide leads to the coupled chemical reduction and Se formation (Eq 5):
H2SeO3 + 2H2Se → 3Se0 + 3H2O (5)
Accumulation of amorphous Se on the electrode surface is the probable reason for the hindering of
the overall cathodic reaction.
Deposition experiments by constant polarization at −0.4 V produced a dense layer of Se on top
of the nanotubes. Change in the color of the coating with increasing deposition time from a bright red
to a reddish dark grey was observed.
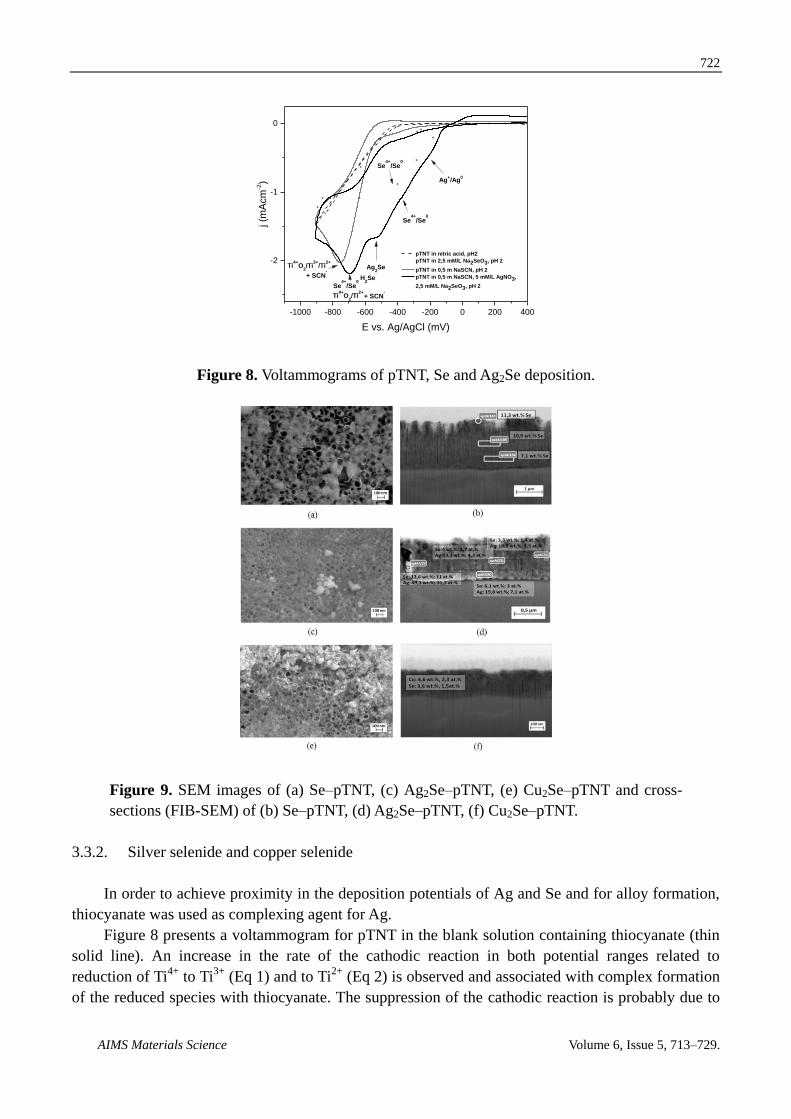
A pulse function was applied to incorporate Se into the nanotubes. The as-deposited Se is
amorphous and gave no XRD signals. The surface morphology of the layer is shown in Figure 9a,
containing about 11 wt% Se according to EDX analysis. The FIB cross-section (Figure 9b) showed
uniformly Se filled nanotubes with up to 11 wt% Se (top-section 11.3 wt%, mid-section 10.9 wt%,
bottom-section 7.1 wt%, values detected by EDX).
722
AIMS Materials Science Volume 6, Issue 5, 713–729.
Figure 8. Voltammograms of pTNT, Se and Ag2Se deposition.
Figure 9. SEM images of (a) Se–pTNT, (c) Ag2Se–pTNT, (e) Cu2Se–pTNT and cross-
sections (FIB-SEM) of (b) Se–pTNT, (d) Ag2Se–pTNT, (f) Cu2Se–pTNT.
3.3.2. Silver selenide and copper selenide
In order to achieve proximity in the deposition potentials of Ag and Se and for alloy formation,
thiocyanate was used as complexing agent for Ag.
Figure 8 presents a voltammogram for pTNT in the blank solution containing thiocyanate (thin
solid line). An increase in the rate of the cathodic reaction in both potential ranges related to
reduction of Ti4+
to Ti3+
(Eq 1) and to Ti2+
(Eq 2) is observed and associated with complex formation
of the reduced species with thiocyanate. The suppression of the cathodic reaction is probably due to
-1000 -800 -600 -400 -200 0 200 400
-2
-1
0
Se4+
/Se0
+ SCN-
Ti4+
O2/Ti
2+
pTNT in nitric acid, pH2
pTNT in 2,5 mM/L Na2SeO3, pH 2
pTNT in 0,5 m NaSCN, pH 2
pTNT in 0,5 m NaSCN, 5 mM/L AgNO3,
2,5 mM/L Na2SeO3, pH 2
j (m
Acm
-2)
E vs. Ag/AgCl (mV)
Ag+/Ag
0
Se4+
/Se0
Ag2Se
H2Se
Ti4+
O2/Ti
3+/Ti
2+
+ SCN-
Se4+
/Se0

723
AIMS Materials Science Volume 6, Issue 5, 713–729.
diffusion limitation for thiocyanate to the electrode surface as well as of reaction products (Ti-
thiocyanate complexes) from the electrode surface to the electrolyte bulk. Addition of thiocyanate to
the electrolyte containing Ag and Se polarizes the Ag+ reduction reaction to a potential of about
−0.25 V and a polarization wave is recorded (Figure 8, thick solid line). At a more negative potential
of about −0.4 V bulk deposition of Se takes place. Separate voltammetric experiments showed no
effect of the thiocyanate on the Se deposition. Silver selenide was formed at a potential of about
−0.5 V (Eqs 6–7) [36]:
2Ag(SCN)n1−n
+ Se + 2e− → Ag2Se + 2nSCN
− (6)
2Ag(SCN)n1−n
+ HSeO3− + 6e
− → Ag2Se + 3H2O + 2nSCN
− (7)
At potentials of about −0.7 V the formation of H2Se, Se and reduction of Ti4+
to Ti2+
overlapped.
The Ag2Se alloy deposition was performed on pTNT by applying pulses of −0.5 V. Top view of the
surface is presented in Figure 9c. Analyses in the cross-section area show concentration gradient for
Ag in depth (Figure 9d). The deposition process of copper selenide was investigated in a similar
manner by voltammetry. A potential of at about −0.5 V was chosen for the co-deposition of Cu and
Se in agreement with literature data [37]. Top view of the sample surface after pulse deposition at
−0.5 V is presented in Figure 9e. Particles agglomeration and partial coverage of the nanotubes’
openings were observed. EDX measurements in the cross-section area confirmed Cu and Se in
amounts of 4.6 wt% and 3.6 wt%, respectively (Figure 9f).
3.3.3. Hydroxyapatite
The HAp coating’s quality of adhesion is dependent on the substrate’s surface structure, the
bath’s acidity, the applied voltage and bath temperature [38]. To prevent precipitation of HAp in the
solution, the pH has to be in an acidic range (pH < 4). Applying cathodic polarization causes a
vigorous hydrogen evolution at the bottom of the nanotubes leading to HAp crystal formation (Eq 8),
acting as an anchorage for the growing layer.
10Ca2+
+ 6PO42−
+ 2OH− → Ca10(PO4)6(OH)2 (8)
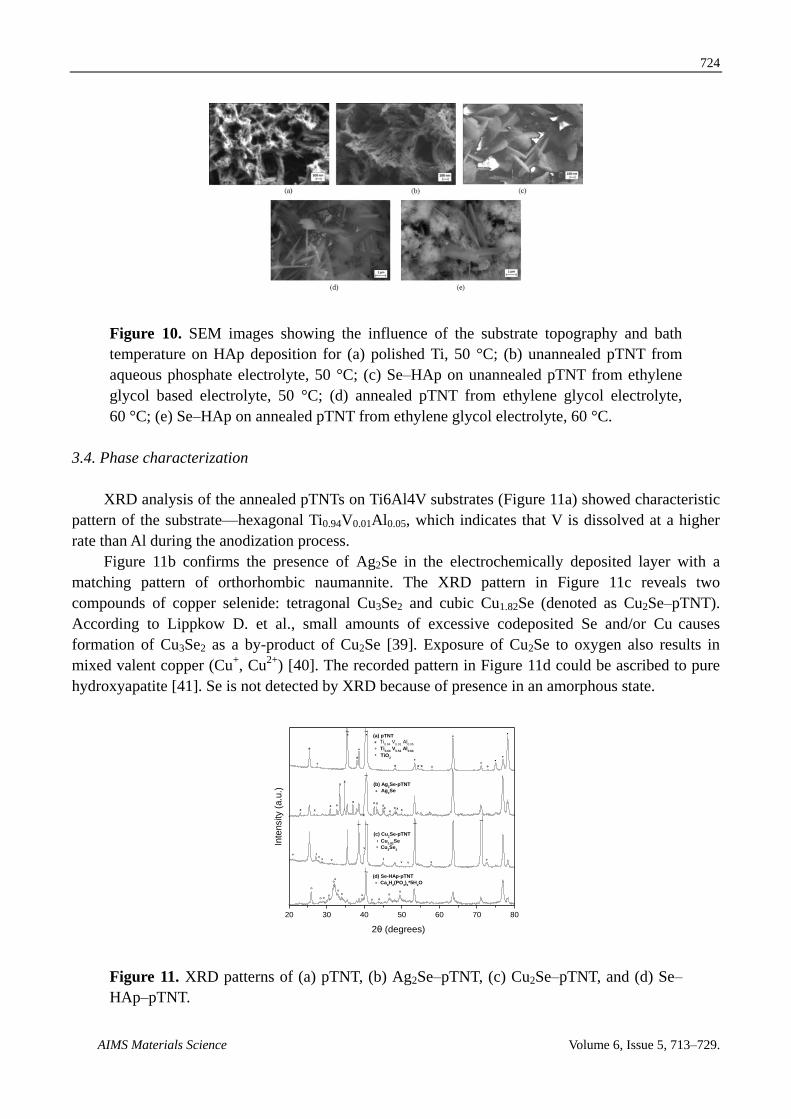
The template effect of the nanostructure on the HAp formation was followed by using Ti
samples with different topography. On a pure Ti sample, grinded and polished gradually with P180,
P360, P500, P1200, P2000, P4000, crystals grew fibrously parallel to the substrate surface indicating
poor layer adhesion (Figure 10a). Whereas a more compact HAp coating was formed on unannealed
pTNT obtained by anodization in aqueous phosphate electrolyte (Figure 10b). HAp adhesion was
improved by addition of Se and use of annealed TNT substrate, obtained by anodization in ethylene
glycol electrolyte (Figure 10c). The HAp crystal growth was facilitated by the presence of anatase [29].
Formation of HAp needles was induced by raising the bath temperature from 50 to 60 °C
(Figure 10d–e). Furthermore, aiming at incorporation of Se in the HAp layer, Na2SeO3 was added to
the solution. It could be proposed that at the conditions of the experiment, Se4+
reduction and
formation of Se takes place, influencing the HAp nucleation behavior by suppressing the hydrogen
evolution reaction. Furthermore, formation of fine globular crystal bundles on top of the HAp
needles was promoted (Figure 10e). According to the literature, HAp with large external surface
would provide high resorption, while the crystalline HAp underneath would ensure the mechanical
stability of the layer [18].
724
AIMS Materials Science Volume 6, Issue 5, 713–729.
Figure 10. SEM images showing the influence of the substrate topography and bath
temperature on HAp deposition for (a) polished Ti, 50 °C; (b) unannealed pTNT from
aqueous phosphate electrolyte, 50 °C; (c) Se–HAp on unannealed pTNT from ethylene
glycol based electrolyte, 50 °C; (d) annealed pTNT from ethylene glycol electrolyte,
60 °C; (e) Se–HAp on annealed pTNT from ethylene glycol electrolyte, 60 °C.
3.4. Phase characterization
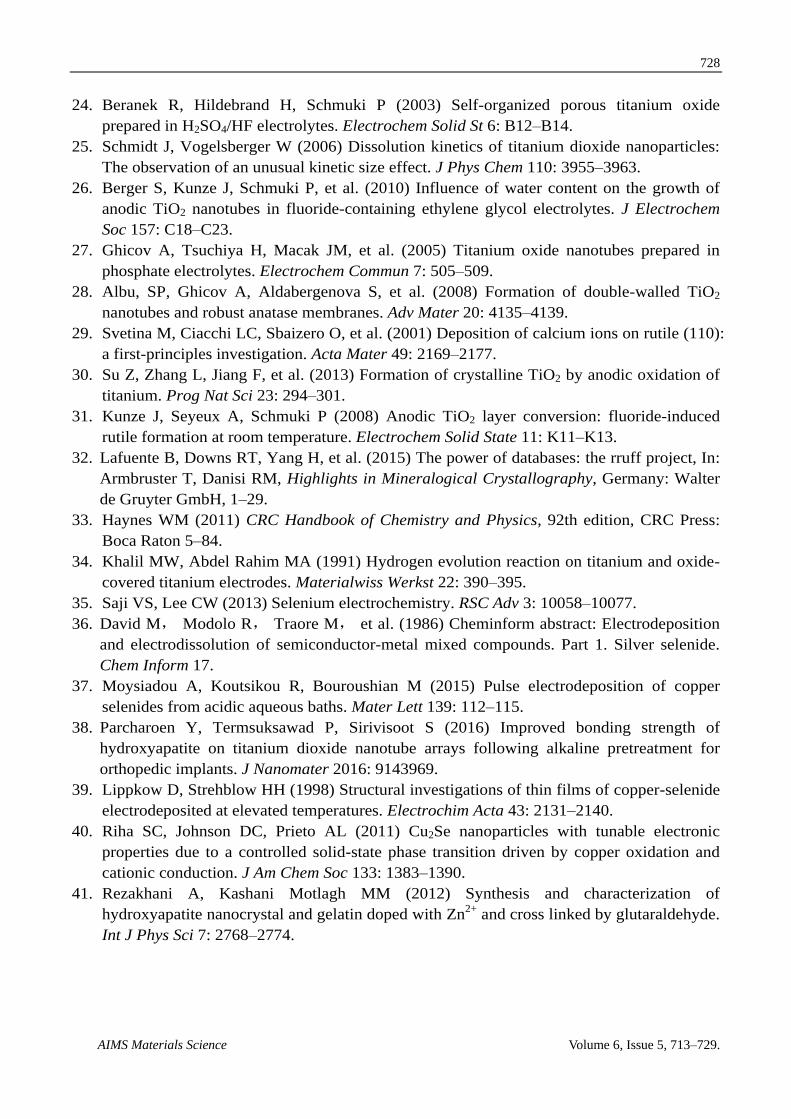
XRD analysis of the annealed pTNTs on Ti6Al4V substrates (Figure 11a) showed characteristic
pattern of the substrate—hexagonal Ti0.94V0.01Al0.05, which indicates that V is dissolved at a higher
rate than Al during the anodization process.
Figure 11b confirms the presence of Ag2Se in the electrochemically deposited layer with a
matching pattern of orthorhombic naumannite. The XRD pattern in Figure 11c reveals two
compounds of copper selenide: tetragonal Cu3Se2 and cubic Cu1.82Se (denoted as Cu2Se–pTNT).
According to Lippkow D. et al., small amounts of excessive codeposited Se and/or Cu causes
formation of Cu3Se2 as a by-product of Cu2Se [39]. Exposure of Cu2Se to oxygen also results in
mixed valent copper (Cu+, Cu
2+) [40]. The recorded pattern in Figure 11d could be ascribed to pure
hydroxyapatite [41]. Se is not detected by XRD because of presence in an amorphous state.
20 30 40 50 60 70 80
°°°
~
~
v
I
.
Cu3Se
2
x
xxxx
xx
xx
x
x
xx
xx
x
v
Ivv
vv
vvv
°°
°
°
° °°°°
°
.
* + Ti
0.64 V
0.52 Al
0.84
++
TiO2
Ti0.94
V0.01
Al0.05
.
.
...
..
***
*
~~~
~
~
(d) Se-HAp-pTNT
(a) pTNT
(b) Ag2Se-pTNT
Inte
nsity (
a.u
.)
(c) Cu2Se-pTNT
~
*
.
+
°
Ca8H
2(PO
4)6*5H
2O
v I
x
Ag2Se
Cu1.82
Se
2θ (degrees)
Figure 11. XRD patterns of (a) pTNT, (b) Ag2Se–pTNT, (c) Cu2Se–pTNT, and (d) Se–
HAp–pTNT.

725
AIMS Materials Science Volume 6, Issue 5, 713–729.
3.5. In vitro experiments
The biofilm was investigated via SEM in order to determine applied coatings’ ability to prevent
the biofilm formation. The immobilized bacteria cells have a round shape and a diameter of
approximately 1 µm. Figure 12a shows bacteria cells on the polished substrate Ti6Al4V forming
colonies of dozens of cells. Whereas, titania nanotubes with a diameter of 70 nm enabled the
formation of a thick biofilm (Figure 12b) by highly increasing the surface area. In contrast to TNT,
alteration of the anodization parameters lead to nanotubes of 100 nm (pTNT, Figure 12c), which
reduces the amount of attached bacteria and size of colonies and correlates with literature about the
influence of nanotube diameter on Staphylococcus aureus and epidermidis [6, 10, 11]. The deposition
of elementary selenium increases the protection against bacterial adhesion significantly (Figure 12d),
so that only isolated bacteria cells are located. The hydroxyapatite deposited pTNT (Figure 12e) is
rough and offers plenty of edges for bacteria to harbor. The amount and size of bacteria colonies is
comparable with the polished substrate (Figure 12a). Whereas, no bacteria cells have been found on
the SeHAp–pTNT.
To demonstrate the difference between silver selenide and silver in the layer, a silver coated
nanostructured Ti-disc was prepared with nanoscale silver trapped in the nanopores (4.5 wt% Ag).
Figure 12g shows Ag–pTNT covered by a slightly thinner biofilm compared to TNT (Figure 12b),
which is a result of S. epidermidis’ capability to reduce silver nanoparticles’ toxicity by precipitating
nanocristalline silver in its cytoplasma [42]. In contrast to Ag–pTNT, the biggest groups of bacteria
cells on Ag2Se–pTNT (Figure 12h) consists of up to three cells and is situated in areas where less
silver selenide coverage is present. Figure 12i presents Cu2Se–pTNT’s antibacterial activity resulting
in isolated or at most groups of two cells with relatively big distances in between.
Figure 12. SEM images of immobilized bacteria after 24 h incubation.

726
AIMS Materials Science Volume 6, Issue 5, 713–729.
4. Conclusions
In this study, various strategies were combined to modify Ti- based material, aiming at
enhanced antibacterial properties and biocompatibility.
Nano-topography formation by anodization was studied. Uniform nano-tube-shaped structures
with a diameter of 100 nm, containing phosphate were successfully grown on Ti and Ti6Al4V alloy.
As-prepared samples were uniformly filled with Se, Ag2Se and Cu2Se.
Hydroxyapatite was electro-chemically deposited on the pTNT. It was found that addition of Se
to the electrolyte influences the HAp nucleation. The formation of fine globular crystal bundles on
top of the HAp needles approximates a two- phase coating, expected to provide high resorption,
bioactivity as well as mechanical stability.
In vitro studies show effective hindering of biofilm formation by applying Se, Se- compounds
surface modification with Se–pTNT and Cu2Se–pTNT performing best.
Such samples will be further examined in depth in medical in-vitro and in-vivo experiments and
undergo clinical tests to evaluate its feasibility for biomedical application.
Acknowledgements
These investigations were performed with the support of the Austrian Science Foundation FFG
under Grant 4253627.
Conflict of interests
All authors declare no conflicts of interest in this paper.
References
1. Technavio Research, Biomedical metal market-global forecasts and opportunity, 2018
Available from: https://www.businesswire.com/news/home/20170620006368/en/
Biomedical-Metal-Market---Global-Forecasts-Opportunity.
2. Actis L, Gaviria L, Guda T, et al. (2013) Antimicrobial surfaces for craniofacial implants:
state of the art. J Korean Assoc Oral Maxillofac Surg 39: 43–54.
3. Chatzopoulos GS, Wolff LF (2017) Implant failure and history of failed endodontic
treatment: a retrospective case-control study. J Clin Exp Dent 9: e1322–e1328.
4. Darouiche RO (2004) Treatment of infections associated with surgical implants. N Engl J
Med 350: 1422–1429.
5. Naghizadeh M, Ghannadi S, Abdizadeh H, et al. (2014) Effect of fluoride concentration and
water content on morphology of titania nanotubes in ethylene glycol solution. Adv Mater
Res 829: 907–911.
6. Xu Z, Lai Y, Wu D, et al. (2015) Increased mesenchymal stem cell response and decreased
staphylococcus aureus adhesion on titania nanotubes without pharmaceuticals. Biomed Res
Int 2015: 9.

727
AIMS Materials Science Volume 6, Issue 5, 713–729.
7. Jagminas A, Kovger J, Selskis A, et al. (2015) Effect of hydrogen doping on the loading of
titania nanotube films with copper selenide species via alternating current deposition. J
Appl Electrochem 45: 1141–1151.
8. Cao C, Yan J, Zhang Y, et al. (2016) Stability of titania nanotube arrays in aqueous
environment and the related factors. Sci Rep 6: 23065.
9. Lim YC, Siti AS, Amiera PN, et al. (2017) Electrochemical deposition of copper decorated
titania nanotubes and its visible light photocatalytic performance. AIP Conf Proc 1877:
070002.
10. Ercan B, Taylor E, Alpaslan E, et al. (2011) Diameter of titanium nanotubes influences
anti-bacterial efficacy. Nanotechnology 22: 295102.
11. Su EP, Justin DF, Pratt CR, et al. (2018) Effects of titanium nanotubes on the
osseointegration, cell differentiation, mineralisation and antibacterial properties of
orthopaedic implant surfaces. Bone Joint J 100-B: 9–16.
12. Piszczek P, Lewandowska Ż, Radtke A, et al. (2017) Biocompatibility of titania nanotube
coatings enriched with silver nanograins by chemical vapor deposition. Nanomaterials 7:
274.
13. Holinka J, Pilz M, Kubista B, et al. (2013) Effects of selenium coating of orthopaedic
implant surfaces on bacterial adherence and osteoblastic cell growth. Bone Joint J 95-B:
678–682.
14. Liu W, Golshan NH, Deng X, et al. (2016) Selenium nanoparticles incorporated into titania
nanotubes inhibit bacterial growth and macrophage proliferation. Nanoscale 8: 15783–
15794.
15. Mir IA, Alam H, Priyadarshini E, et al. (2018) Antimicrobial and biocompatibility of highly
fluorescent znse core and znse@zns core-shell quantum dots. J Nanopart Res 20: 174.
16. Capanema N, Mansur A, Carvalho S, et al. (2015) Niobium-doped hydroxyapatite
bioceramics: synthesis, characterization and in vitro cytocompatibility. Materials 8: 4191–
4209.
17. Bang LT, Long BD, Othman R (2014) Carbonate hydroxyapatite and silicon-substituted
carbonate hydroxyapatite: synthesis, mechanical properties, and solubility evaluations. Sci
World J 2014: 969876.
18. Xue W, Liu X, Zheng X, et al. (2005) Effect of hydroxyapatite coating crystallinity on
dissolution and osseointegration in vivo. J Biomed Mater Res A 74: 553–561.
19. Bauer S, Kleber S, Schmuki P (2006) TiO2 nanotubes: tailoring the geometry in H3PO4/HF
electrolytes. Electrochem Commun 8: 1321–1325.
20. Rogers KL, Fey PD, Rupp ME (2009) Coagulase-negative staphylococcal infections. Infect
Dis Clin N Am 23: 73–98.
21. Schoenfelder SMK, Lange C, Eckart M, et al. (2010) Success through diversity—how
staphylococcus epidermidis establishes as a nosocomial pathogen. Int J Med Microbiol 300:
380–386.
22. Tammelin A, Domicel P, Hambraeus A, et al. (2000) Dispersal of methicillin-resistant
staphylococcus epidermidis by staff in an operating suite for thoracic and cardiovascular
surgery: relation to skin carriage and clothing. J Hosp Infect 44: 119–126.
23. Issam R, Amin A, Kenneth R (1998) Staphylococcus epidermidis: emerging resistance and
need for alternative agents. Clin Infect Dis 26: 1182–1187.
728
AIMS Materials Science Volume 6, Issue 5, 713–729.
24. Beranek R, Hildebrand H, Schmuki P (2003) Self-organized porous titanium oxide
prepared in H2SO4/HF electrolytes. Electrochem Solid St 6: B12–B14.
25. Schmidt J, Vogelsberger W (2006) Dissolution kinetics of titanium dioxide nanoparticles:
The observation of an unusual kinetic size effect. J Phys Chem 110: 3955–3963.
26. Berger S, Kunze J, Schmuki P, et al. (2010) Influence of water content on the growth of
anodic TiO2 nanotubes in fluoride-containing ethylene glycol electrolytes. J Electrochem
Soc 157: C18–C23.
27. Ghicov A, Tsuchiya H, Macak JM, et al. (2005) Titanium oxide nanotubes prepared in
phosphate electrolytes. Electrochem Commun 7: 505–509.
28. Albu, SP, Ghicov A, Aldabergenova S, et al. (2008) Formation of double-walled TiO2
nanotubes and robust anatase membranes. Adv Mater 20: 4135–4139.
29. Svetina M, Ciacchi LC, Sbaizero O, et al. (2001) Deposition of calcium ions on rutile (110):
a first-principles investigation. Acta Mater 49: 2169–2177.
30. Su Z, Zhang L, Jiang F, et al. (2013) Formation of crystalline TiO2 by anodic oxidation of
titanium. Prog Nat Sci 23: 294–301.
31. Kunze J, Seyeux A, Schmuki P (2008) Anodic TiO2 layer conversion: fluoride-induced
rutile formation at room temperature. Electrochem Solid State 11: K11–K13.
32. Lafuente B, Downs RT, Yang H, et al. (2015) The power of databases: the rruff project, In:
Armbruster T, Danisi RM, Highlights in Mineralogical Crystallography, Germany: Walter
de Gruyter GmbH, 1–29.
33. Haynes WM (2011) CRC Handbook of Chemistry and Physics, 92th edition, CRC Press:
Boca Raton 5–84.
34. Khalil MW, Abdel Rahim MA (1991) Hydrogen evolution reaction on titanium and oxide-
covered titanium electrodes. Materialwiss Werkst 22: 390–395.
35. Saji VS, Lee CW (2013) Selenium electrochemistry. RSC Adv 3: 10058–10077.
36. David M, Modolo R, Traore M, et al. (1986) Cheminform abstract: Electrodeposition
and electrodissolution of semiconductor-metal mixed compounds. Part 1. Silver selenide.
Chem Inform 17.
37. Moysiadou A, Koutsikou R, Bouroushian M (2015) Pulse electrodeposition of copper
selenides from acidic aqueous baths. Mater Lett 139: 112–115.
38. Parcharoen Y, Termsuksawad P, Sirivisoot S (2016) Improved bonding strength of
hydroxyapatite on titanium dioxide nanotube arrays following alkaline pretreatment for
orthopedic implants. J Nanomater 2016: 9143969.
39. Lippkow D, Strehblow HH (1998) Structural investigations of thin films of copper-selenide
electrodeposited at elevated temperatures. Electrochim Acta 43: 2131–2140.
40. Riha SC, Johnson DC, Prieto AL (2011) Cu2Se nanoparticles with tunable electronic
properties due to a controlled solid-state phase transition driven by copper oxidation and
cationic conduction. J Am Chem Soc 133: 1383–1390.
41. Rezakhani A, Kashani Motlagh MM (2012) Synthesis and characterization of
hydroxyapatite nanocrystal and gelatin doped with Zn2+
and cross linked by glutaraldehyde.
Int J Phys Sci 7: 2768–2774.

729
AIMS Materials Science Volume 6, Issue 5, 713–729.
42. Rezvani Amin Z, Khashyarmanesh Z, Fazly Bazzaz BS (2016) Different behavior of
staphylococcus epidermidis in intracellular biosynthesis of silver and cadmium sulfide
nanoparticles: more stability and lower toxicity of extracted nanoparticles. World J Microb
Biot 32: 140.
© 2019 the Author(s), licensee AIMS Press. This is an open access
article distributed under the terms of the Creative Commons
Attribution License (http://creativecommons.org/licenses/by/4.0)

![TENSILE PROPERTIES AND MICROSTRUCTURE OF · PDF file... DMLS horizontal Ti6Al4V samples . Machine/Process-parameters (if ... heat treatment at ... for Ti6Al4V ELI alloy [6 -7]. After](https://img.pdfslide.us/doc/110x75/5a9e70897f8b9a62178b5dae/tensile-properties-and-microstructure-of-dmls-horizontal-ti6al4v-samples.jpg)
![Efficient fabrication of Ti6Al4V alloy by means of multi ...sffsymposium.engr.utexas.edu › sites › default › files › ...time onto a substrate. Tian [2] et al., achieved a powder](https://img.pdfslide.us/doc/110x75/5f1cbd2915ed307864382374/efficient-fabrication-of-ti6al4v-alloy-by-means-of-multi-a-sites-a-default.jpg)


![Fretting fatigue of Ti6Al4V Clean Copy - pure.qub.ac.uk · Many researchers have carried out in-depth study of fretting fatigue of Ti6Al4V titanium alloy [2-14], but due to the limitations](https://img.pdfslide.us/doc/110x75/5f06c1797e708231d419930f/fretting-fatigue-of-ti6al4v-clean-copy-purequbacuk-many-researchers-have-carried.jpg)