Embed Size (px)
Citation preview

Geophys. J. Int. (2003) 152, 749–765
Surface expression of thrust faulting in eastern Iran: sourceparameters and surface deformation of the 1978 Tabas and 1968Ferdows earthquake sequences
Richard Walker, James Jackson and Calum BakerBullard Laboratories, Madingley Road, Cambridge CB3 0EZ. E-mail: [email protected]
Accepted 2002 October 8. Received 2002 September 18; in original form 2002 June 14
S U M M A R YPreviously unrecognised thrust faults in eastern Iran were responsible for a destructive earth-quake at Tabas (1978, September 16), which produced over 80 km of distributed and discon-tinuous surface ruptures above a series of low anticlinal hills to the west of a major range-front.Analysis of long-period body-wave seismograms shows a simple rupture on a gently dipping(∼16◦) thrust, with a slight right-lateral component. This is compatible with the locally recordedaftershock distribution. Body wave analysis of two later, smaller events show similar sourceorientations. Several indicators of long-term active folding at Tabas can be recognised in thegeomorphology, and surface ruptures from 1978 are consistent with co-seismic fold growth.Drainage incision also indicates uplift at depth on thrust faults dipping eastwards beneath thefolds. Body-wave seismograms for two earthquakes near Ferdows, 150 km east of Tabas, inSeptember 1968 also show thrust faulting at depths of ∼10 km. Again, the surface geomorphol-ogy indicates a region of folding above an eastward-dipping thrust fault, which is ∼10 km westof a fault bounded range-front. In both Tabas and Ferdows, the active faulting appears to showQuaternary migration away from the range-front, possibly in response to stresses produced bythe elevated topography. The identification of zones of active fault-related folding is importantfor earthquake hazard assessment and also for an understanding of the local tectonics. Weconclude that the structures which gave rise to the 1968 and 1978 earthquakes could have beenrecognised beforehand from the clear signals in the geomorphology, had we known what tolook for at that time.
Key words: continental deformation, earthquakes, geomorphology, Iran, thrust faulting.
1 I N T R O D U C T I O N
In 1968 the town of Ferdows in eastern Iran (Fig. 1c) was badlydamaged and ∼750 people were killed by two earthquakes onthe 1st (Mw 6.3) and 4th (Mw 5.5) of September. Althoughthe surrounding area was very sparsely populated, a number ofnearby villages were also damaged with a further ∼150 deaths(Ambraseys & Melville 1982). Ten years later, on the 1978September 16, the oasis town of Tabas, some 150 km to the westof Ferdows (Fig. 1c), was destroyed and 85 per cent of its pop-ulation (∼11 000 people) killed by an earthquake of Ms 7.4 thatremains the largest instrumentally recorded earthquake in Iran. Insubsequent years, four additional earthquakes have occurred nearTabas.
The faults responsible for the earthquakes had not been recog-nised before the earthquakes occurred, as discrete fault scarps rarelyoccur in the soft alluvial sediments. However, as we show below, in-dications of long-term, cumulative deformation are clearly visiblein the geomorphology. We use seismological and geomorphologi-
cal observations to describe how the surface deformation is relatedto faulting at depth. From this we can better interpret the mass ofcomplex and sometimes apparently contradictory surface rupturesthat were reported, particularly for the Tabas earthquake (Berberian1979a). At the time of the 1968 and 1978 earthquakes, the link be-tween thrust faulting and surface folding was not much understood,nor were the surface manifestations of active folding appreciated orcommonly recognised. We now know that concealed thrust faults(i.e. faults that are not directly expressed at the surface, either dueto their being blind, or due to rapid erosion and sedimentation in theactive region) are widespread and responsible for more recent earth-quakes both within Iran (e.g. the Sefidabeh earthquake sequence in1994; Berberian et al. 2000), and worldwide, such as the Ms 7.31980 El Asnam earthquake in Algeria (Yielding et al. 1981; Boudiafet al. 1998) and several earthquakes in California including the 1987Whittier Narrows (Hauksson & Jones 1989) and 1994 Northridgeevents (Hauksson et al. 1995). Understanding the geomorphologi-cal manifestations of partially or completely concealed thrust faultsin seismically active regions is therefore important for identifying
C© 2003 RAS 749

750 R. Walker, J. Jackson and C. Baker
Figure 1. (a) Seismicity of Iran for the period 1964–1990. Epicentres are from Engdahl et al. (1998). The seismicity is mainly confined within the politicalborders of Iran with Eurasia and Afghanistan (Af) being essentially aseismic. Earthquake deformation within Iran is concentrated in the Zagros (Z), the Alborz (A),the Kopet Dag (K) and in eastern Iran. The aseismic central Iran and Lut blocks are denoted by C and L. (b) A velocity field for Iran estimated from the spatialvariation in the style of strain rates indicated by earthquakes (from Jackson et al. 1995). Velocities are shown relative to stable Eurasia. Note the right-lateralshear expected along the eastern border of Iran. The boxed region shows the location of Fig 1(c). (c) Major faulting in eastern Iran. South of 34◦ N deformationoccurs in two zones of N-S dextral strike-slip, which follow narrow mountain ranges. North of 34◦, E-W left-lateral faulting predominates. Boxes show theareas of Figs 2 and 11.
similar structures that have not had recorded earthquakes but stillpose a significant seismic hazard.
2 A C T I V E T E C T O N I C SO F E A S T E R N I R A N
The active deformation of Iran results from Arabia–Eurasia conver-gence. Shortening is mainly accommodated by distributed faultingin high mountain ranges in the south (the Zagros) and the north (theAlborz and Kopeh Dagh) of the country (Fig. 1a). Surrounding re-gions to the north and east are aseismic and appear not to be deform-ing. This results in a right-lateral shear in the east of Iran as centralIran moves N-NNE relative to stable Afghanistan (Fig. 1b). South of34◦ N the shear is taken up on right-lateral strike-slip faults that endin thrust faults whose displacement dies away towards their ends.
North of 34◦ N left-lateral strike-slip faults take up the right-lateralshear by rotating clockwise (Jackson et al. 1995). Again, these faultsend in thrusts whose displacements die away towards their ends. Thistype of fault termination is a necessary consequence of strike-slipfaults that do not simply link to other structures at their ends, andmany examples are seen, both in Iran (Berberian et al. 2000) andelsewhere (e.g. Bayasgalan et al. 1999a; Meyer et al. 1998). The1968 Ferdows and 1978 Tabas earthquakes both occurred on thrustfault systems of this type.
3 T A B A S
3.1 Topography and Geology
Fig. 2 shows the major elements of the Tabas region. The Tabasfold system is visible in the alluvial apron between the Tabas playa
C© 2003 RAS, GJI, 152, 749–765

Thrust faulting in eastern Iran 751
Figure 2. (a) LANDSAT TM image of the Tabas region. Tabas lies between the high Shotori mountains to the east and the Tabas playa to the west. The foldsegments adjacent to Fosha, Khosrowabad and the Sardar river are discussed in the text. A discontinuous zone of strike-slip faulting is identified in the westernShotori mountains (white lines). Fault plane solutions for five events are shown (black for events modelled in this study, grey for those from the Harvard CMTcatalogue). Epicentres are from the catalogue of Engdahl et al. (1998) and may be in error by up to 15 km. Boxes show locations of later figures. (b) Simplifiedruptures from the 1978 earthquake (after Berberian et al. 1979) are shown in black. High-angle faults have ticks on the upthrown sides. The black star is the1978 main shock epicentre from Engdahl et al. (1998).
C© 2003 RAS, GJI, 152, 749–765
752 R. Walker, J. Jackson and C. Baker
Figure 3. Final inversion results for (a) the 1978 September 16 Tabas main shock (b) the 1979 February 13 event and (c) the 1980 January 12 event.
C© 2003 RAS, GJI, 152, 749–765
Thrust faulting in eastern Iran 753
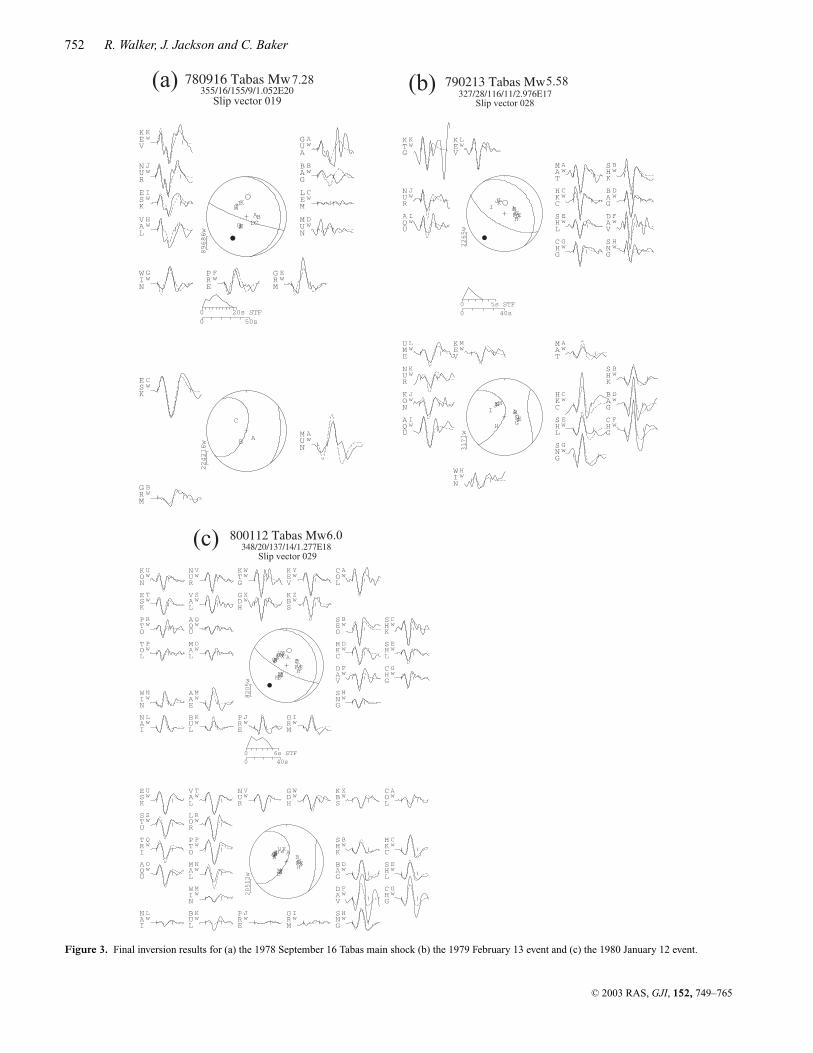
Table 1. Source parameters of the 1978 September 16 Tabas main shock. SV is the slip vector azimuth, assuming thatthe east-dipping nodal plane is the fault plane. The source parameters in each case are determined by different methodsthat are described in the final column.
Source Strike Dip Rake SV Depth Mo (×1020) Mw Method
This paper 355 16 155 19 9 1.052 7.28 Body–wave inversionBerberian et al. (1979) 332 31 110 36 – – – First motionsHarvard CMT 328 33 107 38 11 1.32 7.4 Centroid moment tensorNiazi & Kanamori (1981) 330 30 110 36 – 1.5 7.4 Surface wave moment
– – – – – 0.82 – P–wave momentSilver & Jordan (1983) – – – – – 1.3 – Total moment spectra
depression (∼600 m above sea level) and the Shotori mountains.The NNW–SSE Shotori mountains form the highest topography(∼2900 m). The relief of these mountains is in contrast to the lowrounded hills of the Tabas fold system, which do not rise more than∼100 m above the surrounding gravel apron. The Shotori moun-tains are composed of heavily deformed Palaeozoic and Mesozoicrocks. Changes in sediment thickness from the Shotori mountainstowards Tabas indicate several periods of fault reactivation since thelate Pre-Cambrian (Stocklin et al. 1965; Berberian 1979a), with afinal phase of shortening in the Late Tertiary. West of the Shotorimountains, deposition is typified by Neogene marls overlain by con-glomerate. The marls are exposed in the cores of the Tabas anticlinesand produce light shades in LANDSAT imagery (Fig. 2). River ter-races and laterally equivalent gravel fans are widespread withinboth the Shotori mountains and the Tabas folds. These are proba-bly Quaternary surfaces (Stocklin et al. 1965) and are often deeplyincised.
3.2 Seismicity of the Tabas fault system
We first obtain source parameters for the 1978 main shock as well asfor additional earthquakes on 1979.02.13 and 1980.01.12 by mod-elling P and SH body waves. Two other events in 1990 in the northernpart of the system were too small for their waveforms to be mod-elled with our technique, but CMT solutions are available from theHarvard catalogue (Fig. 2). Our results indicate that the 1978 main-shock occurred on a gently dipping thrust and that much of themain fault slip at depth may not have reached the surface. We thencompare these results with co-seismic ruptures mapped in 1978.
3.2.1 Source parameters of the 1978 September 16 earthquake
The teleseismically-relocated epicentre for the main Tabas shockis at 33.25◦ N, 57.38◦ E (Engdahl et al. 1998), placing the shockwithin the southern Shotori mountains (Fig. 2). This location maybe in error by 10 to 15 km, which is typical for large earthquakesin Iran after 1970 (Berberian 1979b), but even with this error, it isnear the southern end of the rupture sequence (Fig. 2b), implying anorthward rupture propagation. Although there is no proof of this
Table 2. P and SH body-wave inversion results for the Tabas and Ferdows earthquake sequences.Epicentres are from Engdahl et al. (1998).
Event Lat. Long. Strike Dip Rake SV Depth Mo (×1018) Mw
1968 Sept. 01 34.07 58.21 307 37 95 32 10 2.959 6.251968 Sept. 04 34.03 58.31 340 34 100 58 9 0.2163 5.491978 Sept. 16 33.25 57.38 355 16 155 19 9 105.2 7.281979 Feb. 13 33.31 57.40 327 28 116 28 11 0.2976 5.581980 Jan. 12 33.55 57.23 348 20 137 29 14 1.277 6.0
in our body wave inversion, analysis of strong motion records alsosupport a northward propagation (Shoja-Taheri & Anderson 1988).
We used body waveforms to constrain the earthquake source pa-rameters. Paper seismogram records for stations of the WWSSNnetwork in the epicentral range of 30–90◦ were digitised. We thenused the MT5 version (Zwick et al. 1995) of McCaffrey & Abers(1988) and McCaffrey et al. (1991) algorithm, which inverts the Pand SH waveform data to obtain the strike, dip, rake, centroid depth,seismic moment and source time function. We always constrainedthe source to be a double-couple. The method and approach we usedare described in detail elsewhere (e.g. Nabelek 1984; Taymaz et al.1991) and are now too routine to justify repetition here.
The result of our inversion for the main shock is shown on Table 1along with other published source parameters. Fault plane solutionsfor all three of the earthquakes are shown in Fig. 3 and the source pa-rameters for all the earthquakes determined by body-wave inversionare summarized in Table 2. The source parameters determined forthe main shock (Fig. 3a) and the two later earthquakes (Fig. 3b-c) allhave similar mechanisms that involve predominantly thrust faultingon shallow planes dipping between 16◦ and 28◦ to the east (Table 2).Relatively few seismograms are available for the main shock as manywere off scale. The strike of the fault plane in the main shock is notwell constrained, but all three earthquakes have a well constrainedsteep nodal plane which requires the slip vectors to be similar ineach case, assuming that the actual fault plane dips NE beneath theShotori mountains for each one (Table 2). In particular, our solutionfor the 1980.01.12 event, which, like the main shock, has a steep SW-dipping nodal plane, is not sensitive to changes in strike of the faultplane, as changes in strike are balanced by a direct trade-off withrake, without the need to change the well constrained steep nodalplane. But, the strike of the fault plane must be approximately NW–SE because of the topography and structure at the surface (Fig. 2),this means that the dip of the fault plane is constrained to within±5◦, as changing the dip affects seismograms at stations close to theP and SH nodal planes, resulting in a degradation in the visual fitof synthetic seismograms. This, and the similarity between all threesolutions (Fig. 3) increases our confidence in the relatively poorlyconstrained main shock mechanism. The component of right-lateralstrike-slip indicated by the slip vectors in all three earthquakes isalso seen in the co-seismic ruptures, which we address later.
C© 2003 RAS, GJI, 152, 749–765

754 R. Walker, J. Jackson and C. Baker
Figure 4. GTOPO30 topography of the Tabas region with aftershock locations from Berberian (1982) and co-seismic ruptures after Berberian (1979a). Linescorrespond to the sections shown to the right. (b-e) Cross-sections through the Tabas thrust system. Lines of section are shown on Fig. 4(a). Aftershocks up to10 km from the line of section are projected. Black arrows above the sections mark the positions of co-seismic ruptures at the surface. The main rupture surfacedetermined from inversion of body-waves (see text) is represented by the grey bar. The centre-point is fixed by the centroid depth of 9 km. As the epicentrallocation is expected to vary by ∼10 km, the lateral position of the main rupture is located by eye to overlie the most dense aftershock activity.
As both the co-seismic ruptures and longer-term folding occur indiscrete segments (see Fig. 2), discrete earthquake sub-events mightbe expected. Analysis of strong motion records certainly supportsthis, and at least four sub-events are recognised, propagating fromsouth to north (Shoja-Taheri & Anderson 1988). However, relativelocations of the sub-events are not well enough resolved to asso-ciate them with particular fold segments at the surface. The sourcetime function obtained from our long-period inversion indicates asingle, simple rupture event at these lower frequencies lasting for18 s. With a rupture velocity of ∼3.5 km s−1, this gives a 65 kmfault length, which is close to the observed 80 km length of theco-seismic ruptures described by Berberian (1979a). In any case,the 80 km rupture length may contain the effects of aftershocks aswell as the main shock. We therefore consider the earthquake as asingle continuous event without the need to invoke a complicatedcomposite event. Therefore, although it is probable that the faultis segmented at depth (as reflected by the strong motion recordsand possibly by the surface folding as well), we do not attempt tomodel this.
We can also attempt to compare the main shock source parame-ters determined in this study with aftershocks recorded for a periodof 30 d afterwards by Berberian (1982), shown in Fig. 4(a). Wefirst assume that the ratio of average slip to rupture length (u/L) is5 × 10−5, which is typical for intraplate earthquakes (Scholz 1982).We can then use the seismic moment and a rupture length of 65 km
(determined by multiplying the main shock source time functionduration of 18 sec (Fig. 3a) by a rupture velocity of 3.5 km s−1),to estimate a down-dip fault width of ∼17 km and an average slipof ∼3.3 m. The rupture surface is then represented as a grey baron cross-sections perpendicular to the trend of the surface defor-mation (Fig. 4b-e). The centre point of the bar is consistent withour determination of centroid depth (Fig. 3a and Table 1), but thedepth is not well constrained by the waveform modelling becauseof a trade-off with source time-function duration, which is commonfor dip slip earthquakes of this magnitude. With this consideration,and because the instrumental epicentre location may be in error by∼10 km (Berberian 1979b), we placed the bar by eye to overlie thedensest aftershock activity. The location of these bars are shownin plan view on Fig. 4(a). Most of the aftershocks occur in a near-horizontal band that is close to the gently eastward-dipping planewe assume ruptured in the main shock. These observations, andthe relatively small co-seismic displacements seen at the surface(Berberian et al. 1979, see below), imply that most of the fault slipat depth failed to reach the surface.
3.2.2 Coseismic surface ruptures of the 1978September 16 earthquake
Co-seismic ruptures were mapped in detail by Berberian (1979a).Discontinuous surface ruptures in ten main segments extended
C© 2003 RAS, GJI, 152, 749–765

Thrust faulting in eastern Iran 755
Figure 5. Extensive bedding slip developed south of Tabas in the 1978 earthquake. Distance between Qanat tunnels is ∼20 m (photograph courtesy of M.Berberian). (b) Gravels exposed in the north face of a river cutting ∼2 km north of Khosrowabad (33◦ 33′ .36N 56◦ 57′ .50E). Unconformable relationshipsbetween underlying (steeper) and overlying (gently) dipping gravels are seen. (c) Unconformable relationship between steep underlying gravels and gently-dipping overlying gravels in the north face of the Sardar river canyon near 33◦ 36′ .50N 57◦ 02′ .50E near the western flank of the fold. (d) Looking east fromeastern margin of the Sardar fold near 33◦ 38′ .50N 57◦ 04′ .75E. Incision of the Sardar river into abandoned gravel fan deposits (several terraces can be seenin the southern wall of the canyon). (e) Staircase terracing in incised meanders of the Sardar river, view looking west from near 33◦ 39′ .65N 57◦ 07′ .00E.(f) Incised terrace of the Sardar river within the Shotori mountains. Jurassic bedrock is exposed at the base of the gravels. (g) The Sardar canyon as it enters theShotori mountains at 33◦ 39′ .40N 57◦ 07′ .30E. The abandoned alluvial surface is not offset by faulting at the mountain edge, which therefore must have beenquiescent at least since deposition of the fan.
C© 2003 RAS, GJI, 152, 749–765

756 R. Walker, J. Jackson and C. Baker
Figure 6. ASTER image of the Fosha fold segment (see Fig. 2, for location). The folding is very clear, as is the asymmetry of drainage incision, which is seenonly to the east of the fold. (b) 40 m resolution digital elevation model of the Fosha segment of the Tabas system. The white line represents the line of sectionin Fig. 6(c). (c) Section through the 40 m DEM across the Fosha fold. Steep dips at both margins of the fold suggest both margins are underlain by opposingthrust faults. Alluvial surfaces differ in height across the fold by ∼40 m.
along a NNW–SSE trend for ∼85 km. They closely followed thelow hills of the Tabas fold system. Shallow-dipping thrust rup-tures formed along the western margins of these folds (Fig. 2b).The maximum displacement across these ruptures was ∼35 cm(Berberian 1979a), which is significantly less than the ∼3.3 mof slip expected along the main rupture plane using the assumedratio of average slip to rupture length introduced earlier (Scholz1982).
Ruptures also developed within the folds. These had steeper dips,and were interpreted as reverse faults with steep to vertical dip(Berberian 1979a), see Fig. 2b. However we suspect that some ofthese were surficial normal faults, or near-vertical fissures withinthe core of the folds, as seen at El Asnam in 1980 (Yielding et al.1981). Significant internal deformation also occurred within thefolded Neogene deposits in the hangingwalls of the observed thrustfaults, with extensive bedding plane slip over an ∼8 km wide zone.This bedding plane slip was most dramatically demonstrated acrossdry river beds, where it was clearly developed in extensive fluvialsurfaces (Fig. 5a). A right-lateral component was noted in severallocalities (Berberian 1979a).
The seismology suggests that at least the distributed surface rup-tures within the folds were not part of the main seismogenic sur-face responsible for the Tabas earthquake, which probably involved∼3.3 m of slip on a gently eastward dipping plane. Thrust rupturesalong the western margins of the folds may be the tips of the mainrupture reaching to the surface, but the small displacements acrossthem (∼35 cm) indicate that much of the slip at depth did not reachthe surface at all. We suggest that the suite of surface ruptures ispredominantly due to co-seismic fold growth that accommodatesthe major part of the thrust movement at depth.
3.3 Geomorphological expressionof thrust faulting at Tabas
The geomorphology of active fault zones often contains informa-tion on the long-term development and evolution of the faulting,which is impossible to obtain using seismology alone (e.g. Burbanket al. 1996; Jackson et al. 1996; Keller et al. 1998; Oskin et al.2000). In the following section we use simple observations of the
C© 2003 RAS, GJI, 152, 749–765

Thrust faulting in eastern Iran 757
Figure 7. Indicators of long-term and co-seismic growth on the Fosha fold segment (see Fig. 6, for location). (a) Photograph looking SE from 33◦ 42′ .01N57◦ 00′ .03E. Two uplifted and tilted gravel surfaces are seen. These lie unconformably on strongly tilted Neogene marl beds. House and palm trees at rightfor scale. (b) Photograph looking NW along the nose of the Fosha fold, exposed in a river cutting (33◦ 41′ .69N 56◦ 59′ .42E). The unconformity betweenyounger and older gravels can be seen. We are standing on a recent and still active river terrace. (c) Westward dipping thrust fault developed in young gravelson the western margin of the fold (33◦ 42′ .32N 56◦ 58′ .78E). The orientation of the thrust matches the dip of underlying, tilted Neogene marls. (d) Cartoonshowing how the folding at Fosha grows by flexural slip between beds. Continual reworking of folded alluvial gravels into new, un-tilted surfaces results inunconformities between younger and older beds. Slip on steep underlying beds displaces younger gravels forming small thrust faults (as seen in Fig. 7c).
geomorphology to show long-term folding at Tabas. Furthermore,from the landscape, we can infer the presence of an eastward dippingthrust fault at depth below the Tabas folds.
3.3.1 Long-term folding
Fig. 6(a–b) shows the Fosha segment of the Tabas fold system (seeFig. 2, for location). The folding is clearly visible in digital topog-raphy and ASTER satellite imagery. The Fosha fold is ∼2 km wideand ∼5 km long. It is developed in alluvial deposits shed from theShotori mountains and folded Neogene marls are exposed in thecore of the fold (which show as light-shaded regions on the ASTERimage). There are several key observations that point towards long-term folding and uplift.
First, remnants of gently tilted alluvial and fluvial gravel surfacesare preserved at heights of 10 to 20 m above the present-day riverlevels (Fig. 7a). This implies either fold uplift of this amount sincethe gravel surface was deposited or the same amount of loweringof the fluvial base-level. As these uplifted gravels are preservedwithin the folded region and stop sharply at the western margin ofthe fold, it seems likely that their presence records uplift of the foldwith respect to local base-level (e.g Bullard & Lettis 1993; Burbanket al. 1996). Furthermore, the uplifted gravels lie unconformablyon older, steeper Neogene marls (Fig. 7a). Unconformable contactsbetween older and younger gravels can be seen in the wall of ariver cutting the western flank of the fold (Fig. 7b). This is a directindication of long-term growth of the fold, with fluvial and allu-vial gravels repeatedly going through a process of folding, erosion
C© 2003 RAS, GJI, 152, 749–765

758 R. Walker, J. Jackson and C. Baker
Figure 8. (a) ASTER image of the Sardar fold segment (see Fig. 2, for location). The fold forms an ∼4 km wide zone of uplifted and incised alluvium trendingNNW through the centre of the image. The Sardar river has cut an ∼100 m deep gorge to the east of the fold. At the western margin of the fold, the Sardarriver forms an active alluvial fan. (b) 40 m resolution digital elevation model of the Sardar segment of the Tabas system. The white line represents the line ofsection in Fig. 6(c). (c) Section through the 40 m DEM across the Fosha fold. Steep dips are only found in the western margin of the fold, implying a westwardvergence. Alluvial surfaces differ in height across the fold by ∼40 m. The line of section roughly follows a single alluvial surface, abandoned since the Sardarriver cut into it, which is continuous through the fold in old river courses.
and redeposition as new gravel surfaces are in turn uplifted andfolded, as depicted in Fig. 7(d). Similar relationships are also foundin the western flanks of the Sardar and Khosrowabad fold segments(Fig. 5c–d). The folding and uplift is accommodated by bedding-plane slip between steeply dipping beds, as observed in 1978(Berberian 1979a). Similar long-term fold growth is seen in thenorthern Tien Shan (Avouac et al. 1993), and in New Zealand (Lamb& Vella 1987). At Fosha, Berberian (1979a) recorded a westwarddipping thrust fault with cumulative slip of 5.6 m, which moved by7 cm in 1978 (Fig. 7c). This was one of many surface rupturesactivated in 1978 that showed dips apparently inconsistent with thesource parameters determined from seismological investigation (seeFig. 2b). However, the dip of this minor fault is close to that of thesteeply dipping folded Neogene deposits that underlie the gravel sur-faces, and it is probable that the fault represents repeated bedding-plane slip within the Neogene sediments, with the 5.6 m of offsetaccumulating through slip in many earthquakes (Fig. 7d). Althoughour arguments are based on the northern part of the Tabas system,where access in the field is possible, similar relationships are seenthroughout the fold system.
Bedding-slip might not have caused all of the high-angle co-seismic ruptures that were recorded within the folds (see Fig. 2).Some of these were interpreted as steep splay faults that link witha gently dipping master fault at depth (Berberian 1979a). However,it now seems likely that many were superficial structures relatedto fold growth and that at least some were probably normal faultsaccommodating extension above growing anticlines. There are manyexamples in which co-seismic folding is accommodated by normalfaulting along the fold axis, such as at Sefidabeh in eastern Iran(Berberian et al. 2000), the Gobi-Altay of Mongolia (Bayasgalanet al. 1999b) and El Asnam in Algeria (Yielding et al. 1981).
3.3.2 Geomorphic evidence for thrust faulting at depth
The results from seismology and the locations and types of co-seismic rupturing indicate that the surface folding is linked to faultmovements at depth. Several of the folds (e.g the Fosha and Khos-rowabad segments, see Fig. 2) have steeply dipping beds at both theirwestern and eastern margins (also reflected in co-seismic ruptures,see Fig. 2b), presumably indicating opposing reverse faults beneath
C© 2003 RAS, GJI, 152, 749–765

Thrust faulting in eastern Iran 759
Figure 9. Cartoon cross-section through the Sardar fold segment. Surface folding has a wavelength of ∼4 km, relating to the depth at which the underlyingthrust steepens toward the surface. Widespread drainage incision east of the fold implies uplift on a gently eastward-dipping thrust at depth (which is consistentwith seismological results, see Figs 3 and 4). Thrust faulting at the edge of the Shotori mountains appears to be inactive at the surface and does not displacealluvial gravels, although strike-slip faulting is seen to the south of the Sardar river along the mountain range front (Figs 2a and 10). A strike-slip componentwithin the folds is indicated by seismology and surface ruptures. Other folds in the Tabas system show slight variation from this cartoon. Several segments(e.g. Fosha and Khosrowabad) appear to have both frontal and back-thrusts. Also, the asymmetric drainage incision is less clear in the westernmost folds(e.g. Khosrowabad), and might imply that the underlying thrust is almost flat. We have inferred dips within the Neogene sediments. However, the sedimentaryrelationships will depend on whether earlier sediments were deposited in the footwall of an active range-front fault, in which case the units would thickentowards the range-front.
each flank (as in Fig. 7d). But the overall vergence of folding is inall cases to the west. This indicates that the eastward dipping faultswhich underlie the western margins of the folds are dominant. How-ever, it would be difficult to see this without detailed field mapping.Drainage networks provide further information and are discussedbelow.
The Fosha (Fig. 6) and Sardar (Fig. 8) folds provide good ex-amples. Each has a clear asymmetry to the drainage patterns thatsurround it. West of the folds there is no drainage incision, withwestward flowing rivers forming active alluvial fans as they leavethe folds. However, east of the folds, widespread incision contin-ues for ∼10 km into the Shotori mountains. This indicates that theregion east of the folds is uplifting with respect to the region westof the folds, presumably on a fault that dips eastwards beneath thefolds. The clearest example of this is the Sardar river (Figs 5d-eand 8a), which cuts a very narrow gorge up to 100 m deep. Sec-tions drawn through the Fosha (Fig. 6c) and Sardar (Fig. 8c) foldsindicate ∼40 m of height difference of the alluvial surface acrossthe fold. This fan surface can be traced through the folds (e.g thelight-coloured fan in Fig. 8a), implying ∼40 m of uplift (and there-fore incision) has occurred across the folds since the fan was de-posited. The Sardar gorge leaves the Shotori mountain range ∼40 mbelow a well preserved river terrace (Fig. 5f) that passes into theextensive gravel fans on the plain (Fig. 5g). The range front doesnot interrupt this terrace level, indicating that the range front faulthas been inactive at the surface at least since the development ofthe uplifted terrace. This indicates a migration of activity awayfrom the range front and is very similar to examples from theTien Shan (Avouac et al. 1993) and Mongolia (Bayasgalan et al.1999b) where activity is also inferred to have migrated away from themain range-front, presumably in response to stresses generated bytopography.
Fig. 9 is a cartoon cross-section through the Sardar fold segment(see Fig. 8 for location). The proposed configuration is simple and
consistent with the geomorphology, earthquake source parametersand co-seismic ruptures. Slip on a gently east-dipping fault drivesfold growth and secondary faulting in alluvial gravels west of theShotori mountains. This implies a westward migration of activityat the surface. However, the Tabas faults probably interact with re-activated inherited structures of the Shotori mountains at mid tolower crustal levels (Berberian 1982). Right-lateral shear is presentin both co-seismic ruptures and in strike-slip faults that cut alluviumand displace river systems along the western margin of the Shotorimountains (Fig. 10). A right-lateral component is also determinedfor the earthquakes in 1978, 1979 and 1980, and presumably relatesto the role of the Tabas thrust in accommodating strike-slip mo-tion at the end of the Nayband fault to the south, perhaps by localrotational deformation (Fig. 1c).
We conclude that all the major parts of this interpretation canbe inferred directly from the landscape, illustrating that if we knowwhat signs to look for, we can identify zones of active thrust fault-ing even if they have not experienced recent earthquake activity,and even if no discrete fault scarps are reported at the surface. Sev-eral authors have described the geomorphic expression of long-termfault-driven folding (Bayasgalan et al. 1999b; Keller et al. 1998;Oskin et al. 2000), the response of drainage systems and sedimen-tation to localised tectonic uplift (e.g. Burbank et al. 1996) andthe forcing of surface deformation by discrete earthquake events(e.g. Berberian et al. 2001). By combining observations of seismic-ity, co-seismic surface deformation, and geomorphic indications oflong-term folding and uplift we produce a simple and self-consistentpicture of the faulting at Tabas.
4 FE R D O W S
We have shown that indications of active faulting at Tabas are presentin the landscape. We now use the observations made at Tabas toinvestigate two thrust earthquakes in 1968 near Ferdows (Fig. 1c).
C© 2003 RAS, GJI, 152, 749–765

760 R. Walker, J. Jackson and C. Baker
Figure 10. Right-lateral strike-slip faulting, displacing river courses and alluvium within the Shotori mountains. From north to south (see Fig. 2, for locations).(a) ASTER view of drainage displaced by ∼2 km near Espakh. (b) 4 km displacement of alluvial gravels and drainage. The old Espakh-Dehuk road followsthe displaced river channel. (c) ∼300 m displacement of young alluvial fans. (d) The northern end of the Nayband fault at Ab-e-Garm-va-Sard. The faultingcuts young salt deposits in dry lake beds and continues north along the western margin of the Shotori mountains.
C© 2003 RAS, GJI, 152, 749–765

Thrust faulting in eastern Iran 761
Figure 11. (a) LANDSAT TM mosaic of the Ferdows region. Thrust faulting is inferred beneath the region of uplifted and tilted alluvium and river terraces(marked by black arrows). This is some 10 km from the present-day mountain range front, which is defined by an older thrust fault (marked as a white toothedline). Possible co-seismic surface ruptures (Ambraseys & Melville 1982) are shown as a black dotted line northeast of Ferdows. Right-lateral surface rupturesof the Dasht-e-Bayas earthquake (Ambraseys & Tchalenko 1969) are marked as solid black lines. Fault plane solutions for the two Ferdows earthquakes (seeFig. 14) are in black. Epicentres are from the catalogue of Engdahl et al. (1998) and may be inaccurate by up to 15 km for events after 1970, and by more forearlier events. Box shows location of Fig. 11(b). (b) LANDSAT TM close-up of uplifted Quaternary terraces and alluvium and incised river channels east ofFerdows. The NE–SW trending grey and white lithologies are eastward dipping Neogene conglomerates and marls.
Neither produced surface faulting that was recognised at the time,nor were active faults identified in their epicentral region prior tothe earthquakes. Using the landscape, we can relate the earthquakesto surface uplift in the epicentral region, which in turn is related toslip on an underlying thrust fault. We also identify signs of recentfaulting in the field.
4.1 Geological and tectonic setting
Ferdows (Fig. 11a) lies on an alluvial plain west of the Kuh-e-Kalat, Kuh-e-Siah and Kuh-e-Tun mountain ranges. These are com-posed of heavily deformed Jurassic sediments, with small amountsof older limestones and Tertiary volcanics (dacitic lava and pyro-clastics) and granites. The western margin of these mountains isbounded by a substantial thrust fault (marked as white toothed lineon Fig. 11a), which can easily be traced in the field, as the distinc-tive blue fault gouge is quarried as a roofing material (Fig. 12a).Drainage from the Kuh-e-Kalat range flows westwards towards oneof several clay and salt flats. These depressions constitute localbase-levels and are internally draining. Quaternary alluvial depositsshed from the western margin of the Kuh-e-Kalat range cover aneastward-dipping sequence of Neogene marls and conglomerates(Eftekhar-Nezhad & Ruttner 1970). The alluvial and fluvial de-posits are slightly folded and show prominent drainage incisionfor a distance of ∼10 km west of the range front (Fig. 11b). Weinfer below that this incision reflects surface uplift and foldingabove a thrust fault (black arrows on Fig. 11a, shown in detail onFig. 11b).
4.2 Recent seismic and long-term deformation at Ferdows
Satellite imagery shows a clear western limit of river incision anduplift of alluvium and river terraces along a line trending ∼320◦
(Fig. 11) that is also clear in the field (Fig. 12b-c). River inci-sion continues east of this line into the Kuh-e-Kalat mountains.The dips of river terrace deposits steepen towards the southwesternflank of the fold (Fig. 12c). Unconformable relationships betweenolder (steeper) and overlying gravels were seen in several localities(Fig. 12c-d). This asymmetry of folding and drainage incision isreminiscent of Tabas and shows that the surface folding is relatedto an eastward dipping structure at depth. Direct evidence of fault-ing is shown in Fig. 12(g)–(h), where uplifted river terraces that arenear-horizontal 200 m NE of the frontal scarp are tilted to ∼70◦ overless than 5 m distance at the scarp itself, caused by collapse of theupthrown block where co-seismic faulting has reached the surface(Fig. 13). Similar effects were seen after the 1980 El Asnam earth-quake (Yielding et al. 1981). It is probable that faulting was parallelto bedding in underlying Neogene marls, which are exposed nearbyand dip ∼30◦ E (Fig. 12f). The overall wavelength of the surfaceuplift is ∼15 km, and we therefore expect the underlying fault toextend to a similar depth. This is supported by the source parametersof the 1968 earthquakes (see below).
The Neogene deposits that outcrop beneath fluvial and alluvialgravels dip eastwards right across the folded region, even wherethe overlying gravels have been folded over to steep westward dips(Fig. 12e-f). This implies that the eastward dip of the Neogene bedspre-dates the present-day folding and represents deposition in thefootwall of the older, more easterly thrust fault (the white toothed
C© 2003 RAS, GJI, 152, 749–765

762 R. Walker, J. Jackson and C. Baker
Figure 12. (a) Photograph of exposed fault-zone in Quarry at Amrudkhan (34◦ 14′ .014N 58◦ 21′ .336E). The fault gouge dips ∼ 40◦ E. (b) View lookingeastwards at uplifted fluvial and alluvial deposits that are incised by rivers. The western break in incision is sharp. The bed-rock mountains of Kuh-e-Kalatare ∼15 km away. (c) Looking NW at the wall of a river cutting at 34◦ 07′ .801N 58◦ 17′ .499E, bedding in alluvial gravels show growth in the flank of thefold. Individual beds steepen westwards and also truncate underlying steeper beds. (d) Unconformable relationships in alluvial gravels at 34◦ 08′ .949N 58◦16′ .592E. (e) Looking southeast across an incised river at 34◦ 06′ .53N 58◦ 19′ .036E. Two uplifted terrace levels can be seen. (f) Close-up of the river cuttingin Fig. 12(e). Young river terraces are almost horizontal, but underlying Neogene deposits dip ∼30◦ E. (g) Collapsed fold flank at 34◦ 06′ .368N 58◦ 18′ .843E,∼100 m southwest of Fig. 12(f). Uplifted river gravels are horizontal in the right of the picture, but steepen rapidly in the left. (h) Gravel beds steepen rapidlyin less than 10 m. This may be showing collapse of the fold flank where faulting has reached almost to the surface.
C© 2003 RAS, GJI, 152, 749–765

Thrust faulting in eastern Iran 763
Figure 13. Cartoon showing how the relationships seen in Fig. 12(g-h) mayhave formed. The main rupture was on a plane dipping at ∼30◦. Near thesurface, the fault shallows out and causes the flank of the fold to collapse.Minor normal faulting might be expected at the crest of the fold.
line in Fig. 11a). A westward migration of active faulting wouldaccount for the prominent zone of folding and uplift of alluvialand river terrace material between the frontal scarp and the mainmountain front (Fig. 11). This interpretation is similar to that shownin Fig. 9 for Tabas. If the eastward-dipping Neogene deposits weredeposited in the footwall of the range-front fault when it was active,
Figure 14. Final inversion results for the two Ferdows earthquakes of (a) 1968 September 01, and (b) 1968 September 04.
we would expect the beds to thicken eastwards, but we do not knowif this is the case.
Long-period P and SH body waves were inverted to obtain theearthquake source parameters using the same method as for Tabas.The two solutions are shown in Fig. 14 and Table 2. They are sim-ilar, both showing thrust motion on planes dipping 34 and 37◦ NE.and with strike directions close to the ∼320◦ trend of the folds de-scribed above. The epicentres of the 1968.09.01 and 1968.09.04Ferdows earthquakes relocated by Engdahl et al. (1998) are all sit-uated to the SW of Baghestan and apparently in the footwall ofthe fault inferred along the frontal scarp. No surface deformationis apparent at these epicentral locations. Possible co-seismic rup-tures were reported east of Bagestan, within the fold describedabove (Jackson & Fitch 1979; Ambraseys & Melville 1982) butwere not visited at the time by reliable observers. Furthermore,the epicentres are expected to be offset from their true positionby at least 10 km (Berberian 1979b). As the Ferdows fold is theonly known Quaternary structure that is obviously active within10 to 15 km of the reported epicentres, and where possible co-seismic ruptures were developed, it seems likely that the Ferdows
C© 2003 RAS, GJI, 152, 749–765

764 R. Walker, J. Jackson and C. Baker
earthquakes occurred on faults beneath this folding, though we can-not prove this.
In conclusion, even though we have very little knowledge of theground deformations associated with the 1968 Ferdows earthquakes,we can again use observations of the geomorphology to show long-term folding to the east of Ferdows. The asymmetry of the foldingimplies that it overlies an eastward dipping fault that projects to thesurface near the frontal scarp at Baghestan. Once again, indicationsof folding, linked to active earthquake-generating thrust faulting arethere in the landscape and are clear in satellite imagery. The present-day activity is again seen to have migrated away from the mountainrange-fronts and is expressed at the surface as folding in alluvialgravels.
5 I M P L I C A T I O N S F O R E A R T H Q U A K EH A Z A R D I N E A S T E R N I R A NA N D E L S E W H E R E
The towns of Tabas and Ferdows were not identified as zones at highrisk from seismic activity until destructive earthquakes occurred onfaults near them. In Tabas, over 20,000 people died and many set-tlements were destroyed. The identification of active blind thrustingis obviously important for estimating seismic hazard. The imageinterpretation and field data presented in this paper show numerousindications of long-term fold growth that is related to movementon eastward-dipping thrust faults at depth. Such indications cannotshow conclusively that a structure is seismically active as movementsmay occur aseismically (as we suspect is the case in the growth seenon the Shahdad blind thrust in central Iran, described in Berberianet al. (2001). Also, we can only say that growth has occurred in therecent past, and without the use of palaeoseismological or exposuredating techniques on uplifted surfaces we cannot be precise aboutthe exact age and duration of uplift (unlike, for example, at WheelerRidge in California or central Otago in New Zealand; Keller et al.1998; Jackson et al. 2002). However, study of the geomorphol-ogy can highlight the potential for earthquakes to occur on a givenstructure (e.g. Oskin et al. 2000), and allow identification of similarsurface features to those found at Tabas and Ferdows, even withoutguidance from previous recorded seismicity.
6 C O N C L U S I O N S
Indications of active, fault-driven folding and drainage incision arepresent in the landscape in both Tabas and Ferdows. Modern satelliteimagery enhances our ability to see the sometimes subtle patternsof uplift and drainage incision. If we had known how to interpretthese signs, the potential for destructive earthquakes in these regionscould have been properly assessed. This is an important lesson forseismic hazard evaluation, not only in Iran, but also other regionsof active continental deformation where thrust faulting is known tooccur, but where the faulting itself does not produce clear, discretescarps at the surface. Studies of this sort can also shed light on thelong-term development and evolution of the fault zones.
A C K N O W L E D G M E N T S
We would like to thank M.T. Khorehei and M. Qorashi of the Geo-logical Survey of Iran in Tehran for their continued support of ourwork and for enabling us to visit the region in several field seasons.M. Talebian and Dan McKenzie made valuable contributions duringthe fieldwork. We thank M. Berberian for making available detailedmaps of the 1978 co-seismic ruptures, and E. Keller and J. Shawfor helpful reviews. A digital elevation model was produced with
the kind assistance of B. Parsons and T. Wright at the University ofOxford. RW was supported by a NERC studentship. This work wassupported by the NERC Centre for the Observation and Modellingof Earthquakes and Tectonics (COMET). This is Cambridge EarthScience Contribution No. 7076.
R E F E R E N C E S
Ambraseys, N.N. & Tchalenko, J.S., 1969. The Dasht-e-Bayaz (Iran) earth-quake of August 31, 1968: A field report, Bull. Seism. Soc. Am., 59,1751–1792.
Ambraseys, N.N. & Melville, C.P., 1982. A history of Persian earthquakes,Cambridge University Press, Cambridge.
Avouac, J.P., Tapponnier, P., Bai, M., You, H. & Wang, G., 1993. Activethrusting and folding along the northern Tien Shan and Late Cenozoicrotation of the Tarim relative to Dzungaria and Kazakhstan, J. geophys.Res., 98, 6755–6804.
Bayasgalan, A., Jackson, J., Ritz, J-F. & Carretier, S., 1999. Field examples ofstrike-slip fault terminations in Mongolia and their tectonic significance,Tectonics, 18, 394–411.
Bayasgalan, A., Jackson, J., Ritz, J-F. & Carretier, S., 1999b. ‘Forebergs,’flower structures, and the development of large intracontinental strike-slip faults: the Gurvan Bogd fault system in Mongolia, J. struc. geol., 21,1285–1302.
Berberian, M., 1979a. Earthquake faulting and bedding thrust associatedwith the Tabas-e-Golshan (Iran) earthquake of September 16, 1978, Bull.seism. Soc. Am., 69, 1861–1887.
Berberian, M., 1979b. Evaluation of instrumental and relocated epicentresof Iranian earthquakes, Geophys. J. R. astr. Soc., 58, 625–630.
Berberian, M., Asudeh, I., Bilham, R.G., Scholz, C.H. & Soufleris, C., 1979.Mechanism of the main shock and the aftershock study of the Tabas-e-Golshan (Iran) earthquake of September 16, 1978: A preliminary report,Bull. seism. Soc. Am., 69, 1851–1859.
Berberian, M., 1982. Aftershock tectonics of the 1978 Tabas-e-Golshan(Iran) earthquake sequence: a documented active ‘thin- and thick-skinnedtectonic’ case, Geophys. J. R. astr. Soc., 68, 499–530.
Berberian, M., Jackson, J.A., Qorashi, M., Talebian, M., Khatib, M.M. &Priestley, K., 2000. The 1994 Sefidabeh earthquakes in eastern Iran: blindthrusting and bedding-plane slip on a growing anticline, and active tec-tonics of the Sistan suture zone, Geophys. J. Int., 142, 283–299.
Berberian, M. et al., 2001. The 1998 March 14 Fandoqa earthquake (Mw 6.6)in Kerman province, southeast Iran: re-rupture of the 1981 Sirch earth-quake fault, triggering of slip on adjacent thrusts and the active tectonicsof the Gowk fault zone, Geophys. J. Int., 146, 371–398.
Boudiaf, A., Ritz, J.-F. & Philip, H., 1998. Drainage diversions as evidenceof propagating active faults: example of the El Asnam and Thenia faults,Algeria, Terra Nova, 10, 236–244.
Bullard, T.F. & Lettis, W.R., 1993. Quaternary fold deformation associatedwith blind thrust faulting, Los Angeles basin, California, J. geophys. Res.,98, 8349–8369.
Burbank, D., Meigs, A. & Brozovic, N., 1996. Interactions of growing foldsand coeval depositional systems, Basin Research, 8, 199–223.
Eftekhar-Nezhad, J. & Ruttner, A., 1970. Geological Survey of Iran Geolog-ical quadrangle map of Iran No. J6 (Ferdows sheet), scale 1:250,000.
Engdahl, E.R., van der Hilst, R. & Buland, R., 1998. Global teleseismicearthquake relocation with improved travel times and procedures for depthdetermination, Bull. seism. Soc. Am., 88, 722–743.
Hauksson, E. & Jones, L.M., 1989. The 1987 Whittier Narrows earthquakesequence in Los Angeles, southern California: Seismological and tectonicanalysis, J. geophys. Res., 94, 9569–9589.
Hauksson, E., Jones, L.M. & Hutton, K., 1995. The 1994 Northridge earth-quake sequence in California: Seismological and tectonic aspects, J. geo-phys. Res., 100, 12 335–12 355.
Jackson, J.A. & Fitch, T.J., 1979. Seismotectonic implications of relocatedaftershock sequences in Iran and Turkey, Geophys. J. R. astr. Soc., 57,209–229.
Jackson, J.A., Haines, J. & Holt, W., 1995. The accommodation of Arabia-Eurasia plate convergence in Iran, J. geophys. Res., 100, 15 205–15 219.
C© 2003 RAS, GJI, 152, 749–765

Thrust faulting in eastern Iran 765
Jackson, J.A., Norris, R. & Youngson, J., 1996. The structural evolution ofactive fault and fold systems in central Otago, New Zealand: evidencerevealed by drainage patterns, J. struc. geol., 18, 217–234.
Jackson, J.A., Ritz, J.-F., Siame, L., Raisbeck, G., Yiou, F., Norris, R.,Youngson, J. & Bennett, E., 2002. Fault growth and landscapedevelopment rates in Otago, New Zealand, using in situ cosmogenic 10Be,Earth planet. Sci. Lett., 195, 185–193.
Keller, E.A., Zepeda, R.L., Rockwell, T.K., Ku, T.L. & Dinklage, W.S.,1998. Active tectonics at Wheeler Ridge, southern San Joaquin Valley,California, Bull. geol. soc. Am., 110, 298–310.
Lamb, S.H. & Vella, P., 1987. The last million years of deformation inpart of the New Zealand plate-boundary zone, J. struc. geol., 9, 877–891.
McCaffrey, R. & Abers, G., 1988. SYN3: a program for inversion of teleseis-mic body waveforms on microcomputers, Air Force Geophysical Labora-tory Technical Report, AFGL-TR-88-0099, Hanscomb Air Force Base,MA.
McCaffrey, R., Zwick, P. & Abers, G., 1991. SYN4 Program, IASPEI Soft-ware Library, 3, 81–166.
Meyer, B., Tapponnier, P., Bourjot, L., Metivier, F., Gaudemar, Y., Peltzer,G., Shunmin, G. & Zhitai, C., 1998. Crustal thickening in Gansu-Qinghai,lithospheric mantle subduction, and oblique, strike-slip controlled growthof the Tibet plateau, Geophys. J. Int., 135, 1–47.
Nabelek, J., 1984. Determination of earthquake source parameters from in-version of body waves, PhD thesis, MIT, Cambridge MA.
Niazi, M. & Kanamori, H., 1981. Source parameters of 1978 Tabas and 1979Qainat, Iran, earthquakes from long-period surface waves, Bull. seism.Soc. Am., 71, 1201–1213.
Oskin, M., Sieh, K., Rockwell, T., Miller, G., Guptill, P., Curtis, M., McArdle,S. & Elliot, P., 2000. Active parasitic folds on the Elysian Park anticline:Implications for seismic hazard in central Los Angeles, California, Bull.geol. soc. Am., 112, 693–707.
Shoja-Taheri, J. & Anderson, J.G., 1988. The 1978 Tabas, Iran, earthquake:an interpretation of the strong motion records, Bull. seism. Soc. Am., 78,142–171.
Scholz, C., 1982. Scaling laws for large earthquakes: consequences for phys-ical models, Bull. seism. Soc. Am., 72, 1–14.
Silver, P.G. & Jordan, T.H., 1983. Total-moment spectra of fourteen largeearthquakes, J. geophys. Res., 88, 3273–3293.
Stocklin, J., Eftekhar-Nezhad, J. & Hushmand-zadeh, A., 1965. Geologyof the Shotori Range (Tabas area, East Iran), Geological survey of Iran,Report No. 3.
Taymaz, T., Jackson, J. & McKenzie, D., 1991. Active tectonics of the northand central Aegean Sea, Geophys. J. Int., 106, 433–490.
Yielding, G., Jackson, J.A., King, G.C.P., Sinvhal, H., Vita-Finzi, C. & Wood,R.M., 1981. Relations between surface deformation, fault geometry, seis-micity, and rupture characteristics during the El Asnam (Algeria) earth-quake of 10 October 1980, Earth planet. Sci. Lett., 56, 287–304.
Zwick, P., McCaffrey, R. & Abers, G., 1995. MT5 Program, IASPEI SoftwareLibrary 4.
C© 2003 RAS, GJI, 152, 749–765


![Neotectonics of Tabas Area, Central Iran by Index of ...Active, Tectonics, Index, Tabas, Central Iran 1. Introduction The study area is the north part of Tabas area [1] in the east-central](https://img.pdfslide.us/doc/110x75/60c7cd682ac9086ca8179434/neotectonics-of-tabas-area-central-iran-by-index-of-active-tectonics-index.jpg)