Embed Size (px)
Citation preview

Ocean Sci., 6, 191–209, 2010www.ocean-sci.net/6/191/2010/© Author(s) 2010. This work is distributed underthe Creative Commons Attribution 3.0 License.
Ocean Science
Surface expression of Mediterranean Water dipoles and theircontribution to the shelf/slope – open ocean exchange
N. Serra1,2, I. Ambar 2, and D. Boutov2
1Institut fur Meereskunde, Universitat Hamburg, Germany2Centro de Oceanografia, Faculdade de Ciencias da Universidade de Lisboa, Portugal
Received: 15 October 2009 – Published in Ocean Sci. Discuss.: 11 November 2009Revised: 2 February 2010 – Accepted: 5 February 2010 – Published: 9 February 2010
Abstract. The generation of dipolar eddies within theMediterranean Water (MW) layers, at the Portuguese con-tinental slope, was observed using subsurface RAFOS floats.The surface expression of these mid-depth dipoles is herecharacterized with remote sensing data, namely with sea sur-face temperature, chlorophyll concentration and sea surfaceheight measurements. Two cases are presented demonstrat-ing the remote detection of these underwater structures inthe Gulf of Cadiz during 1998 and 2001. The presenceof subsurface MW dipoles in the Iberian coastal zone isshown to influence the development of coastal upwelling fila-ments. The surface circulation induced by the dipoles causesthe upwelling filaments to extend offshorewards and thus toenhance the transport of physical, chemical and biologicalproperties into the open ocean. A numerical model sim-ulation of the ocean circulation around the Iberian Penin-sula forced by heat and freshwater fluxes (computed usingthe NCEP reanalysis atmospheric state) and by the overflowof MW at the Strait of Gibraltar, corroborates the connec-tion between the surface and the mid-depth flows. The high-resolution numerical experiment is used to help clarifying theoccurrence of the MW dipoles surface expression and the im-pact of these dipoles on the eddy kinetic energy of the upperocean and on the exchange of volume and salt between theshelf/slope and the open ocean.
1 Introduction
The Mediterranean Water (MW) spreads in the northeasternpart of the Gulf of Cadiz as a bottom-gravity current (Ambarand Howe, 1979; Baringer and Price, 1997). Approaching
Correspondence to:N. Serra([email protected])
the Portimao Canyon (around 8◦ W), the flow stabilizes inthe water column and continues flowing against the Iberiancontinental slope as a wall-bounded mid-depth intensified jetknown as MW Undercurrent. This current persists along theAtlantic eastern boundary and is thought to reach latitudesof up to 55◦ N. Along its path, the current at times sepa-rates from the slope forming eddies. These eddies (termedmeddies) are coherent vortices rotating anticyclonically andenclosing in their cores the MW high salinity and tempera-ture anomaly. Their dimensions range from 25 to 100 km indiameter, in the vertical they can extend up to 800 m, theiraverage azimuthal velocity is 0.3 ms−1 and their typical driftspeed is in the range 0.02–0.04 ms−1, although it can varydue to advection by background currents and/or eddy inter-actions.
Many studies dealt with the characterization of the phys-ical and dynamical aspects of meddies and these were car-ried out prior to the clear identification of the generationsites. Meddies were first found in the Canary basin as iso-lated monopolar structures (e.g.,Armi and Zenk, 1984; Armiet al., 1989; Schultz-Tokos and Rossby, 1991) and later in theIberian basin (e.g.,Kase et al., 1989; Zenk et al., 1992; Pin-gree and Cann, 1993). However, meddies were mostly ob-served at locations westwards from Cape St. Vincent (9◦ W;37◦ N). An exception was the meddy found byPrater andSanford(1994), which was east of that Cape. A few meddygeneration sites have been established and observations havegiven some insight into the generation mechanisms involved.Bower et al.(1997) concluded that Cape St. Vincent andthe Estremadura Promontory are sites for meddy generation.Other studies also pointed to meddy generation related withthe Undercurrent separation at Cape Finisterre (Paillet et al.,1999) and at the Gorringe Bank (Serra and Ambar, 2002) andwith the Undercurrent instability promoted by the PortimaoCanyon (Cherubin et al., 2000; Serra and Ambar, 2002).
Published by Copernicus Publications on behalf of the European Geosciences Union.

192 N. Serra et al.: Surface expression of MW dipoles
Cyclonically rotating vortices have been also found withinor below the MW layers (Swallow, 1969; Schauer, 1989),but no clear relation with the meddies was established inthese earlier studies. Some authors reported the interactionbetween different meddies.Schultz-Tokos et al.(1994) ob-served the merging of two meddies andCarton et al.(2002)reported the interaction between two meddies and a cyclonein the southern Gulf of Cadiz. The coupling between cy-clones and anticyclones was investigated numerically inKaseand Zenk(1996), the authors having recognized the cy-clone’s importance for the meddy movement. Sporadic floatobservations of cyclone-anticyclone coupling were reportedin Richardson et al.(2000). In situ observations and physicalsimulations have shown that cyclones also play an impor-tant role in the generation of meddies, by helping its detach-ment from the Undercurrent at Cape St. Vincent by meansof dipole formation (Sadoux et al., 2000; Serra et al., 2002).The definite clear identification of MW dipoles was reportedin Serra and Ambar(2002).
A large amount of theoretical, physical and numericalstudies has been devoted to the generation and movement ofdipolar structures in homogeneous or stratified flows, eitheron thef or on theβ plane (e.g.,Mied et al., 1991; Velasco-Fuentes and van Heijst, 1994; Eames and Flor, 1998). Thedipole, also termed modon, is an exact nonlinear solutionof the quasi-geostrophic potential vorticity equation (Flierlet al., 1980). It consists of a quasi-symmetric current sys-tem (two vortices with opposite sign rotation – anticycloneand cyclone) that distributes passive tracers in a way formingmushroom-like patterns. According toFedorov(1986), thedipole is one of the most widespread forms of non-stationaryand non-linear motion in the ocean. Many studies reportedobservations of surface layer dipolar structures using remotesensing methods (e.g.,Ginzburg et al., 2002; Afansyev et al.,2002) and the important contribution of these dipoles to thecoastal/deep-basin water exchange was recognized. Due totheir high drift speed, the dipoles are able to advect proper-ties very efficiently. In particular, they are able to redistributenutrients in the coastal area.
The generation of dipoles in the MW Undercurrent is lo-calized in places where there is a lateral injection of weaklystratified (low-potential vorticity) water into an almost qui-escent environment, in this case the ocean interior. Thus, theseparation of the Undercurrent from the slope forced by a to-pographic constraint is a necessary condition (Serra et al.,2005). This separated patch is an input of momentum intothe interior. The simplest form of response to this local-ized (almost point-source) momentum is the generation ofcounter-rotating vortices. Laboratory measurements (Baeyet al., 1995) showed that dipolar vortices could be generatedby this momentum input in a homogeneous rotating environ-ment.
The surface detection of deep meddies using surfacedrifters or hydrological measurements was reported in thepast (Kase and Zenk, 1989; Schultz-Tokos et al., 1994; Pin-
gree and Cann, 1993; Pingree, 1995). Stammer et al.(1991)were able to correlate positively the altimetry signal withthe dynamic height at the MW level.Oliveira et al.(2000)showed the existence of SST patterns whose shape was con-sistent with the circulation induced by meddies revealed bythe AMUSE project RAFOS floats (Bower et al., 1997). Theauthors concluded that a necessary condition for the surfacerecognition of meddies is the existence of surface thermalgradients that could act as tracers for the eddy movement.
The most prominent feature of the upper ocean dynam-ics off the western Iberian Peninsula is its coastal upwelling.Coastal upwelling is a wind-driven phenomenon usuallyconnected with a decrease of SST and an increase of pri-mary production in the coastal ocean. It occurs under windfavourable conditions (coast on the left of the wind direc-tion in the Northern Hemisphere) along the eastern sides ofthe major ocean basins, as a consequence of Ekman off-shore transport and resulting surface divergence along thecoast. Due to mass continuity, this surface divergence in-duces an ascending motion (upwelling) of subsurface wa-ter which is usually colder and nutrient richer than the sur-face water. Besides the cross-slope thermal gradient, it alsocreates a sea surface slope, giving rise, by geostrophic ad-justment, to an equatorward jet parallel to the coast. If theupwelling-favourable wind blows for sufficient time, a ther-mal and density front forms which separates cold coastalwaters from warmer offshore waters and where horizontalvelocity shear causes barotropic and baroclinic instabilities.The export of upwelled water to the open ocean is locally en-hanced by meanders and the associated development of fila-ment structures extending offshore. Filaments export a muchlarger mass along their principal axis than expected by Ek-man circulation, thus constituting an important mechanismof exchange between coastal and deep sea waters (Relvaset al., 2007).
The Iberian coastal upwelling is a seasonal phenomenonstarting in late spring/early summer as a response to predom-inantly northerly winds. The near surface wind field is basi-cally controlled by the Azores high, the centre of which mi-grates along 38◦ W, from 27◦ to 33◦ N between March andAugust. The associated atmospheric circulation off Iberiachanges from weak westerly winds in winter to northerly andnorthwesterly stronger winds in summer (Fiuza, 1982). Bothobservations and modelling (Oliveira et al., 2009) show a de-crease in SST of about 2–2.5◦C along the coast during thewind intensification phase with a one-day lag between thepeak of northerly winds and minimum SST.
The generated upwelling front is characterized by sharplateral gradients in velocity, density and biological fields. InSST images off Iberia, besides filaments, smaller scale in-stabilities with wavelengths of about 15–30 km are visible(Shi and Røed, 1999). Haynes et al.(1993) presented threeformation mechanisms of filaments: dynamical instability,topographic forcing and geostrophic turbulence. Filamentsoff Iberia show relatively weak dynamical structure, with the
Ocean Sci., 6, 191–209, 2010 www.ocean-sci.net/6/191/2010/
N. Serra et al.: Surface expression of MW dipoles 193
offshore flow restricted to the 100-m surface layer, as a resultof surface-trapped horizontal density gradients (Relvas et al.,2007). A portion of the water transported offshore from theshelf re-circulates back on time scales of about 1 month (Bar-ton et al., 2001). Filaments off Iberia are recurrently locatedin several fixed points (around 41◦ N, 40◦ N, 38.5◦ N, 38◦ Nand 37◦ N), which seem to be systematically associated withirregularities of the bathymetry or of the coastline (Fiuza,1982; Sousa and Bricaud, 1992; Haynes et al., 1993). Thissystematic association ledRøed and Shi(1999) to investigatethe effect of irregularities in the bathymetry and coastline ge-ometry on the formation, evolution and persistence of coolfilaments and other mesoscale structures in the coastal up-welling regions. They concluded that the preferred spacingof the filaments does not inherently depend on the existenceof those irregularities but rather on barotropic and baroclinicinstabilities. However the bathymetry and coastline geome-try irregularities are relevant for anchoring the filaments.
The upwelling filaments can reach 30–50 km offshore un-der calm conditions and 100–200 km during or shortly af-ter strong winds (Fiuza, 1983). Although they are predomi-nately driven by wind, the impact of the circulation inducedby eddies in the filament offshore extension has not beenclearly shown. This motivated our study, with two objec-tives: first to present two cases where the surface detectionof MW dipoles could be established based on four distinctdata sources, one in-situ and three satellite-derived; secondto demonstrate the role that sub-surface eddies (like med-dies) can play in momentum and property transfer from theshelf/slope to the deep-ocean. For that purpose, we analyzeresults from a high-resolution numerical simulation of theMW spreading off southern and western Iberia and its inter-action with the upper layers. Evidence will be given for aclear interaction between the MW undercurrent and associ-ated eddies and the surface circulation, which is mostly rel-evant for the across-slope exchange of physical and biogeo-chemical properties between the shelf and the deep-ocean.The interaction here presented, although being particular tothe Iberian Atlantic coastal zone, where the MW under-current sheds energetic eddies, is certainly ubiquitous andshould be present in all major World Ocean upwelling sys-tems (degree of importance to be determined), in particular inthose where deep undercurrents are present and prone to de-velop instabilities and generate eddies (for instance the Cali-fornia and the Benguela Current upwelling systems).
The paper is organized as follows. The observational dataand the numerical model set-up are presented in Sect. 2, fol-lowed by the description of the MW dipole observations inSect. 3. There, float trajectories are presented and the surfaceexpression of vortices is demonstrated using sea surface tem-peratures (SST), chlorophyll concentrations (CHL) and seasurface height (SSH) anomalies. Section 4 presents resultsfrom the numerical simulations focusing on the interactionbetween the MW dipoles and the upper-ocean circulation.The main conclusions are summarized in Sect. 5.
2 In situ/satellite data and numerical model set-up
During the CANIGO and MEDTOP projects, 24 and 32 iso-baric RAFOS floats, respectively, were seeded in the MWUndercurrent upstream of the Portimao Canyon (grey box inFig. 1). The floats were deployed in the MW layer (nomi-nal depths varying between 800 m and 1200 m) during fivelarge-scale CTD cruises: two during CANIGO, in Septem-ber 1997 and January 1998, and three during MEDTOP, inFebruary, May and September 2001. The hydrological sur-veys were conducted to characterize the body of MW in thearea and help to choose the RAFOS deployment sites. Dur-ing CANIGO some floats were also deployed from aboarda sailing vessel after a quick XBT survey. The temporal coverof the float database is from September 1997 to July 1999 andfrom February 2001 to September 2002. More details on theobservational strategies and results from the CANIGO andMEDTOP projects can be found, respectively, inSerra andAmbar(2002) and inAmbar et al.(2008).
NOAA-12 and NOAA-14 AVHRR sensor data were re-ceived and processed at the HRPT satellite receiving stationof the Centro de Oceanografia da Universidade de Lisboa,Portugal. In the present analysis, only brightness tempera-ture of AVHRR channel 4 was considered, since the algo-rithms that use a combination of different infrared channelsto correct for atmospheric effects introduce a noise amplifi-cation factor that is not suitable to characterize spatial pat-terns (Oliveira et al., 2000). Clouds were separately detectedthrough a multi-band algorithm, which is part of the MultiChannel Sea Surface Temperature – MCSST – processing.The HRPT ocean colour images were received by the Mas-palomas Space Center, Canary Islands, Spain, and processedat the Centro de Oceanografia da Universidade de Lisboa. Inthe present work, the chl-a concentration parameter is used.All HRPT images have a horizontal resolution of 1.1 km.
The altimetry data used here consist in maps of SSHanomaly (SSHA) derived from a merging of ERS-1/2 andTopex/Poseidon data (LeTraon and Ogor, 1998) and weresupplied by AVISO. All the altimetry data was correctedfor instrumental noise, atmospheric effects, ocean surfacewaves, tides and the inverse barometer effect. The anomalieswere constructed from the sea surface heights by subtract-ing a 3-year mean from each satellite track of a given cycle.The horizontal distributions of SSHA were produced usinga space/time objective analysis (LeTraon et al., 1998). Themerging of the Topex/Poseidon and ERS-1/2 provides an im-proved space-time sampling of the ocean, since it takes profitfrom both the higher temporal resolution of Topex/Poseidonand the higher spatial resolution of ERS-1/2. The final hor-izontal resolution of the SSHA maps is 0.25 degrees both inlatitude and longitude. The database temporal resolution is10 days.
The model used in this study is thez-coordinate MITgeneral circulation model (Marshall et al., 1997). Themodel was configured to the Northeast Atlantic and Western
www.ocean-sci.net/6/191/2010/ Ocean Sci., 6, 191–209, 2010

194 N. Serra et al.: Surface expression of MW dipoles
15°W 13°W 11°W 9°W 7°W 5°W 33°N
34°N
35°N
36°N
37°N
38°N
39°N
40°N
41°N
42°N
43°N
Iberia
Cape St. Vincent
EstremaduraPromontory
Gorringe Bank
Gulf of Cadiz
PortimaoCanyon
Galicia Bank
Fig. 1. Map of the region showing the names of the major bathymetric features. The contour interval is200 m from 200–2000 m and 1000 m from 2000–5000 m.
29
Fig. 1. Map of the region showing the names of the major bathy-metric features. The contour interval is 200 m from 200–2000 mand 1000 m from 2000–5000 m.
Mediterranean regions, extending from 9◦ E to 24◦ W andfrom 30◦ N to 48◦ N, and has a resolution of 1/30◦ (approx.2.8 km). In the vertical, 140 levels are used, with verticalresolution varying from 5 m in the upper ocean to 100 min the deep ocean. The model bottom topography derivesfrom ETOPO2 and the initial temperature and salinity con-ditions from the January values of the World Ocean Atlas2005 (Boyer et al., 2005). The model is forced at the sur-face by fluxes of momentum, heat and freshwater computedusing bulk formulae and the 6-hourly atmospheric state fromthe NCEP reanalysis 1 (Kalnay et al., 1996). At the volume-balanced open boundaries, the model is forced by a 1/6◦ res-olution Atlantic solution of the MITgcm forced by the sameNCEP dataset. Vertical mixing is parameterized by the KPPformulation ofLarge et al.(1994). Background biharmoniccoefficients of horizontal diffusion and viscosity are, respec-tively, 1×10³m4s−1 and 5×10⁸m4s−1. Background lapla-cian coefficients of vertical diffusion and viscosity were both1×10−4m2s−1. Contrary to other published simulations atsimilar horizontal resolution (Drillet et al., 2005), sea surfaceor interior temperature and salinity relaxation was not ap-plied. Due to computational limitations, the model was onlyintegrated for 6 years starting at year 1990. The results herepresented correspond to the 3-year period 1993–1995. Allthe analyses will be based on daily model output. A previousunforced model run, using a sigma-coordinate model, wasanalysed bySerra et al.(2005), focusing on the MW plumetopographic splitting and meddy generation mechanisms. In
this work, we build from past results, extend the experimentto the surface and laterally forced case and further focus onthe vertical structure of the model generated MW eddies andtheir interaction with the upper layers.
3 Observations of MW dipoles and their surfaceexpression
3.1 CANIGO 1998 observations
3.1.1 Float trajectories
In order to visualize the temporal evolution of the flow field,float trajectories were segmented in periods of 40 days. Fig-ure 2 presents the results from the CANIGO study, from22 February 1998 (53/98) to 20 October 1998 (293/98),showing one meddy-cyclone (M1-C1) coupling at Cape St.Vincent and two dipole formations (M2-C2, M4-C4) offthe Portuguese southern continental slope near the PortimaoCanyon. These float observations have been extensively re-ported before in Serra and Ambar (2002). Here they are onlybriefly presented in order to introduce the location of the ed-dies detected using satellite remote sensing data.
During the period 53/98 to 133/98, cyclone C1 moveswestwards towards Cape St. Vincent and interacts withmeddy M1 promoting its detachment. C1 and M1 travelas a dipolar structure until reaching the Gorringe Bank(a seamount as shallow as 100 m), which further splits thestructure back into two single eddies (see period 93/98 to133/98). After 133/98, meddy M1 could not be further fol-lowed since the float left the eddy. Cyclone C1 was intensi-fied at 500 m depth, slightly above the MW layers, as con-cluded from the geostrophic flow computed with CTD datacollected during the February 1998 CANIGO survey takenprior to the floats deployment (Serra and Ambar, 2002).
The second MW dipole (M2-C2) can be seen in the period133/98 to 173/98, immediately after generation. Two floatsrevealed the anticyclonic counterpart (the meddy) and onefloat its cyclonic pole. During 173/98 to 213/98, the dipolemoved south and the float that once was in the meddy en-tered the cyclone and sampled it along the rest of its operat-ing cycle. Cyclone C2 continued along the slope to the north(213/98 to 253/98). The third MW dipole revealed by thefloats (M4-C4) was again shed from the MW Undercurrentnear Portimao Canyon (period 253/98 to 293/98). A floatdrifting at 1200 m revealed cyclone C4, whereas meddy M4was revealed by a 800 m float. C4 was further followed formore than 30 days while moving westwards south of the Gor-ringe Bank (not shown).
3.1.2 Surface tracer patterns
The methodology followed to assess the surface expressionof the located MW eddies consists in the superposition of allfloat data on remote sensing images and the establishment of
Ocean Sci., 6, 191–209, 2010 www.ocean-sci.net/6/191/2010/
N. Serra et al.: Surface expression of MW dipoles 195
12°W 11°W 10°W 9°W 8°W 7°W 6°W 33°N
34°N
35°N
36°N
37°N
38°N53/98 to 93/98
12°W 11°W 10°W 9°W 8°W 7°W 6°W 33°N
34°N
35°N
36°N
37°N
38°N93/98 to 133/98
12°W 11°W 10°W 9°W 8°W 7°W 6°W 33°N
34°N
35°N
36°N
37°N
38°N133/98 to 173/98
12°W 11°W 10°W 9°W 8°W 7°W 6°W 33°N
34°N
35°N
36°N
37°N
38°N173/98 to 213/98
12°W 11°W 10°W 9°W 8°W 7°W 6°W 33°N
34°N
35°N
36°N
37°N
38°N213/98 to 253/98
12°W 11°W 10°W 9°W 8°W 7°W 6°W 33°N
34°N
35°N
36°N
37°N
38°N253/98 to 293/98
M1
C1
M1
C1
C1 M2 C2
M2 C2
C2
M3 M3
C2
M4
C4
Fig. 2. Sequence of snapshots with floats trajectories divided in periods of 40 days from julian days 53/98to 293/98 (CANIGO project). Black trajectories correspond to floats operating at depths between 700 mand 1000 m and grey trajectories to floats drifting between 1000 m and 1300 m (the dot correspondsto the float last position in the shown period). Label M refers to meddies and label C to cyclones.Bathymetry is contoured from 200 m to 1800 m depth with a spacing of 400 m.
30
Fig. 2. Sequence of snapshots with floats trajectories divided in periods of 40 days from julian days 53/98 to 293/98 (CANIGO project).Black trajectories correspond to floats operating at depths between 700 m and 1000 m and grey trajectories to floats drifting between 1000 mand 1300 m (the dot corresponds to the float last position in the shown period). Label M refers to meddies and label C to cyclones. Bathymetryis contoured from 200 m to 1800 m depth with a spacing of 400 m.
surface patterns that are related with the deep eddies. Fig-ure 3 shows a sequence of SST maps illustrating the surfacedetection of CANIGO dipole M2-C2 during about 3 months,from mid-June 1998 to mid-September 1998. The colourpalette stretching is not the same for all maps and was chosento enhance the structures of interest, so, an image-to-imagecolour correspondence should not be attempted. The termSST is here used to represent the infrared channel 4 radiationtemperatures instead of true sea surface temperatures.
A strong thermal gradient is present in the coastal region,with lower temperatures against the coast due to upwelling.In Fig. 3a, the SST distribution from 12 June 1998 (163/98)shows two mushroom-like patterns centred, respectively atthe longitudes 9◦ W and 10.25◦ W. These surface features re-veal the influence of the presence of MW eddies, as shown bythe underwater trajectories superimposed on the image. Thesubsequent maps illustrate the evolution of the SST pattern.A clear correspondence between the eastern mushroom fea-ture and MW dipole M2-C2 is evident. Cold water is broughtsouthwards between M2 and C2 (Fig. 3b) and wraps aroundthe eddy centres. Dipole M2-C2 moved south and so did theSST dipolar pattern, which by 12 July 1998 (193/98) wasabout 50 km south (Fig. 3d) of its position in the first map.From this image to its next in the sequence one can clearlysee the transition of the float from one pole to the counter-part. Thirteen days later (Fig. 3f) on 6 August 1998 (218/98),
the cyclone seems intensified since the surface pattern showsmore water being wrapped around the structure. Meddy M2is still discernible but the separation relative to cyclone C2has increased. From there on the meddy could not be de-tected, but the SST cyclonic pattern is still evident and con-sistent with the C2 RAFOS trajectory.
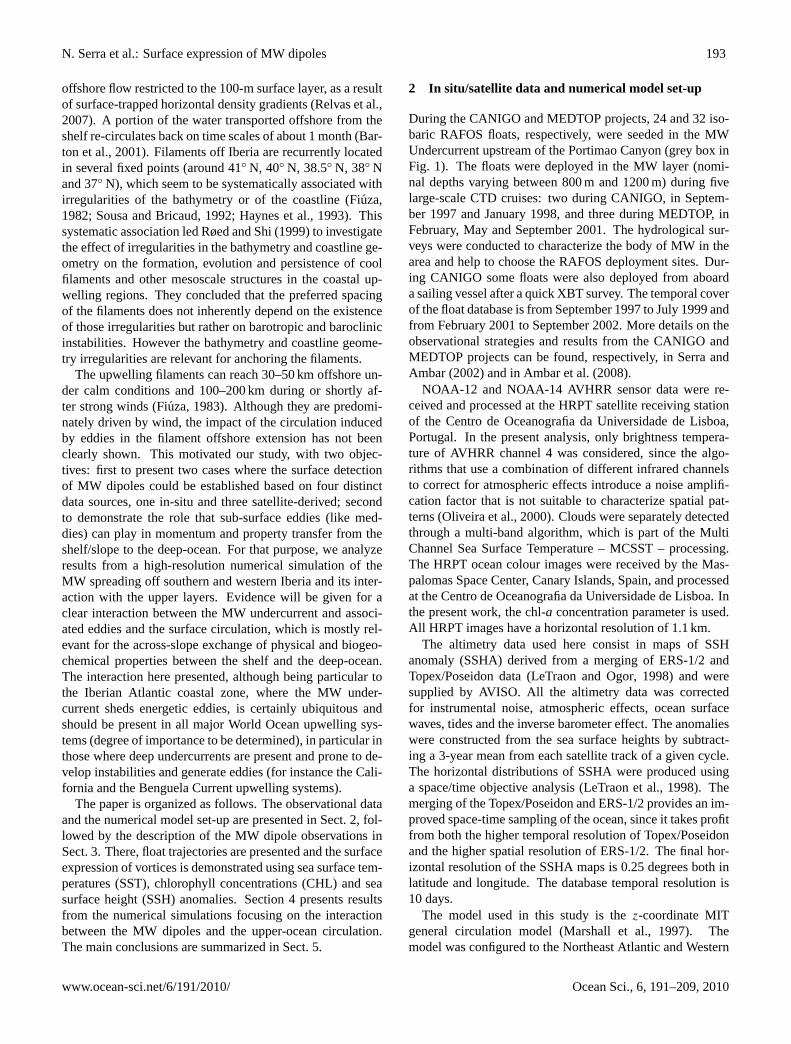
The replenishment of nutrients brought by the upwelledwaters into the photic zone allows phytoplankton growth in-shorewards of the upwelling front, the offshore side of it re-maining oligotrophic. The resulting coastal zone high chl-a concentration is thus suitable to be used as a passive tracerof the circulation over the shelf/slope. The distribution ofSeaWiFS chl-a concentration from 169/98 (Fig. 4) is char-acterized by high concentrations (>1mgm−3) present alongthe Iberian and African coasts (higher in the former) confinedto the continental shelf. The images have a stretched colourpalette in order to cover the whole range of concentrations.
Offshore from the 1800-m bathymetric line, only threemushroom-like patterns congregate concentrations above thebackground. All three patterns can be directly linked to thepresence of MW layer eddies. The patterns centred at 9◦ Wand 10◦ W correspond to the features present in the SST im-age of the same day shown in Fig. 3b. It is thus clear thatMW dipoles induce the offshoreward transport of chloro-phyll pigments from the shelf/slope region. It is also interest-ing to notice that the stem of the mushroom is where larger
www.ocean-sci.net/6/191/2010/ Ocean Sci., 6, 191–209, 2010

196 N. Serra et al.: Surface expression of MW dipoles
(a) (b) (c)
(d) (e) (f)
(g) (h) (i)
Fig. 3. SST images showing the surface signature of one dipolar structure found during CANIGO for (a)12 June 1998 (163/98), (b) 18 June 1998 (169/98), (c) 26 June 1998 (177/98), (d) 12 July 1998 (193/98),(e) 24 July 1998 (205/98), (f) 6 August 1998 (218/98), (g) 22 August 1998 (234/98), (h) 6 September1998 (249/98), (i) 14 September 1998 (257/98). Underwater float trajectories (image date ±5 days) aresuperimposed (depth ranges from 700 m to 1300 m; the dot corresponds to the float last position). Thecolorbar is not presented since values are irrelevant for the pattern identification (blue tones correspondto cold water and orange/red tones to warm water).
31
Fig. 3. SST images showing the surface signature of one dipolar structure found during CANIGO for(a) 12 June 1998 (163/98),(b) 18 June1998 (169/98),(c) 26 June 1998 (177/98),(d) 12 July 1998 (193/98),(e) 24 July 1998 (205/98),(f) 6 August 1998 (218/98),(g) 22 August1998 (234/98),(h) 6 September 1998 (249/98),(i) 14 September 1998 (257/98). Underwater float trajectories (image date±5 days) aresuperimposed (depth ranges from 700 m to 1300 m; the dot corresponds to the float last position). The colorbar is not presented since valuesare irrelevant for the pattern identification (blue tones correspond to cold water and orange/red tones to warm water).
concentrations occur; also colder water was found there. Thevelocities in the middle of the dipoles, which are a composi-tion of the velocities of both eddies, are sufficiently strong tocapture water from the shelf and advect it for hundreds of km.Another interesting aspect is the concentrations being largerin the cyclonic part of the dipole system. Either there is in-tense upwelling in the cyclones with the consequent higherproductivity there, or, more likely, the cyclone resides closerto the surface and is more efficient in capturing the high con-centrations when closer to the shelf/slope region.
3.1.3 Surface dynamical field
The surface dynamical field associated with dipole M2-C2is here assessed by using SSHA and corresponding relativegeostrophic velocity anomalies. As stated before, the SSHanomaly was constructed by subtracting a time average from
each point along the track of the satellite. This removes theundesired contribution of the geoid, but also the contribu-tion for the surface slopes from any permanent current thatmight exist in the region, like for instance the Azores or thePortugal Current. The velocities computed from anomaliesof surface slopes are thus velocity anomalies relative to theaveraged state. The anomalies might be associated to persis-tent eddies if they are strong enough to stand out from thebackground field. This is the case presented in Fig. 5, wherethe trajectories of three RAFOS floats are superimposed onSSHA and corresponding geostrophic anomaly current vec-tors. A good agreeement between the dipole float track andthe SSHA exists. In the map from 13 July 1998 (194/98),a positive SSHA (which means anticyclonic flow) is closeto a negative anomaly (cyclonic flow) in the region 34.5◦ N–36◦ N and 10◦ W–8◦ W. Geostrophic velocity anomalies of
Ocean Sci., 6, 191–209, 2010 www.ocean-sci.net/6/191/2010/
N. Serra et al.: Surface expression of MW dipoles 197
10.00
0.10
1.00
0.01
Fig. 4. Chlorophyll-a concentration distribution (units: mgm−3)in 18 June 1998 (169/98) with RAFOS float trajectories overlaid(float depths range from 700 m to 1300 m; the asterisks correspondto the floats last position), showing the surface expression of oneCANIGO dipole. Bathymetry is contoured from 200 m to 1800 mdepth with a spacing of 400 m.
typically 0.1 ms−1 are associated to these two SSHA but arehigher (>0.2ms−1) between them. The next SSHA map,from 12 August 1998 (224/98), shows both vortical centresfurther south and more horizontally separated, which is con-sistent to what was observed with the SST images concern-ing meddy M2 and cyclone C2. The cyclone intensified inthe last shown period as can be seen by the increase of thevelocity anomalies (Fig. 5b and c). Also the cyclonic SSHAturned more symmetric indicating that C2 was free of stronginteractions with other eddies.
3.2 MEDTOP 2001 observations
3.2.1 Float trajectories
Selected MEDTOP floats were also segmented in periods of40 days from 22 February 2001 (53/01) to 20 October 2001(293/01) and show the presence of a dipole in the centralpart of the Gulf of Cadiz (Fig. 6). In the period 93/01 to133/01, meddy M5, which was formed close to the slope inthe Portimao Canyon region, moved swiftly to the southwest(average drift speed of 0.05 ms−1) and merged with a largermeddy (M6) that was centred at 36◦ N, 10◦ W. This was con-cluded by the sudden change in the RAFOS loop diameteraccompanied by almost constant temperatures registered dur-ing the process (not shown). The float moved south in thisnew structure at an average drift speed of 0.03 ms−1. In thenext time period (133/01 to 173/01) the structure turned tothe southeast direction heading to the Moroccan slope withthe drift speed increasing to 0.04 ms−1. During the sameperiod meddy M7 and cyclone C7 are present further north.Some of the float trajectories in the following 80 days (peri-ods 173/01 to 213/01 and 213/01 to 253/01) reveal the pres-
ence of a cyclonic structure (C6) close to meddy M6, the lat-ter drifting northeastwards at an average speed of 0.025 ms−1
during that period. In the last time frame shown the meddypractically stalled with a drift below 0.01 ms−1.
3.2.2 Surface tracer patterns
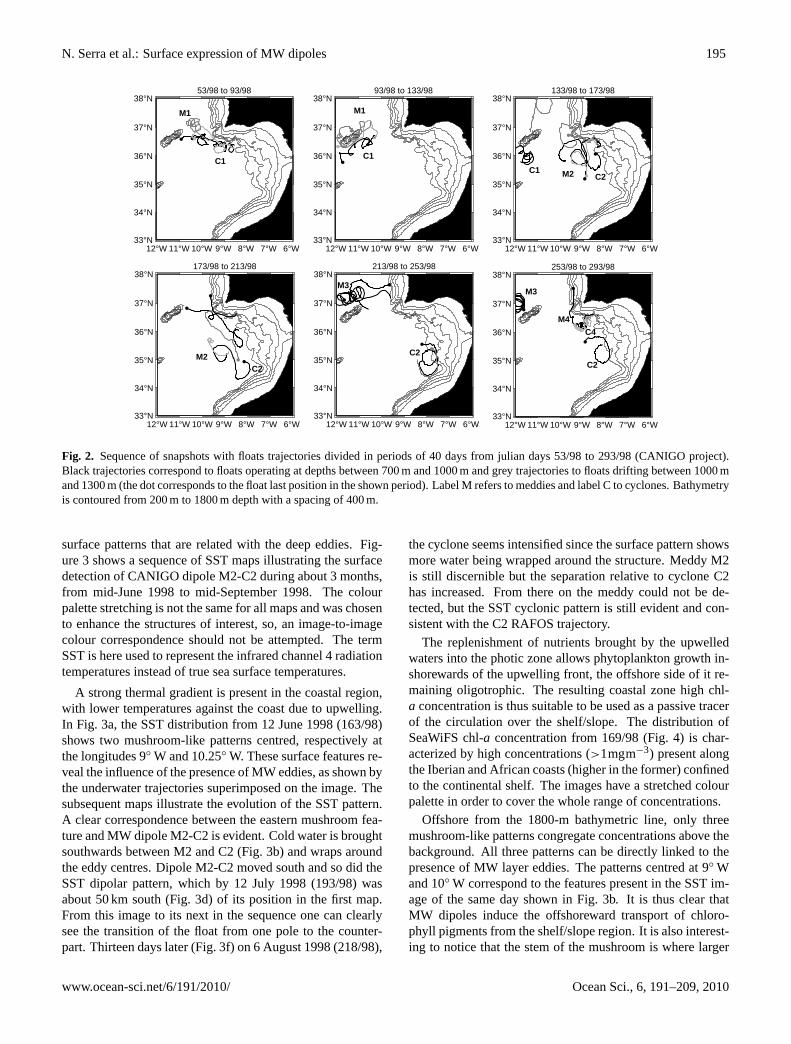
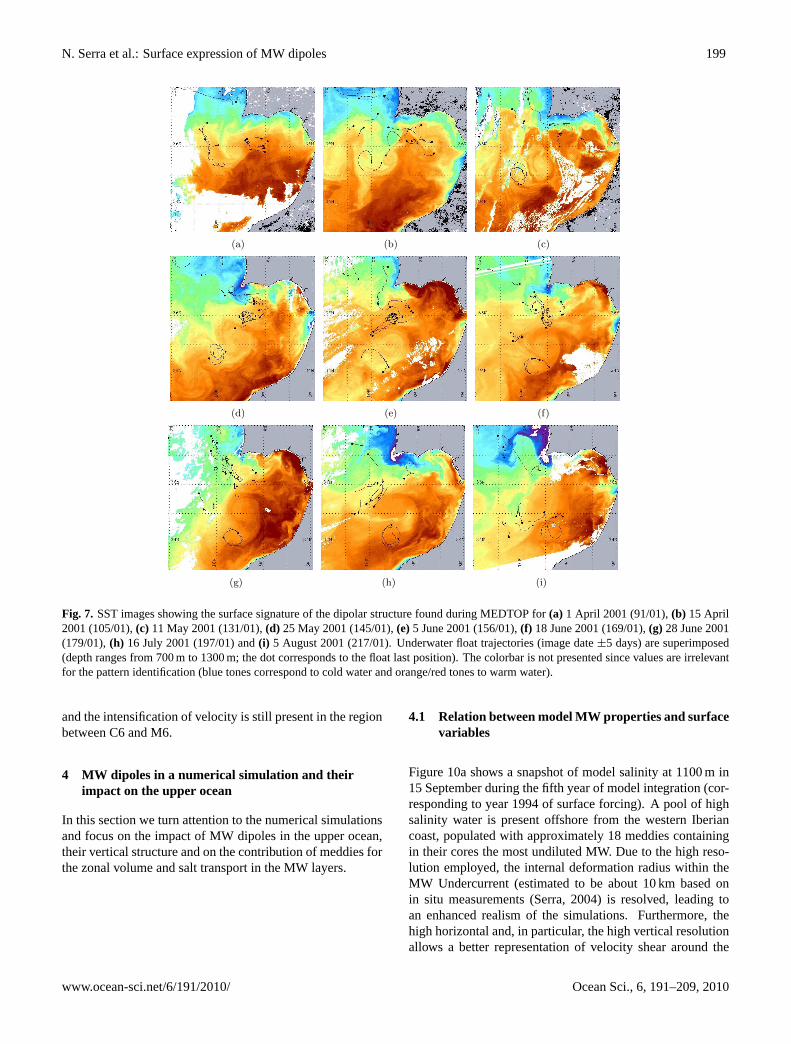
Remote measurements are crucial in this case to reconstructthe eddy field and explain the movement of meddy M6. Fig-ure 7 shows a sequence of SST maps, from 1 April 2001(91/01) to 5 August 2001 (217/01), that allows the detec-tion at the surface of the dipole from which M6 was the an-ticyclonic component. The SST image from 1 April 2001(91/01) shows that meddy M5 was moving around the an-ticyclonic part of a mushroom-like pattern which was thesurface expression of an underwater dipole. In the secondimage (Fig. 7b), the large loop described by the float is cen-tred with the western part of the SST pattern. This is a cleardemonstration that meddy M5 merged with the pre-existingmeddy M6. The following 3 images (from mid-May 2001to mid-June 2001) all show the dipole moving in a southeastdirection. It is interesting to notice that, as before in the caseof the CANIGO dipole M4-C4 (Fig. 3), the cyclonic part ofthe dipole is more evident and more symmetric.
Meddy M7 does not have a clear surface signature,whereas cyclone C7 shows up as a pool of warm water sur-rounded by a thin band of cold water in the image from 18June 2001 (Fig. 7f). The cyclone seems to extend from anupwelling filament rooted at Cape St. Vincent. If this cy-clone was generated by the overshoot of the upwelling re-lated current, then these results prove that upwelling phe-nomena could greatly interact with the MW Undercurrent.In the last 3 images of the sequence cyclone C6 keeps its po-sition (around 35◦ N, 9◦ W) and meddy M6 is forced to movearound the cyclone, thus explaining the re-circulation of M6in the Gulf of Cadiz.
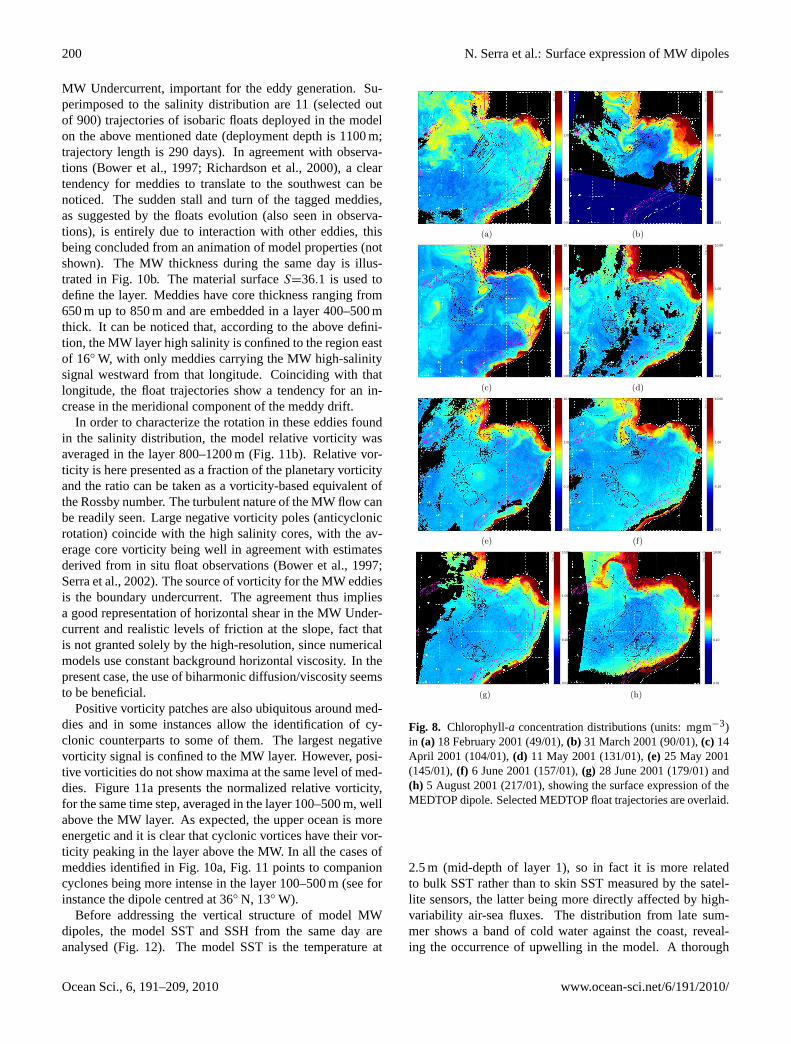
A sequence of chl-a concentration distributions from 18January 2001 (49/98) to 5 August 2001 (217/01) is presentedin Fig. 8. The first image in the sequence shows a circularpattern centered at 36◦ N, 10◦ W. Some pigments in the cen-tre of the pattern disclose an anticyclonic movement, whichis compatible with the float displacements at depth. It is thesurface expression of meddy M6. The next image from 31March 2001 (Fig. 8b) shows a maximum in chlorophyll con-centration attached to the cyclonic part of a mushroom fea-ture near 36◦ N, 9◦ W. These pigments were captured in thefilament extending south from Cape St. Vincent. In the next 3images, the mushroom-like pattern, corresponding to dipoleC6-M6, is clearly seen although the signal is gradually fad-ing. In the image from 5 August 2001 (Fig. 8h) the cycloneno longer presents an accumulation of chlorophyll. It is out-standing, however, the persistence of this accumulation in C6at great distances from the slope, lasting more than 3 months.
www.ocean-sci.net/6/191/2010/ Ocean Sci., 6, 191–209, 2010
198 N. Serra et al.: Surface expression of MW dipoles
12°W 10°W 8°W 6°W 33°N
34°N
35°N
36°N
37°N
38°N
15 cm/s
SSHA (cm)−15 −10 −5 0 5 10 15
12°W 10°W 8°W 6°W 33°N
34°N
35°N
36°N
37°N
38°N
15 cm/s
12°W 10°W 8°W 6°W 33°N
34°N
35°N
36°N
37°N
38°N
15 cm/s
(a) (b) (c)
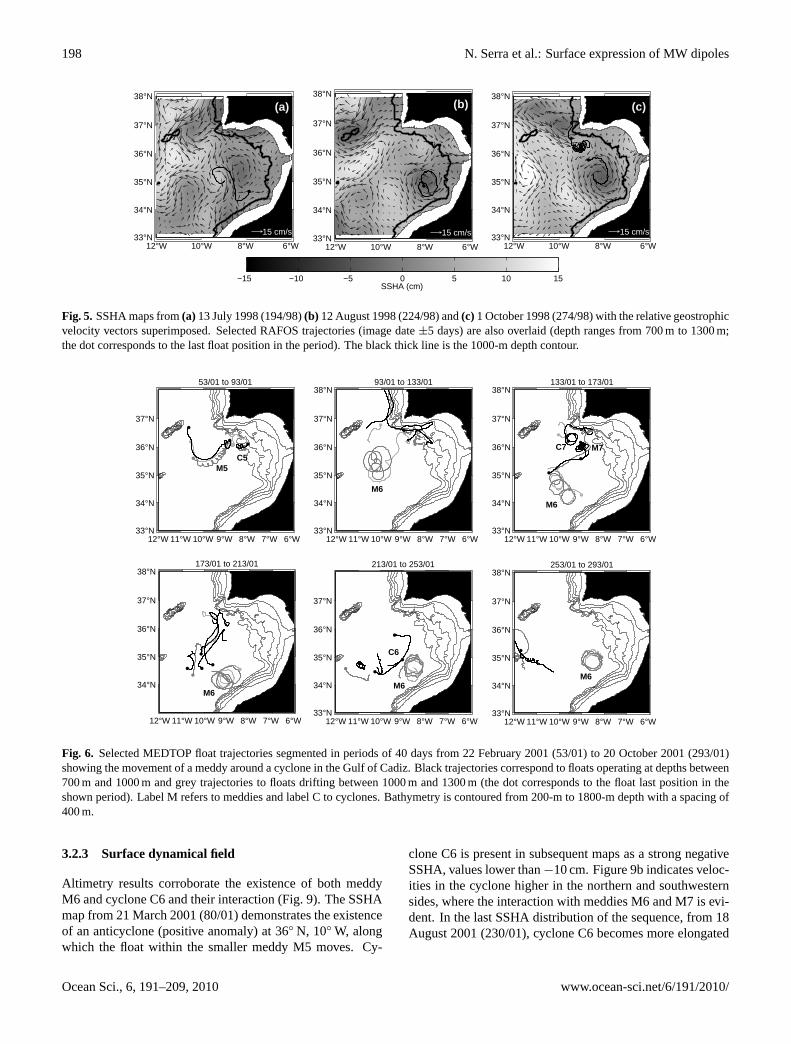
Fig. 5. SSHA maps from (a) 13 July 1998 (194/98) (b) 12 August 1998 (224/98) and (c) 1 October1998 (274/98) with the relative geostrophic velocity vectors superimposed. Selected RAFOS trajectories(image date ±5 days) are also overlaid (depth ranges from 700 m to 1300 m; the dot corresponds to thelast float position in the period). The black thick line is the 1000-m depth contour.
33
Fig. 5. SSHA maps from(a) 13 July 1998 (194/98)(b) 12 August 1998 (224/98) and(c) 1 October 1998 (274/98) with the relative geostrophicvelocity vectors superimposed. Selected RAFOS trajectories (image date±5 days) are also overlaid (depth ranges from 700 m to 1300 m;the dot corresponds to the last float position in the period). The black thick line is the 1000-m depth contour.
12°W 11°W 10°W 9°W 8°W 7°W 6°W 33°N
34°N
35°N
36°N
37°N
53/01 to 93/01
12°W 11°W 10°W 9°W 8°W 7°W 6°W 33°N
34°N
35°N
36°N
37°N
38°N93/01 to 133/01
12°W 11°W 10°W 9°W 8°W 7°W 6°W 33°N
34°N
35°N
36°N
37°N
38°N133/01 to 173/01
12°W 11°W 10°W 9°W 8°W 7°W 6°W
34°N
35°N
36°N
37°N
38°N173/01 to 213/01
12°W 11°W 10°W 9°W 8°W 7°W 6°W 33°N
34°N
35°N
36°N
37°N
38°N253/01 to 293/01
12°W 11°W 10°W 9°W 8°W 7°W 6°W 33°N
34°N
35°N
36°N
37°N
213/01 to 253/01
M5 C5
M6
M6
C7 M7
M6 M6
C6
M6
Fig. 6. Selected MEDTOP float trajectories segmented in periods of 40 days from 22 February 2001(53/01) to 20 October 2001 (293/01) showing the movement of a meddy around a cyclone in the Gulf ofCadiz. Black trajectories correspond to floats operating at depths between 700 m and 1000 m and greytrajectories to floats drifting between 1000 m and 1300 m (the dot corresponds to the float last positionin the shown period). Label M refers to meddies and label C to cyclones. Bathymetry is contoured from200-m to 1800-m depth with a spacing of 400 m.
34
Fig. 6. Selected MEDTOP float trajectories segmented in periods of 40 days from 22 February 2001 (53/01) to 20 October 2001 (293/01)showing the movement of a meddy around a cyclone in the Gulf of Cadiz. Black trajectories correspond to floats operating at depths between700 m and 1000 m and grey trajectories to floats drifting between 1000 m and 1300 m (the dot corresponds to the float last position in theshown period). Label M refers to meddies and label C to cyclones. Bathymetry is contoured from 200-m to 1800-m depth with a spacing of400 m.
3.2.3 Surface dynamical field
Altimetry results corroborate the existence of both meddyM6 and cyclone C6 and their interaction (Fig. 9). The SSHAmap from 21 March 2001 (80/01) demonstrates the existenceof an anticyclone (positive anomaly) at 36◦ N, 10◦ W, alongwhich the float within the smaller meddy M5 moves. Cy-
clone C6 is present in subsequent maps as a strong negativeSSHA, values lower than−10 cm. Figure 9b indicates veloc-ities in the cyclone higher in the northern and southwesternsides, where the interaction with meddies M6 and M7 is evi-dent. In the last SSHA distribution of the sequence, from 18August 2001 (230/01), cyclone C6 becomes more elongated
Ocean Sci., 6, 191–209, 2010 www.ocean-sci.net/6/191/2010/
N. Serra et al.: Surface expression of MW dipoles 199
(a) (b) (c)
(d) (e) (f)
(g) (h) (i)
Fig. 7. SST images showing the surface signature of the dipolar structure found during MEDTOP for (a)1 April 2001 (91/01), (b) 15 April 2001 (105/01), (c) 11 May 2001 (131/01), (d) 25 May 2001 (145/01),(e) 5 June 2001 (156/01), (f) 18 June 2001 (169/01), (g) 28 June 2001 (179/01), (h) 16 July 2001 (197/01)and (i) 5 August 2001 (217/01). Underwater float trajectories (image date ±5 days) are superimposed(depth ranges from 700 m to 1300 m; the dot corresponds to the float last position). The colorbar is notpresented since values are irrelevant for the pattern identification (blue tones correspond to cold waterand orange/red tones to warm water). 35
Fig. 7. SST images showing the surface signature of the dipolar structure found during MEDTOP for(a) 1 April 2001 (91/01),(b) 15 April2001 (105/01),(c) 11 May 2001 (131/01),(d) 25 May 2001 (145/01),(e)5 June 2001 (156/01),(f) 18 June 2001 (169/01),(g) 28 June 2001(179/01),(h) 16 July 2001 (197/01) and(i) 5 August 2001 (217/01). Underwater float trajectories (image date±5 days) are superimposed(depth ranges from 700 m to 1300 m; the dot corresponds to the float last position). The colorbar is not presented since values are irrelevantfor the pattern identification (blue tones correspond to cold water and orange/red tones to warm water).
and the intensification of velocity is still present in the regionbetween C6 and M6.
4 MW dipoles in a numerical simulation and theirimpact on the upper ocean
In this section we turn attention to the numerical simulationsand focus on the impact of MW dipoles in the upper ocean,their vertical structure and on the contribution of meddies forthe zonal volume and salt transport in the MW layers.
4.1 Relation between model MW properties and surfacevariables
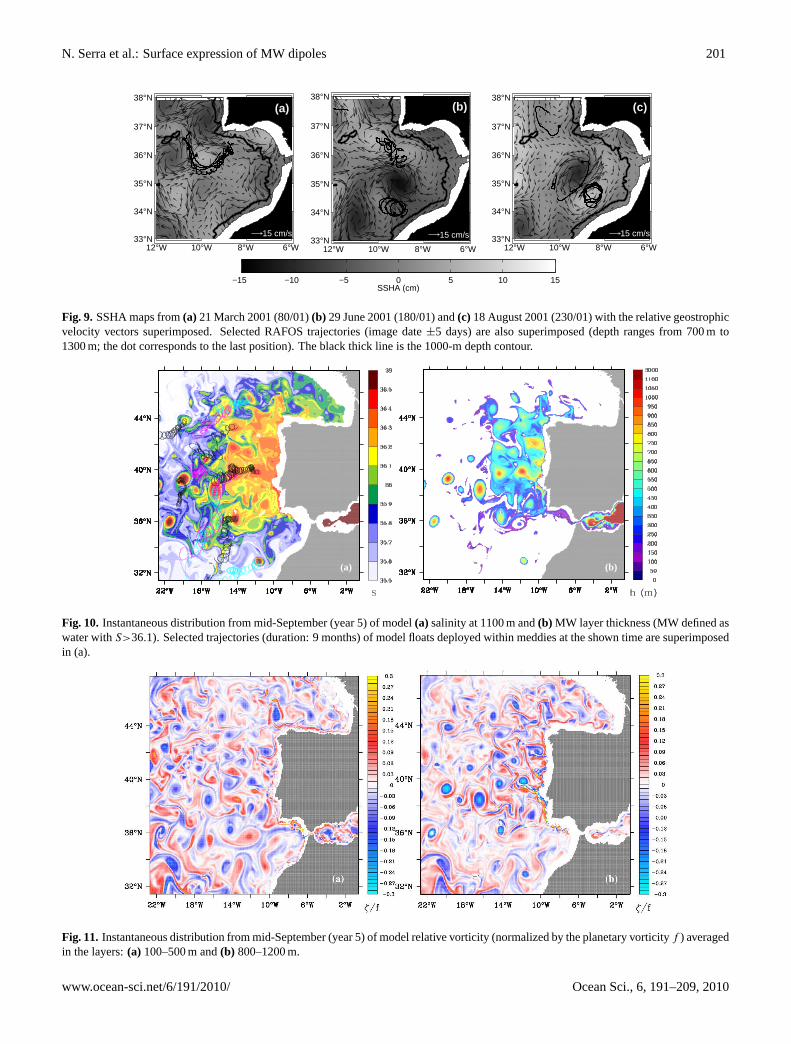
Figure 10a shows a snapshot of model salinity at 1100 m in15 September during the fifth year of model integration (cor-responding to year 1994 of surface forcing). A pool of highsalinity water is present offshore from the western Iberiancoast, populated with approximately 18 meddies containingin their cores the most undiluted MW. Due to the high reso-lution employed, the internal deformation radius within theMW Undercurrent (estimated to be about 10 km based onin situ measurements (Serra, 2004) is resolved, leading toan enhanced realism of the simulations. Furthermore, thehigh horizontal and, in particular, the high vertical resolutionallows a better representation of velocity shear around the
www.ocean-sci.net/6/191/2010/ Ocean Sci., 6, 191–209, 2010
200 N. Serra et al.: Surface expression of MW dipoles
MW Undercurrent, important for the eddy generation. Su-perimposed to the salinity distribution are 11 (selected outof 900) trajectories of isobaric floats deployed in the modelon the above mentioned date (deployment depth is 1100 m;trajectory length is 290 days). In agreement with observa-tions (Bower et al., 1997; Richardson et al., 2000), a cleartendency for meddies to translate to the southwest can benoticed. The sudden stall and turn of the tagged meddies,as suggested by the floats evolution (also seen in observa-tions), is entirely due to interaction with other eddies, thisbeing concluded from an animation of model properties (notshown). The MW thickness during the same day is illus-trated in Fig. 10b. The material surfaceS=36.1 is used todefine the layer. Meddies have core thickness ranging from650 m up to 850 m and are embedded in a layer 400–500 mthick. It can be noticed that, according to the above defini-tion, the MW layer high salinity is confined to the region eastof 16◦ W, with only meddies carrying the MW high-salinitysignal westward from that longitude. Coinciding with thatlongitude, the float trajectories show a tendency for an in-crease in the meridional component of the meddy drift.
In order to characterize the rotation in these eddies foundin the salinity distribution, the model relative vorticity wasaveraged in the layer 800–1200 m (Fig. 11b). Relative vor-ticity is here presented as a fraction of the planetary vorticityand the ratio can be taken as a vorticity-based equivalent ofthe Rossby number. The turbulent nature of the MW flow canbe readily seen. Large negative vorticity poles (anticyclonicrotation) coincide with the high salinity cores, with the av-erage core vorticity being well in agreement with estimatesderived from in situ float observations (Bower et al., 1997;Serra et al., 2002). The source of vorticity for the MW eddiesis the boundary undercurrent. The agreement thus impliesa good representation of horizontal shear in the MW Under-current and realistic levels of friction at the slope, fact thatis not granted solely by the high-resolution, since numericalmodels use constant background horizontal viscosity. In thepresent case, the use of biharmonic diffusion/viscosity seemsto be beneficial.
Positive vorticity patches are also ubiquitous around med-dies and in some instances allow the identification of cy-clonic counterparts to some of them. The largest negativevorticity signal is confined to the MW layer. However, posi-tive vorticities do not show maxima at the same level of med-dies. Figure 11a presents the normalized relative vorticity,for the same time step, averaged in the layer 100–500 m, wellabove the MW layer. As expected, the upper ocean is moreenergetic and it is clear that cyclonic vortices have their vor-ticity peaking in the layer above the MW. In all the cases ofmeddies identified in Fig. 10a, Fig. 11 points to companioncyclones being more intense in the layer 100–500 m (see forinstance the dipole centred at 36◦ N, 13◦ W).
Before addressing the vertical structure of model MWdipoles, the model SST and SSH from the same day areanalysed (Fig. 12). The model SST is the temperature at
0.01
0.10
1.00
10.00
(a)
0.01
0.10
1.00
10.00
(b)
0.01
0.10
1.00
10.00
(c)
0.01
0.10
1.00
10.00
(d)
0.01
0.10
1.00
10.00
(e)
0.01
0.10
1.00
10.00
(f)
0.01
0.10
1.00
10.00
(g)
0.01
0.10
1.00
10.00
(h)
Fig. 8. Chlorophyll-a concentration distributions (units: mg m−3) in (a) 18 February 2001 (49/01),(b) 31 March 2001 (90/01), (c) 14 April 2001 (104/01), (d) 11 May 2001 (131/01), (e) 25 May 2001(145/01), (f) 6 June 2001 (157/01), (g) 28 June 2001 (179/01) and (h) 5 August 2001 (217/01), showingthe surface expression of the MEDTOP dipole. Selected MEDTOP float trajectories are overlaid.
36
Fig. 8. Chlorophyll-a concentration distributions (units: mgm−3)in (a) 18 February 2001 (49/01),(b) 31 March 2001 (90/01),(c) 14April 2001 (104/01),(d) 11 May 2001 (131/01),(e) 25 May 2001(145/01),(f) 6 June 2001 (157/01),(g) 28 June 2001 (179/01) and(h) 5 August 2001 (217/01), showing the surface expression of theMEDTOP dipole. Selected MEDTOP float trajectories are overlaid.
2.5 m (mid-depth of layer 1), so in fact it is more relatedto bulk SST rather than to skin SST measured by the satel-lite sensors, the latter being more directly affected by high-variability air-sea fluxes. The distribution from late sum-mer shows a band of cold water against the coast, reveal-ing the occurrence of upwelling in the model. A thorough
Ocean Sci., 6, 191–209, 2010 www.ocean-sci.net/6/191/2010/
N. Serra et al.: Surface expression of MW dipoles 201
12°W 10°W 8°W 6°W 33°N
34°N
35°N
36°N
37°N
38°N
15 cm/s
SSHA (cm)−15 −10 −5 0 5 10 15
12°W 10°W 8°W 6°W 33°N
34°N
35°N
36°N
37°N
38°N
15 cm/s
12°W 10°W 8°W 6°W 33°N
34°N
35°N
36°N
37°N
38°N
15 cm/s
(a) (b) (c)
Fig. 9. SSHA maps from (a) 21 March 2001 (80/01) (b) 29 June 2001 (180/01) and (c) 18 August2001 (230/01) with the relative geostrophic velocity vectors superimposed. Selected RAFOS trajectories(image date ±5 days) are also superimposed (depth ranges from 700 m to 1300 m; the dot correspondsto the last position). The black thick line is the 1000-m depth contour.
37
Fig. 9. SSHA maps from(a) 21 March 2001 (80/01)(b) 29 June 2001 (180/01) and(c) 18 August 2001 (230/01) with the relative geostrophicvelocity vectors superimposed. Selected RAFOS trajectories (image date±5 days) are also superimposed (depth ranges from 700 m to1300 m; the dot corresponds to the last position). The black thick line is the 1000-m depth contour.
(a) (b)
Fig. 10. Instantaneous distribution from mid-September (year 5) of model (a) salinity at 1100 m and (b)MW layer thickness (MW defined as water with S>36.1). Selected trajectories (duration: 9 months) ofmodel floats deployed within meddies at the shown time are superimposed in (a).
38
Fig. 10. Instantaneous distribution from mid-September (year 5) of model(a) salinity at 1100 m and(b) MW layer thickness (MW defined aswater withS>36.1). Selected trajectories (duration: 9 months) of model floats deployed within meddies at the shown time are superimposedin (a).
Fig. 11. Instantaneous distribution from mid-September (year 5) of model relative vorticity (normalized by the planetary vorticityf ) averagedin the layers:(a) 100–500 m and(b) 800–1200 m.
www.ocean-sci.net/6/191/2010/ Ocean Sci., 6, 191–209, 2010
202 N. Serra et al.: Surface expression of MW dipoles
(a)
2
3
1 (b)
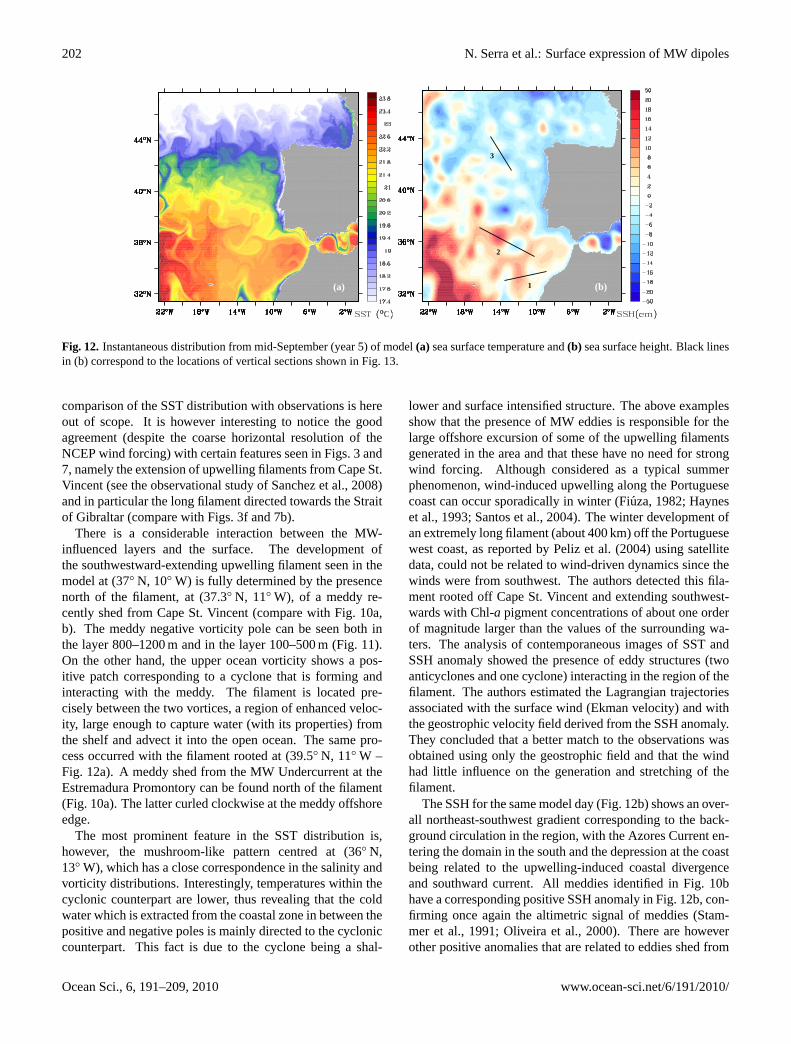
Fig. 12. Instantaneous distribution from mid-September (year 5) of model (a) sea surface temperatureand (b) sea surface height. Black lines in (b) correspond to the locations of vertical sections shown inFig. 13.
40
Fig. 12. Instantaneous distribution from mid-September (year 5) of model(a) sea surface temperature and(b) sea surface height. Black linesin (b) correspond to the locations of vertical sections shown in Fig. 13.
comparison of the SST distribution with observations is hereout of scope. It is however interesting to notice the goodagreement (despite the coarse horizontal resolution of theNCEP wind forcing) with certain features seen in Figs. 3 and7, namely the extension of upwelling filaments from Cape St.Vincent (see the observational study ofSanchez et al., 2008)and in particular the long filament directed towards the Straitof Gibraltar (compare with Figs. 3f and 7b).
There is a considerable interaction between the MW-influenced layers and the surface. The development ofthe southwestward-extending upwelling filament seen in themodel at (37◦ N, 10◦ W) is fully determined by the presencenorth of the filament, at (37.3◦ N, 11◦ W), of a meddy re-cently shed from Cape St. Vincent (compare with Fig. 10a,b). The meddy negative vorticity pole can be seen both inthe layer 800–1200 m and in the layer 100–500 m (Fig. 11).On the other hand, the upper ocean vorticity shows a pos-itive patch corresponding to a cyclone that is forming andinteracting with the meddy. The filament is located pre-cisely between the two vortices, a region of enhanced veloc-ity, large enough to capture water (with its properties) fromthe shelf and advect it into the open ocean. The same pro-cess occurred with the filament rooted at (39.5◦ N, 11◦ W –Fig. 12a). A meddy shed from the MW Undercurrent at theEstremadura Promontory can be found north of the filament(Fig. 10a). The latter curled clockwise at the meddy offshoreedge.
The most prominent feature in the SST distribution is,however, the mushroom-like pattern centred at (36◦ N,13◦ W), which has a close correspondence in the salinity andvorticity distributions. Interestingly, temperatures within thecyclonic counterpart are lower, thus revealing that the coldwater which is extracted from the coastal zone in between thepositive and negative poles is mainly directed to the cycloniccounterpart. This fact is due to the cyclone being a shal-
lower and surface intensified structure. The above examplesshow that the presence of MW eddies is responsible for thelarge offshore excursion of some of the upwelling filamentsgenerated in the area and that these have no need for strongwind forcing. Although considered as a typical summerphenomenon, wind-induced upwelling along the Portuguesecoast can occur sporadically in winter (Fiuza, 1982; Hayneset al., 1993; Santos et al., 2004). The winter development ofan extremely long filament (about 400 km) off the Portuguesewest coast, as reported byPeliz et al.(2004) using satellitedata, could not be related to wind-driven dynamics since thewinds were from southwest. The authors detected this fila-ment rooted off Cape St. Vincent and extending southwest-wards with Chl-a pigment concentrations of about one orderof magnitude larger than the values of the surrounding wa-ters. The analysis of contemporaneous images of SST andSSH anomaly showed the presence of eddy structures (twoanticyclones and one cyclone) interacting in the region of thefilament. The authors estimated the Lagrangian trajectoriesassociated with the surface wind (Ekman velocity) and withthe geostrophic velocity field derived from the SSH anomaly.They concluded that a better match to the observations wasobtained using only the geostrophic field and that the windhad little influence on the generation and stretching of thefilament.
The SSH for the same model day (Fig. 12b) shows an over-all northeast-southwest gradient corresponding to the back-ground circulation in the region, with the Azores Current en-tering the domain in the south and the depression at the coastbeing related to the upwelling-induced coastal divergenceand southward current. All meddies identified in Fig. 10bhave a corresponding positive SSH anomaly in Fig. 12b, con-firming once again the altimetric signal of meddies (Stam-mer et al., 1991; Oliveira et al., 2000). There are howeverother positive anomalies that are related to eddies shed from
Ocean Sci., 6, 191–209, 2010 www.ocean-sci.net/6/191/2010/

N. Serra et al.: Surface expression of MW dipoles 203
Fig. 13.Vertical sections across three selected MW dipoles generated in the model (Fig. 12b, Sect. 1 – top row; Sect. 2 – middle row; Sect. 3– bottom row): (a, c, e– top panels) sea surface height anomaly; (a, c, e – bottom panels) salinity and meridional component of velocity; (b,d, f – top panels) normalized barotropic vorticity; (b, d, f – bottom panels) normalized relative vorticity and salinity larger than 36.
the Azores Current or from the North Atlantic Current. So,in fact, some ambiguity is present when relying only on al-timetry to locate meddies. When comparing the SSH and
the vorticity distributions, it can be seen that the former fieldpresents broader scale patterns and that a one-to-one corre-spondence is not always easily established.
www.ocean-sci.net/6/191/2010/ Ocean Sci., 6, 191–209, 2010
204 N. Serra et al.: Surface expression of MW dipoles
4.2 Vertical structure of simulated dipoles
The attribution of model SSH variability to meddy-inducedfluctuations will be shown later in Sect. 4.4. We focus first onthe vertical structure of MW dipoles. Figure 13 presents thevertical structure of three dipoles generated in the model, cor-responding to Sects. 1–3 shown in Fig. 12b. Salinity verticaldistributions are presented in the lower panels of Fig. 13a,c, e with the velocity component perpendicular to the sec-tion superimposed (meridional component in cases 1–2 andzonal component in case 3), whereas the upper panels depictthe SSH anomaly. The relative vorticity (normalized by theplanetary vorticity) distributions for the same sections are inthe lower panels of Fig. 13b, d, f and the barotropic vorticityin the upper panels.
First of all, the realistic penetration depth of the MW inour simulations can be appreciated. In all the examples, theanticyclone contains the majority of the MW salinity signal,whereas the cyclone comprises less salty or ambient water.This is also clear in Fig. 10a, which shows filaments of highsalinity water wrapped around the centre of the cyclones.Meddy velocities are intensified in the MW layer, with thelarger negative vorticities being found there. The negativevorticity extends to the surface in all 3 cases, especially in thetwo northernmost ones, which are closer in space and time totheir generation. In the deeper layers below the three med-dies, an inversion in vorticity sign is present. On the otherhand, an interesting feature is the top-to-bottom extension ofthe cyclone, as can be seen in the velocity within these polesor in the positive vorticity regions east from the meddies. Thecyclone has thus a tendency to be more barotropic than theanticyclone. The depths of maximum azimuthal velocitieswithin the model cyclones do not coincide with those of theanticylones and are located at the layers above the MW (incase 1 a bottom intensification can be seen as well). Thisis an indication that the cyclone has been formed initiallyat shallower depths and then spread its influence throughoutthe water column. This is also consistent with the fact ofthe MW Undercurrent being bounded by regions of positiveshear (particularly strong above the MW), which are sourcefor the cyclones.
SSH anomalies in the three dipoles have similar magni-tudes to those shown in Figs. 5 and 9. In a depth-integratedsense (see barotropic vorticity), the dipoles ejected from theMW Undercurrent act as barotropic modons, but they wereshown here to have a baroclinic (hetonic) structure. We con-clude that the dipoles generated in the model have character-istics compatible to those observed at the same locations dur-ing the CANIGO and MEDTOP projects (Serra et al., 2005;Ambar et al., 2008), so that the present simulations offer thepossibility of studying the complex meddy evolution frombirth and cyclone-anticyclone coupling to interaction with to-pography and dissipation.
(b)
(a)
Fig. 14. (a) Meridionally integrated volume (black – units: Sv) and salt (red – units: Sv psu) zonaltransports in the MW layer (volume and salt transports share the same axis). Dashed lines correspond tothe case in which only meddy contributions (see text) are accounted. (b) Ratio between meddy (Tmeddy)and total (T ) volume (black) and salt (red) zonal transports.
42
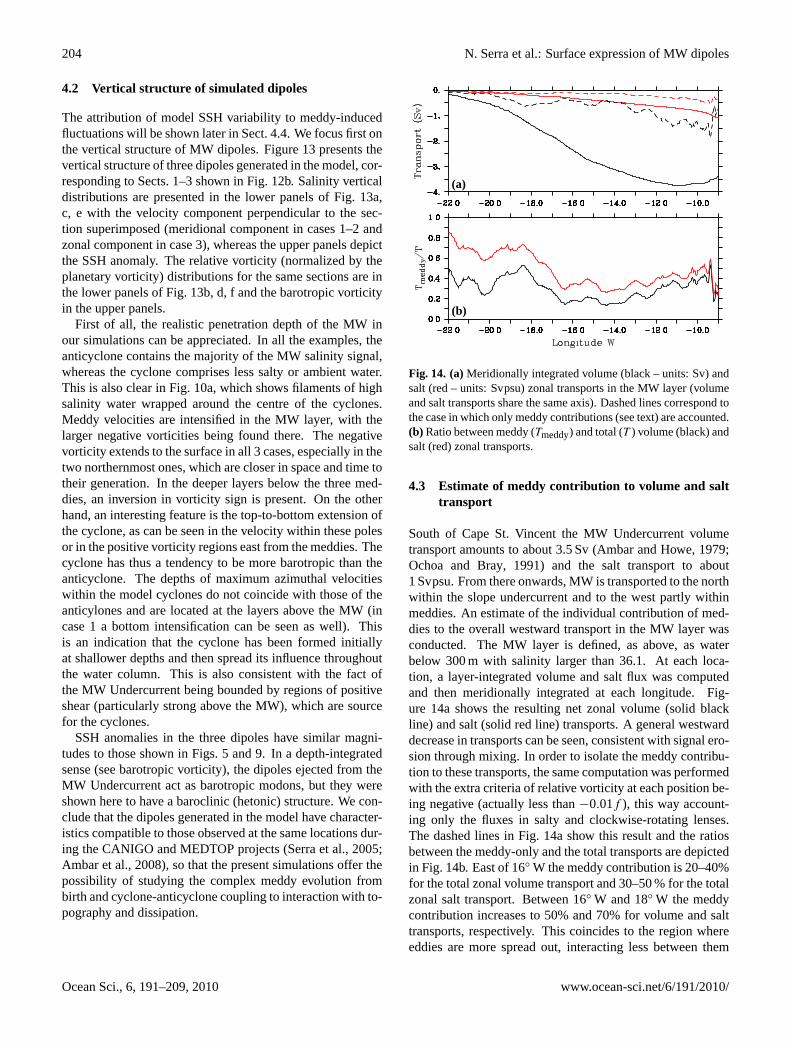
Fig. 14. (a)Meridionally integrated volume (black – units: Sv) andsalt (red – units: Svpsu) zonal transports in the MW layer (volumeand salt transports share the same axis). Dashed lines correspond tothe case in which only meddy contributions (see text) are accounted.(b) Ratio between meddy (Tmeddy) and total (T ) volume (black) andsalt (red) zonal transports.
4.3 Estimate of meddy contribution to volume and salttransport
South of Cape St. Vincent the MW Undercurrent volumetransport amounts to about 3.5 Sv (Ambar and Howe, 1979;Ochoa and Bray, 1991) and the salt transport to about1 Svpsu. From there onwards, MW is transported to the northwithin the slope undercurrent and to the west partly withinmeddies. An estimate of the individual contribution of med-dies to the overall westward transport in the MW layer wasconducted. The MW layer is defined, as above, as waterbelow 300 m with salinity larger than 36.1. At each loca-tion, a layer-integrated volume and salt flux was computedand then meridionally integrated at each longitude. Fig-ure 14a shows the resulting net zonal volume (solid blackline) and salt (solid red line) transports. A general westwarddecrease in transports can be seen, consistent with signal ero-sion through mixing. In order to isolate the meddy contribu-tion to these transports, the same computation was performedwith the extra criteria of relative vorticity at each position be-ing negative (actually less than−0.01f ), this way account-ing only the fluxes in salty and clockwise-rotating lenses.The dashed lines in Fig. 14a show this result and the ratiosbetween the meddy-only and the total transports are depictedin Fig. 14b. East of 16◦ W the meddy contribution is 20–40%for the total zonal volume transport and 30–50 % for the totalzonal salt transport. Between 16◦ W and 18◦ W the meddycontribution increases to 50% and 70% for volume and salttransports, respectively. This coincides to the region whereeddies are more spread out, interacting less between them
Ocean Sci., 6, 191–209, 2010 www.ocean-sci.net/6/191/2010/
N. Serra et al.: Surface expression of MW dipoles 205
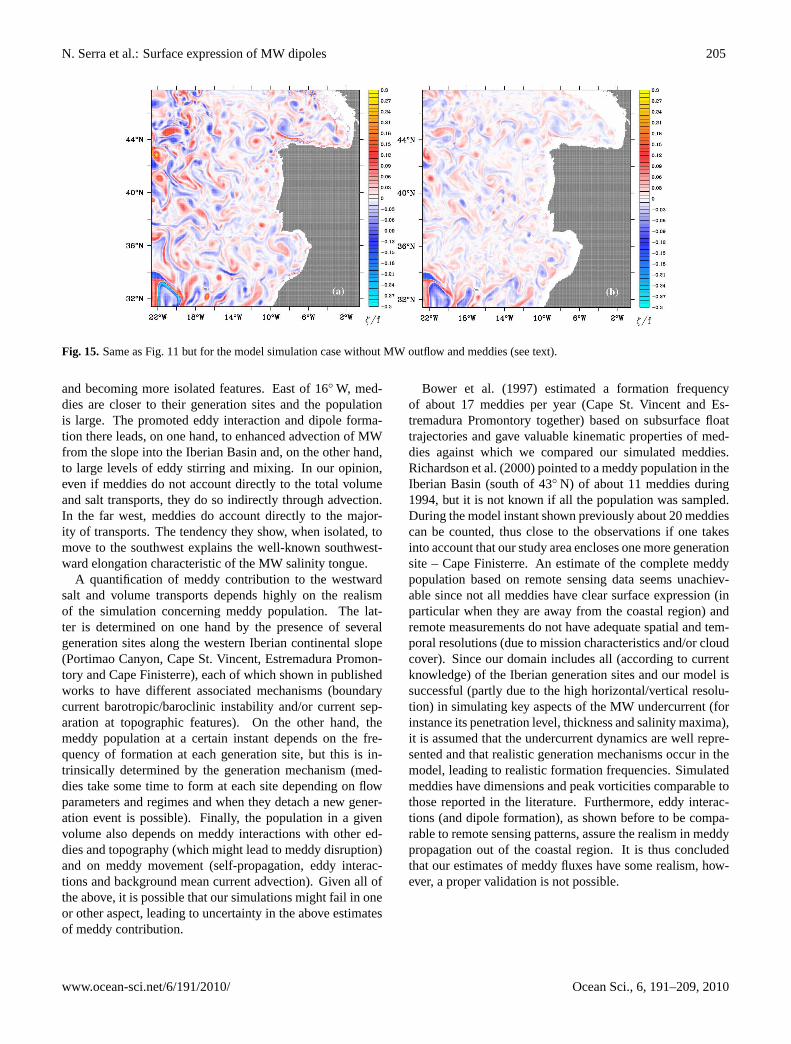
Fig. 15. Same as Fig. 11 but for the model simulation case without MW outflow and meddies (see text).
and becoming more isolated features. East of 16◦ W, med-dies are closer to their generation sites and the populationis large. The promoted eddy interaction and dipole forma-tion there leads, on one hand, to enhanced advection of MWfrom the slope into the Iberian Basin and, on the other hand,to large levels of eddy stirring and mixing. In our opinion,even if meddies do not account directly to the total volumeand salt transports, they do so indirectly through advection.In the far west, meddies do account directly to the major-ity of transports. The tendency they show, when isolated, tomove to the southwest explains the well-known southwest-ward elongation characteristic of the MW salinity tongue.
A quantification of meddy contribution to the westwardsalt and volume transports depends highly on the realismof the simulation concerning meddy population. The lat-ter is determined on one hand by the presence of severalgeneration sites along the western Iberian continental slope(Portimao Canyon, Cape St. Vincent, Estremadura Promon-tory and Cape Finisterre), each of which shown in publishedworks to have different associated mechanisms (boundarycurrent barotropic/baroclinic instability and/or current sep-aration at topographic features). On the other hand, themeddy population at a certain instant depends on the fre-quency of formation at each generation site, but this is in-trinsically determined by the generation mechanism (med-dies take some time to form at each site depending on flowparameters and regimes and when they detach a new gener-ation event is possible). Finally, the population in a givenvolume also depends on meddy interactions with other ed-dies and topography (which might lead to meddy disruption)and on meddy movement (self-propagation, eddy interac-tions and background mean current advection). Given all ofthe above, it is possible that our simulations might fail in oneor other aspect, leading to uncertainty in the above estimatesof meddy contribution.
Bower et al. (1997) estimated a formation frequencyof about 17 meddies per year (Cape St. Vincent and Es-tremadura Promontory together) based on subsurface floattrajectories and gave valuable kinematic properties of med-dies against which we compared our simulated meddies.Richardson et al.(2000) pointed to a meddy population in theIberian Basin (south of 43◦ N) of about 11 meddies during1994, but it is not known if all the population was sampled.During the model instant shown previously about 20 meddiescan be counted, thus close to the observations if one takesinto account that our study area encloses one more generationsite – Cape Finisterre. An estimate of the complete meddypopulation based on remote sensing data seems unachiev-able since not all meddies have clear surface expression (inparticular when they are away from the coastal region) andremote measurements do not have adequate spatial and tem-poral resolutions (due to mission characteristics and/or cloudcover). Since our domain includes all (according to currentknowledge) of the Iberian generation sites and our model issuccessful (partly due to the high horizontal/vertical resolu-tion) in simulating key aspects of the MW undercurrent (forinstance its penetration level, thickness and salinity maxima),it is assumed that the undercurrent dynamics are well repre-sented and that realistic generation mechanisms occur in themodel, leading to realistic formation frequencies. Simulatedmeddies have dimensions and peak vorticities comparable tothose reported in the literature. Furthermore, eddy interac-tions (and dipole formation), as shown before to be compa-rable to remote sensing patterns, assure the realism in meddypropagation out of the coastal region. It is thus concludedthat our estimates of meddy fluxes have some realism, how-ever, a proper validation is not possible.
www.ocean-sci.net/6/191/2010/ Ocean Sci., 6, 191–209, 2010
206 N. Serra et al.: Surface expression of MW dipoles
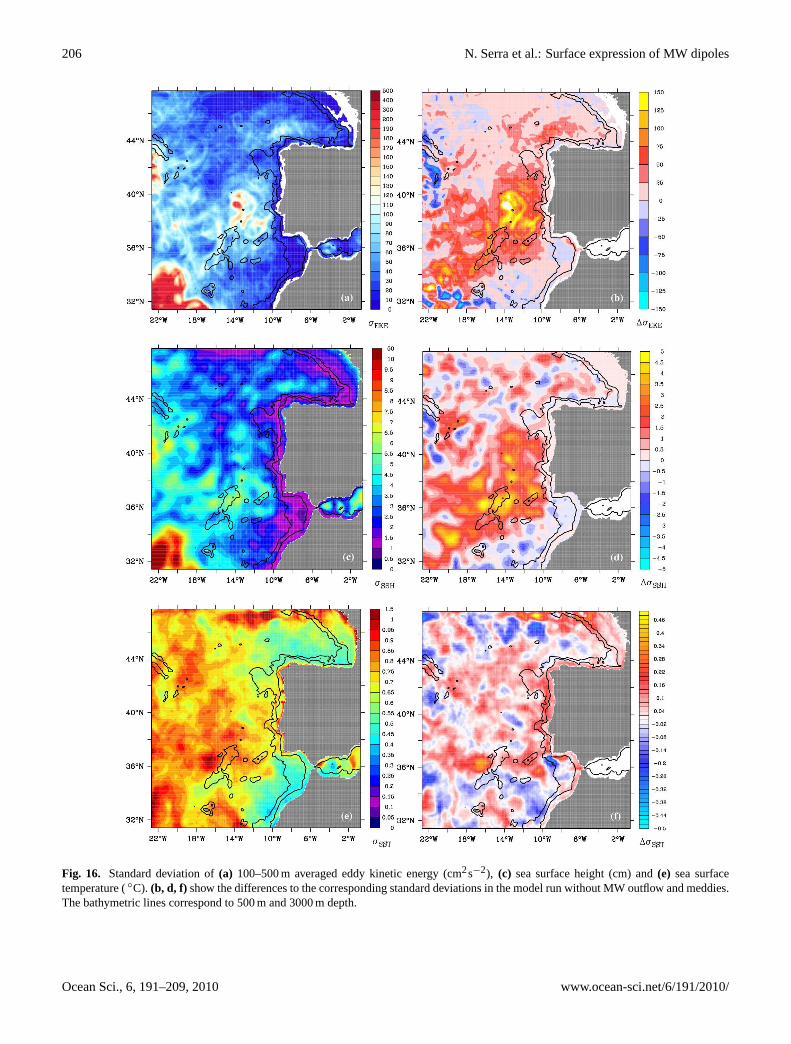
Fig. 16. Standard deviation of(a) 100–500 m averaged eddy kinetic energy (cm2s−2), (c) sea surface height (cm) and(e) sea surfacetemperature (◦C). (b, d, f) show the differences to the corresponding standard deviations in the model run without MW outflow and meddies.The bathymetric lines correspond to 500 m and 3000 m depth.
Ocean Sci., 6, 191–209, 2010 www.ocean-sci.net/6/191/2010/

N. Serra et al.: Surface expression of MW dipoles 207
4.4 Impact of MW eddies in the upper oceanvariability: a sensitivity experiment
We continue to analyse the impact of meddies and meddy-induced circulation on the variability of the upper ocean off-shore from the Iberian Peninsula. The simplest way of get-ting the full response is not allowing the overflow of MWinto the Gulf of Cadiz and consequently no eddy formationat mid-depth. A sensitivity experiment was thus conductedin which the Strait of Gibraltar was closed and the Mediter-ranean Sea excluded from the computations. All model pa-rameters, initial and boundary conditions and forcing weremaintained, including the length of the run.
In Fig. 15, the same layer-averaged vorticity fields as inFig. 11 are presented. From the comparison of Figs. 11b and15b, a clear reduction in vorticity at the MW layer is visi-ble, as expected, since eddy formation no longer takes place.Although positive and negative vortices still exist (a remnantof MW from the initial condition is still present), strong ed-dies can no longer be seen. The lack of MW eddies impactsthe upper ocean as well, as can be noticed in the upper layer(100–500 m) vorticity (Fig. 15a). Comparing Figs. 11a and15a, a reduction in vorticity magnitude (and also on the sizeof positive/negative patches) again occurs in the region closerto the Iberian coast. Offshore, in the west and south, similarvorticity levels are present in both runs, resulting from in-stabilities of the currents inflowing into the domain (AzoresCurrent and North Atlantic Current extension).
The eddy kinetic energy (EKE) variability in the layerabove the MW from the realistic run is shown in Fig. 16a.Besides the two offshore regions of high EKE nearthe boundaries, the distribution shows values larger than100 cm2s−2 in the Iberian Basin, from 36◦ N to 42◦ N and10◦ W to 16◦ W, where meddies are recently shed from CapeSt. Vincent and Estremadura Promontory and closely inter-act. Figure 16b shows the difference in EKE between therealistic run and the sensitivity run without MW outflow andmeddies. A dramatic reduction of energy levels and thus ofeddy-induced mixing can be seen in the Iberian Basin, ex-tending southwestwards towards the Canary Basin. As ex-pected, this region coincides with what was seen in the rela-tive vorticity.
Since, as shown before, eddies have a clear signal in SSH,its variability should be also affected in the run without MWoutflow. Figure 16c shows the standard deviation of SSH af-ter removing the seasonal cycle. The slope region shows lowvalues of SSH variability (below 2 cm), the highest EKE re-gion (>7 cm) is again linked to the Azores Current and mod-erate values can be found in the Iberian Basin and, in par-ticular, over the variable topography of the Horseshoe chainof seamounts, with which many meddies are known to inter-act and, eventually, be disrupted (Richardson et al., 2000).The run without MW outflow presents lower values of SSHvariability (up to 5 cm), as can be seen by the positive differ-ences in standard deviation (Fig. 16d). The anomalous region
highly coincides with the corresponding positive anomalyarea seen in the layer-averaged EKE. Although three yearsare definitely not enough to derive significant statistics, webelieve the obtained pattern is robust. We thus here concludethat meddies are of determining importance to set the upperlayer variability in the Iberian Basin. More interestingly, thesame investigation was conducted for the non-seasonal SSTvariability (Fig. 16e). The standard deviation of the realisticrun shows the Gulfs of Cadiz and Biscay as regions of lowvariability (below 0.5◦C) and variability of up to 1◦C canbe found offshore. The pattern of the difference is now quitedistinct from that of SSH and EKE. In fact, positive anoma-lies are found onshore from the 3000-m isobath, fact that isattributed here to the meddy/dipole-induced impact on theupwelling regime, by extracting cold upwelled water fromthe coast within highly extended filaments. Further offshore,from 36◦ N up to 44◦ N, mainly positive anomalies can beseen, leading to the conclusion that eddies can have an im-pact on the SST variability of the Northeast Atlantic. Sinceeddies change the SST, the heat fluxes will also be changed,so we expect part of the difference between both runs to berelated to modified air-sea exchange.
5 Summary of conclusions
Surface filaments and eddies are known to be key factorsin the transfer processes of mass, heat and momentum be-tween the shelf and the deep ocean. The ability of eddies totransport and disperse dynamically passive (dissolved or sus-pended) materials can have far-reaching effects on the chem-ical and biological characteristics of the deep ocean. In thelast decade, field observations off the southern coast of Iberiawere able to detect the presence of cyclones associated withmeddies to form vortex pairs (dipoles) at the level of the MW.The dynamical fields associated with meddies and cyclonesextend vertically much farther than the depth range wherethe thermohaline anomaly is detected, and may reach levelsdown to 3000 m or up to the sea surface. The implicationsof such an extensive dynamical field in the shelf-deep oceanexchanges were here presented.
The comparison between float trajectories and the distri-bution of two scalar fields – SST and chl-a concentration– acting as passive tracers of the movement in the surfacelayers, showed that the surface expression of MW dipolescould be assessed by remote measurements. The mushroom-like surface patterns associated with the dipoles result fromthe wrapping of thermal and chlorophyll concentration gra-dients around the vortical structures. One general result isthe more clear identification of the cyclonic counterparts ofthe dipoles, thus indicating that the cyclone is more intense atshallower depths than the anticyclone and pointing to a baro-clinic character of the dipolar structure as a whole.
Furthermore, the altimetric signal of MW dipoles couldalso be reconstructed. On the other hand, their clear
www.ocean-sci.net/6/191/2010/ Ocean Sci., 6, 191–209, 2010

208 N. Serra et al.: Surface expression of MW dipoles
identification with altimetry imprints a barotropic characterto the currents in the dipoles. The fact that the cyclones couldbe identified for longer times at the surface is an indication ofthe barotropicity in cyclones or evidence of them being sur-face intensified features, whereas meddies are clearly mid-depth intensified. This fact is related to the differences in thegeneration, in the sense that the cyclones tend to be formed atshallower depths than the anticyclone. The altimetry resultsreinforce this fact since the SSH (or its anomaly) is some-how a depth-integrated quantity, giving the barotropic part ofthe water column velocity. So, even if the cyclone is weakerin strength, if it comprises more of the water column, it willshow up strongly at the surface.
A numerical model simulation forced by realisticatmosphere-ocean exchange confirmed here the verticalstructure of MW dipoles, the link between the MW layer cir-culation and the upper ocean and in particular the impact onSSH and SST. Our observational and model results also in-dicated that some of the filaments (most certainly those thatextend further offshore) that are frequently observed in thePortuguese coastal upwelling region are due to the presenceof MW meddies and cyclones. The dipolar system is ableto transport chlorophyll pigments away from the coastal re-gion for large periods of time (order of few months) beforedecaying or being destroyed by topography. This has impor-tant implications for the removal of high productivity watersfrom the coastal region.
Acknowledgements.This work was funded by the Por-tuguese Fundacao para a Ciencia e Tecnologia (FCT) projectsRENA (Contract PDCTE/CTA/49945/2003), MUD (Con-tract POCI/MAR/58384/2004) and SATMAR (ContractREEQ/1136/MAR/2005). The float data was acquired duringthe CANIGO project, supported by the EU MAST-3 programme(Contract MAS3-CT96-0060), and during the FCT project MED-TOP (Contract PDCTM/P/MAR/15301/1999). The SeaWiFSdata is a courtesy of the NASA SeaWiFS Project and the OrbitalSciences Corporation. The altimeter products were producedby the CLS Space Oceanography Division, Toulouse, France,as part of the EU Environment and Climate project AGORA(Contract ENV4-CT9560113) and DUACS (ENV4-CT96-0357).The authors aknowledge the computer resources and technicalassistance provided by the Barcelona Supercomputer Center –Centro Nacional de Supercomputacion.
Edited by: J. A. Johnson
References
Afansyev, Y., Kostianoy, A., Zatsepin, A., and coauthors: Analysisof velocity field in the eastern Black Sea from satellite data dur-ing the Black Sea 1999 experiment, J. Geophys. Res., 107(C8),3098, doi:10.1029/2000JC000578, 2002.
Ambar, I. and Howe, M.: Observations of the Mediterranean out-flow – I: Mixing in the Mediterranean outflow, Deep-Sea Res.,26, 535–554, 1979.
Ambar, I., Serra, N., Neves, F., and Ferreira, T.: Observations ofthe Mediterranean Undercurrent and eddies in the Gulf of Cadizduring 2001, J. Mar. Sys., 71, 195–220, 2008.
Armi, L. and Zenk, W.: Large lenses of highly saline MediterraneanWater, J. Phys. Oceanogr., 14, 1560–1576, 1984.
Armi, L., Hebert, D., Oakey, N., Price, J., Richardson, P.,Rossby, H., and Ruddick, B.: Two years of the life of a Mediter-ranean salt lens, J. Phys. Oceanogr., 19, 354–370, 1989.
Baey, J., Renouard, D., and D’Hieres, G.: Preliminary results aboutthe stability of an intermediate water current, Deep-Sea Res., 42,2063–2073, 1995.
Baringer, M. and Price, J.: Mixing and spreading of the Mediter-ranean outflow, J. Phys. Oceanogr., 27, 1654–1677, 1997.
Barton, E., Inall, M., Sherwin, T., and Torres, R.: Vertical structure,turbulent mixing and fluxes during lagrangian observations of anupwelling filament system off northwest Iberia, Prog. Oceanogr.,51, 249–267, 2001.
Bower, A., Armi, L., and Ambar, I.: Lagrangian observations ofmeddy formation during a mediterranean undercurrent seedingexperiment, J. Phys. Oceanogr., 27, 2545–2575, 1997.
Boyer, T., Levitus, S., Garcia, H., Locarnini, R., Stephens, C., andAntonov, J.: Objective analyses of annual, seasonal, and monthlytemperature and salinity for the World Ocean on a 0.25◦ grid,Int. J. Climatol., 25(7), 931–945, 2005.
Carton, X., Cherubin, L., Paillet, J., Morel, Y., Serpette, A., andCann, B. L.: Meddy coupling with a dep cyclone in the Gulf ofCadiz, J. Mar. Sys., 32, 13–42, 2002.
Cherubin, L., Carton, X., Paillet, J., Morel, Y., and Serpette, A.:Instability of the Mediterranean Water Undercurrents southwestof Portugal: Effects of baroclinicity and of topography, Oceanol.Acta, 23(5), 551–573, 2000.
Drillet, Y., Bourdalle-Badie, R., Siefridt, L., and LeProvost, C.:Meddies in the Mercator North Atlantic and MediterraneanSea eddy-resolving model, J. Geophys. Res., 110, C03016,doi:10.1029/2003JC002170, 2005.
Eames, I. and Flor, J.: Fluid transport by dipolar vortices, Dynam.Atmos. Oceans, 28, 93–105, 1998.
Fedorov, K.: Mushroom-like currents (vortex dipoles) in the oceanand in a laboratory tank, Ann. Geophys. B-Terr. P., 4, 507–516,1986.
Fiuza, A.: The Portuguese coastal upwelling system, in: Ac-tual problems of Oceanography in Portugal, Junta Nacional deInvestigacao Cientıfica e Tecnologica, Lisbon, Portugal, 45–71,1982.
Fiuza, A.: Upwelling patterns off Portugal, in: Coastal Upwelling:its sediment record, edited by: Suess, E. and Thiede, J., PlenumPress, 85–98 1983.
Flierl, G., Larichev, V., McWilliams, J., and Reznik, G.: The dy-namics of baroclinic and barotropic solitary eddies, Dynam. At-mos. Oceans, 5, 1–41, 1980.
Ginzburg, A., Kostianoy, A., Nezlin, N., et al.: Anticyclonic eddiesin the northwestern Black Sea, J. Mar. Sys., 32, 91–106, 2002.
Haynes, R., Barton, E., and Pilling, I.: Development, persistence,and variability of upwelling filaments off the Atlantic coast ofthe Iberian Peninsula, J. Geophys. Res., 98(C12), 22681–22692,1993.
Kalnay, E., Kanamitsu, M., Kistler, R., and coauthors: TheNCEP/NCAR 40-year reanalysis project, B. Am. Meteor. Soc.,77, 437–470, 1996.
Ocean Sci., 6, 191–209, 2010 www.ocean-sci.net/6/191/2010/

N. Serra et al.: Surface expression of MW dipoles 209
Kase, R. and Zenk, W.: Reconstructed mediterranean salt lens tra-jectories, J. Phys. Oceanogr., 17, 158–163, 1989.
Kase, R. and Zenk, W.: Structure of the Mediterranean Wa-ter and meddy characteristics in the northeastern Atlantic, in:The Warmwatersphere of the North Atlantic Ocean, edited by:Krauss, W., Gebruder Borntraeger, Berlin Stuttgart, 365–395,1996.
Kase, R., Beckmann, A., and Hinrichsen, H.: Observational evi-dence of salt lens formation in the Iberian Basin, J. Geophys.Res., 94, 4905–4912, 1989.
Large, W., McWilliams, J., and Doney, S.: Ocean vertical mixing:a review and a model with a nonlocal boundary layer parameter-ization, Rev. Geophys., 32, 363–403, 1994.
LeTraon, P. and Ogor, F.: ERS-1/2 orbit improvement usingTOPEX/POSEIDON: the 2 cm challenge, J. Geophys. Res., 103,8045–8057, 1998.
LeTraon, P., Nadal, F., and Ducet, N.: An improved mappingmethod of multi-satellite altimeter data, J. Atmos. Ocean. Tech.,25, 522–534, 1998.
Marshall, J., Adcroft, A., Hill, C., Perelman, L., and Heisey, C.:A finite-volume, incompressible Navier Stokes model for studiesof the ocean on parallel computers, J. Geophys. Res., 102, 5753–5766, 1997.
Mied, R., McWilliams, J., and Lindemann, G.: The generationand evolution of mushroom-like vortices, J. Phys. Oceanogr., 21,489–510, 1991.
Ochoa, J. and Bray, N.: Water mass exchange in the Gulf of Cadiz,Deep-Sea Res., 38, 465–503, 1991.
Oliveira, P., Serra, N., Fiuza, A., and Ambar, I.: A study of meddiesusing simultaneous in-situ and satellite observations, in: Satel-lites, Oceanography and Society, edited by: Halpern, D., vol. 63,Elsevier Oceanography Series, 125–148, 2000.
Oliveira, P., Nolasco, R., Dubert, J., Moita, T., and Peliz, A.:Surface temperature, chlorophyll and advection patterns duringa summer upwelling event off central Portugal, Cont. Shelf Res.,29, 759–774, 2009.
Paillet, J., Cann, B. L., Serpette, A., Morel, Y., and Carton, X.:Real-time tracking of a Galician meddy, Geophys. Res. Lett., 26,1877–1880, 1999.
Peliz, A., Santos, A., Oliveira, P., and Dubert, J.: Extremecross-shelf transport induced by eddy interactions southwestof Iberia in winter 2001, Geophys. Res. Lett., 31, L08301,doi:10.1029/2004GL019618, 2004.
Pingree, R.: The droguing of meddy Pinball and seeding withALACE floats, J. Mar. Biol. Assoc. UK, 75, 235–252, 1995.
Pingree, R. D. and Cann, B. L.: A shallow meddy (a smeddy)from the secondary Mediterranean salinity maximum, J. Geo-phys. Res., 98, 20169–20185, 1993.
Prater, M. and Sanford, T.: A meddy off Cape St. Vincent. Part I:Description, J. Phys. Oceanogr., 24, 1572–1586, 1994.
Relvas, P., Barton, E., Dubert, J., Oliveira, P., Peliz, A., Silva, J., andSantos, A.: Physical oceanography of the western Iberia ecosys-tem: latest views and challenges, Prog. Oceanogr., 74, 149–173,2007.
Richardson, P., Bower, A., and Zenk, W.: A census of meddiestracked by floats, Prog. Oceanogr., 45, 209–250, 2000.
Røed, L. P. and Shi, X.: A numerical study of the dynamics and en-ergetics of cool filaments, jets, and eddies off the Iberian Penin-sula, J. Geophys. Res., 104(C12), 29817–29841, 1999.
Sadoux, S., Baey, J., Fincham, A., and Renouard, D.: Experimentalstudy of the stability of an intermediate current and its interactionwith a cape, Dynam. Atmos. Oceans, 31, 165–192, 2000.
Sanchez, R., Relvas, P., Martinho, A., and Miller, P.: Physicaldescription of an upwelling filament west of Cape St. Vin-cent in late October 2004, J. Geophys. Res., 113, C07044,doi:10.1029/2007JC004430, 2008.
Santos, A., Peliz, A., Dubert, J., Oliveira, P., Angelico, M., andRe, P.: Impact of a winter upwelling event on the distributionand transport of sardine (Sardina Pilchardus) eggs and larvaeoff western Iberia: a retention mechanism, Cont. Shelf Res., 24,149–165, 2004.
Schauer, U.: A deep saline cyclonic eddy in the west Europeanbasin, Deep-Sea Res., 36, 1549–1565, 1989.
Schultz-Tokos, K. and Rossby, T.: Kinematics and dynamics ofa mediterranean salt lens, J. Phys. Oceanogr., 21, 879–892, 1991.
Schultz-Tokos, K., Hinrichsen, H., and Zenk, W.: Merging andmigration of two meddies, J. Phys. Oceanogr., 24, 2129–2141,1994.
Serra, N.: Observations and numerical modelling of the Mediter-ranean Outflow, in: Ph.D. Thesis., University of Lisbon., p. 234,2004.
Serra, N. and Ambar, I.: Eddy generation in the Mediterranean un-dercurrent, Deep-Sea Res. Pt. II, 49, 4225–4243, 2002.
Serra, N., Sadoux, S., Ambar, I., and Renouard, D.: Observationsand laboratory modeling of meddy generation at Cape St. Vin-cent, J. Phys. Oceanogr., 32, 3–25, 2002.
Serra, N., Ambar, I., and Kase, R.: Numerical modelling of theMediterranean Water splitting and eddy generation, Deep-SeaRes. Pt. II, 52, 383–408, 2005.
Shi, X. and Røed, L.: Frontal instabilities in a two-layer, primitiveequation ocean model, J. Phys. Oceanogr., 29(5), 948–968, 1999.
Sousa, F. and Bricaud, A.: Satellite-derived phytoplankton pigmentstructures in the Portuguese upwelling area, J. Geophys. Res.,97(C7), 11343–11356, 1992.
Stammer, D., Hinrichsen, H., and Kase, R.: Can meddies be de-tected by satellite altimetry?, J. Geophys. Res., 96, 7005–7014,1991.
Swallow, J.: A deep eddy off cape St. Vincent, Deep-Sea Res., 16,285–295, 1969.
Velasco-Fuentes, O. and van Heijst, G.: Experimental study of dipo-lar vortices on a topographicβ-plane, J. Fluid Mech., 259, 79–106, 1994.
Zenk, W., Schultz-Tokos, K., and Boebel, O.: New observations ofmeddy movement south of the Tejo Plateau, Geophys. Res. Lett.,19, 2389–2392, 1992.
www.ocean-sci.net/6/191/2010/ Ocean Sci., 6, 191–209, 2010


![UPWELLING, EKMAN MASS TRANSPORT AND EL NIÑO, ENS O & …ocw.umb.edu/environmental-earth-and-ocean-sciences/eeos-630-biol… · on Ekman transport and upwelling.] Comments on upwelling](https://img.pdfslide.us/doc/110x75/606d25ba60c7861ff966b665/upwelling-ekman-mass-transport-and-el-nio-ens-o-ocwumbeduenvironmental-earth-and-ocean-scienceseeos-630-biol.jpg)