Embed Size (px)
Citation preview
GEOPHYSICS, VOL. 52, NO. 7 (JULY 1987); P. 858-874, 13 FIGS.
Surface emittance, temperature, and thermal inertia derived from
Thermal Infrared Multispectral Scanner (TIMS) data for
Death Valley, California
Anne B. Kahle*
ABSTRACT
The NASA airborne Thermal Infrared Multispectral Scanner (TIMS) was flown over Death Valley, Califor- nia on both a daytime flight and a nighttime flight within a two-day period in July 1983. This Daedulus scanner has six channels in the thermal infrared, be- tween 8 and 12 pm. Calibrated digital spectral radiance data from these flights, along with Landsat Thematic Mapper (TM) reflectance data, permit the calculation of both spectral emittance and thermal inertia.
spectral emittance images were derived for the test area for data sets from both the day and night tests, and they show good qualitative agreement. Comparison of the numerlcal values of emittance derived from these day and night images shows a decrease in spectral con- trast at night. This is probably due primarily to an in- creased atmospheric contribution to the radiance reach- ing the sensor at night_ whm_ the ground is cold, rather than to a change in spectral characteristics of the sur- face at night.
These spectral emittance data contribute to an under- standing of the physical basis for the discrimination of differences in surface materials afforded by TIMS data. These emittance data show good qualitative agreement with field emittance data taken in the same areas and with laboratory spectral reflectance data for samples from the Death Valley area. The strongest spectral fea- ture commonly seen lies between 8 and 10 pm and is ascribed to the fundamental silicon-oxygen stretching vibration of quartz and other silicate minerals. This fea- ture allows identification of quartzite and discrimi- nation of other silicate rocks in images produced from the TIMS data. Spectral features of other minerals, such as the = 11.3 pm band of carbonates, are also detectable in laboratory spectra and field spectra.
Using the day and night surface temperature data and Landsat TM reflectance data, an apparent thermal inertia image has been produced. This image allows sep- aration of some bedrock units and separation of bed- rock from alluvium. The temperature images allow in- ferences about the soil moisture and/or soil conditions on some of the alluvial fans.
INTRODUCTION
The NASA airborne Thermal Infrared Multispectral Scan- ner (TIMS) has six wavelength channels between 8 and 12 pm, an instantaneous field of view of 2.5 mrad, and a total field of view of 80 degrees (Kahle and Goetz, 1983; Palluconi and Meeks, 1985). The instrument has excellent sensitivity, ranging between 0.1 and 0.3 K noise-equivalent temperature change in each channel at 300 K. Spectral radiance data are acquired in digital format, with calibration provided for each scan line by two built-in black bodies at measured temperatures.
In July 1983, the TIMS was flown over Death Valley, Cali- fornia (Figure 1) on a daytime flight and a nighttime (pre-
dawn) flight within a two-day period. Data were provided to JPL by NASA/NSTL as calibrated computer compatible tapes. The measured spectral bands during the 1983 flights were 8.15-8.5, 8.6-9.0, 9.G9.3, 9.6-10.2, 10.3-11.1, and 11.3- II.6 pm. These wavelengths are slightly changed from those reported earlier (Kahle and Goetz, 1983), because the instru- ment configuration has changed (Palluconi and Meeks, 1985). The availability of calibrated digital data permits the calcula- tion of day and night surface temperature, surface spectral emittance, and (when Landsat TM data are also available) thermal inertia. The term “emittance” is used here to describe the ratio of the measured radiance from a natural surface to the radiance of a black body at the same kinetic temperature.
Manuscript received by the Editor January 13, 1986; revised manuscript received September 2, 1986. *Jet Propulsion Laboratory, California Institute of Technology, 183-501,480U Oak Grove Drive, Pasadena, CA 91109 (_“ 1987 Society of Exploration Geophysicists. All rights reserved.
Analysis of TIMS Data-Death Valley 859
I recognize that the term “emissivity” is often used for this ratio, but prefer to reserve the term “emissivity” to describe the same ratio as an intrinsic property of a pure substance.
DATA PROCESSING
Preliminary image processing of the data from both the day and night flights included panoramic correction and calibra- tion to radiance using the onboard black bodies and the mea- sured spectral response of each channel. See Palluconi and Meeks (1985) or Kahle et al. (1980) for details of these calcula- tions. Examination of black-and-white images of the six channels of radiance data revealed the presence of noise in the data. Scene-dependent, isolated point noise due to bit drops was located by the relatively discontinuous values and re-
placed by the average of the surrounding data values. Bad lines were repaired using values interpolated from adjacent lines. Coherent noise due to microphonics was not removed in these data as it’ had been in earlier data sets (Kahle, 1983) because it was not judged to be too severe.
The measured radiance has a strong dependence on the surface temperature, causing the radiance data to be very highly correlated from one spectral channel to the next. How- ever, much of the diagnostic information in the multispectral
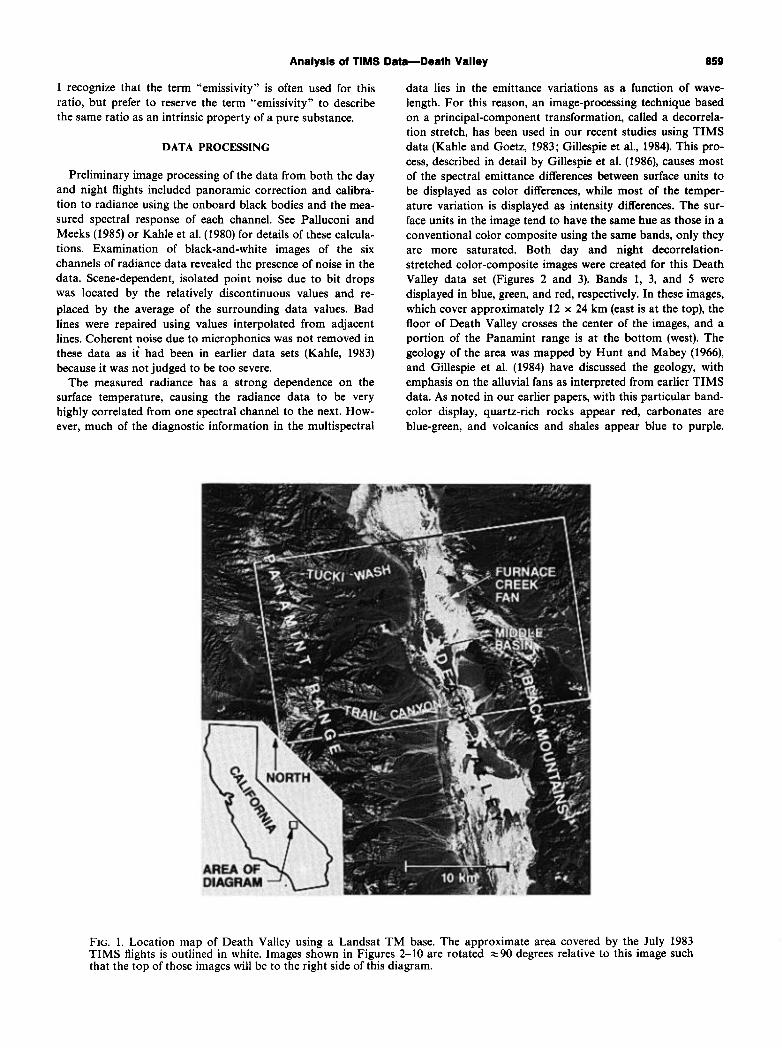
data lies in the emittance variations as a function of wave- length. For this reason, an image-processing technique based on a principal-component transformation, called a decorrela- tion stretch, has been used in our recent studies using TIMS data (Kahle and Goetz, 1983; Gillespie et al., 1984). This pro- cess, described in detail by Gillespie et al. (1986), causes most of the spectral emittance differences between surface units to be displayed as color differences, while most of the temper- ature variation is displayed as intensity differences. The sur- face units in the image tend to have the same hue as those in a conventional color composite using the same bands, only they are more saturated. Both day and night decorrelation- stretched color-composite images were created for this Death Valley data set (Figures 2 and 3). Bands 1, 3, and 5 were displayed in blue, green, and red, respectively. In these images, which cover approximately 12 x 24 km (east is at the top), the floor of Death Valley crosses the center of the images, and a portion of the Panamint range is at the bottom (west). The geology of the area was mapped by Hunt and Mabey (1966), and Gillespie et al. (1984) have discussed the geology, with emphasis on the alluvial fans as interpreted from earlier TIMS data. As noted in our earlier papers, with this particular band- color display, quartz-rich rocks appear red, carbonates are blue-green, and volcanics and shales appear blue to purple.
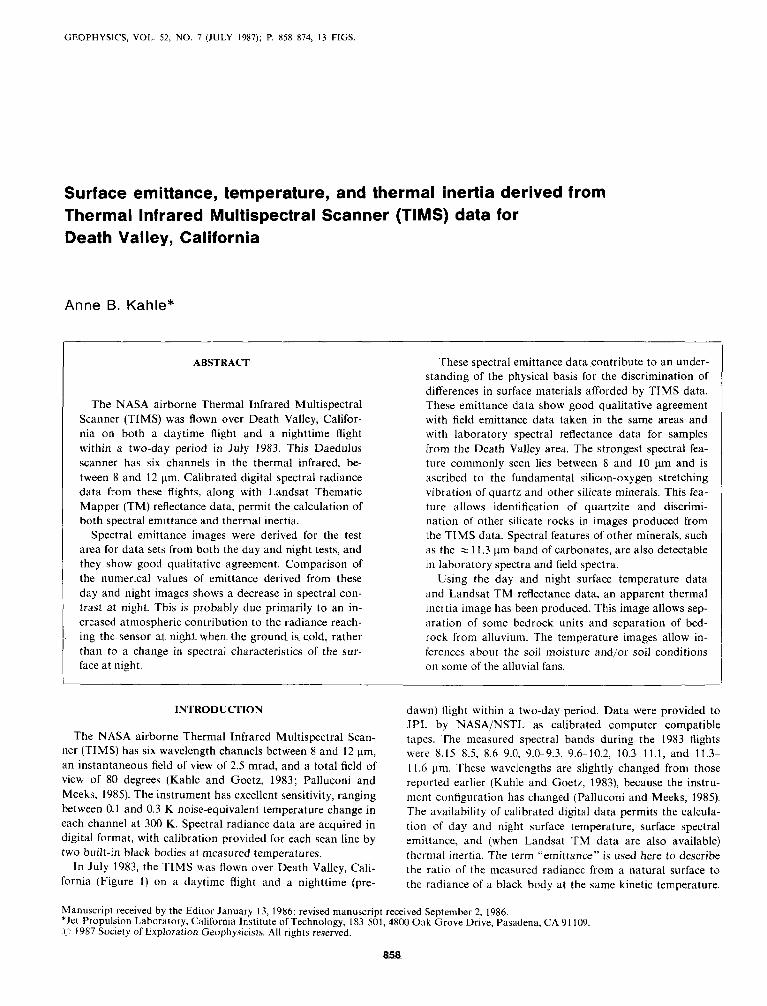
FIG. 1. Location map of Death Valley using a Landsat TM base. The approximate area covered by the July 1983 TIMS flights is outlined in white. Images shown in Figures 2-10 are rotated ~90 degrees relative to this image such that the top of those images will be to the right side of this diagram.
Kahle
FIG. 2. Day decorrelation-stretched TIMS image of the study area. Bands 1, 3, and 5 are displayed as blue, green, and red, respectively. Quartz-rich rocks appear red, carbonates blue-green, and volcanics and shales blue to purple. A = Stirling quartzite, B = Eureka quartzite, C = carbonates-mostly dolomites (Bonanza King, Pogonip, Nopah formations), D = Tertiary andesites, E = Tertiary rhyolites, F = andesite outcrop in lower part of Tucki Wash) G = Bonanza King (dolomite) in lower part of Tucki Wash, H = outcrop of quartzite in lower part of Tucki Wash, I = Furnace Creek fan, and J = Middle basin.
3
Analysis of TIMS Data-Death Valley
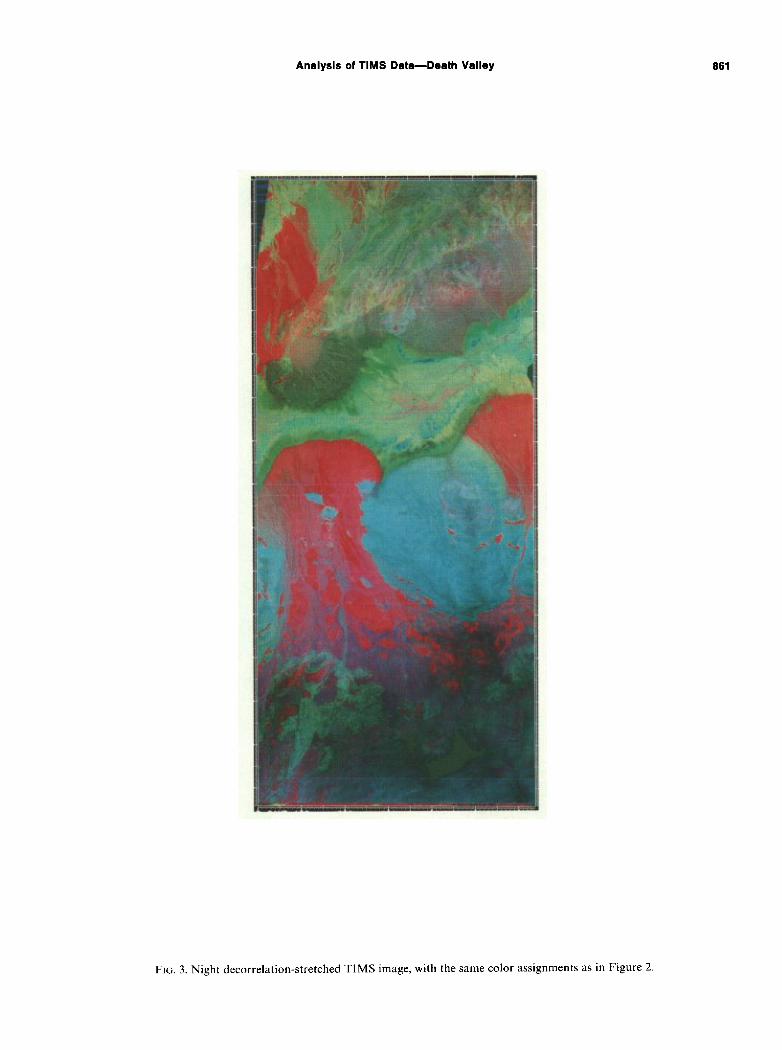
FIG. 3. Night decorrelation-stretched TIMS image, with the same color assignments as in Figure 2.
881
862 Kahle
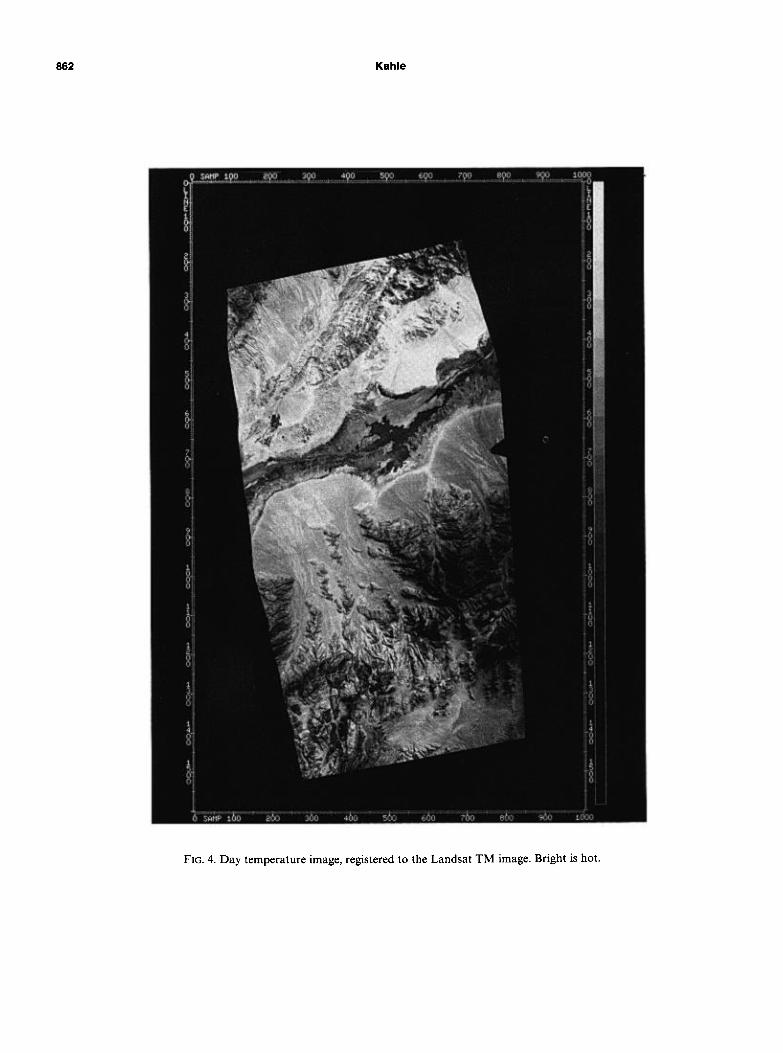
FIG. 4. Day temperature image, registered to the Landsat TM image. Bright is hot.
Analysis of TIMS Data-Death Valley 883
Comparing the images to the map of Hunt and Mabey (1966) one can see the bright red areas in the upper part of Tucki Wash (A) correspond to outcrops of Precambrian Stirling quartzite. In the right center of the image, small red areas (B) that correspond to the Ordovician Eureka quartzite occur within the predominantly blue-green region (C) that corre- sponds to Cambrian and Ordovician dolostone of the Bon- anza King, Pogonip, and Nopah formations. Tertiary andesit- ic (D) and rhyolitic (E) volcanic rocks (differentiated in the field by Gillespie et al., 1984) crop out along the front of the Panamint Range (center of image) and appear blue and mag- enta, respectively. In the center of the lower part of the Tucki Wash, an outcrop of andesite (F) (blue) and an outcrop of Bonanza King dolomite (G) (green) are separated by a small outcrop of Eureka (?) quartzite (H) (red). [The latter was mapped by Hunt and Mabey (1966) as a fault-bound slice of Bonanza King dolomite, but field observations by Gillespie et al. (1984) indicated that it is a quartzite, probably Eureka.]
Comparison of the day-night pair shows that the hues, cor- responding to emittance, are similar in the various rock units, while the most striking differences between images are in the intensities of various units, explainable on the basis of day- night temperature effects. Thus, Figures 2 and 3 tend to con- firm that the decorrelation stretch processing displays spectral differences in color, and temperature in intensity (discussed in more detail later). The purpose of this paper is to go beyond this decorrelation stretch to look at emittance and temper- ature data separately.
CALCULATION OF TEMPERATURE, EMITTANCE, AND THERMAL INERTIA
In order to sepamte the spectral_ and temperature infor- mation contained in these TIMS data, a method developed by Kahle et al. (1980) is used. It is assumed that the emittance of the ground at every point is equal to 0.93 in the wavelength region of channel 6 (11.3-11.6 am). Then, Planck’s law states
L, = E>” &(h, T) = EI-Ci
h5 exp (C,jhT) - 1 where I’
L, = measured radiance, IV’ = black-body radiance,
h = wavelength, T = temperature,
C, = first radiation constant, CZ = second radiation constant, and c1 = emittance.
This equation is solved numerically for ground temperature for each pixel in channel 6. Using these temperature values, Planck’s law is then solved in each of the other channels for emittance E*.
The assumption of constant emittance in channel 6 is easy to use and any errors introduced are not too serious. How- ever, one must remember the implications this assumption will have when interpreting the results. In particular, laboratory and field spectra indicate that, in general, the silicates will still have a somewhat depressed emittance in this wavelength region, and that the carbonates have a fairly significant emis-
sion minimum centered in this region. Both rock types, then, may have an emittance near 0.93, the chosen value; but other rocks, soils, and vegetation may have higher emittance values here. Underestimating the emittance has the effect of raising the calculated temperature, and hence lowering the calculated emittance, elsewhere in the spectrum for the surface materials (rocks, soils, vegetation). The position of the maximum of the black-body curve of radiance as a function of wavelength (Planck’s law) shifts as a function of temperature. Therefore, an error in calculation of temperature will also cause a slight change in the shape of derived spectral curves; however, in most cases, this will be of secondary importance.
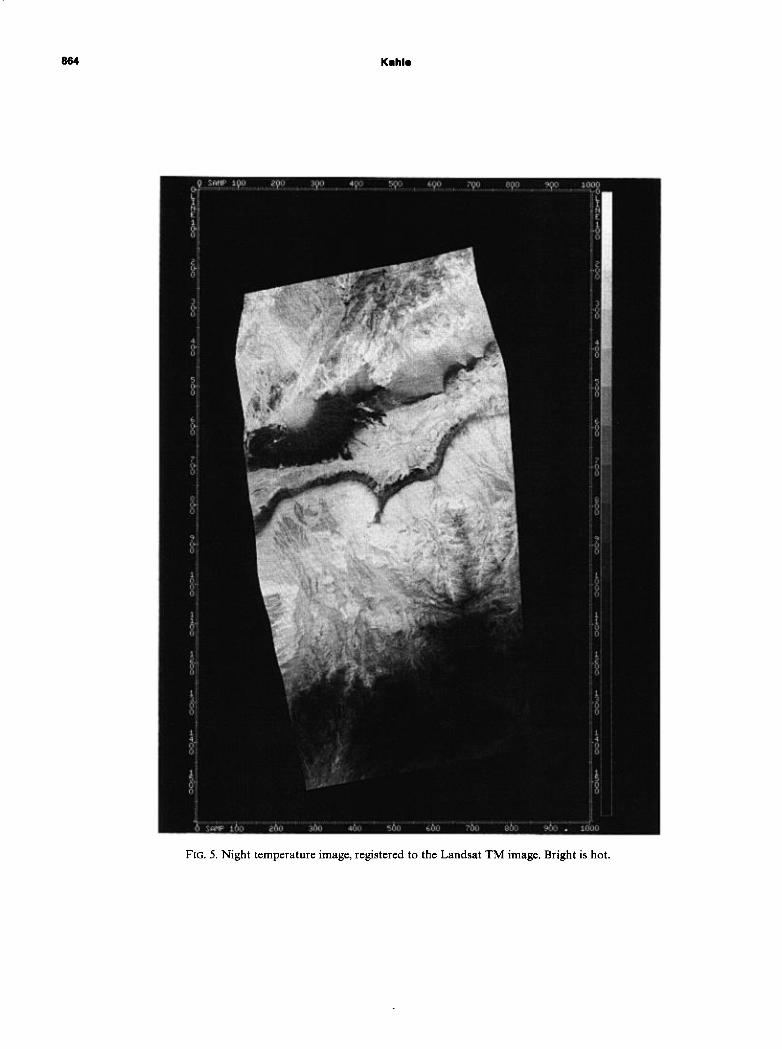
Both day and night data sets were processed by the method just described. There are significant differences to be seen in the day and night temperature images which, as indicated above, were derived from channel 6 (Figures 4 and 5). These images display temperature as brightness, with hotter areas brighter. They are “stretched” separately so that a brightness value in one image cannot be compared directly with a bright- ness value in the other image. Although numerical values of the temperatures do exist, these stretched images should only be used in a relative sense. In the day image, shaded slopes (facing north) are cooler (darker) than the slopes facing the sun. This illumination-aspect effect disappears in the night image. The very high Panamint Mountains at the bottom of the image are cold at night due to radiative cooling. Two other areas exhibit striking day-to-night temperature differ- ences. Middle Basin, in the bottom of the valley floor, has standing water that keeps the area relatively cool (dark) in the day image and relatively warm (bright) in the night image. Conversely, Furnace Creek fan is very hot in the day image and very cold in the night image. This fan, composed of ma- terial wtth very low thermai inertia, bakes dry~an& ‘becomes very hot in the daytime. At night, water entering the valley at Furnace Creek apparently makes its way to the surface where significant evaporative cooling takes place. A similar effect, of much more limited extent, can be seen at the bottom of the fans coming out of the Panamint Mountains. The ability to detect this effect could be very useful in hydrologic studies.
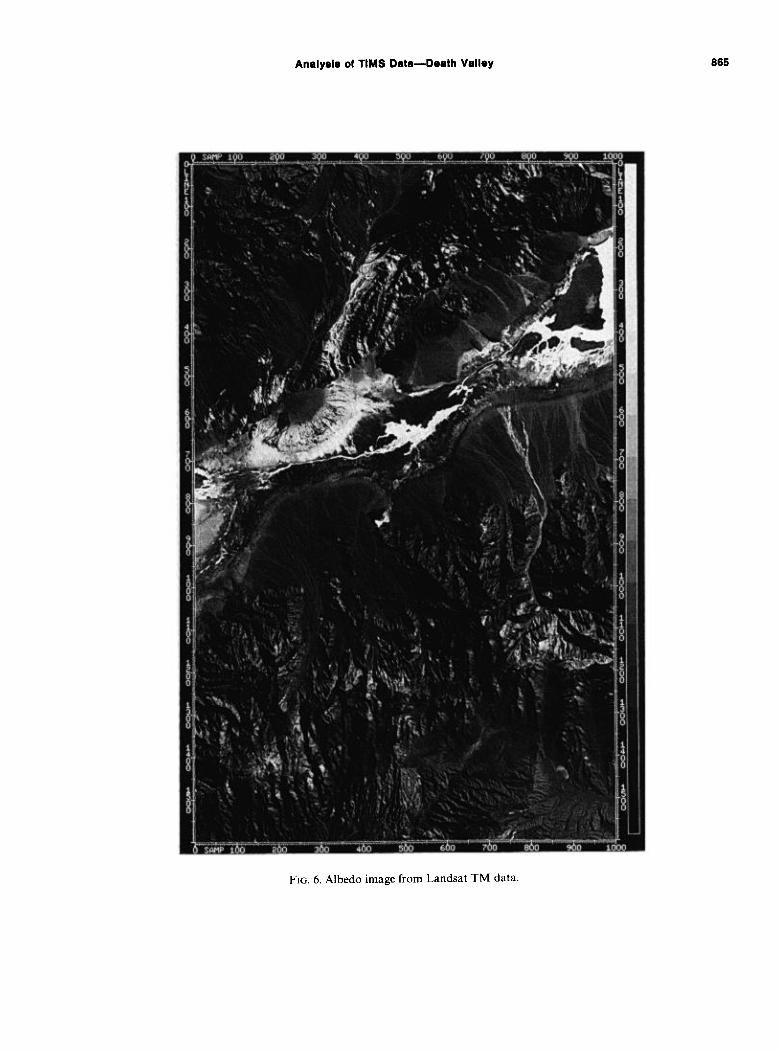
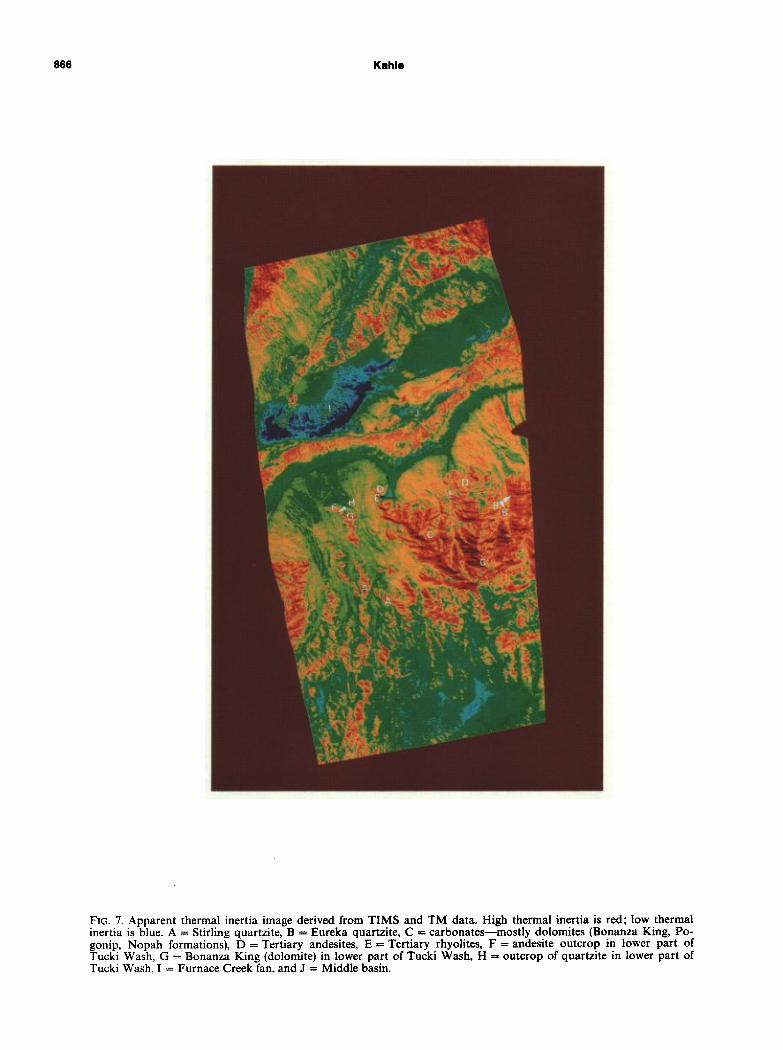
To examine these thermal differences further, an apparent thermal inertia image was produced from the day and night temperature images coregistered with Landsat Thematic Mapper (TM) data. Earnest Paylor (Pers. comm.) provided ground calibration data to enable the construction of an albedo image (Figure 6) from a combination of all six visible and near-infrared (NIR) channels of TM data. The apparent thermal inertia image was then constructed from the Price (1977) formula, ATI z (1 - .4)/AT, ignoring, for simplicity, the topographic and atmospheric effects. Thermal inertia, a bulk physical property of the surface material equal to (K pc)‘,Q where K = thermal conductivity, p = density, and c = specific heat, adds complementary information to spectraldata. This thermal inertia image is shown in Figure 7, where the highest values of thermal inertia are displayed in red, the lowest values are in blue, and intermediate values are distrib- uted spectrally between the extremes. In the image, the largest area of high thermal inertia is the dark red through yellow- orange mountainous area in the right-center. This mostly cor- responds to the Bonanza King, Pogonip, and Nopah forma-
(continued on p, 870)
Kahle
FIG. 5. Night temperature image, registered to the Landsat TM image. Bright is hot.
Analysis of TIMS Data-Death Valley
FIG. 6. Albedo image from Landsat TM data.
665
666 Kahle
FIG. 7. Apparent thermal inertia image derived from TIMS and TM data. High thermal inertia is red; low thermal inertia is blue. A = Stirling quartzite, B = Eureka quartzite, C = carbonates-mostly dolomites (Bonanza King, Po- gonip, Nopah formations), D = Tertiary andesites, E = Tertiary rhyolites, F = andesite outcrop in lower part of Tucki Wash, G = Bonanza King (dolomite) in lower part of Tucki Wash, H = outcrop of quartzite in lower part of Tucki Wash, I = Furnace Creek fan, and J = Middle basin.
Analysis of TIMS Data-Death Valley 667
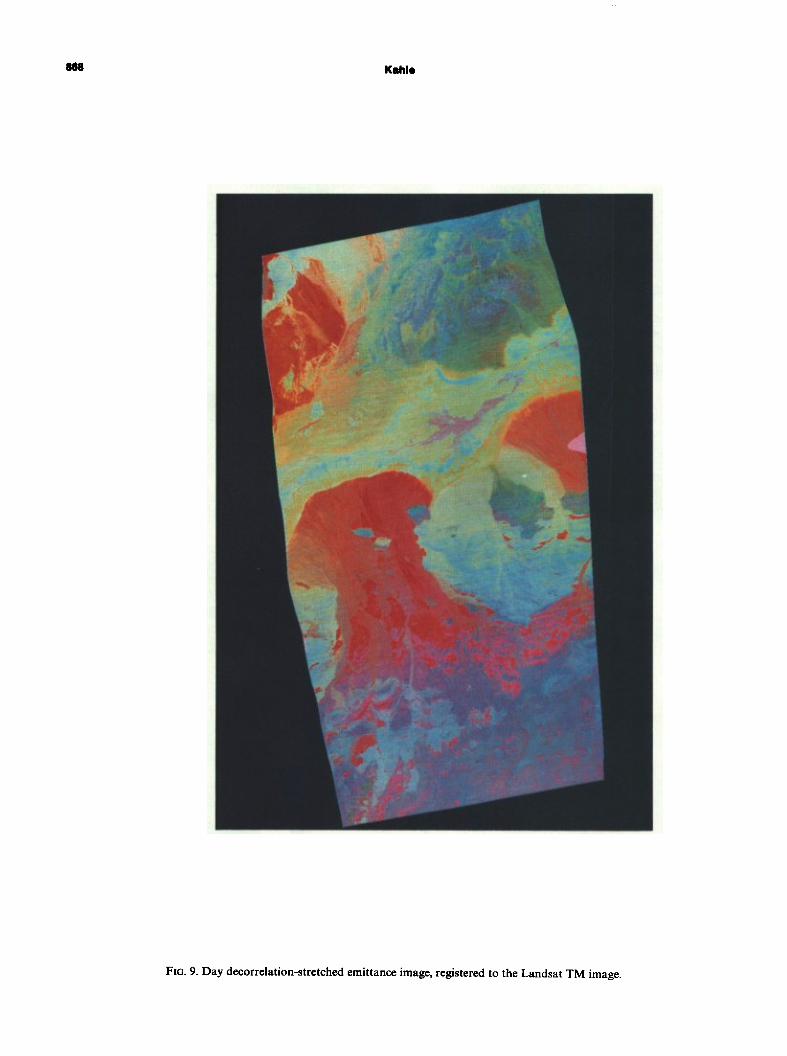
FIG. 9. Day decorrelation-stretched emittance image, registered to the Landsat TM image.
Analysis of TIMS Data-Death Valley
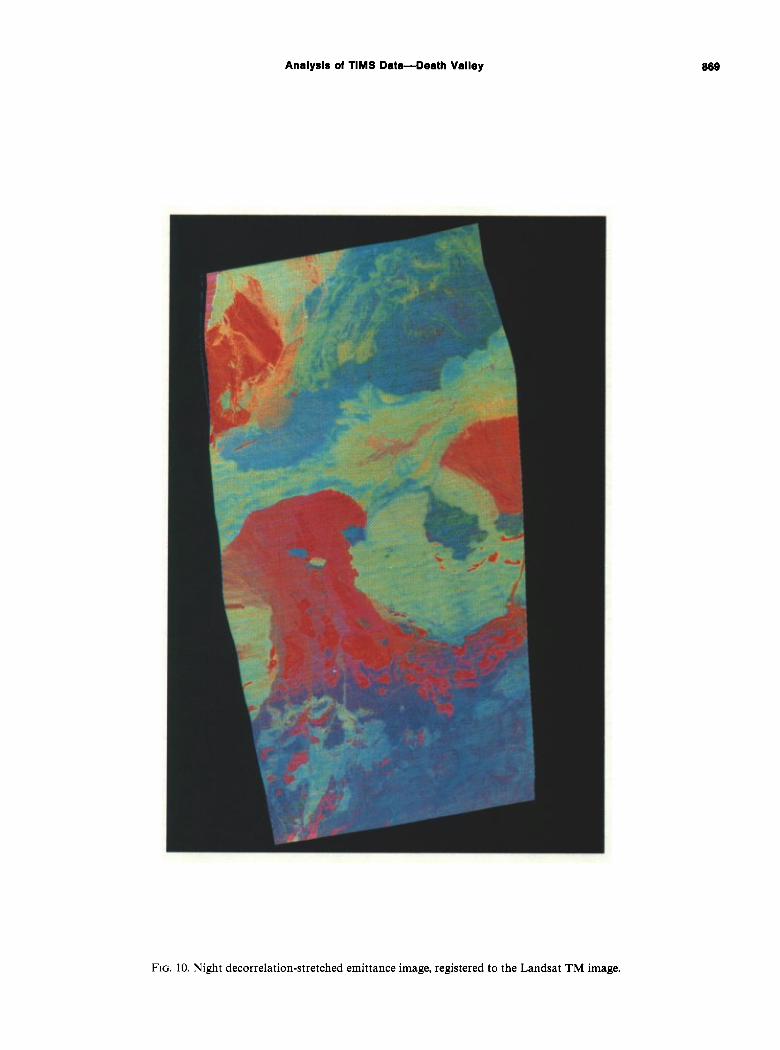
FIG. 10. Night decorrelation-stretched emittance image, registered to the Landsat TM image.
669
870 Kahle
(continuedfrom p. 863)
tion dolostone (C) (see Figure 2, where these dolostones are blue-green). It is apparent from the texture of the image that topographic effects, not having been removed, are quite prominent in this (and other) area(s) of high relief. Neverthe- less, it is possible to integrate mentally and recognize that the average thermal inertia is higher in the dolomitic areas. Refer- ring again to Figure 2, one can see that the volcanic units (D and E) just east of these carbonates have slightly lower ther- mal inertia (Figure 7). It is not possible to distinguish the Eureka quartzite (B) in this area from the associated dolo- mites. Looking at the isolated outcrops of andesite (F) and dolomite (G) at the lower end of Tucki Wash (identified earlier in Figure 2) in this thermal inertia image the dolomite (red) has higher thermal inertia than the andesite (orange) and both have higher thermal inertia than the small outcrop of quart- zite (H) (yellow) which separates them.
The area of extremely low thermal inertia (deep blue) is the Furnace Creek fan (I). However, because of the probability of change in moisture content at the surface, the concept of de- riving thermal inertia from the diurnal temperature range loses meaning, since the physical properties of the surface are not constant over the time interval, and the thermal effects of evaporation have not been taken into account. In addition, the meanings of the values of derived thermal inertia in the valley floor are also ambiguous due to transient thin layers of water over white salt pan, deeper areas of standing water, and large wet areas with evaporative cooling. The areas of stand- ing water, including Middle Basin (J) and Salt Creek, are blue and green in the image, implying lower thermal inertia than the surrounding wet and/or dry salt flats (yellow and orange).
The most striking use of this thermal inertia image is in the differentiation of bedrock outcrops from derived alluvium. This feature is most evident in Tucki Wash. Comparing Figure 7 with Figure 2, one can see that the bedrock outcrops (A) in the Tucki Wash appear considerably smaller and of a more erratic shape in the thermal inertia image (where they appear red to orange) than in the decorrelation image (where the quartzites are red and the shales magenta). These outcrops form steep hills above the large alluvial fan. The high values of thermal inertia represent only the outcrops of bedrock because of their higher conductivity and density and, hence, higher thermal inertia. The decorrelation image depicts the entire area of the hills, composed of both outcrops and derived debris slopes, since both these materials have the same miner- alogy.
In general, however, I feel there is much more useful geolog- ic information in the spectral data of Figure 2 than in the thermal inertia data of Figure 7.
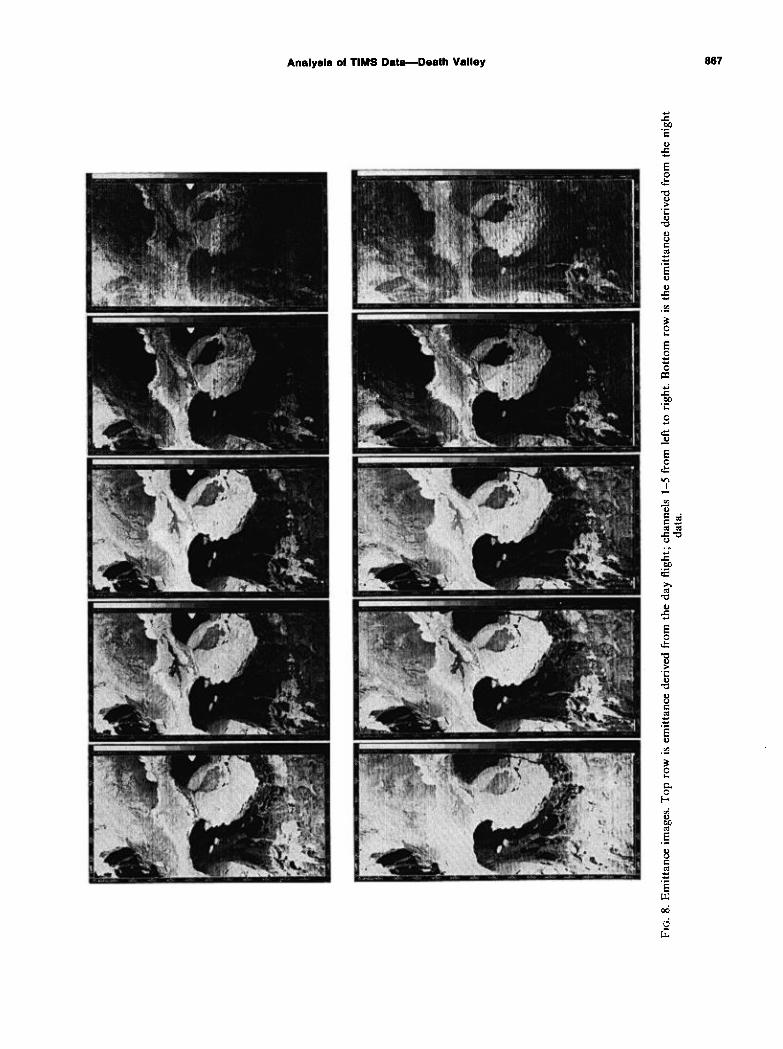
The emittance images, which were created for channels 1 through 5 for both the day and night data, are shown in Figure 8 with high emittance areas being bright. In addition, channels 1, 3, and 5 of the emittance were displayed in blue, green, and red, respectively, using the decorrelation stretch, for both the day and night data sets (Figures 9 and 10). The similarity of the day and night images demonstrates that the procedure for removing the temperature and displaying only emittance is at least qualitatively correct. The emittance images of channel 5 for both day and night (Figure 8) appear quite noisy, an artifact introduced by assuming that all emit- tance values in channel 6 are equal to a constant. Because the
emittance in channel 5 is correlated to the emittance in channel 6, it also is being forced toward a constant value, leaving small dynamic range in the image.
The original daytime radiance images (not shown), along with the daytime temperature image, show marked temper- ature patterns related to topography and moisture; these pat- terns are for the most part removed in Figures 8-10. The most notable remaining difference between the day and night images of Figures 9 and 10 is in the Furnace Creek fan, where increased moisture could change the spectral signature of the material. It is also possible, as discussed earlier, that there might be a skewing of the spectral curve caused by an error in the assumed value of the emittance in channel 6. This change in spectral shape could be more significant on this fan because of the extreme diurnal temperature range.
Spectral differences among rock units are consistent from day to night. In the black-and-white emittance images (Figure 8), the darkest (low emittance) units in channel 1 are the Eureka and Stirling quartzites. This is attributed to the strong quartz bands ascribed to the silicon-oxygen stretching vibra- tion (Hunt and Salisbury, 1974). The relatively low emittance of the quartzite becomes less pronounced with increasing wavelength. Alluvial fans which contain abundant quartzite clasts in an argillacious matrix, such as the prominent Tucki Wash and Trail Canyon fan, are also quite dark, as are their source areas. Spectrally flat carbonates and their derived fans are bright (relatively high emittance) in all channels. The most noticeable changes with wavelength are in the volcanic units, including the small andesite outcrop located in the Tucki Wash. These volcanics have a fairly high relative emittance in channel 1 which decreases with increasing wavelength through channel 4, the location of the reststrahlen band of the silicates. These observations are all predictable from laboratory obser- vations (Lyon, 1965).
FIELD AND LABORATORY SPECTRAL DATA
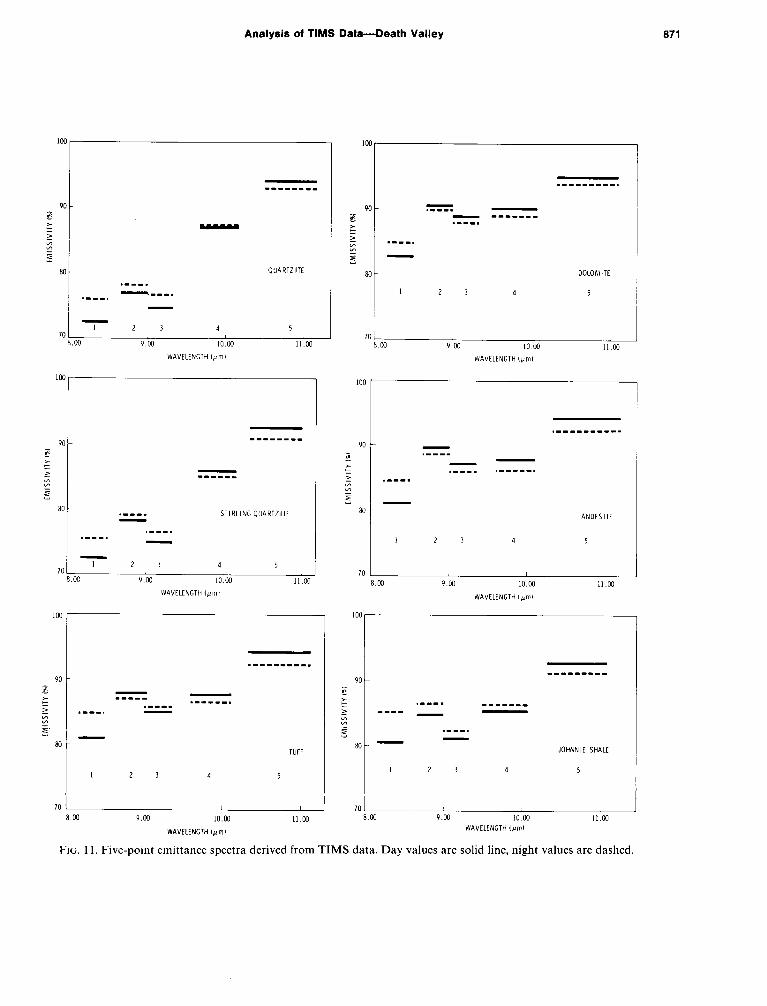
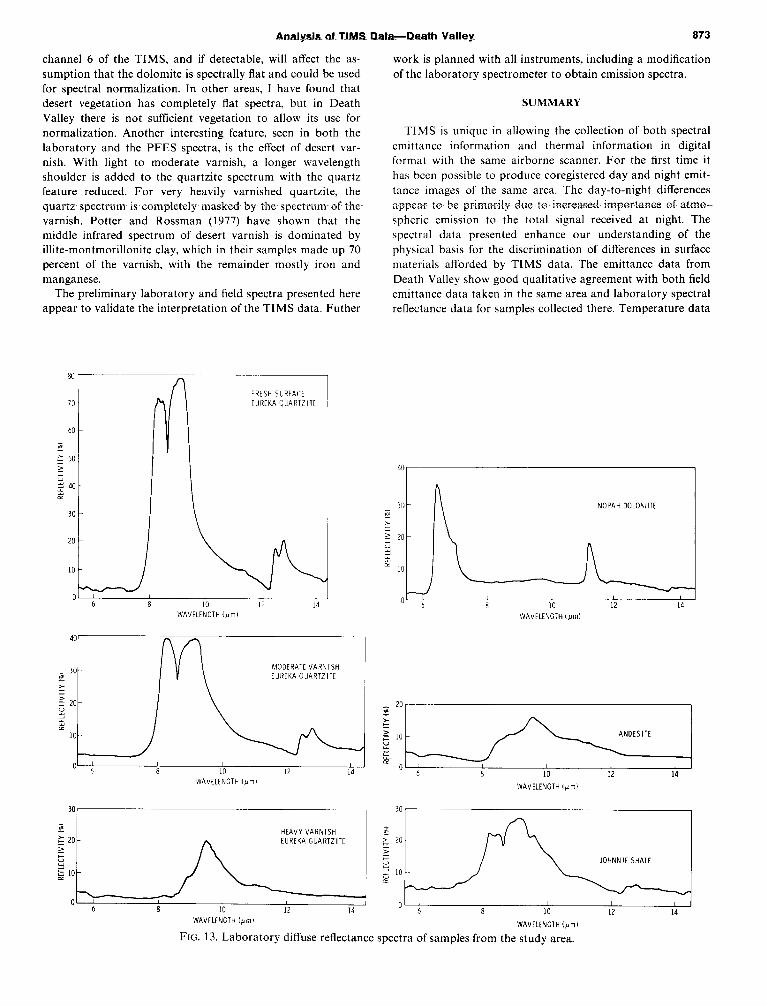
To facilitate comparison of ground emittance, both the day and night images were registered to the same Landsat-D TM image. Five-point emittance spectra were then extracted from the data for approximately 90 5 x 5 pixel areas over known geologic units. Six of these spectra (two from quartzite, and one each from tuff, dolomite, andesite, and shale) are shown in Figure 11. For comparison, spectra of the same or similar units taken in the field with the Jet Propulsion Laboratory’s Portable Field Emission Spectrometer (PFES) (Hoover and Kahle, 1986) are shown in Figure 12. Diffuse reflectance spec- tra of field samples collected in the same areas were obtained (Figure 13) using a laboratory Analect Fourier transform in- frared spectrometer.
In Figure 11, selected daytime five-value TIMS spectra are shown as a solid line and the night data are shown as a dashed line. In these examples, and also in 84 other derived spectra, the value in channel 1 is consistently several percent higher in the night data than in the day data. I ascribe this to atmospheric effects. Channel 1 is in the wing of an atmospher- ic water band, and these data have not been corrected for atmospheric absorption and emission. Kahle et al. (1981) have shown, using the LOWTRAN model (Kneizys et al. 1980), that atmospheric emission effects are much more significant when the ground is cold, since they are then a larger percent
Analysis of TIM Data-Death Valley 871
5 70 7c
8.00 9.w lo.w 11.00
WAVELENGTHl~ml
‘“r IQ0 90'
iz > r 2 2 .s
________
E
.---_____. ___---___
90 - 90 -
s g
z _B___
.-__w_.
; 2 .___. .___I
2 ._B_. ;
-______ ____
2
5'
80-- s
.___a
80- - TIJFF JOHNNIE SHALE
l-
I-
I-
,_ 8
8.1 8cx 70 9.w 10.00 1l.W w 9.00 10.00 11.00
WAVELENGTH,,,ml WAVELENGTHlpml
IW 100
1 1
03 PW 10 w 11.00
WAVELENGTHlpm)
1 2 I 2 3 3 4 4 5 5
70 I 70 / 1 800 9.w 10.00 Il.00 a.00 9.w IO 00 II w
WAVELENGTH(fim) WAVELENGTHlrmI
FIG. 11. Five-point emittance spectra derived from TIMS data. Day values are solid line, night values are dashed.
872 Kahle
of the total signal reaching the sensor. In Figure 11, it can be seen that the apparent total spectral range is thus decreased at night (predawn) when the ground is very cold. It is possible, though, that there are real changes in the spectral emission from day to night caused by the change in direction of the near-surface temperature gradient. This effect needs to be in- vestigated further.
For the daytime spectra, as expected, the quartzites have the lowest values in channels l-3. The fact that the dolomite spectrum should be essentially flat, but instead its emittance is rising with wavelength, I suspect is due to atmospheric effects. If the data were normalized to a flat spectrum for the dolo- mite, then the remaining intermediate spectra (volcanics and shale) would display a weak minimum somewhere between 9 and 10 urn, as expected.
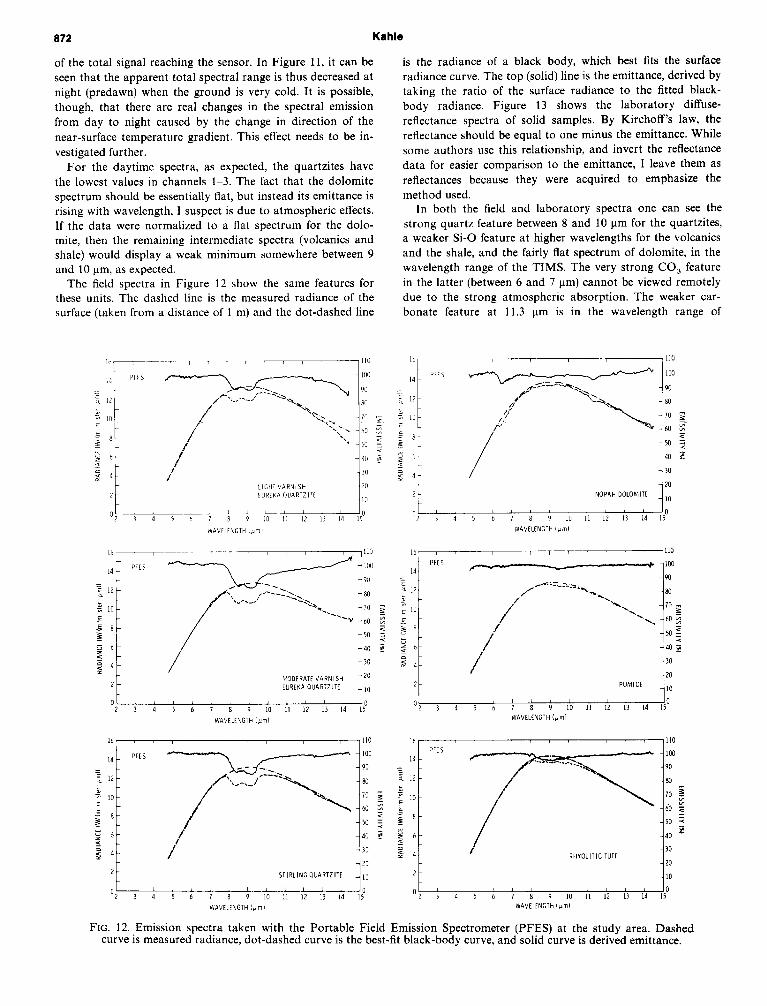
The field spectra in Figure 12 show the same features for these units. The dashed line is the measured radiance of the surface (taken from a distance of 1 m) and the dot-dashed line
is the radiance of a black body, which best fits the surface radiance curve. The top (solid) line is the emittance, derived by taking the ratio of the surface radiance to the fitted black- body radiance. Figure 13 shows the laboratory diffuse- reflectance spectra of solid samples. By Kirchoff’s law, the reflectance should be equal to one minus the emittance. While some authors use this relationship, and invert the reflectance data for easier comparison to the emittance, I leave them as reflectances because they were acquired to emphasize the method used.
In both the field and laboratory spectra one can see the strong quartz feature between 8 and 10 urn for the quartzites, a weaker Si-0 feature at higher wavelengths for the volcanics and the shale, and the fairly flat spectrum of dolomite, in the wavelength range of the TIMS. The very strong CO, feature in the latter (between 6 and 7 urn) cannot be viewed remotely due to the strong atmospheric absorption. The weaker car- bonate feature at 11.3 urn is in the wavelength range of
i 80 70 90 100 p
60 5 z
502
40 s
20 NOPAH DOLOMITE ,.
/ M',DERATEV4RNISH 20
EUREKAQUARTZITE 10
01 1 1 1 1 1 1 1 2 3 4 5 6 7 8 9 IO I, 12 13 14 IP 02 3 4 5 6 I 8 9 IO 11 12 13 14 15O
IVAVELEhGTh irm' WAVELENGTH ipml
16. I ,110 16, 1 ,110
- 80
-70 5
-60 5
-50 z
: -40 r
._._. F--- ,w::. - -100
‘*+ - 90
/
-80
/
\: 70 ;
do z
-50 2
-40 -
- 30 RHYOLITIC TUFF
_ 20 2
STIRLING OUiiRTZITE ,c 2 10
‘2 3 4 5 6 / 7 8 9 1 10 1 11 I 12 I 13 1 14 1 1; ‘2 3 4 5 6 7 8 9 10 11 12 13 14 15” WAVELEhGTH icml WAVELENCTHipml
FIG. 12. Emission spectra taken with the Portable Field Emission Spectrometer (PFES) at the study area. Dashed curve is measured radiance, dot-dashed curve is the best-fit black-body curve, and solid curve is derived emittance.
Analysis aft TIMS Data-Reath Valley 873
channel 6 of the TIMS, and if detectable, will affect the as- sumption that the dolomite is spectrally flat and could be used for spectral normalization. In other areas, I have found that desert vegetation has completely flat spectra, but in Death Valley there is not sufficient vegetation to allow its use for normalization. Another interesting feature, seen in both the laboratory and the PFES spectra, is the effect of desert var- nish. With light to moderate varnish, a longer wavelength shoulder is added to the quartzite spectrum with the quartz feature reduced. For very heavily varnished quartzite, the quartz spectrttm is completely masked~ by the specti-um of then varnish. Potter and Rossman (1977) have shown that the middle infrared spectrum of desert varnish is dominated by illite-montmorillonite clay, which in their samples made up 70 percent of the varnish, with the remainder mostly iron and manganese.
The preliminary laboratory and field spectra presented here appear to vaiidate the interpretation of the IT-MS data. Futher
work is planned with all instruments, including a modification of the laboratory spectrometer to obtain emission spectra.
SUMMARY
TIMS is unique in allowing the collection of both spectral emittance information and thermal information in digital format with the same airborne scanner. For the first time it has been possible to produce coregistered day and night emit- tance images of the same area. The day-to-night differences a~ppear to be primarily due to increased importance of atmo- spheric emission to the total signal received at night. The spectral data presented enhance our understanding of the physical basis for the discrimination of differences in surface materials afforded by TIMS data. The emittance data from Death Valley show good qualitative agreement with both field emittance data taken in the same area and laboratory spectral reflectance data for samples coilected there. Temperature data
FRESH SURFACE EUREKA QUARTLITE
WAVELENGTHluml
MODERATEVARNISH EUREKAOUARTZITE
“7 1 8 IO I? 14 WAVELENGTH Iurn)
WAVELENGTH Ipml
*u
30- NOPAH DOLOhllTE 2
g 2 xl- .5 5
G IO
I ’ 6
I I I 8 10 12 14
WAVELEIUCTH lirmi
WAVELENGTH turn)
30
> JOHNNIE SHALE
0 1 I 6 a 10 12 14
WAVELENGTH (pm1
FIG. 13. Laboratory diffuse reflectance spectra of samples from the study area.
a74 Kahle
and an apparent thermal inertia image produced from the
same data set serve to separate some bedrock units, to differ-
entiate bedrock from alluvium, and to allow some inferences
about the soil moisture and/or soil conditions on some of the
alluvial fans. With NASA’s approval, the scanner is now avail-
able for use by investigators from any discipline.
ACKNOWLEDGMENTS
I would like to thank the National Space Technology Lab-
oratory personnel, particularly G. Meeks, for dedicated work
in the operation and improvement of TIMS. John Reimer and Richard Walker at the Jet Propulsion Laboratory’s Image Processing Lab did much of the TIMS data processing. I have had numerous helpful discussions with M. Abrams, A. Gil- lespie, F. Palluconi, and E. Paylor. M. J. Bartholomew, G. Hoover, and S. Schultz helped with field and laboratory work. The research described here was carried out by the Jet Propul- sion Laboratory, California Institute of Technology, under contract with the Land Processes Branch of the National Aeronautics and Space Administration.
REFERENCES
Gillespie, A. R., Kahle, A. B., and Palluconi, F. D., 1984, Mapping alluvial fans in Death Valley, California, using multichannel ther- mal infrared images: Geophys. Res. Lett., 11, 1153-1156.
Gillespie, A. R., Kahle, A. B., and Walker, R., 1986, Color enhance- ment of highly correlated images: I. Decorrelation and HSI- contrast stretches: Remote Sensing Environ., 20, 209-235.
Hoover, G., and Kahle, A. B., 1986, A portable spectrometer for use from 5 to 14.5 micrometers: Jet Propulsion Lab Tech. Rep. 8619.
Hunt, C. B., and Mabey, D. R., 1966, Stratigraphy and structure of Death Valley, California: U.S. Geol. Surv. Prof. Paper 494-A.
Hunt, G. R., and Salisbury, J. W., 1974, Mid-infrared spectral behav- ior of igneous rocks: AFCRL-TR-74-0625.
Kahle, A. B., 1983, The new airborne Thermal Infrared Multispectral Scanner (TIMS): Inst. Electr. Electron. Eng., Proc., Internat. Geosci. and Remote Sensing Sympos. (IGARSS ‘83) II, 7.1-7.6.
Kahle, A. B., and Goetz, A. F. H., 1983, Mineralogic information from a new airborne Thermal Infrared Multispectral Scanner: Science, 222,2427.
Kahle, A. B., Madura, D. P., and Soha, J. M., 1980, Middle infrared multi-spectral aircraft scanner data: Analysis for geological appli- c~aiionx Appl. Optics, 19; 2279-2298.
Kahle. A. B., Schieldge, J. P., Abrams, M. J., Alley, R. E., and Levine, C. J., 1981, Geologic application of thermal inertia imaging using HCMM data: Jet Propulsion Lab. Tech. Rep. 81-55.
Kneizys, F. X., Shettle, E. P., Gallery, W. O., Chetwynd, Jr., J. H., Abreu, L. W., Shelby, J. E. A., Fenn, R. W., and McClatchey, R. A., 1980, Atmospheric transmittance/radiance: computer code LOW- TRAN 5: Air Force Geophys. Lab. Rep. no. AFGL-TR-80-0067.
Lyon, R. J. P., 1965, Analysis of rocks by spectral infrared emission (8 to 25 microns): Econ. Geol., 60, 715-736.
Palluconi, F. D., and Meeks, G. R., 1985, Thermal Infrared Multi- spectral Scanner (TIMS): An investigator’s guide to TIMS data: Jet Propulsion Lab. Publ. 85-32.
Potter, R. M., and Rossman, G. R., 1977, Desert varnish: The impor- tance of clay minerals: Science, 196,1446-1448.
Price, J. C., 1977, Thermal inertia mapping: A new view of the earth: J. Geophys. Res., 82, 2582-2590.
![Feature space learning in Support Vector Machines through ...mwiering/AD_Pietersma_Thesis.pdf · Functions". Principle Component Analysis [9] and Fischer Linear Discrimi-nant [9]](https://img.pdfslide.us/doc/110x75/6085e76a0d745748944a74be/feature-space-learning-in-support-vector-machines-through-mwieringadpietersma.jpg)


![Deep Metric Learning With Angular Lossresearch.baidu.com/Public/uploads/5acc20706a719.pdfture matching [7], fine-grained image classification [33, 38], zero-shot learning [11, 35]](https://img.pdfslide.us/doc/110x75/5f85e49da1d3a8189b46dbab/deep-metric-learning-with-angular-ture-matching-7-ine-grained-image-classiication.jpg)