Embed Size (px)
Citation preview
Surface Circulation at the Tip of the Antarctic Peninsula from Drifters
ANDREW F. THOMPSON AND KAREN J. HEYWOOD
School of Environmental Sciences, University of East Anglia, Norwich, United Kingdom
SALLY E. THORPE
British Antarctic Survey, Natural Environment Research Council, Cambridge, United Kingdom
ANGELIKA H. H. RENNER
British Antarctic Survey, Natural Environment Research Council, Cambridge, and School of Environmental Sciences,
University of East Anglia, Norwich, United Kingdom
ARMANDO TRASVINA
Centro de Investigacion Cientıfica y de Educacion Superior de Ensenada, Departamento de Oceanografia Fisica,
Unidad La Paz, La Paz, Mexico
(Manuscript received 6 February 2008, in final form 3 June 2008)
ABSTRACT
An array of 40 surface drifters, drogued at 15-m depth, was deployed in February 2007 to the east of the tip
of the Antarctic Peninsula as part of the Antarctic Drifter Experiment: Links to Isobaths and Ecosystems
(ADELIE) project. Data obtained from these drifters and from a select number of local historical drifters
provide the most detailed observations to date of the surface circulation in the northwestern Weddell Sea.
The Antarctic Slope Front (ASF), characterized by a ;20 cm s21 current following the 1000-m isobath, is
the dominant feature east of the peninsula. The slope front bifurcates when it encounters the South Scotia
Ridge with the drifters following one of three paths. Drifters (i) are carried westward into Bransfield Strait;
(ii) follow the 1000-m isobath to the east along the southern edge of the South Scotia Ridge; or (iii) become
entrained in a large-standing eddy over the South Scotia Ridge. Drifters are strongly steered by contours
of f/h (Coriolis frequency/depth) as shown by calculations of the first two moments of displacement in both
geographic coordinates and coordinates locally aligned with contours of f/h. An eddy-mean decomposition
of the drifter velocities indicates that shear in the mean flow makes the dominant contribution to dispersion in
the along-f/h direction, but eddy processes are more important in dispersing particles across contours of
f/h. The results of the ADELIE study suggest that the circulation near the tip of the Antarctic Peninsula
may influence ecosystem dynamics in the Southern Ocean through Antarctic krill transport and the export
of nutrients.
1. Introduction
The circulation near the tip of the Antarctic Penin-
sula is crucial for enabling the export of unique water
properties found along the rim of the Weddell Gyre
into the Antarctic Circumpolar Current (ACC). Ant-
arctic Bottom Water formed over the continental shelf
in the southern Weddell Sea passes through gaps in the
complex topography near the tip of the Antarctic Pen-
insula before entering the ACC (Orsi et al. 1999). Once
in the ACC, this dense water spreads throughout the
World Ocean. Considering water masses close to the
surface, Antarctic waters overlying continental shelves
typically have iron concentrations that are an order of
magnitude larger than pelagic Antarctic waters, includ-
ing pelagic waters of the Scotia Sea (Martin et al. 1990;
Fitzwater et al. 2000). It is now generally accepted that
iron limits phytoplankton biomass in pelagic Antarctic
Corresponding author address: Andrew F. Thompson, Depart-
ment of Applied Mathematics and Theoretical Physics, University
of Cambridge, Wilberforce Road, Cambridge CB3 0WA, United
Kingdom.
E-mail: [email protected]
VOLUME 39 J O U R N A L O F P H Y S I C A L O C E A N O G R A P H Y JANUARY 2009
DOI: 10.1175/2008JPO3995.1
� 2009 American Meteorological Society 3
waters, and there is increasing evidence that this is also
true in coastal waters (Fitzwater et al. 2000; discussion
in Holm-Hansen et al. 2004a). The export of iron-rich
waters found near the Antarctic Peninsula may explain
elevated chlorophyll levels—visible from satellite ob-
servations—that extend from this region to South
Georgia Island (Falkowski et al. 1998; Atkinson et al.
2001; Korb et al. 2004). Therefore, the pathways
through which exchange occurs between the Weddell
Sea and the ACC influence both the global overturning
circulation and local biological dynamics.
The margins of Antarctica are dominated by two to-
pographically constrained westward currents, the Ant-
arctic Slope Front (ASF) and the Antarctic Coastal
Current (CC). The Antarctic Slope Front marks the
subsurface boundary between cold, relatively freshwa-
ter found on the Antarctic continental shelf and
warmer, more saline water found farther offshore (Ja-
cobs 1986, 1991). The ASF is consistently found above
or just offshore of the shelf break.
In the western Weddell Sea the speed of the ASF is
uniform throughout most of the water column, but it
peaks around 20 cm s21 near the seabed due to the
outflow of dense bottom water (Muench and Gordon
1995; Fahrbach et al. 2001; Thompson and Heywood
2008; hereafter TH08). It has been suggested that the
position of the ASF is in part determined by this deep
outflow (Gill 1973; Baines 2008, manuscript submitted
to Deep-Sea Res. II). The CC is found broadly over the
continental shelf and is not tied to a specific topo-
graphical feature. In regions where the continental shelf
narrows, the CC may merge with the ASF (Heywood et
al. 1998).
Within the Weddell Gyre, the ASF and CC act to
precondition shelf waters for the formation of Antarctic
Bottom Water (Fahrbach et al. 1992), melt the under-
side of ice shelves (Fahrbach et al. 1994), and transport
Antarctic krill and nutrients (Pauly et al. 2000). Near
the tip of the Antarctic Peninsula, though, the ASF and
CC encounter complex topography and come into
confluence with the ACC in the region over and sur-
rounding the South Scotia Ridge known as the Weddell
Scotia Confluence (Patterson and Sievers 1980). Inter-
actions with topography and the ACC significantly
modify the properties and behavior of the ASF and CC
and have contributed to difficulties in detecting and
tracking these currents in this region. For example,
Whitworth et al. (1998) have shown that the traditional
markers of the currents—for example, identifying the
ASF with the shoreward extension of the 08C isotherm
(Jacobs 1991)—are no longer applicable in the north-
western Weddell Sea. Furthermore, most large-scale
maps of the mean circulation in the Weddell Gyre, such
as those constructed by Orsi et al. (1993) from historical
hydrographic data, have proven too coarse to resolve
the fates of the ASF and CC near the tip of the Ant-
arctic Peninsula.
Heywood et al. (2004) used hydrographic data lo-
cated over and around the South Scotia Ridge to infer
the paths of the ASF and CC. A distinct CC was de-
tected east of Joinville Island that flowed westward into
the southern portion of Bransfield Strait, where it could
no longer be tracked. The ASF was associated with
cyclonic flow around Powell Basin between the 1000-
and 2000-m isobaths. Heywood et al. (2004) suggested
that the ASF splits in two over the South Scotia Ridge,
with one part following a complicated, topographically
steered route out through the Weddell Scotia Conflu-
ence into the ACC, and the second part forming the
Weddell Front above the 3000-m isobath along the
southern ridge of the South Orkney Plateau (see their
Fig. 6). We note that in Heywood et al. (2004), identi-
fication of the ASF over the South Scotia Ridge was
made difficult by the predominantly along-isobath align-
ment of the hydrographic stations.
Thus the goal of the Antarctic Drifter Experiment:
Links to Isobaths and Ecosystems (ADELIE) project
was to provide a more complete description of the ASF
and the CC near the tip of the Antarctic Peninsula and,
specifically, to identify where and to what extent cross-
slope transport enables export of water masses formed
on the shelf into deeper waters. Multiple transects
across the continental shelf and slope to the east of the
peninsula’s tip (Fig. 1) were completed to obtain hy-
drographic data and to deploy 40 surface drifters. The
surface drifters represent the first dedicated experiment
using Lagrangian instruments to the east of the Ant-
arctic Peninsula and will be the focus of this study.1 This
study highlights the role of topography in steering cur-
rents in this region and gives an indication of possible
pathways for nutrient and Antarctic krill transport near
the Antarctic Peninsula.
The dataset used in this study is described in section
2. An overview of the surface circulation at the tip of
the Antarctic Peninsula is provided in section 3. Section 4
gives a statistical description of the data and focuses on
the dispersion of the drifters relative to contours of
Coriolis frequency/depth (f/h) to determine the extent of
1 Iceberg drift has previously been used to document surface
currents in the Weddell Sea (e.g., Wadhams et al. 1989; Schodlok
et al. 2006). The deviation of iceberg drift from a true passive
tracer is expected to be greater than that of a drifter because of
the large above-surface extent of the iceberg that is susceptible to
wind forcing.
4 J O U R N A L O F P H Y S I C A L O C E A N O G R A P H Y VOLUME 39
topographical steering. A discussion of the results and a
summary of the conclusions are provided in section 5.
2. Data
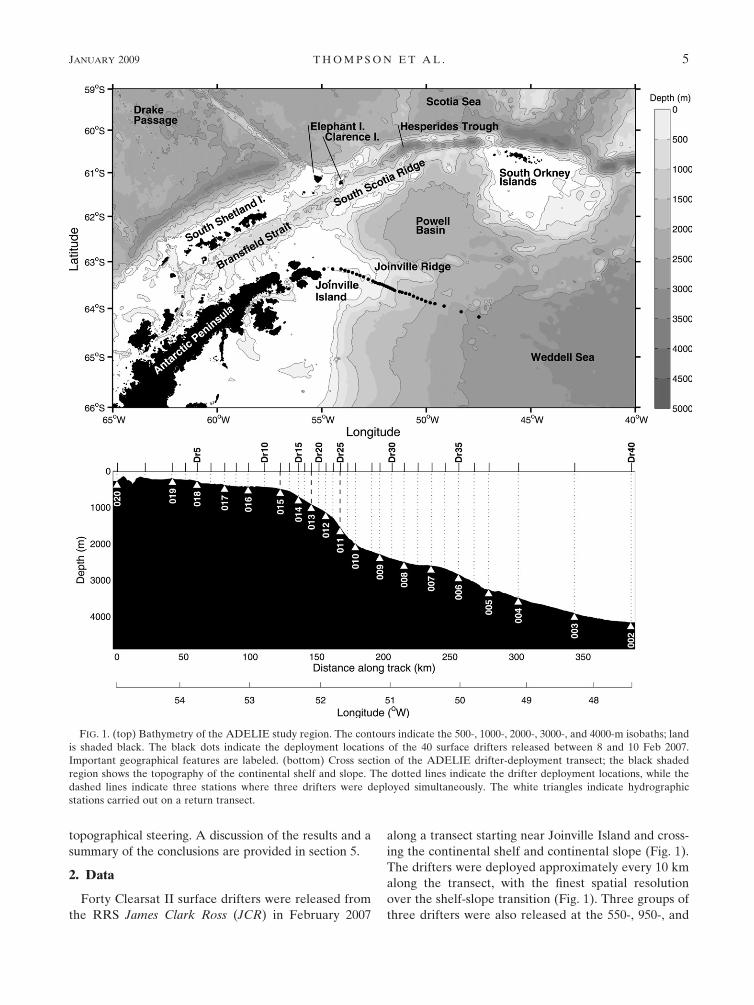
Forty Clearsat II surface drifters were released from
the RRS James Clark Ross (JCR) in February 2007
along a transect starting near Joinville Island and cross-
ing the continental shelf and continental slope (Fig. 1).
The drifters were deployed approximately every 10 km
along the transect, with the finest spatial resolution
over the shelf-slope transition (Fig. 1). Three groups of
three drifters were also released at the 550-, 950-, and
FIG. 1. (top) Bathymetry of the ADELIE study region. The contours indicate the 500-, 1000-, 2000-, 3000-, and 4000-m isobaths; land
is shaded black. The black dots indicate the deployment locations of the 40 surface drifters released between 8 and 10 Feb 2007.
Important geographical features are labeled. (bottom) Cross section of the ADELIE drifter-deployment transect; the black shaded
region shows the topography of the continental shelf and slope. The dotted lines indicate the drifter deployment locations, while the
dashed lines indicate three stations where three drifters were deployed simultaneously. The white triangles indicate hydrographic
stations carried out on a return transect.
JANUARY 2009 T H O M P S O N E T A L . 5
1600-m isobaths (Fig. 1). Because of sea ice, the average
life span of the drifter was about 58 days.2 Only a single
drifter failed immediately, and four drifters, three of
which escaped into the ACC, lasted at least 4 months.
Table 1 gives a summary of all the drifters including the
deployment date and location, length of record, and
cause of ‘‘death.’’
All drifters were drogued at 15-m depth following
World Ocean Circulation Experiment (WOCE) stan-
dards for surface drifters. Twenty of the drifters were
equipped with global positioning (GPS) devices while
the remainder were tracked with the Argos satellite
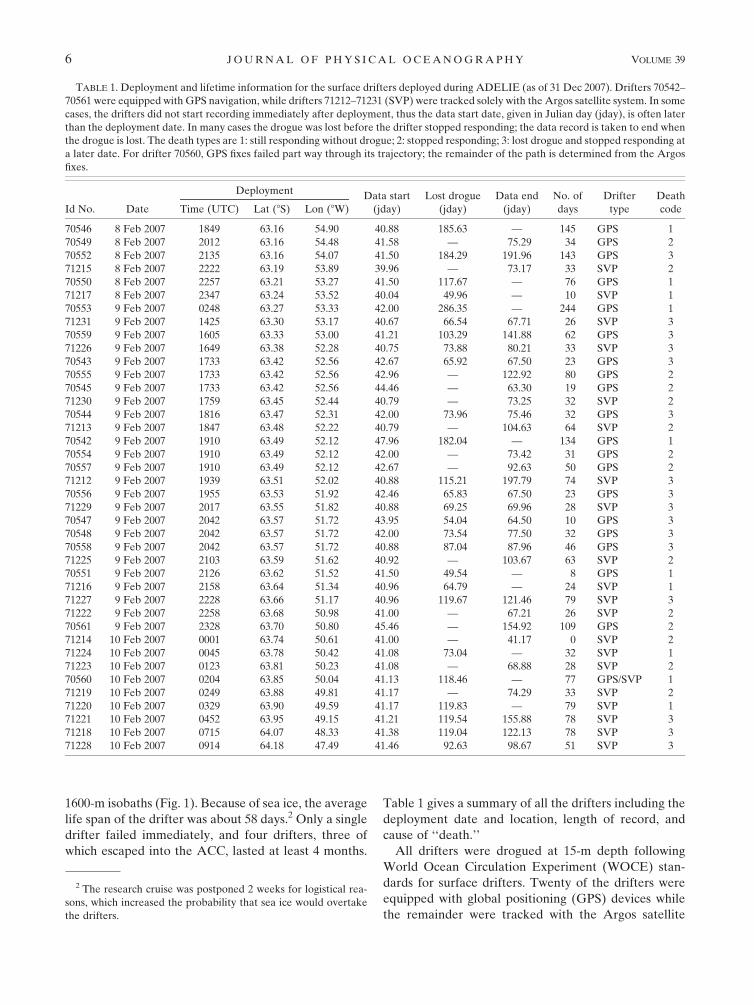
TABLE 1. Deployment and lifetime information for the surface drifters deployed during ADELIE (as of 31 Dec 2007). Drifters 70542–
70561 were equipped with GPS navigation, while drifters 71212–71231 (SVP) were tracked solely with the Argos satellite system. In some
cases, the drifters did not start recording immediately after deployment, thus the data start date, given in Julian day (jday), is often later
than the deployment date. In many cases the drogue was lost before the drifter stopped responding; the data record is taken to end when
the drogue is lost. The death types are 1: still responding without drogue; 2: stopped responding; 3: lost drogue and stopped responding at
a later date. For drifter 70560, GPS fixes failed part way through its trajectory; the remainder of the path is determined from the Argos
fixes.
Id No. Date
DeploymentData start
(jday)
Lost drogue
(jday)
Data end
(jday)
No. of
days
Drifter
type
Death
codeTime (UTC) Lat (8S) Lon (8W)
70546 8 Feb 2007 1849 63.16 54.90 40.88 185.63 — 145 GPS 1
70549 8 Feb 2007 2012 63.16 54.48 41.58 — 75.29 34 GPS 2
70552 8 Feb 2007 2135 63.16 54.07 41.50 184.29 191.96 143 GPS 3
71215 8 Feb 2007 2222 63.19 53.89 39.96 — 73.17 33 SVP 2
70550 8 Feb 2007 2257 63.21 53.27 41.50 117.67 — 76 GPS 1
71217 8 Feb 2007 2347 63.24 53.52 40.04 49.96 — 10 SVP 1
70553 9 Feb 2007 0248 63.27 53.33 42.00 286.35 — 244 GPS 1
71231 9 Feb 2007 1425 63.30 53.17 40.67 66.54 67.71 26 SVP 3
70559 9 Feb 2007 1605 63.33 53.00 41.21 103.29 141.88 62 GPS 3
71226 9 Feb 2007 1649 63.38 52.28 40.75 73.88 80.21 33 SVP 3
70543 9 Feb 2007 1733 63.42 52.56 42.67 65.92 67.50 23 GPS 3
70555 9 Feb 2007 1733 63.42 52.56 42.96 — 122.92 80 GPS 2
70545 9 Feb 2007 1733 63.42 52.56 44.46 — 63.30 19 GPS 2
71230 9 Feb 2007 1759 63.45 52.44 40.79 — 73.25 32 SVP 2
70544 9 Feb 2007 1816 63.47 52.31 42.00 73.96 75.46 32 GPS 3
71213 9 Feb 2007 1847 63.48 52.22 40.79 — 104.63 64 SVP 2
70542 9 Feb 2007 1910 63.49 52.12 47.96 182.04 — 134 GPS 1
70554 9 Feb 2007 1910 63.49 52.12 42.00 — 73.42 31 GPS 2
70557 9 Feb 2007 1910 63.49 52.12 42.67 — 92.63 50 GPS 2
71212 9 Feb 2007 1939 63.51 52.02 40.88 115.21 197.79 74 SVP 3
70556 9 Feb 2007 1955 63.53 51.92 42.46 65.83 67.50 23 GPS 3
71229 9 Feb 2007 2017 63.55 51.82 40.88 69.25 69.96 28 SVP 3
70547 9 Feb 2007 2042 63.57 51.72 43.95 54.04 64.50 10 GPS 3
70548 9 Feb 2007 2042 63.57 51.72 42.00 73.54 77.50 32 GPS 3
70558 9 Feb 2007 2042 63.57 51.72 40.88 87.04 87.96 46 GPS 3
71225 9 Feb 2007 2103 63.59 51.62 40.92 — 103.67 63 SVP 2
70551 9 Feb 2007 2126 63.62 51.52 41.50 49.54 — 8 GPS 1
71216 9 Feb 2007 2158 63.64 51.34 40.96 64.79 — 24 SVP 1
71227 9 Feb 2007 2228 63.66 51.17 40.96 119.67 121.46 79 SVP 3
71222 9 Feb 2007 2258 63.68 50.98 41.00 — 67.21 26 SVP 2
70561 9 Feb 2007 2328 63.70 50.80 45.46 — 154.92 109 GPS 2
71214 10 Feb 2007 0001 63.74 50.61 41.00 — 41.17 0 SVP 2
71224 10 Feb 2007 0045 63.78 50.42 41.08 73.04 — 32 SVP 1
71223 10 Feb 2007 0123 63.81 50.23 41.08 — 68.88 28 SVP 2
70560 10 Feb 2007 0204 63.85 50.04 41.13 118.46 — 77 GPS/SVP 1
71219 10 Feb 2007 0249 63.88 49.81 41.17 — 74.29 33 SVP 2
71220 10 Feb 2007 0329 63.90 49.59 41.17 119.83 — 79 SVP 1
71221 10 Feb 2007 0452 63.95 49.15 41.21 119.54 155.88 78 SVP 3
71218 10 Feb 2007 0715 64.07 48.33 41.38 119.04 122.13 78 SVP 3
71228 10 Feb 2007 0914 64.18 47.49 41.46 92.63 98.67 51 SVP 3
2 The research cruise was postponed 2 weeks for logistical rea-
sons, which increased the probability that sea ice would overtake
the drifters.
6 J O U R N A L O F P H Y S I C A L O C E A N O G R A P H Y VOLUME 39
system. The GPS drifters provided a position fix
roughly once every half-hour, with an accuracy as small
as 25 m. At these polar latitudes, a position fix from
the Argos satellite system is available at least once an
hour, but the accuracy of the fixes, as small as 150 m
with an average of 350 m, is considerably coarser than
the GPS. The onset of sea ice formation in the western
Weddell Sea coupled with drifting icebergs led to a
more frequent loss of drogues than in traditional drifter
studies. Velocities were only calculated while the
drogue remained attached to the drifter. Velocities
reported here are calculated from low-pass-filtered
trajectories with a 38-h cutoff to remove tidal and in-
ertial oscillations. These filtered trajectories are shown
in Fig. 2. Velocities are determined from 6-hourly sub-
sampled records following the method described by
Hansen and Poulain (1996). The expected drogue slip
relative to the water is less than 2 cm s21 for winds up
to 20 m s21 (Niiler et al. 1995). The data from the
ADELIE surface drifters are available through the
Global Drifter Program Web site (www.aoml.noaa.gov/
phod/dac/gdp.html).
The ADELIE data complement the historical drifter
data available through the Global Drifter Program.
Historical drifters in the region have principally been
released in Bransfield Strait as shown in Fig. 2. In this
study we consider 55 historical drifters that pass close to
the Antarctic Peninsula to help construct the mean cir-
culation. The historical drifters span a period between
1989 and 2005 and are all drogued at 15-m depth. Table
2 gives a summary of the historical drifters used in this
study.
In the following section, we also show data obtained
from a 75-kHz RD Instruments Ocean Surveyor
(OS75) shipboard acoustic Doppler current profiler
(SADCP) installed on the JCR. The SADCP was used
to acquire current measurements up to a depth of 700 m
throughout the cruise.3 SADCP measurements were re-
corded in 16-m bins and then averaged over a period of
10 min; the error in the SADCP suggested by the manu-
facturer is 60.5 cm s21. Sea surface temperature and
sea surface salinity were recorded throughout the cruise
on the JCR’s oceanlogger that sampled seawater
through an intake at 6-m depth. Further details on in-
strumentation and deployment can be found in the
cruise report (Thompson 2007).
3. The surface circulation of the northwesternWeddell Sea
From a qualitative analysis of the ADELIE drifter
trajectories combined with historical drifter trajectories
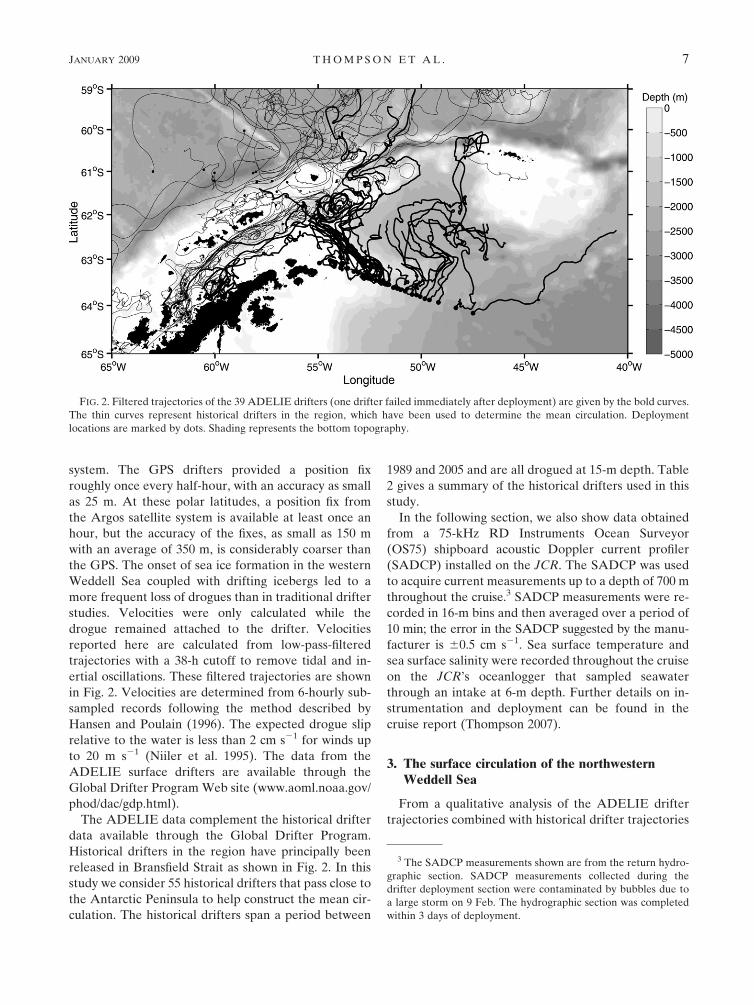
FIG. 2. Filtered trajectories of the 39 ADELIE drifters (one drifter failed immediately after deployment) are given by the bold curves.
The thin curves represent historical drifters in the region, which have been used to determine the mean circulation. Deployment
locations are marked by dots. Shading represents the bottom topography.
3 The SADCP measurements shown are from the return hydro-
graphic section. SADCP measurements collected during the
drifter deployment section were contaminated by bubbles due to
a large storm on 9 Feb. The hydrographic section was completed
within 3 days of deployment.
JANUARY 2009 T H O M P S O N E T A L . 7
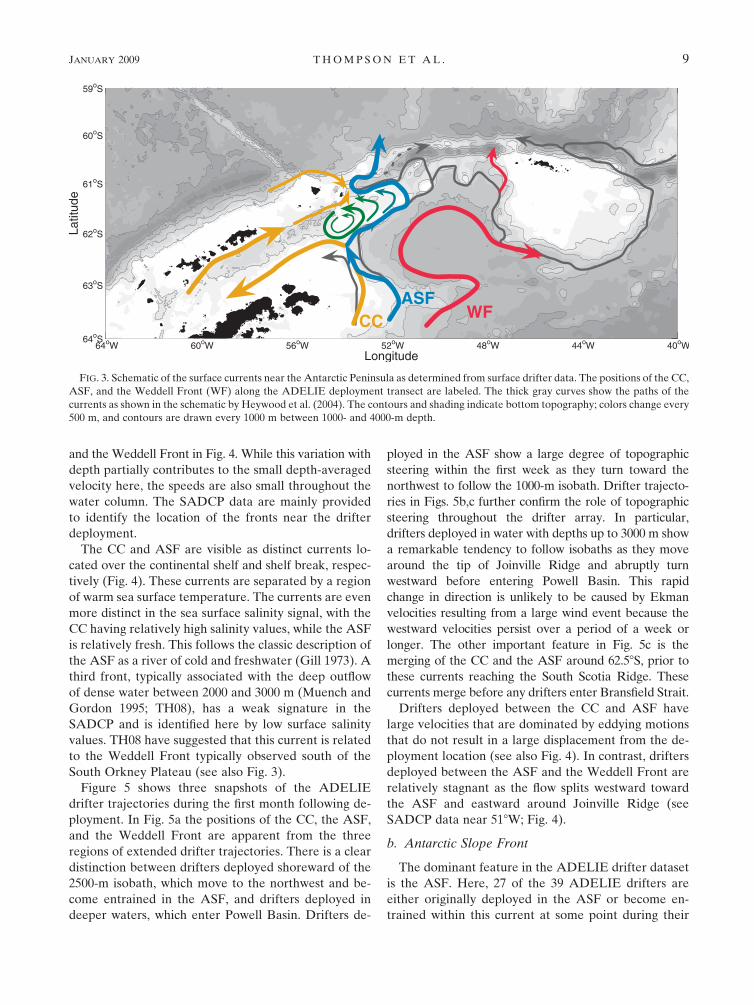
in the region, the schematic circulation near the tip of
the Antarctic Peninsula has been updated from Hey-
wood et al. (2004) as shown in Fig. 3. We expect the
depth-averaged circulation to be similar, at least in
structure, to the surface circulation due to the weak
stratification in this region. Hydrographic measure-
ments in the western Weddell Sea consistently show
that current velocities, especially those related to the
frontal currents, are largely uniform throughout the wa-
ter column above the thin deep outflow (e.g., Muench
and Gordon 1995; TH08). Strong topographical steering
of the surface drifters, as discussed in section 4b, sup-
ports this assumption.
The new features shown in Fig. 3 largely involve re-
gions of divergence or convergence in the mean flow.
Therefore, it is important to note that drifters are quasi-
Lagrangian and may not follow a single water mass
because they are drogued at a constant depth. In the
following section, we describe the prominent features
of the circulation arising from this study.
a. East of the peninsula
The deployment transect was selected to follow the
WOCE section SR04 (e.g., Fahrbach et al. 1994), where
there is a long record of hydrographic and mooring
data. Figure 4 shows the depth-averaged (to 700 m)
velocity vectors along the ADELIE transect as mea-
sured by the SADCP shortly after drifter deployment
(see section 2). Tidal velocities have been removed us-
ing the Earth&Space Research/Oregon State University
(ESR/OSU AntPen) (;2-km high-resolution Antarctic
Peninsula domain) high-latitude barotropic tide model
(Padman et al. 2002). Vectors are colored according to
(i) sea surface temperature and (ii) sea surface salinity.
Over most of the transect, the velocity vectors are
consistent with depth. The most strongly barotropic
regions in the SADCP data coincide with the ASF and
the Weddell Front, in agreement with the hydrographic
data of TH08. Greater vertical variability is observed in
the region of weak velocities found between the ASF
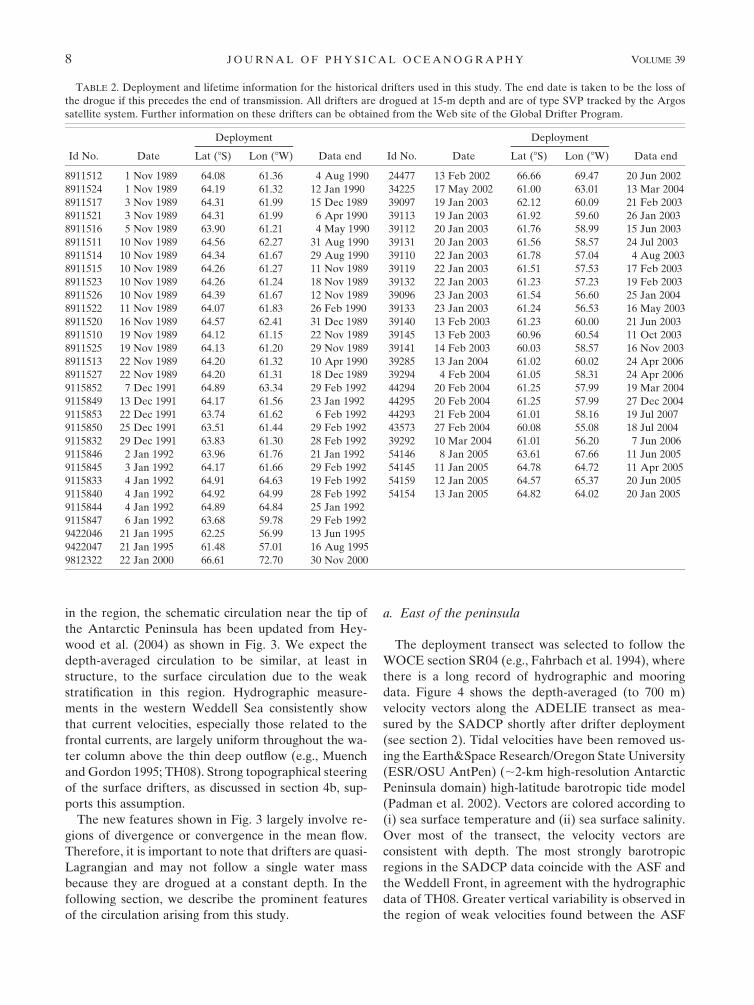
TABLE 2. Deployment and lifetime information for the historical drifters used in this study. The end date is taken to be the loss of
the drogue if this precedes the end of transmission. All drifters are drogued at 15-m depth and are of type SVP tracked by the Argos
satellite system. Further information on these drifters can be obtained from the Web site of the Global Drifter Program.
Id No. Date
Deployment
Data end Id No. Date
Deployment
Data endLat (8S) Lon (8W) Lat (8S) Lon (8W)
8911512 1 Nov 1989 64.08 61.36 4 Aug 1990 24477 13 Feb 2002 66.66 69.47 20 Jun 2002
8911524 1 Nov 1989 64.19 61.32 12 Jan 1990 34225 17 May 2002 61.00 63.01 13 Mar 2004
8911517 3 Nov 1989 64.31 61.99 15 Dec 1989 39097 19 Jan 2003 62.12 60.09 21 Feb 2003
8911521 3 Nov 1989 64.31 61.99 6 Apr 1990 39113 19 Jan 2003 61.92 59.60 26 Jan 2003
8911516 5 Nov 1989 63.90 61.21 4 May 1990 39112 20 Jan 2003 61.76 58.99 15 Jun 2003
8911511 10 Nov 1989 64.56 62.27 31 Aug 1990 39131 20 Jan 2003 61.56 58.57 24 Jul 2003
8911514 10 Nov 1989 64.34 61.67 29 Aug 1990 39110 22 Jan 2003 61.78 57.04 4 Aug 2003
8911515 10 Nov 1989 64.26 61.27 11 Nov 1989 39119 22 Jan 2003 61.51 57.53 17 Feb 2003
8911523 10 Nov 1989 64.26 61.24 18 Nov 1989 39132 22 Jan 2003 61.23 57.23 19 Feb 2003
8911526 10 Nov 1989 64.39 61.67 12 Nov 1989 39096 23 Jan 2003 61.54 56.60 25 Jan 2004
8911522 11 Nov 1989 64.07 61.83 26 Feb 1990 39133 23 Jan 2003 61.24 56.53 16 May 2003
8911520 16 Nov 1989 64.57 62.41 31 Dec 1989 39140 13 Feb 2003 61.23 60.00 21 Jun 2003
8911510 19 Nov 1989 64.12 61.15 22 Nov 1989 39145 13 Feb 2003 60.96 60.54 11 Oct 2003
8911525 19 Nov 1989 64.13 61.20 29 Nov 1989 39141 14 Feb 2003 60.03 58.57 16 Nov 2003
8911513 22 Nov 1989 64.20 61.32 10 Apr 1990 39285 13 Jan 2004 61.02 60.02 24 Apr 2006
8911527 22 Nov 1989 64.20 61.31 18 Dec 1989 39294 4 Feb 2004 61.05 58.31 24 Apr 2006
9115852 7 Dec 1991 64.89 63.34 29 Feb 1992 44294 20 Feb 2004 61.25 57.99 19 Mar 2004
9115849 13 Dec 1991 64.17 61.56 23 Jan 1992 44295 20 Feb 2004 61.25 57.99 27 Dec 2004
9115853 22 Dec 1991 63.74 61.62 6 Feb 1992 44293 21 Feb 2004 61.01 58.16 19 Jul 2007
9115850 25 Dec 1991 63.51 61.44 29 Feb 1992 43573 27 Feb 2004 60.08 55.08 18 Jul 2004
9115832 29 Dec 1991 63.83 61.30 28 Feb 1992 39292 10 Mar 2004 61.01 56.20 7 Jun 2006
9115846 2 Jan 1992 63.96 61.76 21 Jan 1992 54146 8 Jan 2005 63.61 67.66 11 Jun 2005
9115845 3 Jan 1992 64.17 61.66 29 Feb 1992 54145 11 Jan 2005 64.78 64.72 11 Apr 2005
9115833 4 Jan 1992 64.91 64.63 19 Feb 1992 54159 12 Jan 2005 64.57 65.37 20 Jun 2005
9115840 4 Jan 1992 64.92 64.99 28 Feb 1992 54154 13 Jan 2005 64.82 64.02 20 Jan 2005
9115844 4 Jan 1992 64.89 64.84 25 Jan 1992
9115847 6 Jan 1992 63.68 59.78 29 Feb 1992
9422046 21 Jan 1995 62.25 56.99 13 Jun 1995
9422047 21 Jan 1995 61.48 57.01 16 Aug 1995
9812322 22 Jan 2000 66.61 72.70 30 Nov 2000
8 J O U R N A L O F P H Y S I C A L O C E A N O G R A P H Y VOLUME 39
and the Weddell Front in Fig. 4. While this variation with
depth partially contributes to the small depth-averaged
velocity here, the speeds are also small throughout the
water column. The SADCP data are mainly provided
to identify the location of the fronts near the drifter
deployment.
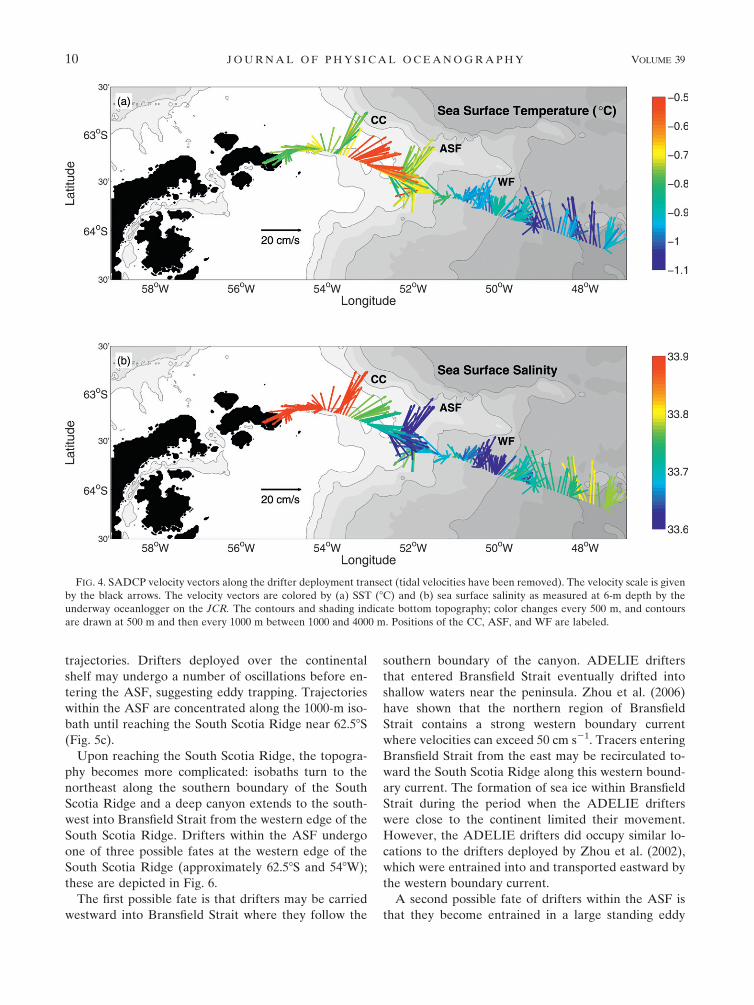
The CC and ASF are visible as distinct currents lo-
cated over the continental shelf and shelf break, respec-
tively (Fig. 4). These currents are separated by a region
of warm sea surface temperature. The currents are even
more distinct in the sea surface salinity signal, with the
CC having relatively high salinity values, while the ASF
is relatively fresh. This follows the classic description of
the ASF as a river of cold and freshwater (Gill 1973). A
third front, typically associated with the deep outflow
of dense water between 2000 and 3000 m (Muench and
Gordon 1995; TH08), has a weak signature in the
SADCP and is identified here by low surface salinity
values. TH08 have suggested that this current is related
to the Weddell Front typically observed south of the
South Orkney Plateau (see also Fig. 3).
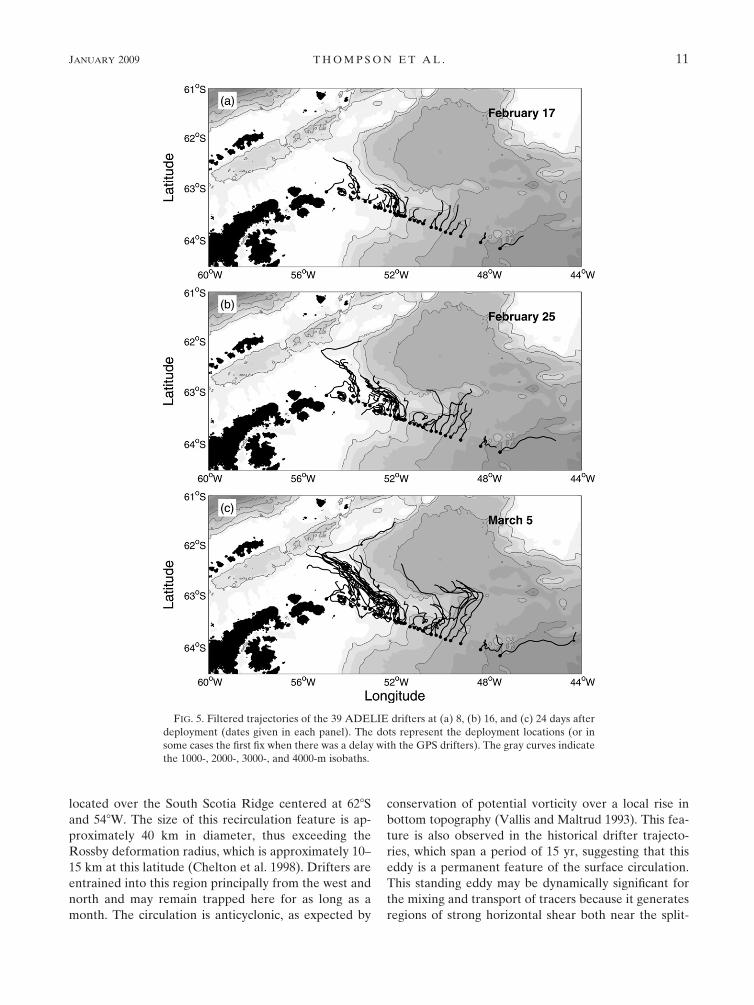
Figure 5 shows three snapshots of the ADELIE
drifter trajectories during the first month following de-
ployment. In Fig. 5a the positions of the CC, the ASF,
and the Weddell Front are apparent from the three
regions of extended drifter trajectories. There is a clear
distinction between drifters deployed shoreward of the
2500-m isobath, which move to the northwest and be-
come entrained in the ASF, and drifters deployed in
deeper waters, which enter Powell Basin. Drifters de-
ployed in the ASF show a large degree of topographic
steering within the first week as they turn toward the
northwest to follow the 1000-m isobath. Drifter trajecto-
ries in Figs. 5b,c further confirm the role of topographic
steering throughout the drifter array. In particular,
drifters deployed in water with depths up to 3000 m show
a remarkable tendency to follow isobaths as they move
around the tip of Joinville Ridge and abruptly turn
westward before entering Powell Basin. This rapid
change in direction is unlikely to be caused by Ekman
velocities resulting from a large wind event because the
westward velocities persist over a period of a week or
longer. The other important feature in Fig. 5c is the
merging of the CC and the ASF around 62.58S, prior to
these currents reaching the South Scotia Ridge. These
currents merge before any drifters enter Bransfield Strait.
Drifters deployed between the CC and ASF have
large velocities that are dominated by eddying motions
that do not result in a large displacement from the de-
ployment location (see also Fig. 4). In contrast, drifters
deployed between the ASF and the Weddell Front are
relatively stagnant as the flow splits westward toward
the ASF and eastward around Joinville Ridge (see
SADCP data near 518W; Fig. 4).
b. Antarctic Slope Front
The dominant feature in the ADELIE drifter dataset
is the ASF. Here, 27 of the 39 ADELIE drifters are
either originally deployed in the ASF or become en-
trained within this current at some point during their
FIG. 3. Schematic of the surface currents near the Antarctic Peninsula as determined from surface drifter data. The positions of the CC,
ASF, and the Weddell Front (WF) along the ADELIE deployment transect are labeled. The thick gray curves show the paths of the
currents as shown in the schematic by Heywood et al. (2004). The contours and shading indicate bottom topography; colors change every
500 m, and contours are drawn every 1000 m between 1000- and 4000-m depth.
JANUARY 2009 T H O M P S O N E T A L . 9
trajectories. Drifters deployed over the continental
shelf may undergo a number of oscillations before en-
tering the ASF, suggesting eddy trapping. Trajectories
within the ASF are concentrated along the 1000-m iso-
bath until reaching the South Scotia Ridge near 62.58S
(Fig. 5c).
Upon reaching the South Scotia Ridge, the topogra-
phy becomes more complicated: isobaths turn to the
northeast along the southern boundary of the South
Scotia Ridge and a deep canyon extends to the south-
west into Bransfield Strait from the western edge of the
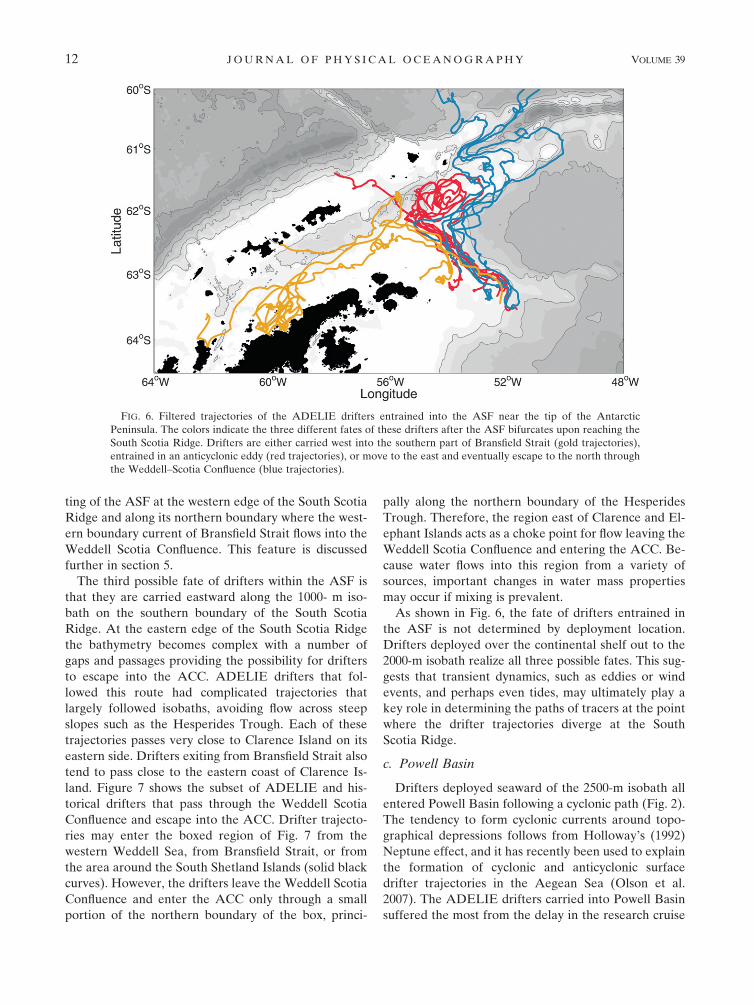
South Scotia Ridge. Drifters within the ASF undergo
one of three possible fates at the western edge of the
South Scotia Ridge (approximately 62.58S and 548W);
these are depicted in Fig. 6.
The first possible fate is that drifters may be carried
westward into Bransfield Strait where they follow the
southern boundary of the canyon. ADELIE drifters
that entered Bransfield Strait eventually drifted into
shallow waters near the peninsula. Zhou et al. (2006)
have shown that the northern region of Bransfield
Strait contains a strong western boundary current
where velocities can exceed 50 cm s21. Tracers entering
Bransfield Strait from the east may be recirculated to-
ward the South Scotia Ridge along this western bound-
ary current. The formation of sea ice within Bransfield
Strait during the period when the ADELIE drifters
were close to the continent limited their movement.
However, the ADELIE drifters did occupy similar lo-
cations to the drifters deployed by Zhou et al. (2002),
which were entrained into and transported eastward by
the western boundary current.
A second possible fate of drifters within the ASF is
that they become entrained in a large standing eddy
FIG. 4. SADCP velocity vectors along the drifter deployment transect (tidal velocities have been removed). The velocity scale is given
by the black arrows. The velocity vectors are colored by (a) SST (8C) and (b) sea surface salinity as measured at 6-m depth by the
underway oceanlogger on the JCR. The contours and shading indicate bottom topography; color changes every 500 m, and contours
are drawn at 500 m and then every 1000 m between 1000 and 4000 m. Positions of the CC, ASF, and WF are labeled.
10 J O U R N A L O F P H Y S I C A L O C E A N O G R A P H Y VOLUME 39
located over the South Scotia Ridge centered at 628S
and 548W. The size of this recirculation feature is ap-
proximately 40 km in diameter, thus exceeding the
Rossby deformation radius, which is approximately 10–
15 km at this latitude (Chelton et al. 1998). Drifters are
entrained into this region principally from the west and
north and may remain trapped here for as long as a
month. The circulation is anticyclonic, as expected by
conservation of potential vorticity over a local rise in
bottom topography (Vallis and Maltrud 1993). This fea-
ture is also observed in the historical drifter trajecto-
ries, which span a period of 15 yr, suggesting that this
eddy is a permanent feature of the surface circulation.
This standing eddy may be dynamically significant for
the mixing and transport of tracers because it generates
regions of strong horizontal shear both near the split-
FIG. 5. Filtered trajectories of the 39 ADELIE drifters at (a) 8, (b) 16, and (c) 24 days after
deployment (dates given in each panel). The dots represent the deployment locations (or in
some cases the first fix when there was a delay with the GPS drifters). The gray curves indicate
the 1000-, 2000-, 3000-, and 4000-m isobaths.
JANUARY 2009 T H O M P S O N E T A L . 11
ting of the ASF at the western edge of the South Scotia
Ridge and along its northern boundary where the west-
ern boundary current of Bransfield Strait flows into the
Weddell Scotia Confluence. This feature is discussed
further in section 5.
The third possible fate of drifters within the ASF is
that they are carried eastward along the 1000- m iso-
bath on the southern boundary of the South Scotia
Ridge. At the eastern edge of the South Scotia Ridge
the bathymetry becomes complex with a number of
gaps and passages providing the possibility for drifters
to escape into the ACC. ADELIE drifters that fol-
lowed this route had complicated trajectories that
largely followed isobaths, avoiding flow across steep
slopes such as the Hesperides Trough. Each of these
trajectories passes very close to Clarence Island on its
eastern side. Drifters exiting from Bransfield Strait also
tend to pass close to the eastern coast of Clarence Is-
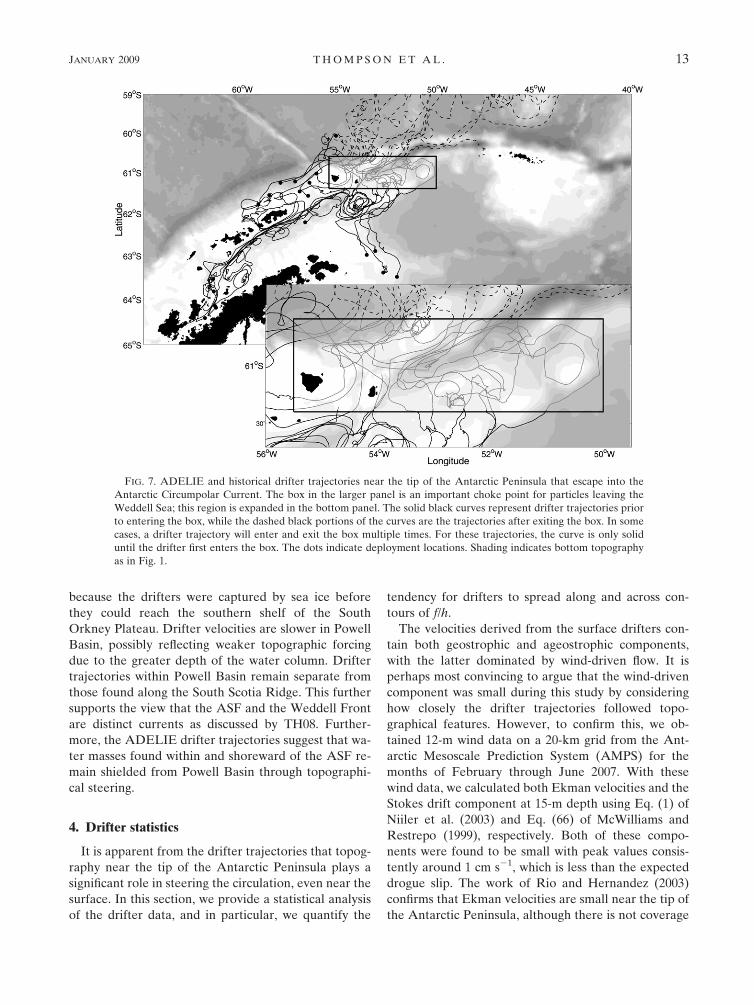
land. Figure 7 shows the subset of ADELIE and his-
torical drifters that pass through the Weddell Scotia
Confluence and escape into the ACC. Drifter trajecto-
ries may enter the boxed region of Fig. 7 from the
western Weddell Sea, from Bransfield Strait, or from
the area around the South Shetland Islands (solid black
curves). However, the drifters leave the Weddell Scotia
Confluence and enter the ACC only through a small
portion of the northern boundary of the box, princi-
pally along the northern boundary of the Hesperides
Trough. Therefore, the region east of Clarence and El-
ephant Islands acts as a choke point for flow leaving the
Weddell Scotia Confluence and entering the ACC. Be-
cause water flows into this region from a variety of
sources, important changes in water mass properties
may occur if mixing is prevalent.
As shown in Fig. 6, the fate of drifters entrained in
the ASF is not determined by deployment location.
Drifters deployed over the continental shelf out to the
2000-m isobath realize all three possible fates. This sug-
gests that transient dynamics, such as eddies or wind
events, and perhaps even tides, may ultimately play a
key role in determining the paths of tracers at the point
where the drifter trajectories diverge at the South
Scotia Ridge.
c. Powell Basin
Drifters deployed seaward of the 2500-m isobath all
entered Powell Basin following a cyclonic path (Fig. 2).
The tendency to form cyclonic currents around topo-
graphical depressions follows from Holloway’s (1992)
Neptune effect, and it has recently been used to explain
the formation of cyclonic and anticyclonic surface
drifter trajectories in the Aegean Sea (Olson et al.
2007). The ADELIE drifters carried into Powell Basin
suffered the most from the delay in the research cruise
FIG. 6. Filtered trajectories of the ADELIE drifters entrained into the ASF near the tip of the Antarctic
Peninsula. The colors indicate the three different fates of these drifters after the ASF bifurcates upon reaching the
South Scotia Ridge. Drifters are either carried west into the southern part of Bransfield Strait (gold trajectories),
entrained in an anticyclonic eddy (red trajectories), or move to the east and eventually escape to the north through
the Weddell–Scotia Confluence (blue trajectories).
12 J O U R N A L O F P H Y S I C A L O C E A N O G R A P H Y VOLUME 39
because the drifters were captured by sea ice before
they could reach the southern shelf of the South
Orkney Plateau. Drifter velocities are slower in Powell
Basin, possibly reflecting weaker topographic forcing
due to the greater depth of the water column. Drifter
trajectories within Powell Basin remain separate from
those found along the South Scotia Ridge. This further
supports the view that the ASF and the Weddell Front
are distinct currents as discussed by TH08. Further-
more, the ADELIE drifter trajectories suggest that wa-
ter masses found within and shoreward of the ASF re-
main shielded from Powell Basin through topographi-
cal steering.
4. Drifter statistics
It is apparent from the drifter trajectories that topog-
raphy near the tip of the Antarctic Peninsula plays a
significant role in steering the circulation, even near the
surface. In this section, we provide a statistical analysis
of the drifter data, and in particular, we quantify the
tendency for drifters to spread along and across con-
tours of f/h.
The velocities derived from the surface drifters con-
tain both geostrophic and ageostrophic components,
with the latter dominated by wind-driven flow. It is
perhaps most convincing to argue that the wind-driven
component was small during this study by considering
how closely the drifter trajectories followed topo-
graphical features. However, to confirm this, we ob-
tained 12-m wind data on a 20-km grid from the Ant-
arctic Mesoscale Prediction System (AMPS) for the
months of February through June 2007. With these
wind data, we calculated both Ekman velocities and the
Stokes drift component at 15-m depth using Eq. (1) of
Niiler et al. (2003) and Eq. (66) of McWilliams and
Restrepo (1999), respectively. Both of these compo-
nents were found to be small with peak values consis-
tently around 1 cm s21, which is less than the expected
drogue slip. The work of Rio and Hernandez (2003)
confirms that Ekman velocities are small near the tip of
the Antarctic Peninsula, although there is not coverage
FIG. 7. ADELIE and historical drifter trajectories near the tip of the Antarctic Peninsula that escape into the
Antarctic Circumpolar Current. The box in the larger panel is an important choke point for particles leaving the
Weddell Sea; this region is expanded in the bottom panel. The solid black curves represent drifter trajectories prior
to entering the box, while the dashed black portions of the curves are the trajectories after exiting the box. In some
cases, a drifter trajectory will enter and exit the box multiple times. For these trajectories, the curve is only solid
until the drifter first enters the box. The dots indicate deployment locations. Shading indicates bottom topography
as in Fig. 1.
JANUARY 2009 T H O M P S O N E T A L . 13
for the entire area of the ADELIE study. Because wind
data are unavailable for the entire drifter record or for
the historical drifters, the wind component has not been
removed. We note that the mean current estimates of-
ten involve averages over observations at very different
times, and thus the wind-driven component would tend
to be minimized unless the wind direction was consis-
tently in a uniform direction.
a. Basic flow statistics
The velocity observations were averaged in bins of
0.28 latitude 3 0.48 longitude to obtain estimates of the
large-scale mean circulation during the measurement
period. A distance of 0.48 of longitude at 658S is ap-
proximately 19 km, while 0.48 of longitude at 598S is
approximately 23 km, thus the bins are roughly square
throughout the domain (0.28 latitude ’ 22 km). We
have chosen to incorporate 55 historical drifters that
entered the region 658 to 408W and 658 to 598S. The
introduction of the historical data complements the ob-
servations made by the ADELIE drifters because it
provides supporting data in regions, such as Bransfield
Strait, where sampling by ADELIE drifters was less
dense. We note that more sophisticated methods exist
for determining the mean circulation, such as objective
analysis (Davis 1998) or bicubic spline interpolation
(Bauer et al. 1998), but for simplicity binned means
were applied.4
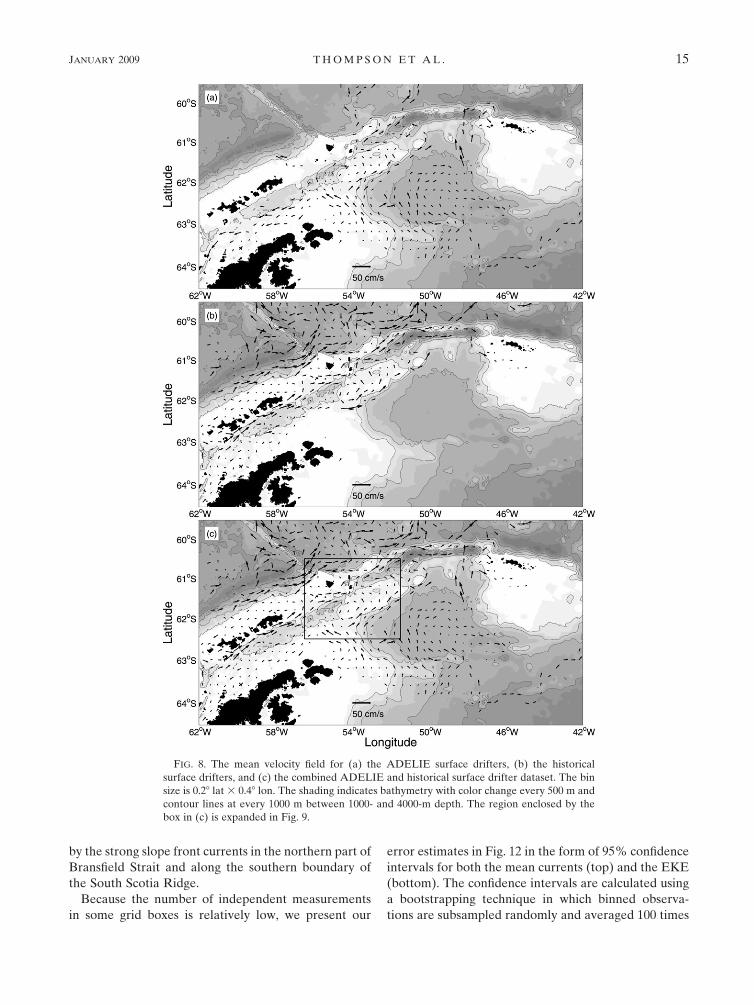
Figure 8 shows the mean circulation derived from (i)
the ADELIE drifters, (ii) the historical drifters, and
(iii) the combined drifter dataset. The two sets cover
very different regions of the northwestern Weddell Sea,
but taken together they provide a relatively complete
view of the surface circulation in this area. The clearest
features are the strong ASF northeast of Joinville Is-
land, the western boundary current in Bransfield Strait,
the standing eddy over the South Scotia Ridge, and the
convergence of flow near Elephant and Clarence Is-
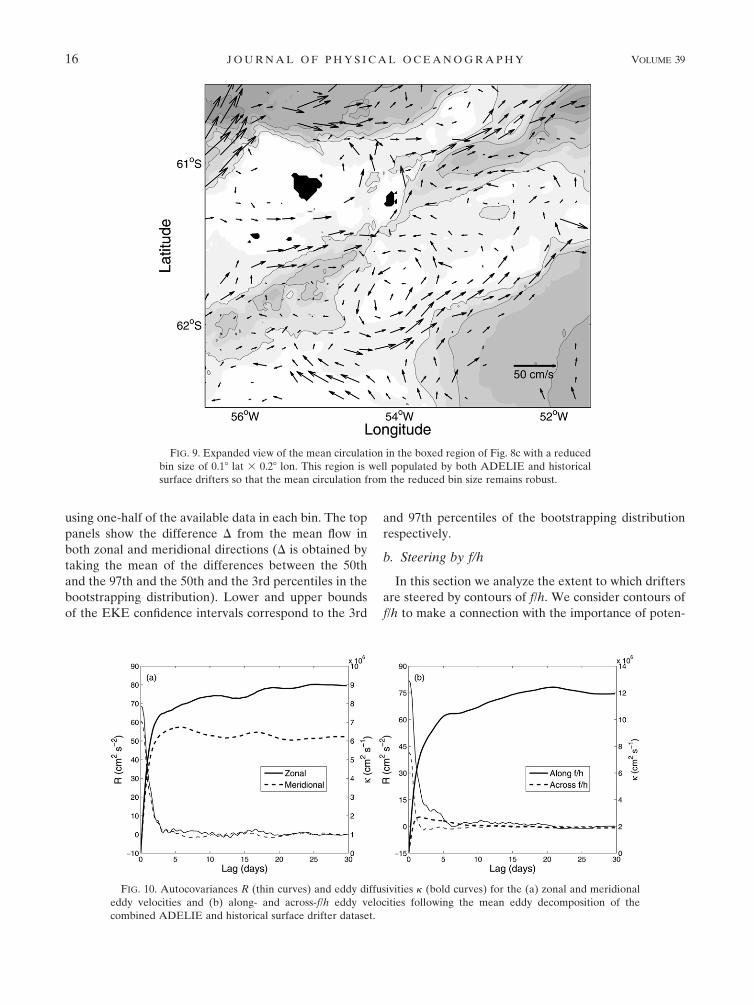
lands. These latter two features are expanded in Fig. 9,
which corresponds to the boxed region in Fig. 8c. Fig-
ure 9 uses bins that are 0.18 latitude 3 0.28 longitude.
At this increased resolution, regions of strong horizon-
tal shear (e.g., the western edge of the South Scotia
Ridge and along the Hesperides Trough) are clearly
visible.
Velocity estimates are assumed to be independent
if they are separated by times longer than the
Lagrangian time scale. Assuming that the eddy field is
homogeneous and stationary, the eddy diffusivity k is
defined as
k 5 limt!‘8; 8ðtÞ [
Z t
0
RðtÞ dt; ð1Þ
where R(t) is the Lagrangian autocovariance of the
eddy velocity (Bauer et al. 1998; Falco et al. 2000). The
Lagrangian time scale TL is then obtained by dividing k
by the variance of the eddy velocity s2, or
TL 51
s2
Z ‘
0
RðtÞ dt: ð2Þ
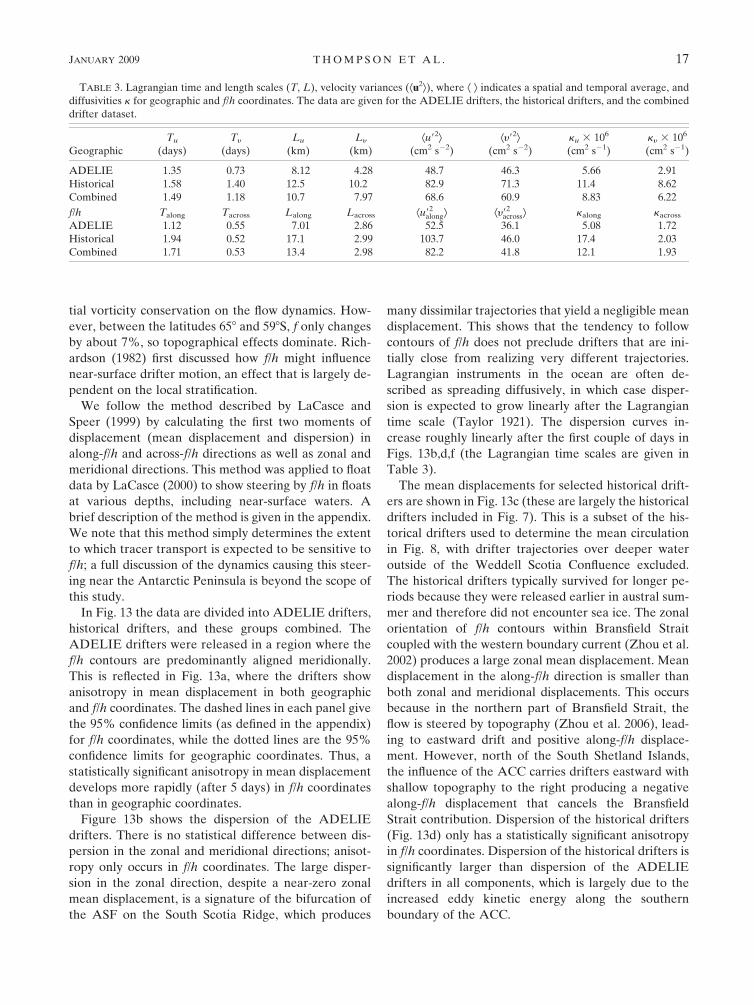
Figure 10 shows the autocovariance R (thin curve) and
eddy diffusivities k (bold curve) in both (i) zonal and
meridional geographic components and (ii) along and
across f/h components for both ADELIE and historical
drifters. In both cases k asymptotes to a constant value
within approximately 10 days. The Lagrangian time
scale TL is approximately one day for the ADELIE
drifters and slightly longer for the historical drifters.
This value is comparable to other drifter studies in
coastal and topographically influenced regions such as
the Adriatic Sea (Falco et al. 2000) and the Aegean Sea
(Olson et al. 2007). The Lagrangian scales are summa-
rized in Table 3.
Figure 11a shows the number of independent obser-
vations that are available from the combined historical
and ADELIE drifters based on the Lagrangian time-
scale estimates. Velocity observations are only sepa-
rated into mean and eddy components if they are found
in a bin with five or more independent observations.
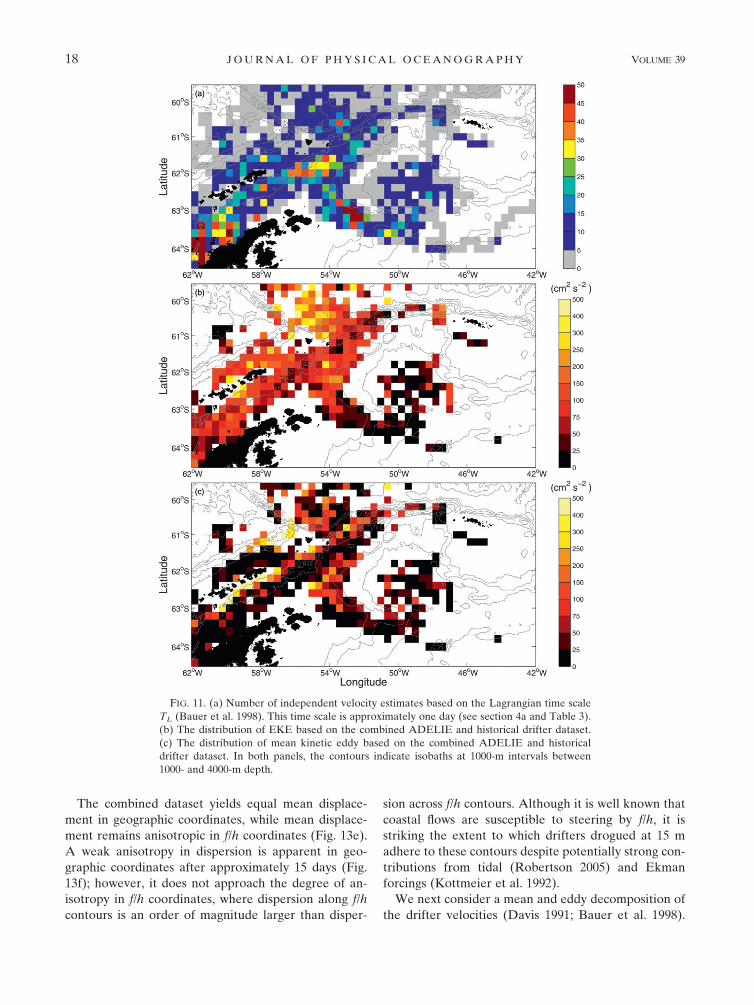
Figure 11b shows the eddy kinetic energy (EKE) de-
rived from the binning process described above. The
largest values of EKE are found north of the South
Scotia Ridge, where strong currents along the southern
boundary of the ACC impinge on the Weddell Scotia
Confluence. Here, maximum values of the EKE can
reach 700 cm2 s21. Typical values within the Weddell
Gyre are much smaller, peaking around 250 cm2 s21
along the ASF and up onto the South Scotia Ridge. The
standing eddy shown in Fig. 9 is not correlated with a
peak in EKE, suggesting that there is little variability
associated with this feature (see discussion in section 3b).
We note that mean velocities to the east of the Peninsula
are generated solely from ADELIE drifters, and thus
the EKE reflects variability at meso- and synoptic
scales, but not seasonal or interannual variability. His-
torical drifters in Bransfield Strait and the Weddell
Scotia Confluence have been deployed in various years,
and therefore EKE here may represent longer temporal
variability. Figure 11c shows the mean kinetic energy
for comparison with the EKE. The signal is dominated
4 Falco et al. (2000) found that there was little difference be-
tween mean circulations derived from binned means and bicubic
spline interpolation in the Adriatic Sea.
14 J O U R N A L O F P H Y S I C A L O C E A N O G R A P H Y VOLUME 39
by the strong slope front currents in the northern part of
Bransfield Strait and along the southern boundary of
the South Scotia Ridge.
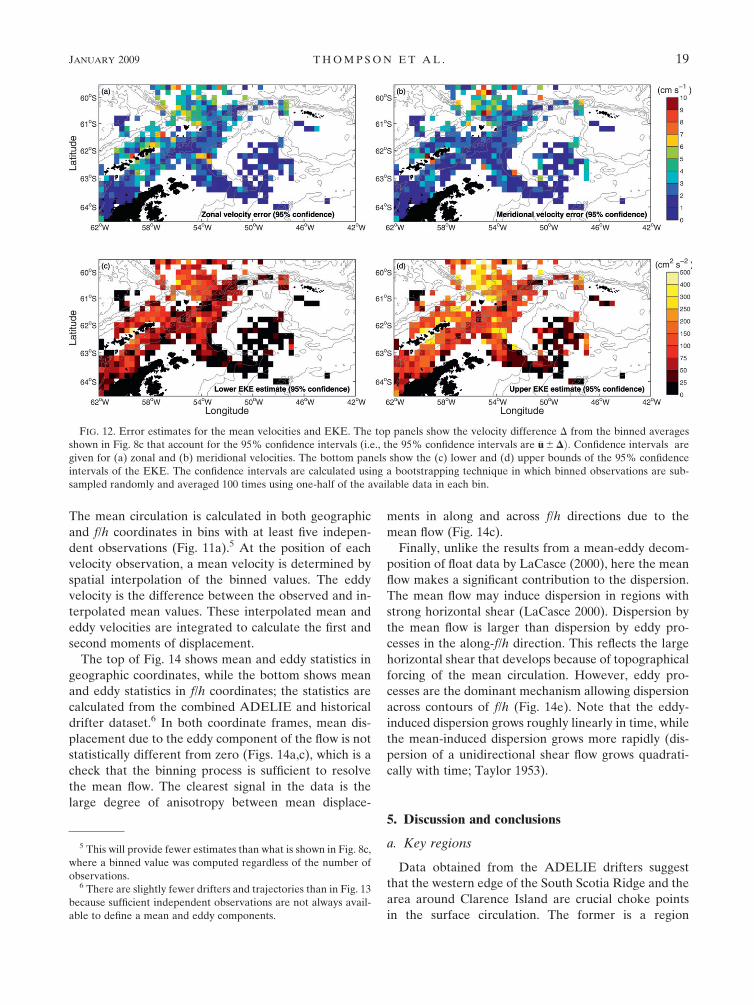
Because the number of independent measurements
in some grid boxes is relatively low, we present our
error estimates in Fig. 12 in the form of 95% confidence
intervals for both the mean currents (top) and the EKE
(bottom). The confidence intervals are calculated using
a bootstrapping technique in which binned observa-
tions are subsampled randomly and averaged 100 times
FIG. 8. The mean velocity field for (a) the ADELIE surface drifters, (b) the historical
surface drifters, and (c) the combined ADELIE and historical surface drifter dataset. The bin
size is 0.28 lat 3 0.48 lon. The shading indicates bathymetry with color change every 500 m and
contour lines at every 1000 m between 1000- and 4000-m depth. The region enclosed by the
box in (c) is expanded in Fig. 9.
JANUARY 2009 T H O M P S O N E T A L . 15
using one-half of the available data in each bin. The top
panels show the difference D from the mean flow in
both zonal and meridional directions (D is obtained by
taking the mean of the differences between the 50th
and the 97th and the 50th and the 3rd percentiles in the
bootstrapping distribution). Lower and upper bounds
of the EKE confidence intervals correspond to the 3rd
and 97th percentiles of the bootstrapping distribution
respectively.
b. Steering by f/h
In this section we analyze the extent to which drifters
are steered by contours of f/h. We consider contours of
f/h to make a connection with the importance of poten-
FIG. 10. Autocovariances R (thin curves) and eddy diffusivities k (bold curves) for the (a) zonal and meridional
eddy velocities and (b) along- and across-f/h eddy velocities following the mean eddy decomposition of the
combined ADELIE and historical surface drifter dataset.
FIG. 9. Expanded view of the mean circulation in the boxed region of Fig. 8c with a reduced
bin size of 0.18 lat 3 0.28 lon. This region is well populated by both ADELIE and historical
surface drifters so that the mean circulation from the reduced bin size remains robust.
16 J O U R N A L O F P H Y S I C A L O C E A N O G R A P H Y VOLUME 39
tial vorticity conservation on the flow dynamics. How-
ever, between the latitudes 658 and 598S, f only changes
by about 7%, so topographical effects dominate. Rich-
ardson (1982) first discussed how f/h might influence
near-surface drifter motion, an effect that is largely de-
pendent on the local stratification.
We follow the method described by LaCasce and
Speer (1999) by calculating the first two moments of
displacement (mean displacement and dispersion) in
along-f/h and across-f/h directions as well as zonal and
meridional directions. This method was applied to float
data by LaCasce (2000) to show steering by f/h in floats
at various depths, including near-surface waters. A
brief description of the method is given in the appendix.
We note that this method simply determines the extent
to which tracer transport is expected to be sensitive to
f/h; a full discussion of the dynamics causing this steer-
ing near the Antarctic Peninsula is beyond the scope of
this study.
In Fig. 13 the data are divided into ADELIE drifters,
historical drifters, and these groups combined. The
ADELIE drifters were released in a region where the
f/h contours are predominantly aligned meridionally.
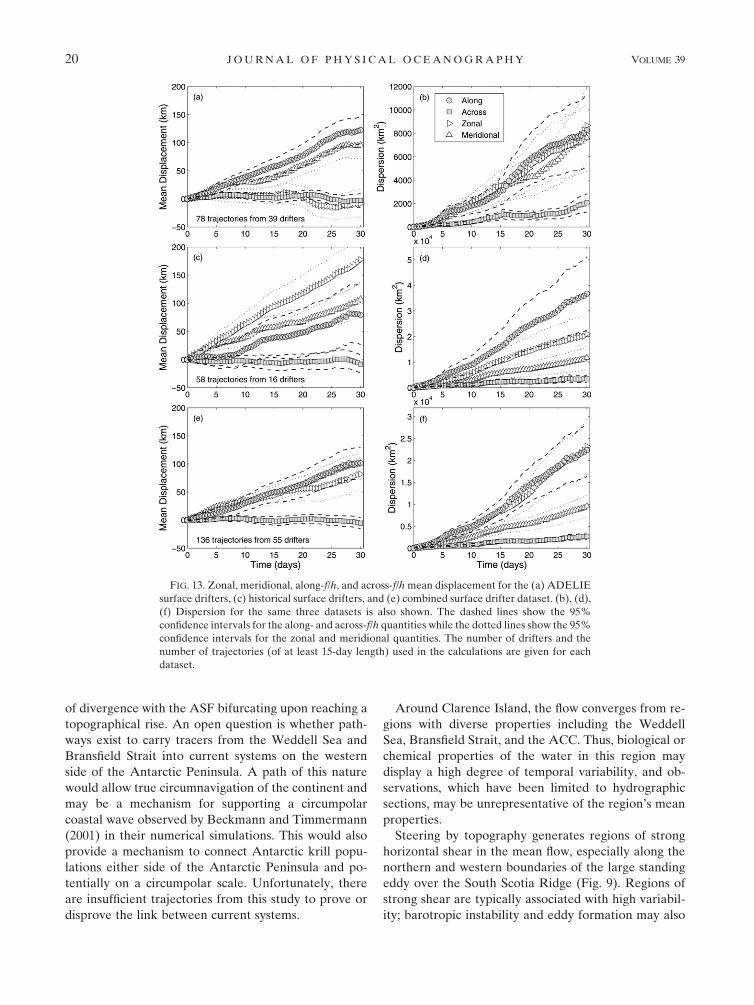
This is reflected in Fig. 13a, where the drifters show
anisotropy in mean displacement in both geographic
and f/h coordinates. The dashed lines in each panel give
the 95% confidence limits (as defined in the appendix)
for f/h coordinates, while the dotted lines are the 95%
confidence limits for geographic coordinates. Thus, a
statistically significant anisotropy in mean displacement
develops more rapidly (after 5 days) in f/h coordinates
than in geographic coordinates.
Figure 13b shows the dispersion of the ADELIE
drifters. There is no statistical difference between dis-
persion in the zonal and meridional directions; anisot-
ropy only occurs in f/h coordinates. The large disper-
sion in the zonal direction, despite a near-zero zonal
mean displacement, is a signature of the bifurcation of
the ASF on the South Scotia Ridge, which produces
many dissimilar trajectories that yield a negligible mean
displacement. This shows that the tendency to follow
contours of f/h does not preclude drifters that are ini-
tially close from realizing very different trajectories.
Lagrangian instruments in the ocean are often de-
scribed as spreading diffusively, in which case disper-
sion is expected to grow linearly after the Lagrangian
time scale (Taylor 1921). The dispersion curves in-
crease roughly linearly after the first couple of days in
Figs. 13b,d,f (the Lagrangian time scales are given in
Table 3).
The mean displacements for selected historical drift-
ers are shown in Fig. 13c (these are largely the historical
drifters included in Fig. 7). This is a subset of the his-
torical drifters used to determine the mean circulation
in Fig. 8, with drifter trajectories over deeper water
outside of the Weddell Scotia Confluence excluded.
The historical drifters typically survived for longer pe-
riods because they were released earlier in austral sum-
mer and therefore did not encounter sea ice. The zonal
orientation of f/h contours within Bransfield Strait
coupled with the western boundary current (Zhou et al.
2002) produces a large zonal mean displacement. Mean
displacement in the along-f/h direction is smaller than
both zonal and meridional displacements. This occurs
because in the northern part of Bransfield Strait, the
flow is steered by topography (Zhou et al. 2006), lead-
ing to eastward drift and positive along-f/h displace-
ment. However, north of the South Shetland Islands,
the influence of the ACC carries drifters eastward with
shallow topography to the right producing a negative
along-f/h displacement that cancels the Bransfield
Strait contribution. Dispersion of the historical drifters
(Fig. 13d) only has a statistically significant anisotropy
in f/h coordinates. Dispersion of the historical drifters is
significantly larger than dispersion of the ADELIE
drifters in all components, which is largely due to the
increased eddy kinetic energy along the southern
boundary of the ACC.
TABLE 3. Lagrangian time and length scales (T, L), velocity variances (Æu2æ), where Æ æ indicates a spatial and temporal average, and
diffusivities k for geographic and f/h coordinates. The data are given for the ADELIE drifters, the historical drifters, and the combined
drifter dataset.
Geographic
Tu
(days)
Ty
(days)
Lu
(km)
Ly
(km)
Æu92æ(cm2 s22)
Æy92æ(cm2 s22)
ku 3 106
(cm2 s21)
ky 3 106
(cm2 s21)
ADELIE 1.35 0.73 8.12 4.28 48.7 46.3 5.66 2.91
Historical 1.58 1.40 12.5 10.2 82.9 71.3 11.4 8.62
Combined 1.49 1.18 10.7 7.97 68.6 60.9 8.83 6.22
f/h Talong Tacross Lalong Lacross Æu92alongæ Æy92
acrossæ kalong kacross
ADELIE 1.12 0.55 7.01 2.86 52.5 36.1 5.08 1.72
Historical 1.94 0.52 17.1 2.99 103.7 46.0 17.4 2.03
Combined 1.71 0.53 13.4 2.98 82.2 41.8 12.1 1.93
JANUARY 2009 T H O M P S O N E T A L . 17
The combined dataset yields equal mean displace-
ment in geographic coordinates, while mean displace-
ment remains anisotropic in f/h coordinates (Fig. 13e).
A weak anisotropy in dispersion is apparent in geo-
graphic coordinates after approximately 15 days (Fig.
13f); however, it does not approach the degree of an-
isotropy in f/h coordinates, where dispersion along f/h
contours is an order of magnitude larger than disper-
sion across f/h contours. Although it is well known that
coastal flows are susceptible to steering by f/h, it is
striking the extent to which drifters drogued at 15 m
adhere to these contours despite potentially strong con-
tributions from tidal (Robertson 2005) and Ekman
forcings (Kottmeier et al. 1992).
We next consider a mean and eddy decomposition of
the drifter velocities (Davis 1991; Bauer et al. 1998).
FIG. 11. (a) Number of independent velocity estimates based on the Lagrangian time scale
TL (Bauer et al. 1998). This time scale is approximately one day (see section 4a and Table 3).
(b) The distribution of EKE based on the combined ADELIE and historical drifter dataset.
(c) The distribution of mean kinetic eddy based on the combined ADELIE and historical
drifter dataset. In both panels, the contours indicate isobaths at 1000-m intervals between
1000- and 4000-m depth.
18 J O U R N A L O F P H Y S I C A L O C E A N O G R A P H Y VOLUME 39
The mean circulation is calculated in both geographic
and f/h coordinates in bins with at least five indepen-
dent observations (Fig. 11a).5 At the position of each
velocity observation, a mean velocity is determined by
spatial interpolation of the binned values. The eddy
velocity is the difference between the observed and in-
terpolated mean values. These interpolated mean and
eddy velocities are integrated to calculate the first and
second moments of displacement.
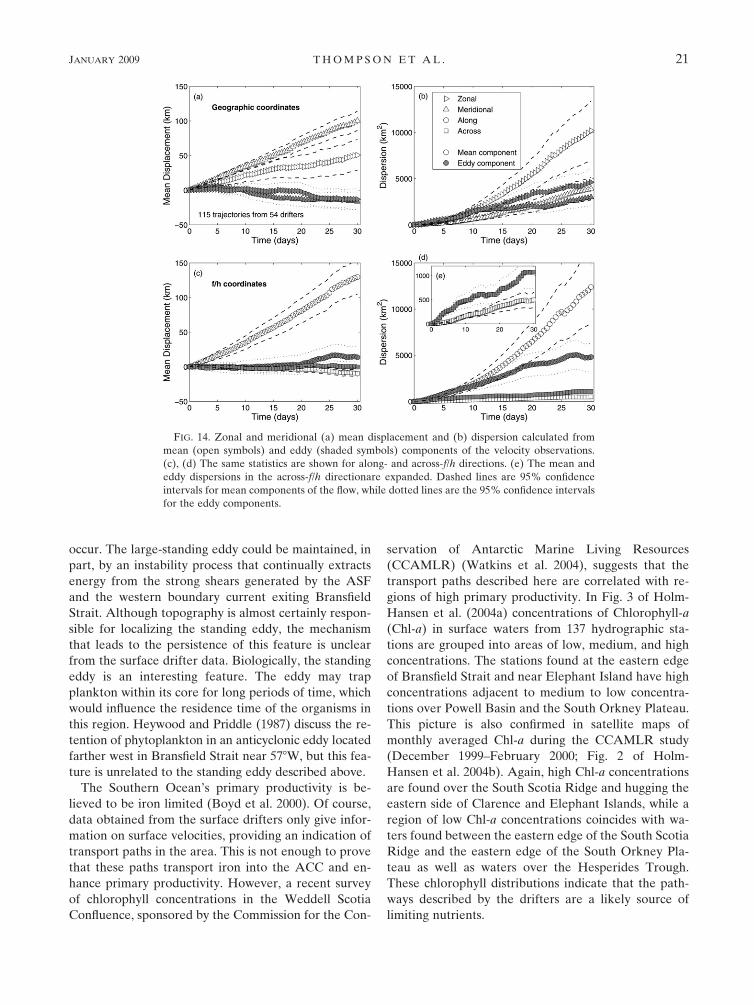
The top of Fig. 14 shows mean and eddy statistics in
geographic coordinates, while the bottom shows mean
and eddy statistics in f/h coordinates; the statistics are
calculated from the combined ADELIE and historical
drifter dataset.6 In both coordinate frames, mean dis-
placement due to the eddy component of the flow is not
statistically different from zero (Figs. 14a,c), which is a
check that the binning process is sufficient to resolve
the mean flow. The clearest signal in the data is the
large degree of anisotropy between mean displace-
ments in along and across f/h directions due to the
mean flow (Fig. 14c).
Finally, unlike the results from a mean-eddy decom-
position of float data by LaCasce (2000), here the mean
flow makes a significant contribution to the dispersion.
The mean flow may induce dispersion in regions with
strong horizontal shear (LaCasce 2000). Dispersion by
the mean flow is larger than dispersion by eddy pro-
cesses in the along-f/h direction. This reflects the large
horizontal shear that develops because of topographical
forcing of the mean circulation. However, eddy pro-
cesses are the dominant mechanism allowing dispersion
across contours of f/h (Fig. 14e). Note that the eddy-
induced dispersion grows roughly linearly in time, while
the mean-induced dispersion grows more rapidly (dis-
persion of a unidirectional shear flow grows quadrati-
cally with time; Taylor 1953).
5. Discussion and conclusions
a. Key regions
Data obtained from the ADELIE drifters suggest
that the western edge of the South Scotia Ridge and the
area around Clarence Island are crucial choke points
in the surface circulation. The former is a region
FIG. 12. Error estimates for the mean velocities and EKE. The top panels show the velocity difference D from the binned averages
shown in Fig. 8c that account for the 95% confidence intervals (i.e., the 95% confidence intervals are �u 6 DÞ: Confidence intervals are
given for (a) zonal and (b) meridional velocities. The bottom panels show the (c) lower and (d) upper bounds of the 95% confidence
intervals of the EKE. The confidence intervals are calculated using a bootstrapping technique in which binned observations are sub-
sampled randomly and averaged 100 times using one-half of the available data in each bin.
5 This will provide fewer estimates than what is shown in Fig. 8c,
where a binned value was computed regardless of the number of
observations.6 There are slightly fewer drifters and trajectories than in Fig. 13
because sufficient independent observations are not always avail-
able to define a mean and eddy components.
JANUARY 2009 T H O M P S O N E T A L . 19
of divergence with the ASF bifurcating upon reaching a
topographical rise. An open question is whether path-
ways exist to carry tracers from the Weddell Sea and
Bransfield Strait into current systems on the western
side of the Antarctic Peninsula. A path of this nature
would allow true circumnavigation of the continent and
may be a mechanism for supporting a circumpolar
coastal wave observed by Beckmann and Timmermann
(2001) in their numerical simulations. This would also
provide a mechanism to connect Antarctic krill popu-
lations either side of the Antarctic Peninsula and po-
tentially on a circumpolar scale. Unfortunately, there
are insufficient trajectories from this study to prove or
disprove the link between current systems.
Around Clarence Island, the flow converges from re-
gions with diverse properties including the Weddell
Sea, Bransfield Strait, and the ACC. Thus, biological or
chemical properties of the water in this region may
display a high degree of temporal variability, and ob-
servations, which have been limited to hydrographic
sections, may be unrepresentative of the region’s mean
properties.
Steering by topography generates regions of strong
horizontal shear in the mean flow, especially along the
northern and western boundaries of the large standing
eddy over the South Scotia Ridge (Fig. 9). Regions of
strong shear are typically associated with high variabil-
ity; barotropic instability and eddy formation may also
FIG. 13. Zonal, meridional, along-f/h, and across-f/h mean displacement for the (a) ADELIE
surface drifters, (c) historical surface drifters, and (e) combined surface drifter dataset. (b), (d),
(f) Dispersion for the same three datasets is also shown. The dashed lines show the 95%
confidence intervals for the along- and across-f/h quantities while the dotted lines show the 95%
confidence intervals for the zonal and meridional quantities. The number of drifters and the
number of trajectories (of at least 15-day length) used in the calculations are given for each
dataset.
20 J O U R N A L O F P H Y S I C A L O C E A N O G R A P H Y VOLUME 39
occur. The large-standing eddy could be maintained, in
part, by an instability process that continually extracts
energy from the strong shears generated by the ASF
and the western boundary current exiting Bransfield
Strait. Although topography is almost certainly respon-
sible for localizing the standing eddy, the mechanism
that leads to the persistence of this feature is unclear
from the surface drifter data. Biologically, the standing
eddy is an interesting feature. The eddy may trap
plankton within its core for long periods of time, which
would influence the residence time of the organisms in
this region. Heywood and Priddle (1987) discuss the re-
tention of phytoplankton in an anticyclonic eddy located
farther west in Bransfield Strait near 578W, but this fea-
ture is unrelated to the standing eddy described above.
The Southern Ocean’s primary productivity is be-
lieved to be iron limited (Boyd et al. 2000). Of course,
data obtained from the surface drifters only give infor-
mation on surface velocities, providing an indication of
transport paths in the area. This is not enough to prove
that these paths transport iron into the ACC and en-
hance primary productivity. However, a recent survey
of chlorophyll concentrations in the Weddell Scotia
Confluence, sponsored by the Commission for the Con-
servation of Antarctic Marine Living Resources
(CCAMLR) (Watkins et al. 2004), suggests that the
transport paths described here are correlated with re-
gions of high primary productivity. In Fig. 3 of Holm-
Hansen et al. (2004a) concentrations of Chlorophyll-a
(Chl-a) in surface waters from 137 hydrographic sta-
tions are grouped into areas of low, medium, and high
concentrations. The stations found at the eastern edge
of Bransfield Strait and near Elephant Island have high
concentrations adjacent to medium to low concentra-
tions over Powell Basin and the South Orkney Plateau.
This picture is also confirmed in satellite maps of
monthly averaged Chl-a during the CCAMLR study
(December 1999–February 2000; Fig. 2 of Holm-
Hansen et al. 2004b). Again, high Chl-a concentrations
are found over the South Scotia Ridge and hugging the
eastern side of Clarence and Elephant Islands, while a
region of low Chl-a concentrations coincides with wa-
ters found between the eastern edge of the South Scotia
Ridge and the eastern edge of the South Orkney Pla-
teau as well as waters over the Hesperides Trough.
These chlorophyll distributions indicate that the path-
ways described by the drifters are a likely source of
limiting nutrients.
FIG. 14. Zonal and meridional (a) mean displacement and (b) dispersion calculated from
mean (open symbols) and eddy (shaded symbols) components of the velocity observations.
(c), (d) The same statistics are shown for along- and across-f/h directions. (e) The mean and
eddy dispersions in the across-f/h directionare expanded. Dashed lines are 95% confidence
intervals for mean components of the flow, while dotted lines are the 95% confidence intervals
for the eddy components.
JANUARY 2009 T H O M P S O N E T A L . 21

Assuming, then, that the transport paths described
here are potential mechanisms for the export of iron, it
is of interest to determine where iron-rich waters origi-
nating over the continental shelf are able to cross con-
tours of f/h to reach deeper waters. Figure 15 shows the
ratio of the across-f/h velocity variance to the along-f/h
velocity variance for bins where there are at least five
independent estimates. The ratio is then multiplied by
the eddy kinetic energy (as shown in Fig. 11b) for nor-
malization, because the ratio can be abnormally large in
bins where there is little eddy activity. Tracers are more
likely to cross contours of f/h where this quantity is
large. Although large across-f/h variance does not nec-
essarily imply mean transport across-f/h contours, we
expect cross-slope exchange to be large here because
eddy processes dominate the cross-slope dispersion
(Fig. 14). Also, regions in Fig. 15 that have large values
largely correspond to areas where the across-f/h com-
ponent of the mean circulation is significant (not
shown). Neglecting the large values found in the Scotia
Sea, the important regions of cross-slope exchange are
likely found along the southern boundary of the South
Scotia Ridge and to the northeast of Elephant and Clar-
ence Islands.
Observations (Watkins et al. 1999) and modeling
studies (Hofmann et al. 1998; Murphy et al. 2004) have
linked the populations of Antarctic krill at the Antarc-
tic Peninsula and the northern Weddell Sea to those
around the island of South Georgia in the northeastern
Scotia Sea. While we are unable to verify whether krill
may be transported between these two regions purely
from the drifter data, we have identified what are likely
to be the key transport pathways between the coastal
region near the Antarctic Peninsula and the Scotia Sea.
b. Summary
The surface circulation of the northwestern Weddell Sea
has been studied using data from a set of 40 surface drifters
deployed across the continental shelf and slope to the east
of the tip of the Antarctic Peninsula. Combining these data
with historical drifter data in the region, primarily within
Bransfield Strait, we have identified new circulation fea-
tures that update the schematic provided by Heywood et al.
(2004) of the Antarctic Coastal Current and the Antarctic
Slope Front (Fig. 3). These new features have a significant
influence on the export of nutrient-rich shelf waters into the
Antarctic Circumpolar Current. The drifter-derived circu-
lation may also serve as a starting point for understanding
how deep water escapes the Weddell Sea. This is possible
because the circulation of the western Weddell Sea is
largely barotropic and, more importantly, the deep outflow
peaks in the same locations as the frontal currents found at
the surface and in the interior (Fahrbach et al. 2001, TH08).
Our major conclusions follow:
1) While the Coastal Current and the ASF appear as
separate currents east of Joinville Island where the
continental shelf is broad, these two features merge
at the mouth of Bransfield Strait and dominate the
circulation. Most drifters deployed shoreward of the
2500-m isobath become entrained in the ASF. Upon
reaching the western edge of the South Scotia
Ridge, trajectories describe one of three possible
fates: (i) they turn west and flow into the southern
FIG. 15. Ratio of across-f/h velocity variance to along-f/h velocity variance multiplied by the EKE for normalization.
The contours indicate bottom topography with contours every 1000 m between 1000- and 4000-m depth.
22 J O U R N A L O F P H Y S I C A L O C E A N O G R A P H Y VOLUME 39
portion of Bransfield Strait. The drifters may be re-
turned to the South Scotia Ridge within the Strait’s
strong western boundary current. (ii) They become
entrained in a large standing eddy centered at 628S
and 548W. This eddy has not, to our knowledge,
been previously reported but is a persistent feature
in the historical drifter data. (iii) They turn east and
follow a complicated, topographically forced path
allowing eventual export into the ACC.
2) The export of water masses from the western Wed-
dell Sea may follow a number of complicated routes
due to the bifurcation of the ASF at the western
edge of the South Scotia Ridge, however, both
ADELIE and historical surface drifters escape into
the Antarctic Circumpolar Current from a relatively
small geographical region (Fig. 7). Furthermore,
while these export routes are well described by the
mean circulation shown in Fig. 8, the path an indi-
vidual drifter ultimately follows likely depends cru-
cially on smaller-scale motions such as eddies, iner-
tial oscillations, Ekman drift, and tidal forcing. The
importance of these forcings, especially in regions
highlighted in section 5a, requires further study.
3) The surface drifter trajectories are steered by contours
of f/h to a remarkable degree, considering they are
drogued at 15-m depth. The largest contribution to the
dispersion of the drifters is due to regions of large shear
in the mean flow; however, eddy processes are pri-
marily responsible for dispersion across contours of f/h.
The western edge of the South Scotia Ridge and the
region between the Hesperides Trough and Clarence
Island have been identified as potentially important
regions for cross-slope exchange (Fig. 15). We em-
phasize that the tendency to follow contours of f/h does
not preclude two drifters starting in similar locations
from describing very different trajectories. The differ-
ent residence times within the Weddell Sea associated
with different trajectories may have implications for
Antarctic krill transport to South Georgia Island
and for natural fertilization of the area by iron from the
Antarctic Peninsula.
Acknowledgments. We are grateful to all who con-
tributed to the success of the ADELIE research cruise,
especially the officers and crew of the RRS James Clark
Ross. We are grateful for support from Peter Niiler and
the Global Drifter Program in augmenting our drifter
array and supplying position fixes. Mayra Pazos was
extremely helpful in providing near-real-time data on
the drifter trajectories during the research cruise. Deb
Shoosmith assisted in processing the shipboard ADCP
data, and Kevin Manning provided the AMPS wind data.
Comments from two anonymous reviewers helped clarify
some important aspects of this study. The cruise was
supported by the U.K. Natural Environment Research
Council (NERC) through the Antarctic Funding Initia-
tive, AFI6/25. AHHR was supported by a Marie Curie
Early Stage Training Fellowship. ATC’s participation
was funded in part by the Royal Society’s International
Joint Projects Scheme. AT is an SNI (Mexico) grant
holder and his participation was funded in part by the
Royal Society’s International Joint Projects Scheme,
CICESE’s Oceanology Division, and Unidad La Paz.
APPENDIX
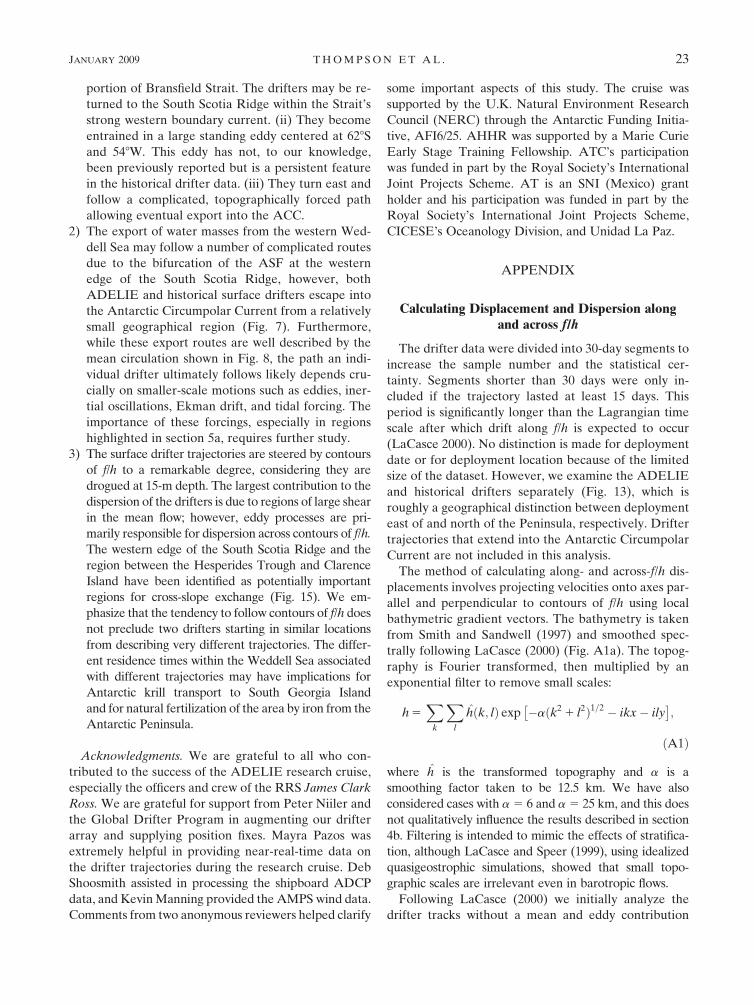
Calculating Displacement and Dispersion alongand across f/h
The drifter data were divided into 30-day segments to
increase the sample number and the statistical cer-
tainty. Segments shorter than 30 days were only in-
cluded if the trajectory lasted at least 15 days. This
period is significantly longer than the Lagrangian time
scale after which drift along f/h is expected to occur
(LaCasce 2000). No distinction is made for deployment
date or for deployment location because of the limited
size of the dataset. However, we examine the ADELIE
and historical drifters separately (Fig. 13), which is
roughly a geographical distinction between deployment
east of and north of the Peninsula, respectively. Drifter
trajectories that extend into the Antarctic Circumpolar
Current are not included in this analysis.
The method of calculating along- and across-f/h dis-
placements involves projecting velocities onto axes par-
allel and perpendicular to contours of f/h using local
bathymetric gradient vectors. The bathymetry is taken
from Smith and Sandwell (1997) and smoothed spec-
trally following LaCasce (2000) (Fig. A1a). The topog-
raphy is Fourier transformed, then multiplied by an
exponential filter to remove small scales:
h 5X
k
Xl
h k; lð Þ exp��aðk2 1 l2Þ1=2 � ikx� ily
�;
ðA1Þ
where h is the transformed topography and a is a
smoothing factor taken to be 12.5 km. We have also
considered cases with a 5 6 and a 5 25 km, and this does
not qualitatively influence the results described in section
4b. Filtering is intended to mimic the effects of stratifica-
tion, although LaCasce and Speer (1999), using idealized
quasigeostrophic simulations, showed that small topo-
graphic scales are irrelevant even in barotropic flows.
Following LaCasce (2000) we initially analyze the
drifter tracks without a mean and eddy contribution
JANUARY 2009 T H O M P S O N E T A L . 23
and rather consider the drifter tracks as transport mea-
surements. Displacements are calculated from twice-
daily positions subsampled from the filtered, 6-hourly
drifter tracks (see section 2) to determine zonal and
meridional velocities. Along- and across-f/h velocities
are obtained by taking the cross and dot products, re-
spectively, of the velocity vector with the local gradient
vector for f/h. Positive across-f/h velocities are defined
as ‘‘uphill,’’ while positive along-f/h velocities have the
shallower topography to the left.
The mean displacement M(t) is defined by
MðtÞ5
Pi
diðtÞ � dið0Þ½ �
N6 z
DðtÞN � 1
� �1=2
; ðA2Þ
and the dispersion D(t) is given by
DðtÞ5
Pi
½diðtÞ � dið0Þ �MðtÞ�2
N � 1
3 1 6 z2
N � 1
� �1=2" #
; ðA3Þ
where d is displacement, N is the number of measure-
ments, and z 5 1.96 at the 95% confidence level if
normal distribution is assumed (LaCasce and Speer
1999; LaCasce 2000). As noted by LaCasce (2000), dis-
placements along and across f/h do not conserve dis-
tance because f/h is curvilinear. Figure A1b shows the
FIG. A1. (a) Smooth f/h contours for the ADELIE study region. The contours values for f/h
are (4, 5, 10, 20, 30, 50) 3 1028 (m s)21; land is indicated by the bold curve. The f/h field is
smoothed following (3), where the smoothing factor a is taken to be 12.5 km. (b) Ex-
panded view of the boxed region with the trajectory of drifter 71212 superimposed. The drifter
trajectory has been filtered to remove tidal and inertial motions. (c) The displacement of
drifter 71212 in zonal and meridional direction and also projected into along- and across-f/h
direction as described in the appendix.
24 J O U R N A L O F P H Y S I C A L O C E A N O G R A P H Y VOLUME 39
trajectory from drifter 71212 overlaid on the f/h con-
tours in the boxed region of Fig. A1a. The zonal and
meridional along- and across-f/h mean displacements
for this single trajectory are shown in Fig. A1c.
REFERENCES
Atkinson, A., M. J. Whitehouse, J. Priddle, G. C. Cripps, P. Ward,
and M. A. Brandon, 2001: South Georgia, Antarctica: A pro-
ductive, cold water, pelagic ecosystem. Mar. Ecol. Prog. Ser.,
216, 279–308.
Bauer, S. A., A. Griffa, M. Swenson, A. Mariano, and K. Owens,
1998: Eddy-mean flow decomposition and eddy diffusivity
estimates in the tropical Pacific Ocean. 1. Methodology. J.
Geophys. Res., 103, 30 855–30 871.
Beckmann, A., and R. Timmermann, 2001: Circumpolar influ-
ences on the Weddell Sea: Indication of an Antarctic circum-
polar coastal wave. J. Climate, 14, 3785–3792.
Boyd, P. W., and Coauthors, 2000: A mesoscale phytoplankton
bloom in the polar Southern Ocean stimulated by iron fer-
tilization. Nature, 407, 695–702.
Chelton, D. B., R. A. deSzoeke, M. G. Schlax, K. El Naggar, and
N. Siwertz, 1998: Geographical variability of the first-
baroclinic Rossby radius of deformation. J. Phys. Oceanogr.,
28, 433–460.
Davis, R. E., 1991: Observing the general circulation with floats.
Deep-Sea Res., 38 (Suppl.), S531–S571.
——, 1998: Preliminary results from directly measuring mid-depth
circulation in the Tropical and South Pacific. J. Geophys.
Res., 103, 24 619–24 639.
Fahrbach, E., G. Rohardt, and G. Krause, 1992: The Antarctic
coastal current in the southeastern Weddell Sea. Polar Biol.,
12, 171–182.
——, ——, M. Schroder, and V. Strass, 1994: Transport and struc-
ture of the Weddell Gyre. Ann. Geophys., 12, 840–855.
——, S. Harms, G. Rohardt, M. Schroder, and R. A. Woodgate,
2001: Flow of bottom water in the northwestern Weddell Sea.
J. Geophys. Res., 106, 2761–2778.
Falco, P., A. Griffa, P.-M. Poulain, and E. Zambianchi, 2000:
Transport properties in the Adriatic Sea as deduced from
drifter data. J. Phys. Oceanogr., 30, 2055–2071.
Falkowski, P. G., R. T. Barber, and V. Smetacek, 1998: Bio-
geochemical controls and feedbacks on ocean primary pro-
duction. Science, 281, 200–206.
Fitzwater, S. E., K. S. Johnson, R. M. Gordon, K. H. Coale, and
W. O. Smith, 2000: Trace metal concentrations in the Ross
Sea and their relationship with nutrients and phytoplankton
growth. Deep-Sea Res. II, 47, 3159–3179.
Gill, A. E., 1973: Circulation and bottom water production in the
Weddell Sea. Deep-Sea Res., 20, 111–140.
Hansen, D. V., and P.-M. Poulain, 1996: Quality control and in-
terpolations of WOCE–TOGA drifter data. J. Atmos. Oce-
anic Technol., 13, 900–909.
Heywood, K. J., R. A. Locarnini, R. D. Frew, P. F. Dennis, and
B. A. King, 1998: Transport and water masses of the Antarc-
tic Slope Front system in the eastern Weddell Sea. Ocean, Ice,
and Atmosphere: Interactions at the Antarctic Continental
Margin, S. S. Jacobs and R. F. Weiss, Eds., Antarctic Re-
search Series, Vol. 75, Amer. Geophys. Union, 203–214.
——, A. C. Naveira Garabato, D. P. Stevens, and R. D. Muench,
2004: On the fate of the Antarctic Slope Front and the origin
of the Weddell Front. J. Geophys. Res., 109, C06021,
doi:10.1029/2003JC002053.
Heywood, R. B., and J. Priddle, 1987: Retention of phytoplankton
by an eddy. Cont. Shelf Res., 7, 937–955.
Hofmann, E. E., J. M. Klinck, R. A. Locarnini, B. A. Fach, and
E. J. Murphy, 1998: Krill transport in the Scotia Sea and en-
virons. Antarct. Sci., 10, 406–415.
Holloway, G., 1992: Representing topographic stress for large-
scale ocean models. J. Phys. Oceanogr., 22, 1033–1046.
Holm-Hansen, O., and Coauthors, 2004a: Factors influencing the
distribution, biomass, and productivity of phytoplankton in
the Scotia Sea and adjoining waters. Deep-Sea Res. II, 51,
1333–1350.
——, and Coauthors, 2004b: Temporal and spatial distribution of
chlorophyll-a in surface waters of the Scotia Sea as deter-
mined by both shipboard measurements and satellite data.
Deep-Sea Res. II, 51, 1323–1331.
Jacobs, S. S., 1986: The Antarctic Slope Front. Antarct. J. U.S., 21,
123–124.
——, 1991: On the nature of the Antarctic Slope Front. Mar.
Chem., 35, 9–24.
Korb, R. E., M. J. Whitehouse, and P. Ward, 2004: SeaWIFS in
the southern ocean: Spatial and temporal variability in phy-
toplankton biomass around South Georgia. Deep-Sea Res. II,
51, 99–116.
Kottmeier, C., J. Olf, W. Frieden, and R. Rainer, 1992: Wind
forcing and ice motion in the Weddell Sea. J. Geophys. Res.,
97, 20 373–20 383.
LaCasce, J. H., 2000: Floats and f/h. J. Mar. Res., 58, 61–95.
——, and K. Speer, 1999: Lagrangian statistics in unforced baro-
tropic flows. J. Mar. Res., 57, 245–275.
Martin, J. H., R. M. Gordon, and S. E. Fitzwater, 1990: Iron in
Antarctic waters. Nature, 345, 156–158.
McWilliams, J. C., and J. M. Restrepo, 1999: The wave-driven
ocean circulation. J. Phys. Oceanogr., 29, 2523–2540.
Muench, R. D., and A. L. Gordon, 1995: Circulation and transport
of water along the western Weddell Sea margin. J. Geophys.
Res., 100, 18 503–18 515.
Murphy, E. J., S. E. Thorpe, J. L. Watkins, and R. Hewitt, 2004:
Modeling the transport pathways in the Scotia Sea: Spatial
and environmental connections generating the seasonal dis-
tribution of krill. Deep-Sea Res. II, 51, 1435–1456.
Niiler, P. P., A. S. Sybrandy, K. Bi, P.-M. Poulain, and D. Bitter-
man, 1995: Measurements of the water-following capability
of holey-sock and TRISTAR drifters. Deep-Sea Res. I, 42,
1951–1964.
——, N. A. Maximenko, and J. C. McWilliams, 2003: Dynamically
balanced absolute sea level of the global ocean derived from
near-surface velocity observations. Geophys. Res. Lett., 30,
2164, doi:10.1029/2003GL018628.
Olson, D. B., V. H. Kourafalou, W. E. Johns, G. Samuels, and M.
Veneziani, 2007: Aegean surface circulation from a satellite-
tracked drifter array. J. Phys. Oceanogr., 37, 1898–1917.
Orsi, A. H., W. D. Nowlin, and T. Whitworth, 1993: On the cir-
culation and stratification of the Weddell Gyre. Deep-Sea
Res., 40, 169–203.
——, G. C. Johnson, and J. L. Bullister, 1999: Circulation, mixing
and production of Antarctic Bottom Water. Prog. Oceanogr.,
43, 55–109.
Padman, L., H. A. Ricker, R. Coleman, S. Howard, and S. Ero-
feeva, 2002: A new tidal model from the Antarctic ice shelves
and seas. Ann. Glaciol., 34, 247–254.
JANUARY 2009 T H O M P S O N E T A L . 25
Patterson, S. L., and H. A. Sievers, 1980: The Weddell–Scotia
Confluence. J. Phys. Oceanogr., 10, 1584–1610.
Pauly, T., S. Nicol, I. Higginbottom, G. Hosie, and J. Kitchener,
2000: Distribution and abundance of Antarctic krill (Euphau-
sia superba) off East Antarctica (80–1508E) during the Aus-
tral summer of 1995/1996. Deep-Sea Res. II, 47, 2465–2488.
Richardson, P. L., 1982: Gulf Stream paths measured with free-
drifting buoys. J. Phys. Oceanogr., 11, 999–1010.
Rio, M.-H., and F. Hernandez, 2003: High-frequency response of
wind-driven currents measured by drifting buoys and altim-
etry over the world ocean. J. Geophys. Res., 108, 3283,
doi:10.1029/2002JC001655.
Robertson, R., 2005: Baroclinic and barotropic tides in the Wed-
dell Sea. Antarct. Sci., 17, 461–474.
Schodlok, M. P., H. H. Hellmer, G. Rohardt, and E. Fahrbach,
2006: Weddell Sea iceberg drift: Five years of observations. J.
Geophys. Res., 111, C06018, doi:10.1029/2004JC002661.
Smith, W. H. F., and D. T. Sandwell, 1997: Global sea floor to-
pography from satellite altimetry and ship depth soundings.
Science, 277, 1956–1962.
Taylor, G. I., 1921: Diffusion by continuous movements. Proc.
London Math. Soc., 20, 196–212.
——, 1953: Dispersion of soluble matter in solvent flowing slowly
through a tube. Proc. London Math. Soc., A219, 186–203.
Thompson, A. F., 2007: ADELIE cruise report: RRS James Clark
Ross cruise 158, 9 February–20 February 2007. UEA Cruise
Rep. Series 9, University of East Anglia, Norwich, United
Kingdom, 86 pp.
——, and K. J. Heywood, 2008: Frontal structure and transport in
the northwestern Weddell Sea. Deep-Sea Res. I, 55, 1229–
1251.
Vallis, G. K., and M. E. Maltrud, 1993: Generation of mean flows
and jets on a beta plane and over topography. J. Phys. Ocean-
ogr., 23, 1346–1362.
Wadhams, P., C. Sear, D. Crane, M. Rowe, S. Morrison, and D.
Limbert, 1989: Basin-scale ice motion and deformation in the
Weddell Sea during winter. Ann. Glaciol., 12, 178–186.
Watkins, J. L., A. W. A. Murray, and H. I. Daly, 1999: Variation
in the distribution of Antarctic krill Euphausia superba
around South Georgia. Mar. Ecol. Prog. Ser., 188, 149–160.
——, R. Hewitt, M. Naganobu, and V. Sushin, 2004: The
CCAMLR 2000 survey: A multinational, multi-ship biologi-
cal oceanography survey of the Atlantic sector of the South-
ern Ocean. Deep-Sea Res. II, 51, 1205–1214.
Whitworth, T., A. H. Orsi, S.-J. Kim, W. D. Nowlin, and R. A.
Locarnini, 1998: Water masses and mixing near the Antarctic
Slope Front. Ocean, Ice, and Atmosphere: Interactions at the
Antarctic Continental Margin, S. S. Jacobs and R. F. Weiss,
Eds., Antarctic Research Series, Vol. 75, Amer. Geophys.
Union, 1–27.
Zhou, M., P. P. Niiler, and J.-H. Hu, 2002: Surface currents in the
Bransfield and Gerlache Straits, Antarctica. Deep-Sea Res. I,
49, 267–280.
——, ——, Y. Zhu, and R. D. Dorland, 2006: The western bound-
ary current in the Bransfield Strait, Antarctica. Deep-Sea Res.
I, 53, 1244–1252.
26 J O U R N A L O F P H Y S I C A L O C E A N O G R A P H Y VOLUME 39