Embed Size (px)
Citation preview
World vitiviniculture situation
Surface area
Grape− Global grape production
Wine− Production− Consumption− Trade
2016 FAO-OIV Focus: Table and Dried Grapes
2
Global area under vines
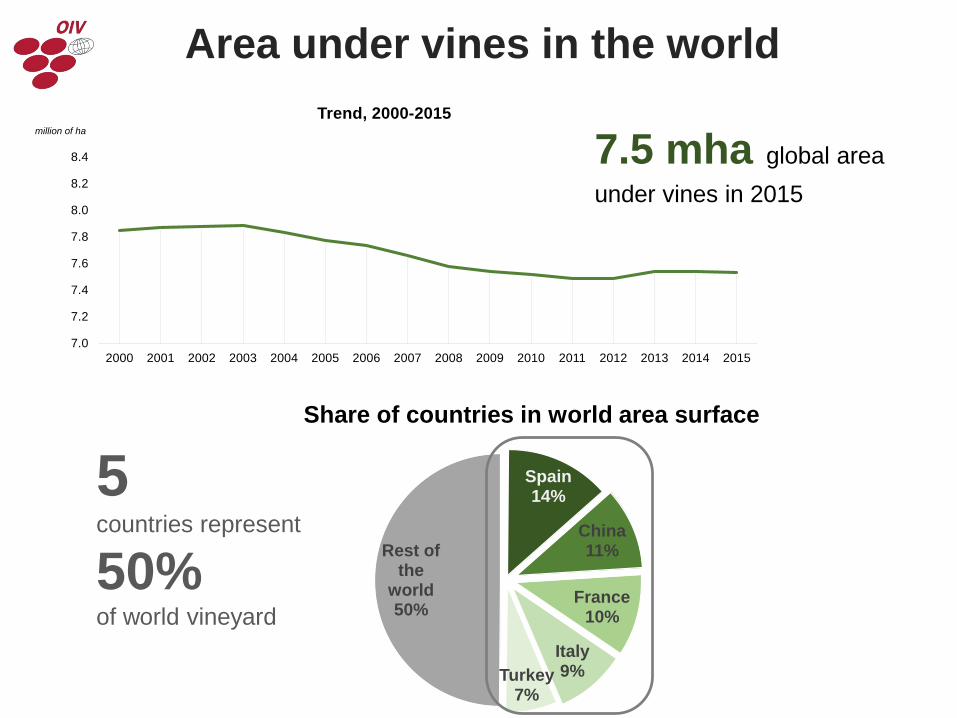
Area under vines in the world
5countries represent
50% of world vineyard
7.0
7.2
7.4
7.6
7.8
8.0
8.2
8.4
2000 2001 2002 2003 2004 2005 2006 2007 2008 2009 2010 2011 2012 2013 2014 2015
million of haTrend, 2000-2015
Share of countries in world area surface
7.5 mha global area under vines in 2015
Spain 14%
China11%
France10%
Italy9%Turkey
7%
Rest of the
world50%
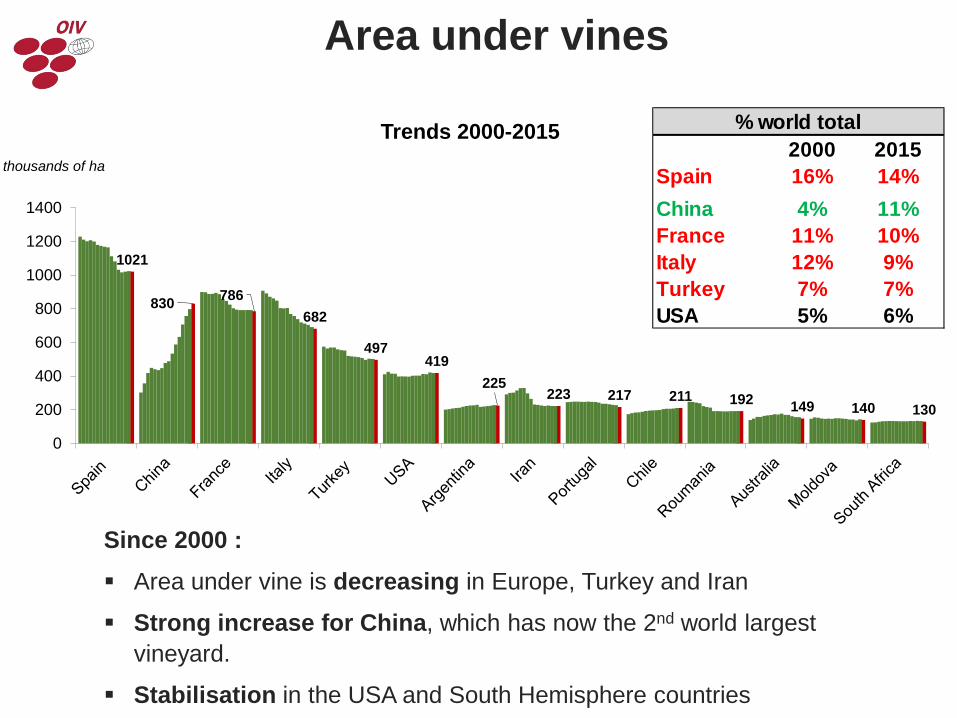
Since 2000 : Area under vine is decreasing in Europe, Turkey and Iran
Strong increase for China, which has now the 2nd world largestvineyard.
Stabilisation in the USA and South Hemisphere countries
Area under vines
2000 2015Spain 16% 14%China 4% 11%France 11% 10%Italy 12% 9%Turkey 7% 7%USA 5% 6%
% world total
1021
830 786682
497419
225223 217 211 192 149 140 130
0
200
400
600
800
1000
1200
1400
thousands of ha
Trends 2000-2015
Grape
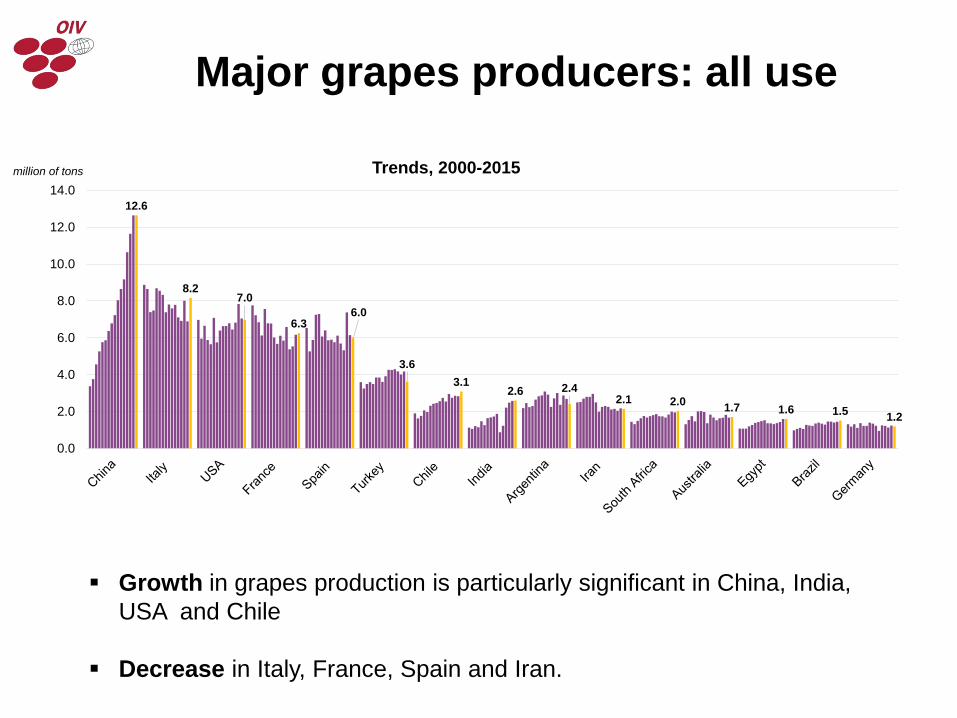
Major grapes producers: all use
Growth in grapes production is particularly significant in China, India, USA and Chile
Decrease in Italy, France, Spain and Iran.
12.6
8.27.0
6.36.0
3.63.1
2.6 2.42.1 2.0 1.7 1.6 1.5 1.2
0.0
2.0
4.0
6.0
8.0
10.0
12.0
14.0million of tons Trends, 2000-2015
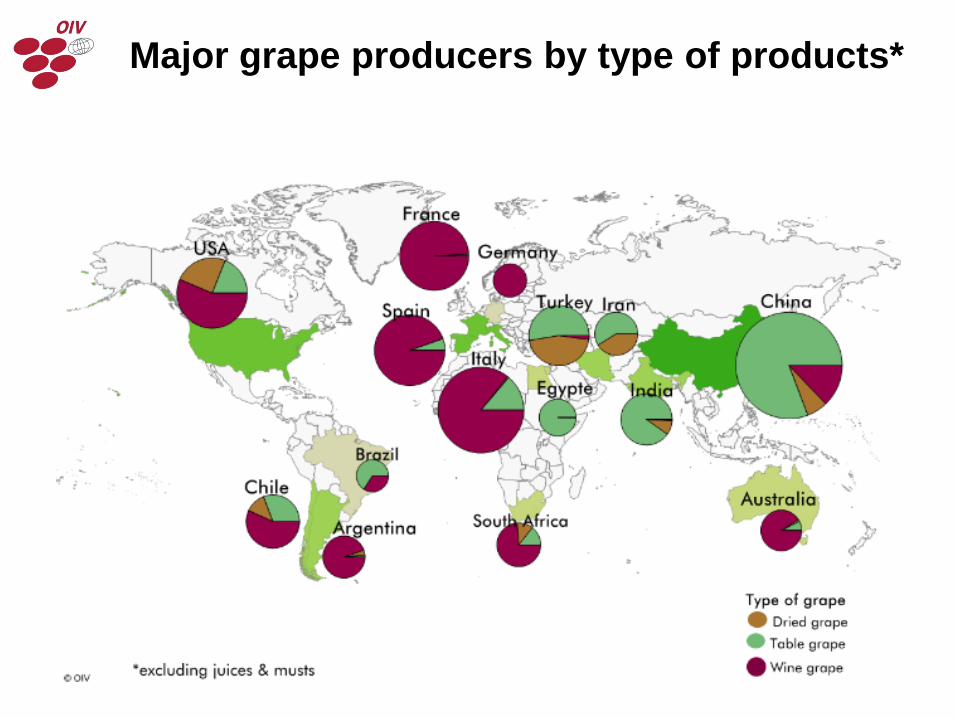
GrapeMajor grape producers by type of products*
Wine production
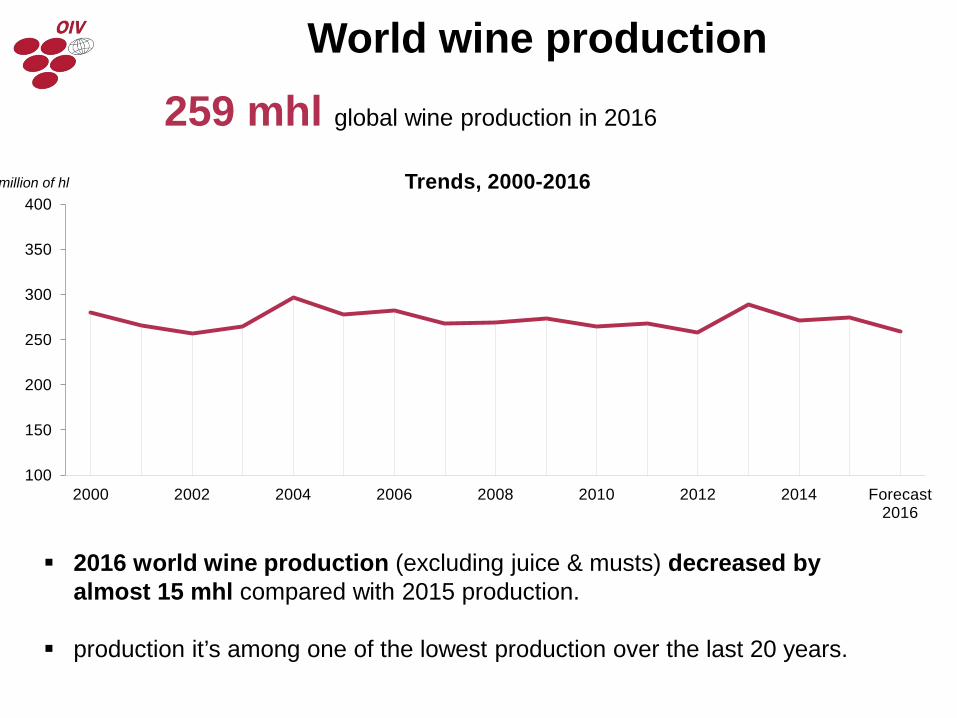
2016 world wine production (excluding juice & musts) decreased by almost 15 mhl compared with 2015 production.
production it’s among one of the lowest production over the last 20 years.
World wine production259 mhl global wine production in 2016
100
150
200
250
300
350
400
2000 2002 2004 2006 2008 2010 2012 2014 Forecast 2016
million of hl Trends, 2000-2016
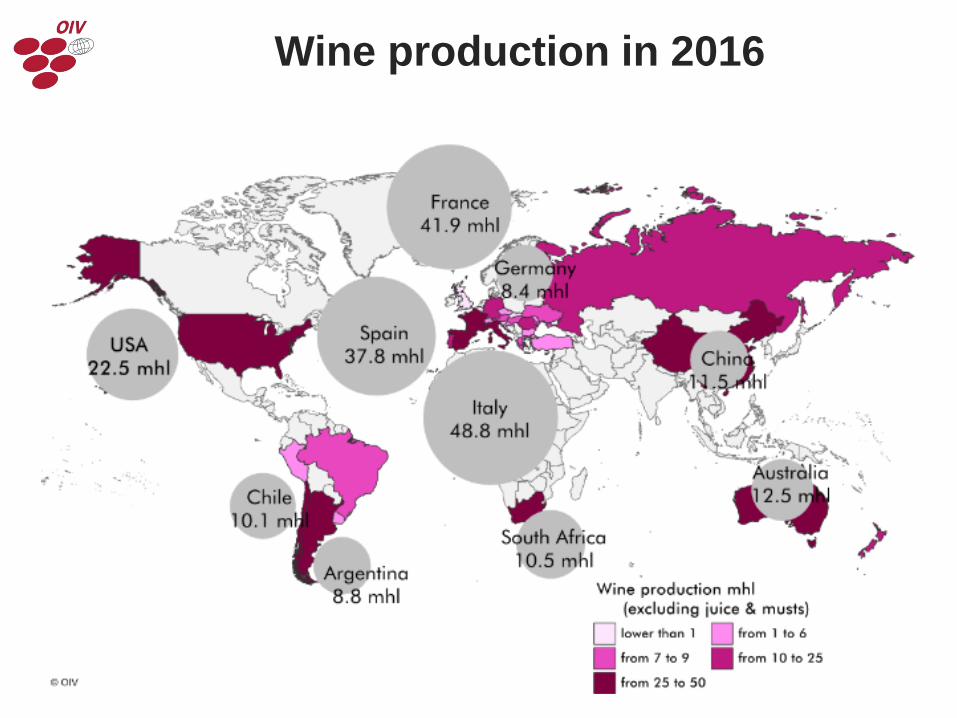
Wine production in 2016
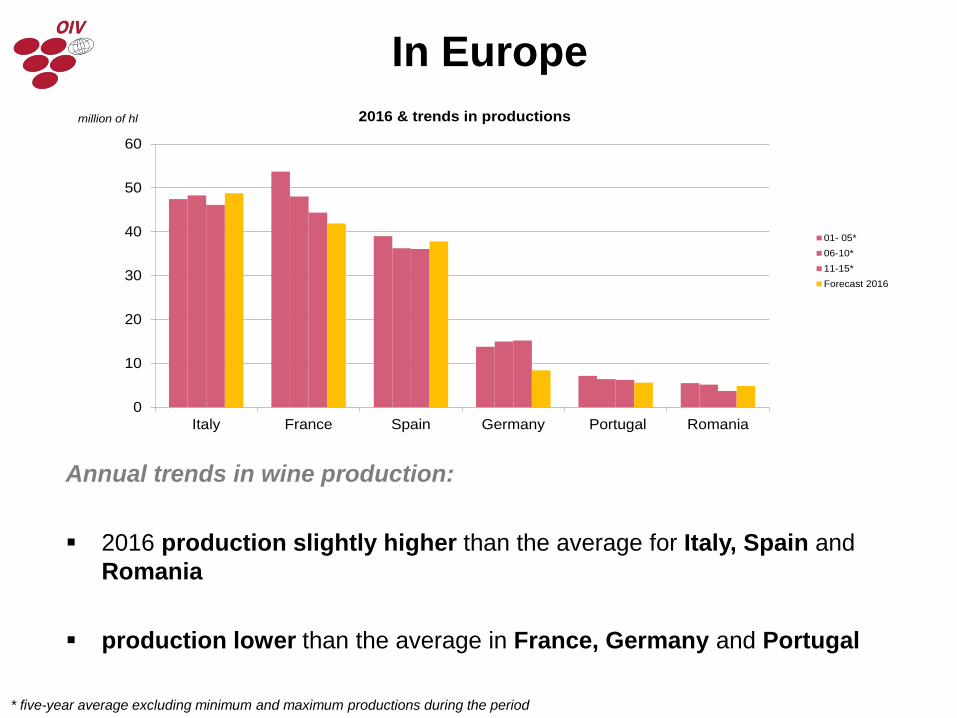
In Europe
* five-year average excluding minimum and maximum productions during the period
0
10
20
30
40
50
60
Italy France Spain Germany Portugal Romania
million of hl 2016 & trends in productions
01- 05*06-10*11-15*Forecast 2016
Annual trends in wine production:
2016 production slightly higher than the average for Italy, Spain and Romania
production lower than the average in France, Germany and Portugal
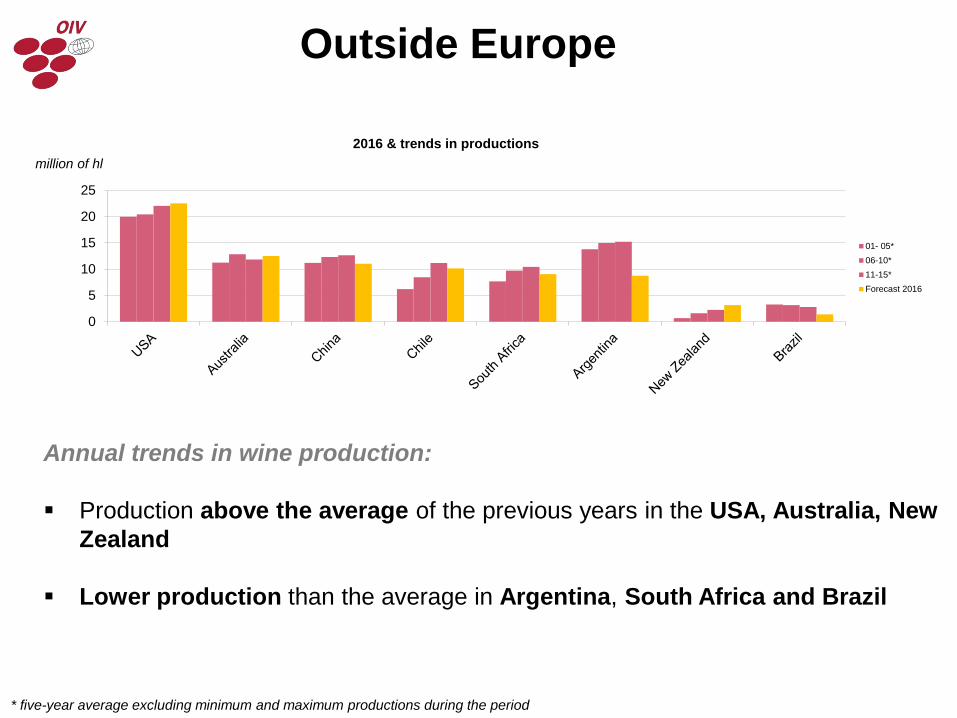
Outside Europe
* five-year average excluding minimum and maximum productions during the period
Annual trends in wine production:
Production above the average of the previous years in the USA, Australia, New Zealand
Lower production than the average in Argentina, South Africa and Brazil
0
5
10
15
20
25
million of hl2016 & trends in productions
01- 05*06-10*11-15*Forecast 2016
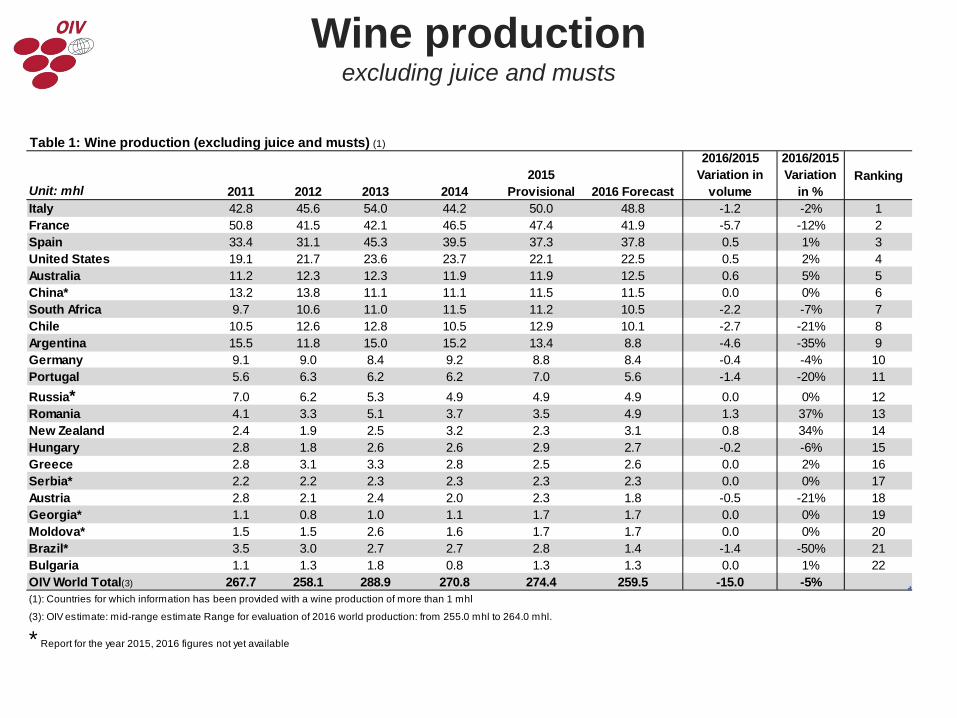
Wine productionexcluding juice and musts
Table 1: Wine production (excluding juice and musts) (1)
Unit: mhl 2011 2012 2013 20142015
Provisional 2016 Forecast
2016/2015 Variation in
volume
2016/2015 Variation
in %Ranking
Italy 42.8 45.6 54.0 44.2 50.0 48.8 -1.2 -2% 1France 50.8 41.5 42.1 46.5 47.4 41.9 -5.7 -12% 2Spain 33.4 31.1 45.3 39.5 37.3 37.8 0.5 1% 3United States 19.1 21.7 23.6 23.7 22.1 22.5 0.5 2% 4Australia 11.2 12.3 12.3 11.9 11.9 12.5 0.6 5% 5China* 13.2 13.8 11.1 11.1 11.5 11.5 0.0 0% 6South Africa 9.7 10.6 11.0 11.5 11.2 10.5 -2.2 -7% 7Chile 10.5 12.6 12.8 10.5 12.9 10.1 -2.7 -21% 8Argentina 15.5 11.8 15.0 15.2 13.4 8.8 -4.6 -35% 9Germany 9.1 9.0 8.4 9.2 8.8 8.4 -0.4 -4% 10Portugal 5.6 6.3 6.2 6.2 7.0 5.6 -1.4 -20% 11Russia* 7.0 6.2 5.3 4.9 4.9 4.9 0.0 0% 12Romania 4.1 3.3 5.1 3.7 3.5 4.9 1.3 37% 13New Zealand 2.4 1.9 2.5 3.2 2.3 3.1 0.8 34% 14Hungary 2.8 1.8 2.6 2.6 2.9 2.7 -0.2 -6% 15Greece 2.8 3.1 3.3 2.8 2.5 2.6 0.0 2% 16Serbia* 2.2 2.2 2.3 2.3 2.3 2.3 0.0 0% 17Austria 2.8 2.1 2.4 2.0 2.3 1.8 -0.5 -21% 18Georgia* 1.1 0.8 1.0 1.1 1.7 1.7 0.0 0% 19Moldova* 1.5 1.5 2.6 1.6 1.7 1.7 0.0 0% 20Brazil* 3.5 3.0 2.7 2.7 2.8 1.4 -1.4 -50% 21Bulgaria 1.1 1.3 1.8 0.8 1.3 1.3 0.0 1% 22OIV World Total(3) 267.7 258.1 288.9 270.8 274.4 259.5 -15.0 -5%(1): Countries for which information has been provided with a wine production of more than 1 mhl
(3): OIV estimate: mid-range estimate Range for evaluation of 2016 world production: from 255.0 mhl to 264.0 mhl.
* Report for the year 2015, 2016 figures not yet available
Wine Consumption
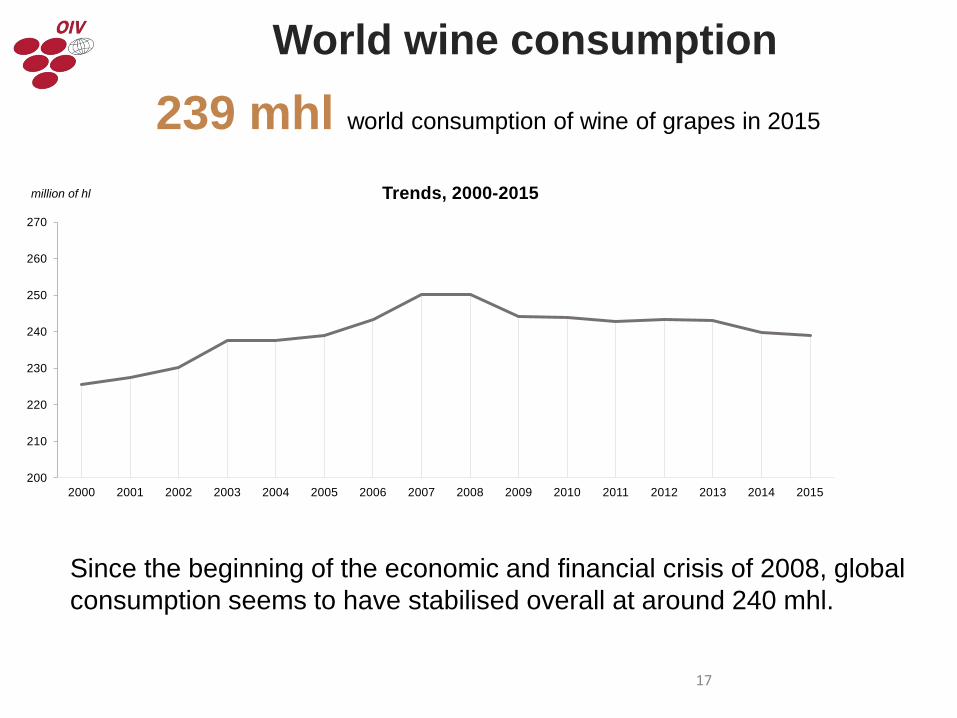
Since the beginning of the economic and financial crisis of 2008, global consumption seems to have stabilised overall at around 240 mhl.
World wine consumption
17
200
210
220
230
240
250
260
270
2000 2001 2002 2003 2004 2005 2006 2007 2008 2009 2010 2011 2012 2013 2014 2015
million of hl Trends, 2000-2015
239 mhl world consumption of wine of grapes in 2015
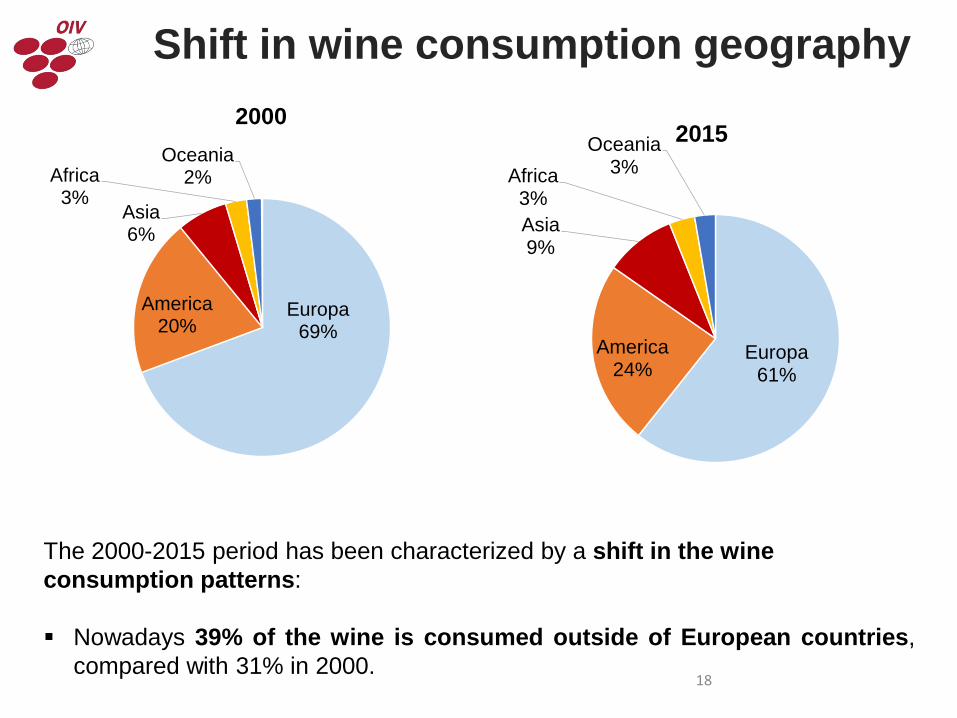
The 2000-2015 period has been characterized by a shift in the wine consumption patterns:
Nowadays 39% of the wine is consumed outside of European countries,compared with 31% in 2000.
Shift in wine consumption geography
18
Europa69%
America20%
Asia6%
Africa3%
Oceania2%
2000
Europa61%
America24%
Asia9%
Africa3%
Oceania3%
2015
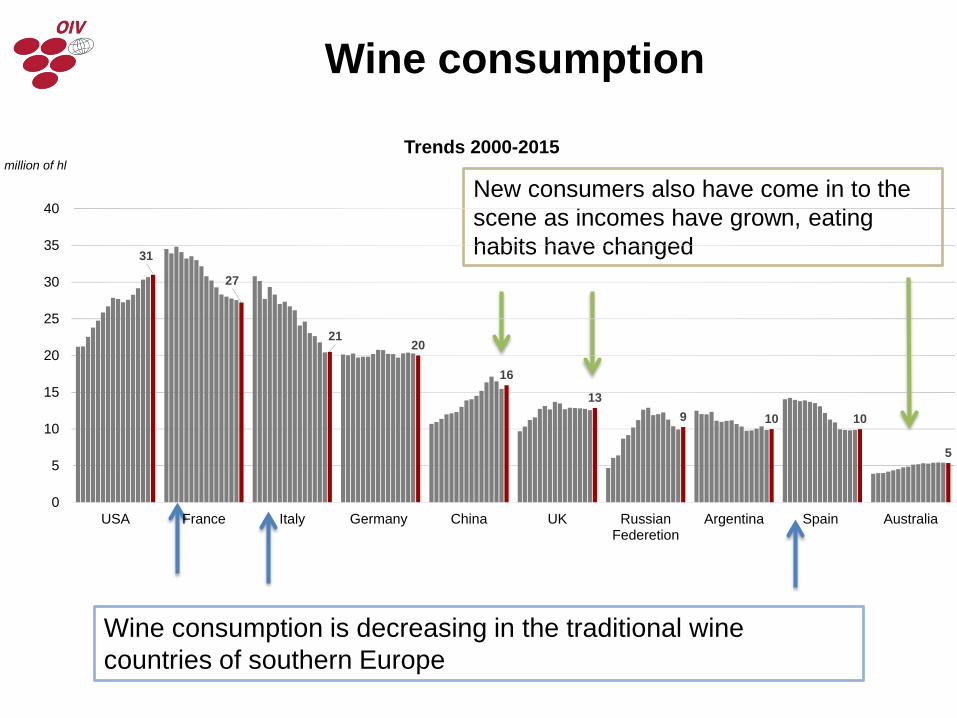
Wine consumption is decreasing in the traditional wine countries of southern Europe
New consumers also have come in to the scene as incomes have grown, eating habits have changed
Wine consumption
31
27
2120
16
139 10 10
5
0
5
10
15
20
25
30
35
40
USA France Italy Germany China UK RussianFederetion
Argentina Spain Australia
million of hlTrends 2000-2015
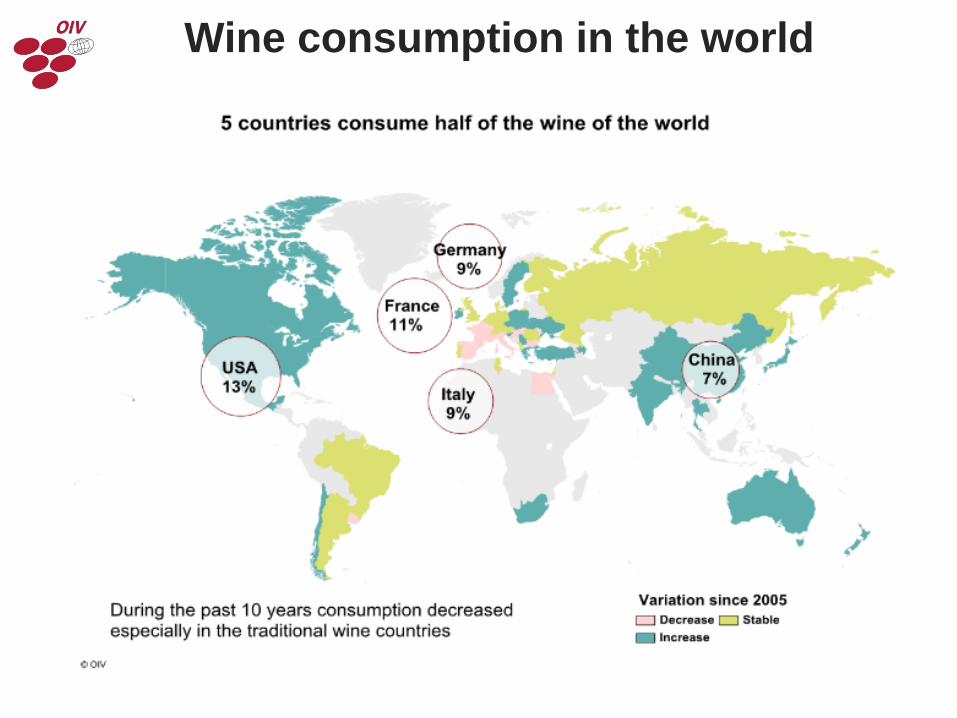
Wine consumption in the world
Wine trade
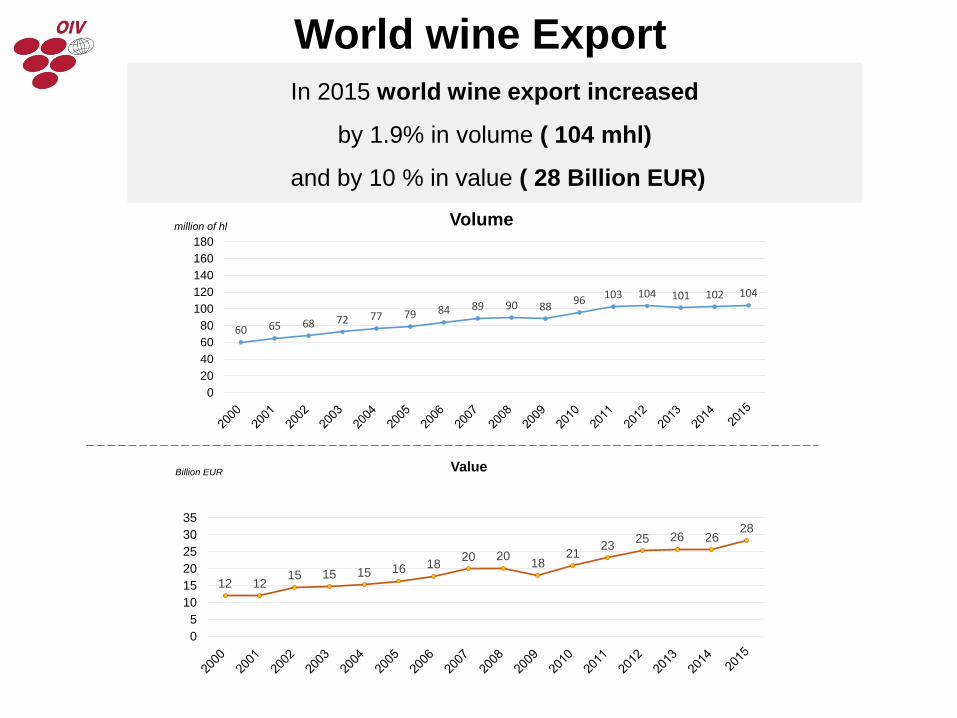
In 2015 world wine export increased
by 1.9% in volume ( 104 mhl)
and by 10 % in value ( 28 Billion EUR)
World wine Export
60 65 68 72 77 79 84 89 90 88 96 103 104 101 102 104
020406080
100120140160180
million of hl Volume
12 1215 15 15 16 18 20 20 18
21 23 25 26 2628
05
101520253035
Billion EUR Value
0
10
20
30
40
50
60
2000 2001 2002 2003 2004 2005 2006 2007 2008 2009 2010 2011 2012 2013 2014 2015
million of hl
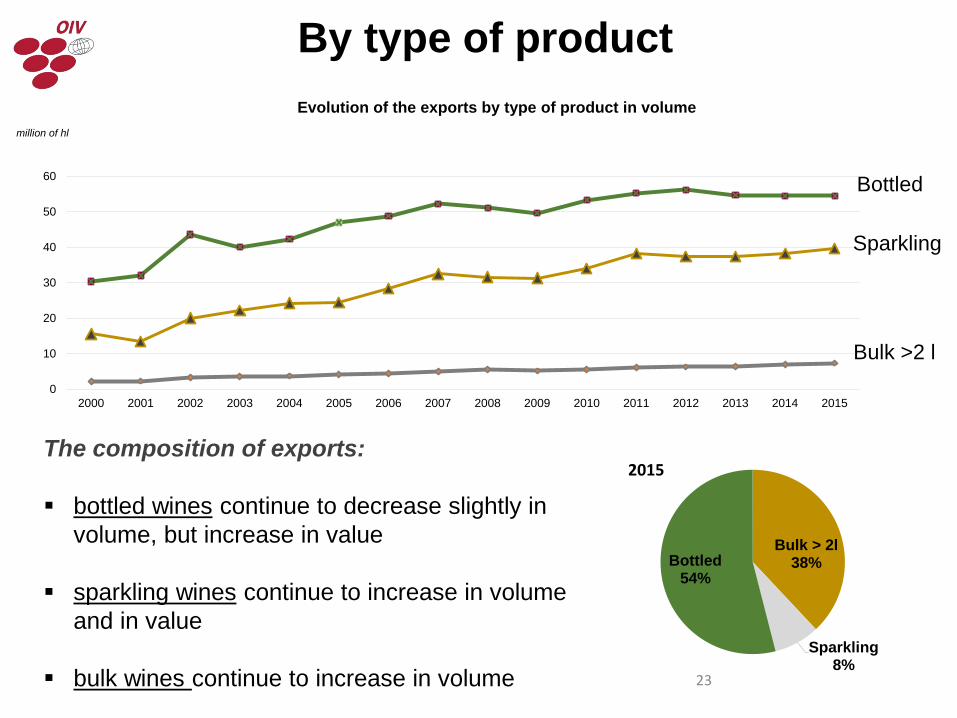
Evolution of the exports by type of product in volume
The composition of exports:
bottled wines continue to decrease slightly in volume, but increase in value
sparkling wines continue to increase in volume and in value
bulk wines continue to increase in volume
By type of product
23
Bulk > 2l38%
Sparkling8%
Bottled 54%
2015
Bottled
Sparkling
Bulk >2 l
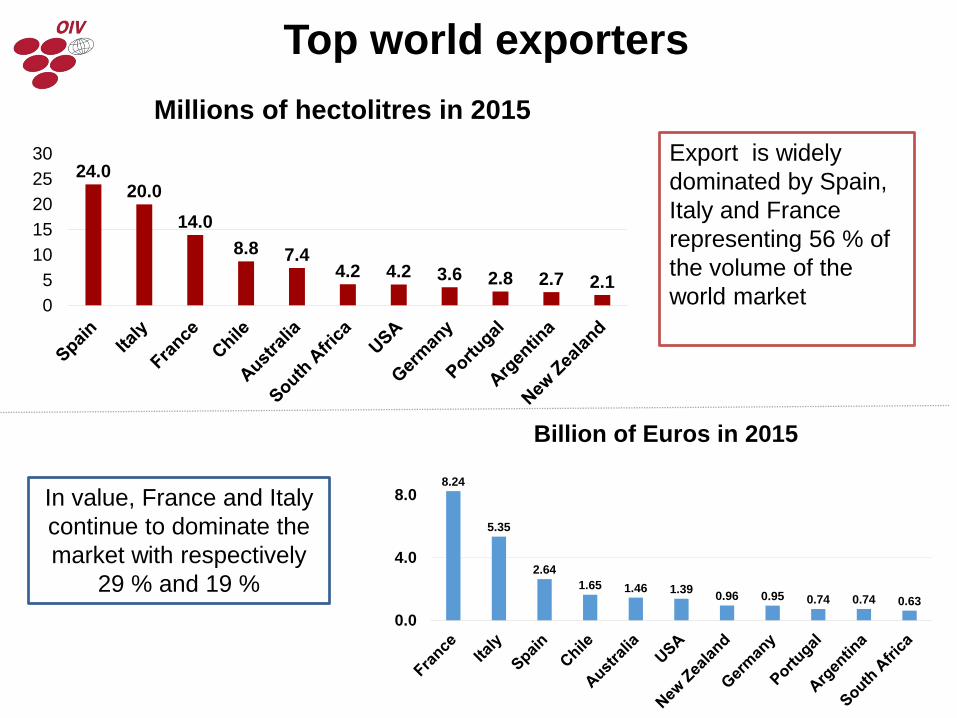
Top world exporters
Export is widely dominated by Spain, Italy and France representing 56 % of the volume of the world market
In value, France and Italy continue to dominate the market with respectively
29 % and 19 %
24.020.0
14.08.8 7.4
4.2 4.2 3.6 2.8 2.7 2.105
1015202530
Millions of hectolitres in 2015
8.24
5.35
2.641.65 1.46 1.39 0.96 0.95 0.74 0.74 0.63
0.0
4.0
8.0
Billion of Euros in 2015
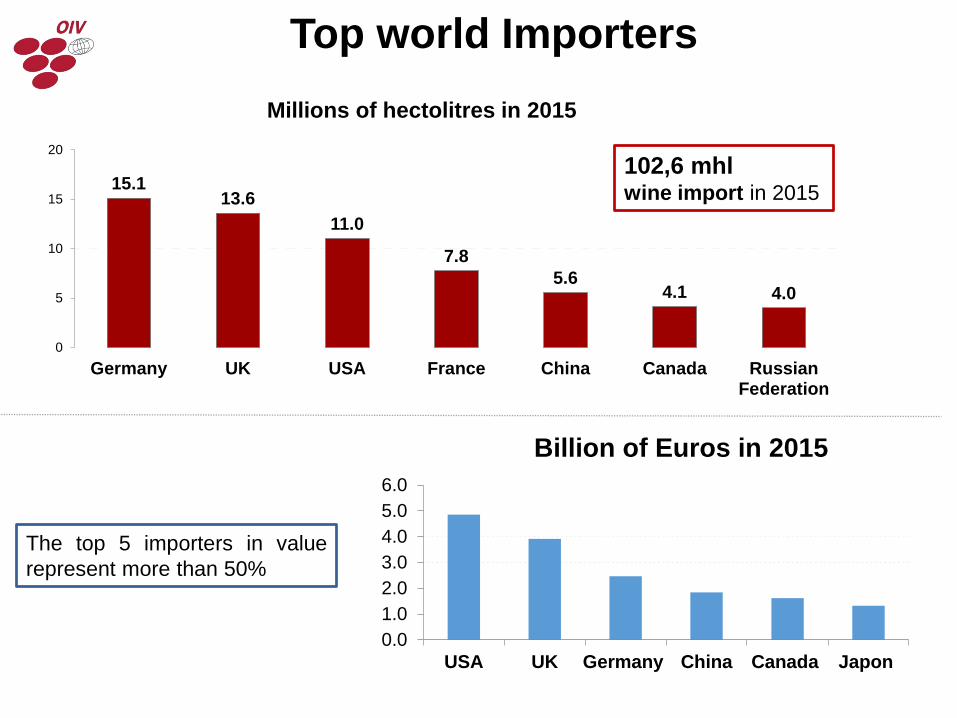
102,6 mhlwine import in 2015
Top world Importers
The top 5 importers in valuerepresent more than 50%
15.113.6
11.0
7.85.6
4.1 4.0
0
5
10
15
20
Germany UK USA France China Canada RussianFederation
Millions of hectolitres in 2015
0.01.02.03.04.05.06.0
USA UK Germany China Canada Japon
Billion of Euros in 2015
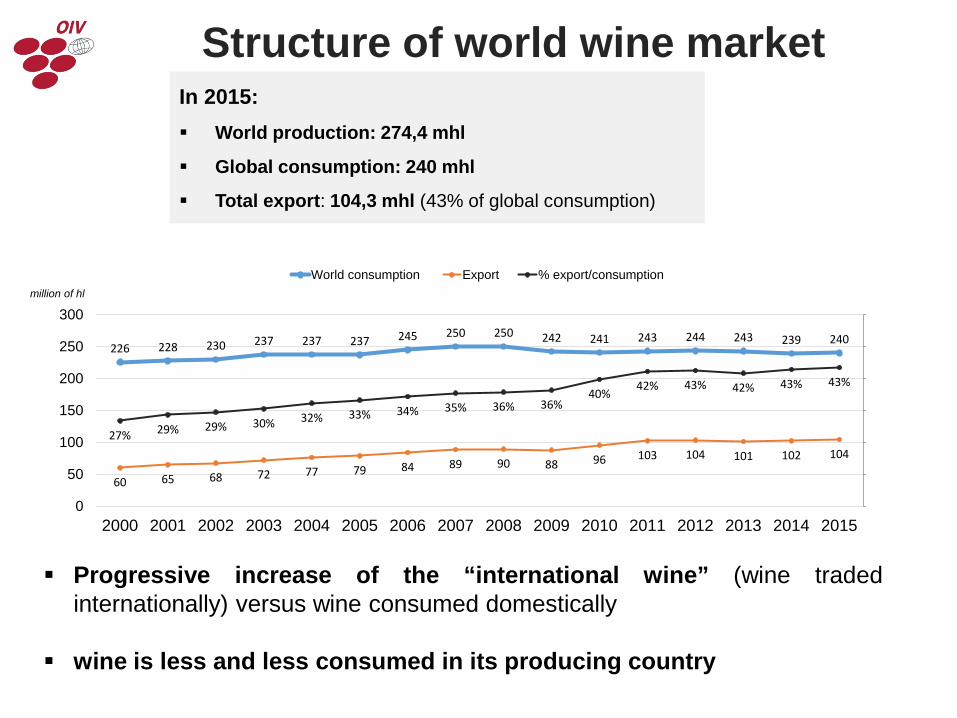
Structure of world wine market
Progressive increase of the “international wine” (wine tradedinternationally) versus wine consumed domestically
wine is less and less consumed in its producing country
In 2015: World production: 274,4 mhl
Global consumption: 240 mhl
Total export: 104,3 mhl (43% of global consumption)
226 228 230 237 237 237 245 250 250 242 241 243 244 243 239 240
60 65 68 72 77 79 84 89 90 88 96 103 104 101 102 10427% 29% 29% 30% 32% 33% 34% 35% 36% 36%
40% 42% 43% 42% 43% 43%
0
50
100
150
200
250
300
2000 2001 2002 2003 2004 2005 2006 2007 2008 2009 2010 2011 2012 2013 2014 2015
million of hl
World consumption Export % export/consumption
FAO-OIV Focus 2016:
Table and Dried Grapes
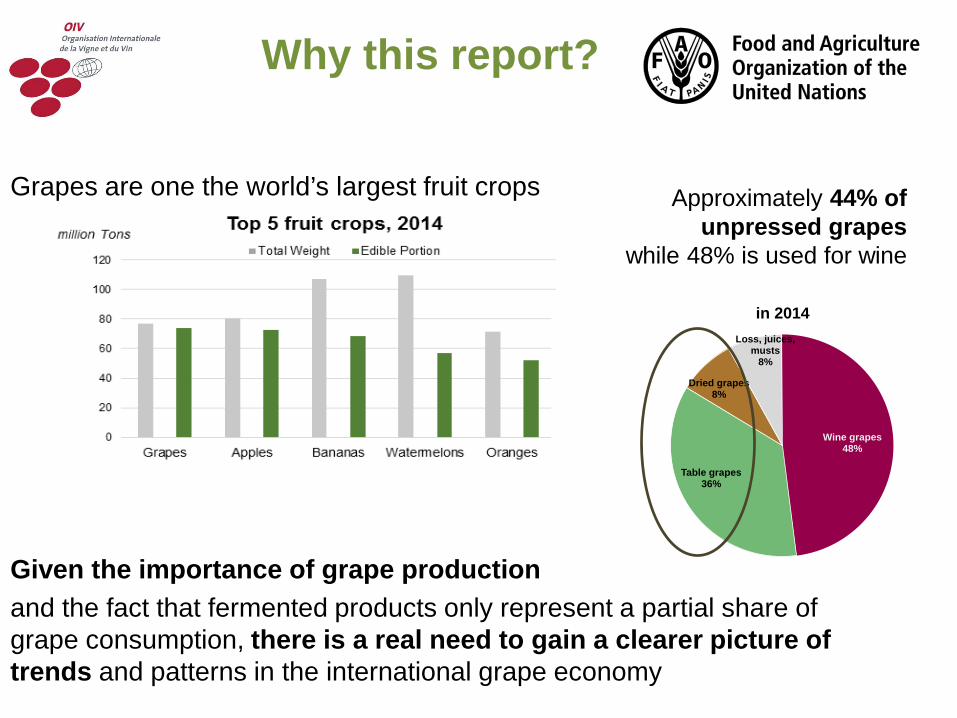
Why this report?
Grapes are one the world’s largest fruit crops
Given the importance of grape production and the fact that fermented products only represent a partial share of grape consumption, there is a real need to gain a clearer picture of trends and patterns in the international grape economy
Wine grapes48%
Table grapes36%
Dried grapes8%
Loss, juices, musts
8%
in 2014
Approximately 44% of unpressed grapes
while 48% is used for wine
FAO with FAOSTAT, the world's largest database of food and agricultural information, with more than a million statistics covering five decades and 245 countries and territories
OIV the reference organization on vines, wine, wine-based beverages, table grapes, raisins and other vine-based products
Content :
Section 1 general considerations of the basics of viticulture, food use of grape crops, and its nutritional aspects.
Section 2 provides an analyses of the table and dried grape market. It presents the latest data on production, consumption and imports.
10
15
20
25
30
2000 2002 2004 2006 2008 2010 2012 2014
million of tons
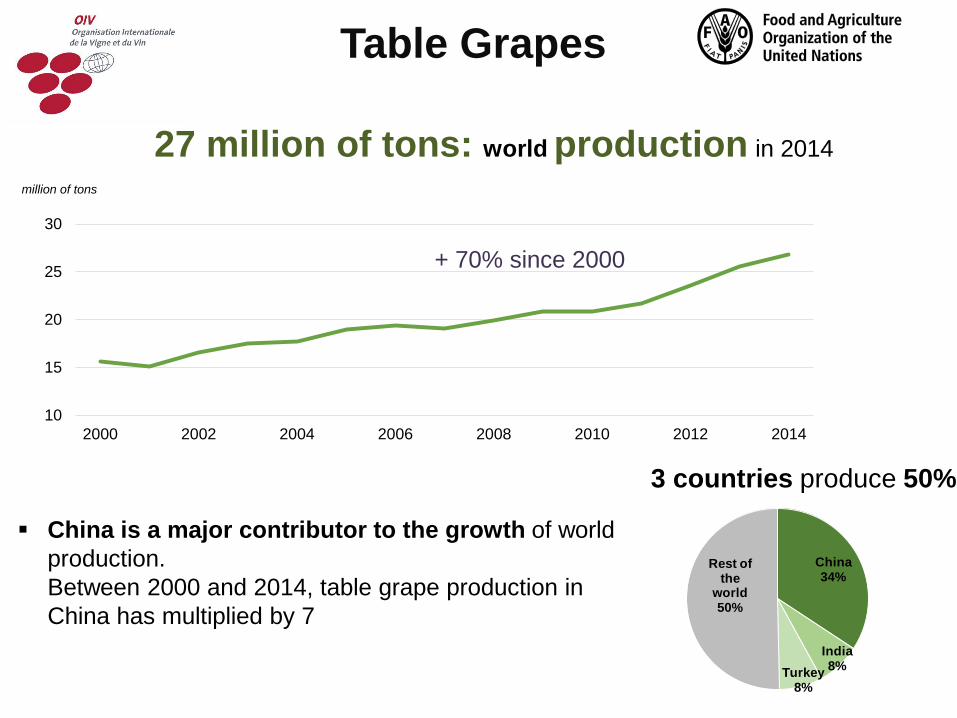
27 million of tons: world production in 2014
Table Grapes
+ 70% since 2000
China is a major contributor to the growth of world production. Between 2000 and 2014, table grape production in China has multiplied by 7
China34%
India8%Turkey
8%
Rest of the
world 50%
3 countries produce 50%
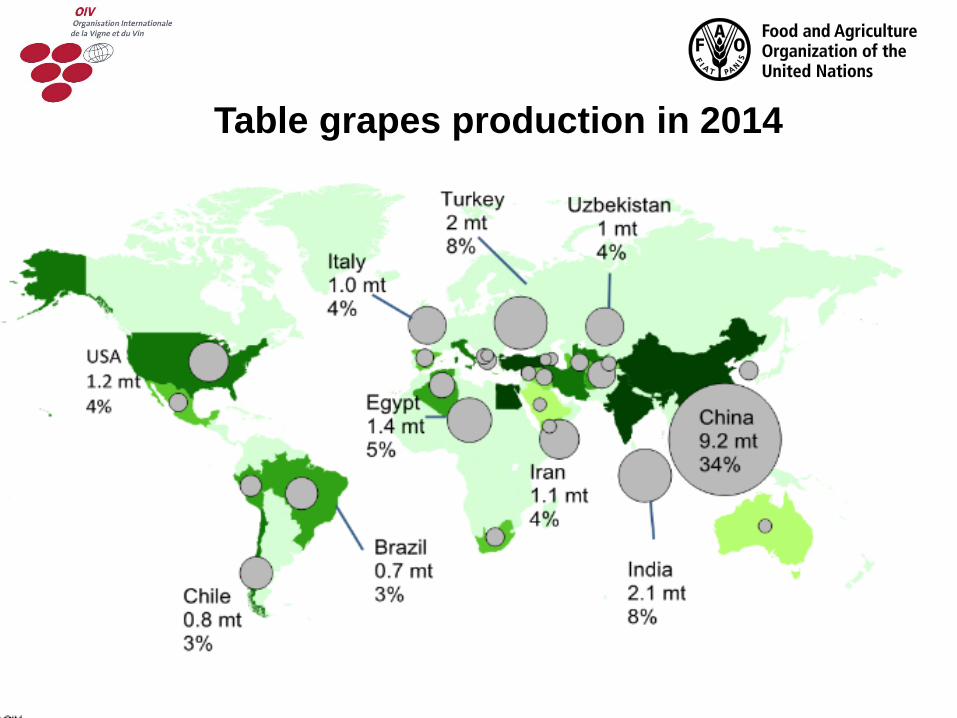
Table grapes production in 2014
10
16
22
28
2000 2002 2004 2006 2008 2010 2012 2014
million of tons
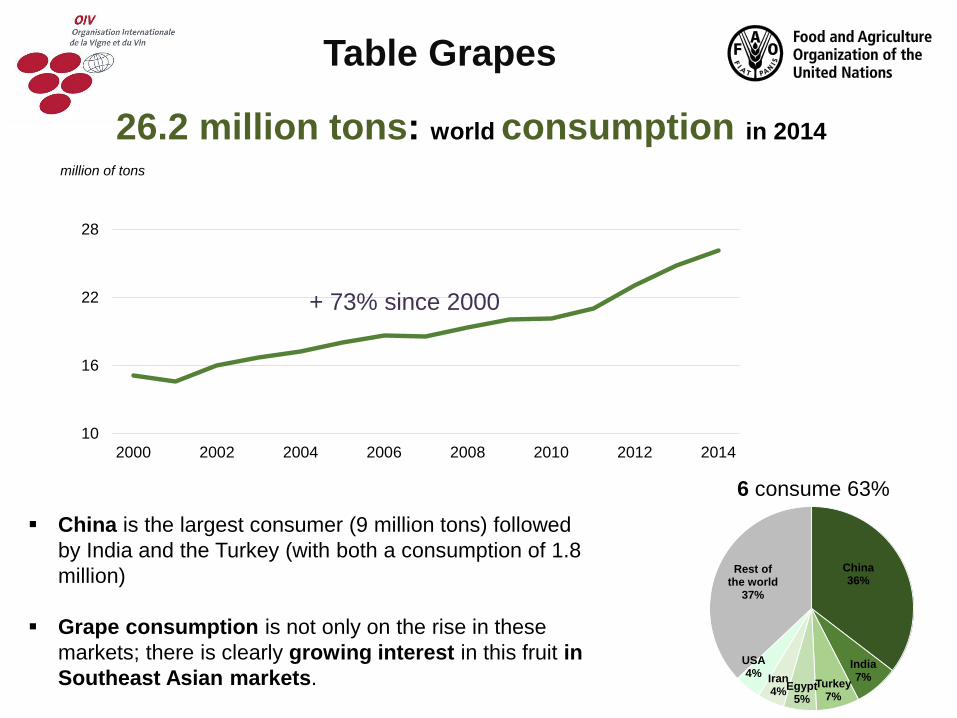
China is the largest consumer (9 million tons) followed by India and the Turkey (with both a consumption of 1.8 million)
Grape consumption is not only on the rise in these markets; there is clearly growing interest in this fruit in Southeast Asian markets.
Table Grapes
+ 73% since 2000
China36%
India7%Turkey
7%Egypt
5%
Iran4%
USA4%
Rest of the world
37%
26.2 million tons: world consumption in 2014
6 consume 63%
2
3
4
5
2000 2002 2004 2006 2008 2010 2012 2014
millions of tons
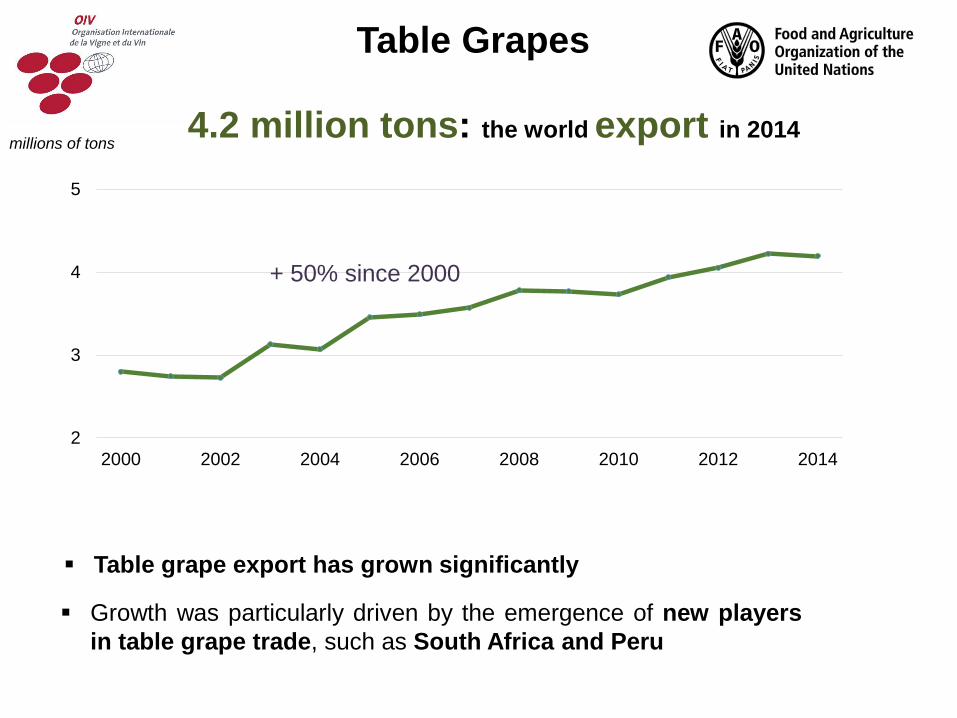
Table grape export has grown significantly
+ 50% since 2000
Growth was particularly driven by the emergence of new playersin table grape trade, such as South Africa and Peru
Table Grapes
4.2 million tons: the world export in 2014
Turkey28%
USA21%Iran
13%
China12%
Chile6%
Rest of the world
21%
0.8
1.2
1.6
2.0
2000 2002 2004 2006 2008 2010 2012 2014
million of tons
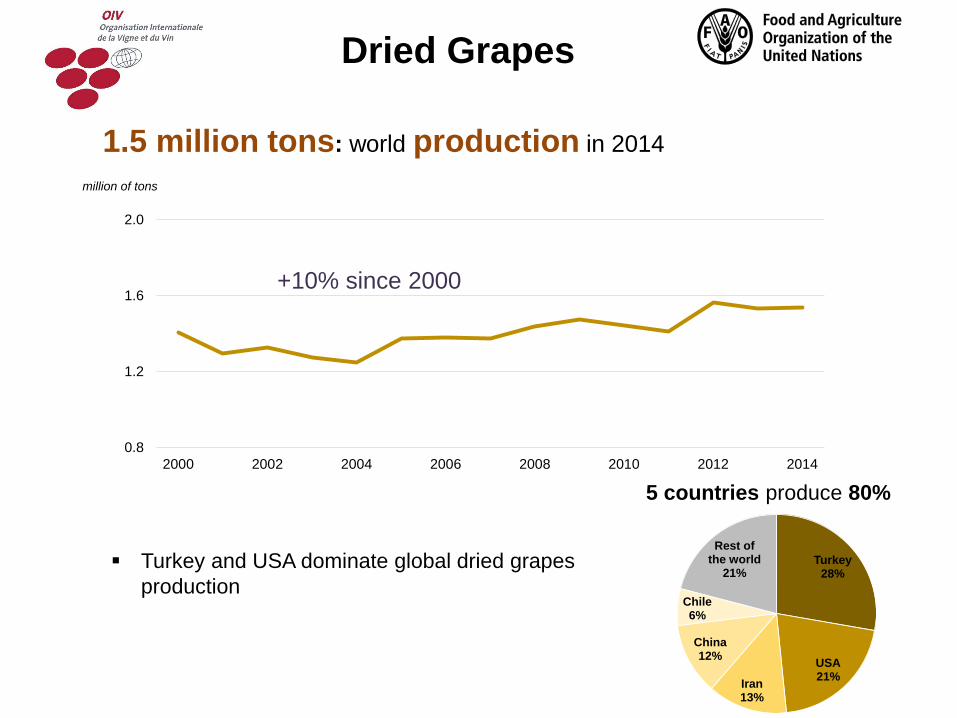
1.5 million tons: world production in 2014
Dried Grapes
Turkey and USA dominate global dried grapes production
+10% since 2000
5 countries produce 80%
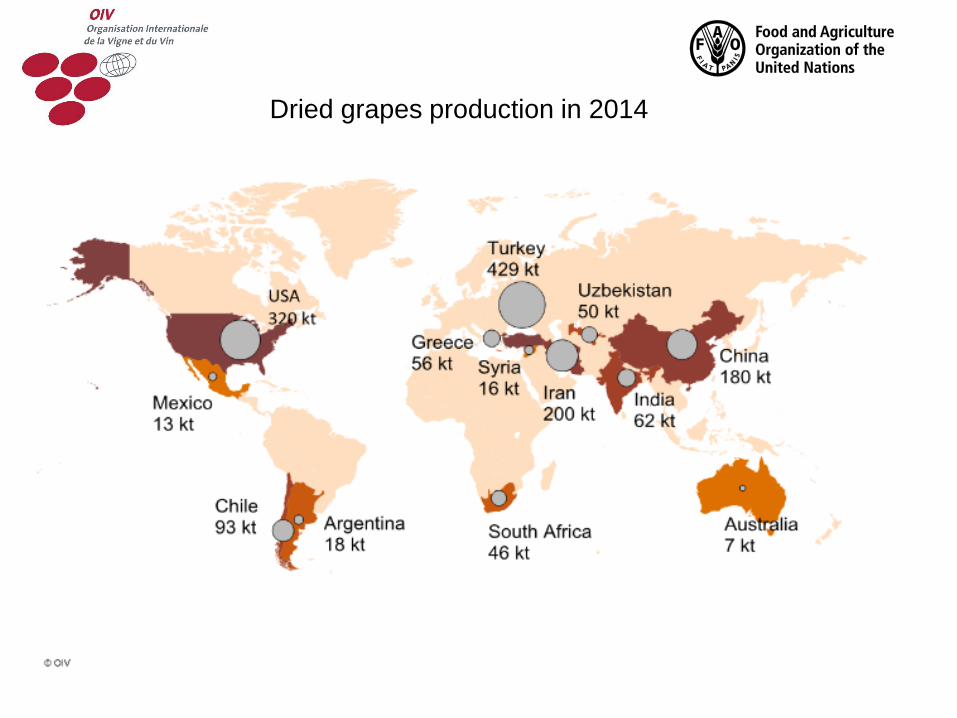
Dried grapes production in 2014
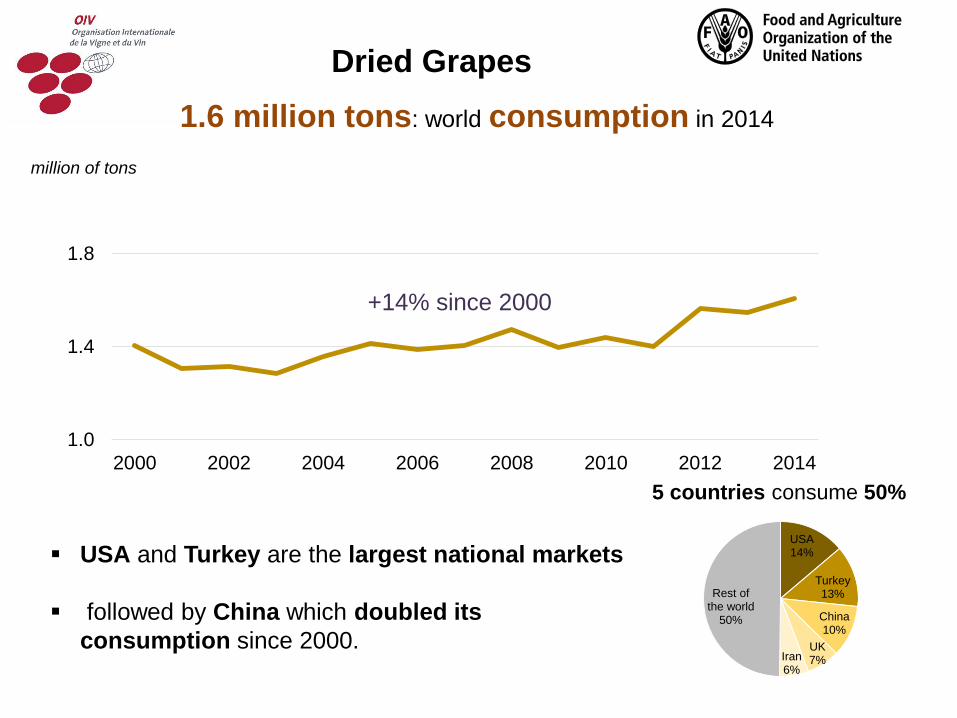
1.0
1.4
1.8
2000 2002 2004 2006 2008 2010 2012 2014
million of tons
USA and Turkey are the largest national markets
followed by China which doubled its consumption since 2000.
Dried Grapes
+14% since 2000
5 countries consume 50%
1.6 million tons: world consumption in 2014
USA14%
Turkey13%
China10%
UK7%Iran
6%
Rest of the world
50%
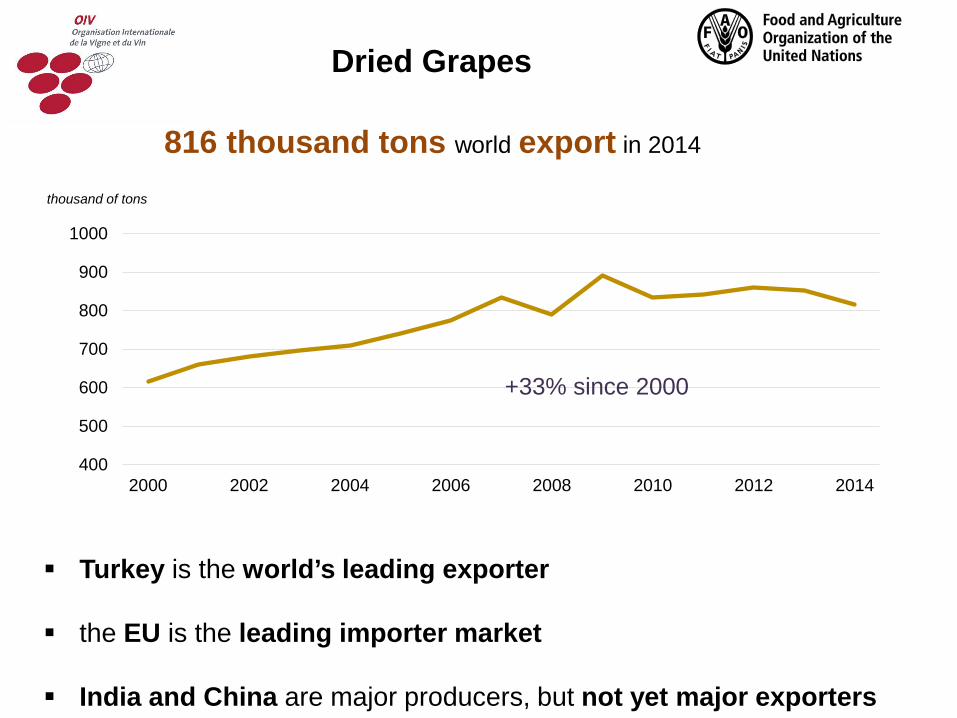
400
500
600
700
800
900
1000
2000 2002 2004 2006 2008 2010 2012 2014
thousand of tons
816 thousand tons world export in 2014
Turkey is the world’s leading exporter
the EU is the leading importer market
India and China are major producers, but not yet major exporters
Dried Grapes
+33% since 2000
Future actions:
How to improve the data collection of this segment of the sector?
The statistical data currently available on the quantities of grape juice produced and on intermediate unfermented products do not enable us to analyse these segments of the sector in further details
Thank you for your attention
Vielen Dank für Ihre Aufmerksamkeit
Grazie per la Loro attenzione
Gracias por su atención
Merci de votre attention
Obrigado