Embed Size (px)
Citation preview
Surat Municipal Corporation
Vector Borne Diseases Control Department Surat Municipal corporation
GENERAL INFORMATION
Surat city is situated in the southern part of Gujarat state. It lies between 21.112° North
latitude & 2.814° East longitudes. It is situated on the bank of river Tapi. The city has flat coastal
land. It is divided in to seven zones (Central, West, South, South-East, South-West, North & East,).
It is one of the most dynamic cities of India with one of the fastest growth rate due to
immigration from various parts of Gujarat and other states of India. Surat is one of the cleanest
cities of India and is also known by several other names like "THE SILK CITY", "THE DIAMOND
CITY", "THE GREEN CITY", etc. It has a most vibrant present and an equally varied heritage of the
past. It is the city where the British first land in India. The Dutch and the Portuguese also
established their business centers in Surat, the remnants of which are still preserved in the modern
day Surat. In past this was a glorious port with ships of more than 84 countries anchored in its
harbour at any time.
Climate of the city is moderate with maximum temperature 44.5° C & minimum of 9.9° C
the average rainfall is 60 inches. The total area of the city is 326.515 sq. k.m. & The total
population according to 2011 one census is 44,66,826. The density of population per sq. km. is
13,663. The 40% of the population of Surat city lives in slums. The total number of census houses
is 13,86,245.
Oldest Municipality : 1852 AD.
Area : 326.52 Sq.Km.
Population : 44,66,826(2011)
Climate : Humid
Rain : 60'' (Average)
Industries : Jari, Textile, Silk, Diamond and Plastic.
Density : 138 persons/ha
Slum pockets : 334
Number of Zone : 07
No. of Unit : 34
UHC : 44
Ward (Election) : 29
Ward (Health) : 87
Houses : 13,86,245
Population : Above 57 lacs (Year 2016)
Municipal Councillors : 116
Committee : 20
METEOROLOGICAL DATA
Temperature with seasonal variations: Maximum – 45° C Minimum - 11° C Average - 25°– 35° C
Rainfall : Average - 60" Humidity: Average 60 ° & above
SOCIOECONOMIC CONDITION
Literacy : Male - 91 % Female - 83 %
Economic conditions based on some criteria:
Social Economic condition: Good - 75 % Poor - 25 %
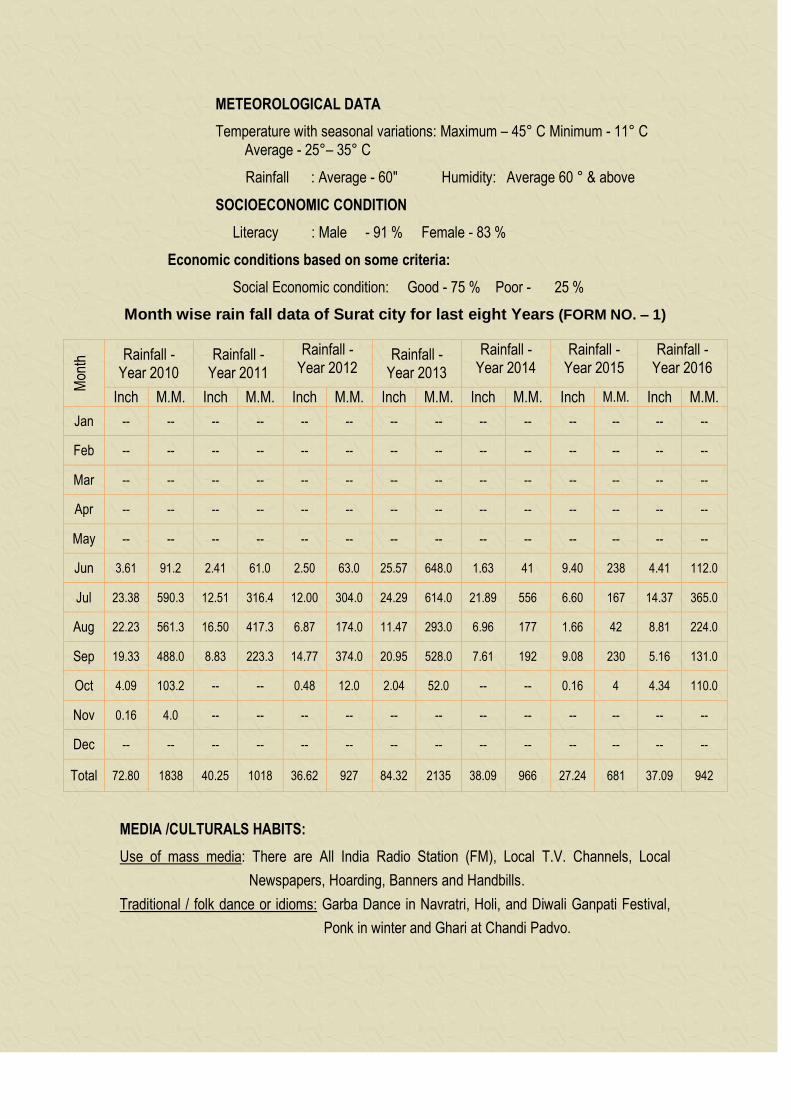
Month wise rain fall data of Surat city for last eight Years (FORM NO. – 1)
MEDIA /CULTURALS HABITS:
Use of mass media: There are All India Radio Station (FM), Local T.V. Channels, Local
Newspapers, Hoarding, Banners and Handbills.
Traditional / folk dance or idioms: Garba Dance in Navratri, Holi, and Diwali Ganpati Festival,
Ponk in winter and Ghari at Chandi Padvo.
Mon
th Rainfall -
Year 2010 Rainfall -
Year 2011
Rainfall - Year 2012
Rainfall - Year 2013
Rainfall - Year 2014
Rainfall - Year 2015
Rainfall - Year 2016
Inch M.M. Inch M.M. Inch M.M. Inch M.M. Inch M.M. Inch M.M. Inch M.M.
Jan -- -- -- -- -- -- -- -- -- -- -- -- -- --
Feb -- -- -- -- -- -- -- -- -- -- -- -- -- --
Mar -- -- -- -- -- -- -- -- -- -- -- -- -- --
Apr -- -- -- -- -- -- -- -- -- -- -- -- -- --
May -- -- -- -- -- -- -- -- -- -- -- -- -- --
Jun 3.61 91.2 2.41 61.0 2.50 63.0 25.57 648.0 1.63 41 9.40 238 4.41 112.0
Jul 23.38 590.3 12.51 316.4 12.00 304.0 24.29 614.0 21.89 556 6.60 167 14.37 365.0
Aug 22.23 561.3 16.50 417.3 6.87 174.0 11.47 293.0 6.96 177 1.66 42 8.81 224.0
Sep 19.33 488.0 8.83 223.3 14.77 374.0 20.95 528.0 7.61 192 9.08 230 5.16 131.0
Oct 4.09 103.2 -- -- 0.48 12.0 2.04 52.0 -- -- 0.16 4 4.34 110.0
Nov 0.16 4.0 -- -- -- -- -- -- -- -- -- -- -- --
Dec -- -- -- -- -- -- -- -- -- -- -- -- -- --
Total 72.80 1838 40.25 1018 36.62 927 84.32 2135 38.09 966 27.24 681 37.09 942
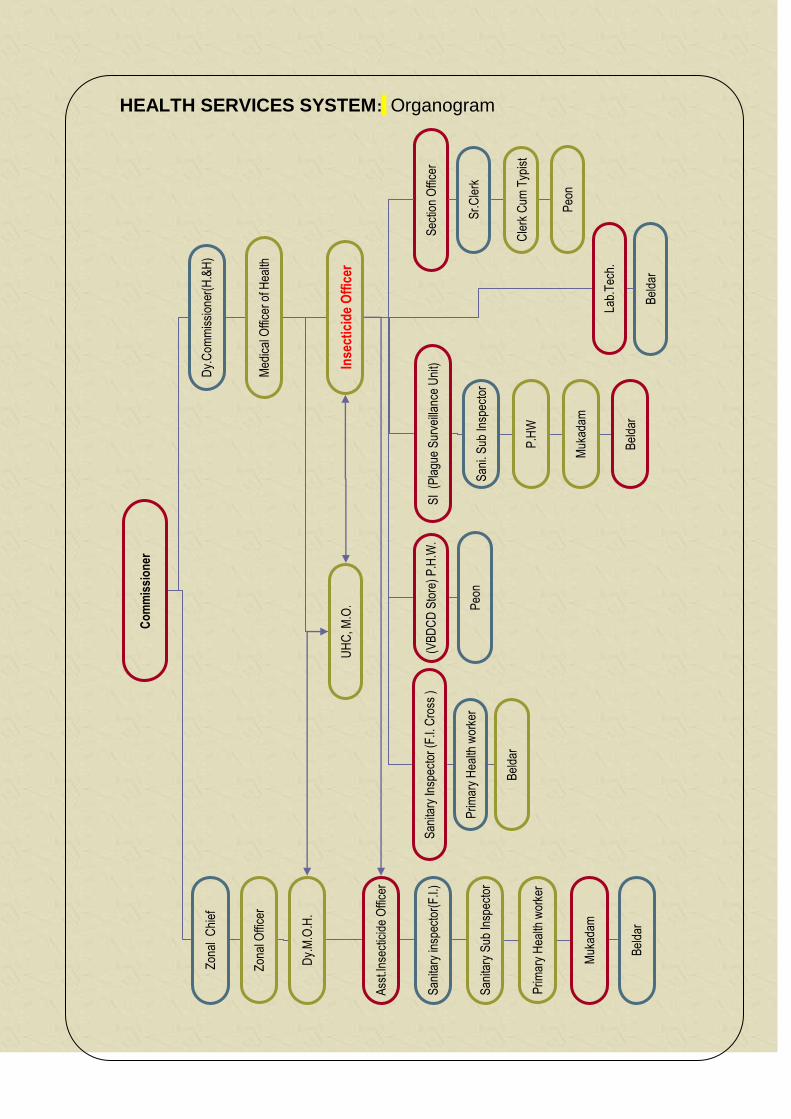
HEALTH SERVICES SYSTEM: Organogram
Section Officer
Sr.Clerk
Clerk Cum Typist
Peon
Bel
dar
Sec
tion
Offi
cer
Co
mm
issi
on
er
Zon
al C
hief
Zon
al O
ffice
r
Dy.
M.O
.H.
Ass
t.Ins
ectic
ide
Offi
cer
San
itary
insp
ecto
r(F
.I.)
San
itary
Sub
Insp
ecto
r
Prim
ary
Hea
lth w
orke
r
Muk
adam
Bel
dar
Dy.
Com
mis
sion
er(H
.&H
)
Med
ical
Offi
cer
of H
ealth
Inse
ctic
ide
Off
icer
SI
(Pla
gue
Sur
veill
ance
Uni
t)
San
itary
Insp
ecto
r (F
.I. C
ross
)
(VB
DC
D S
tore
) P
.H.W
.
Lab.
Tec
h.
San
i. S
ub In
spec
tor
P.H
W
Muk
adam
Bel
dar
Prim
ary
Hea
lth w
orke
r
Bel
dar
Peo
n
Sr.
Cle
rk
Cle
rk C
um T
ypis
t
Peo
n
UH
C, M
.O.
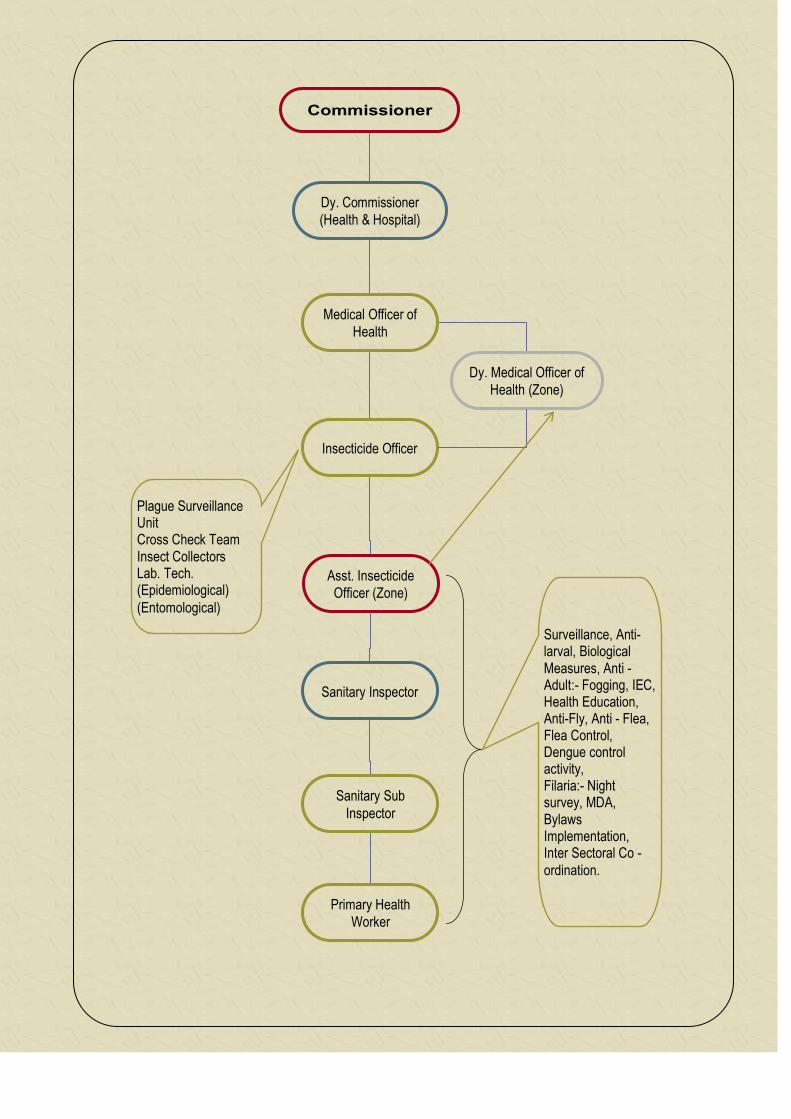
Commissioner
Dy. Commissioner
(Health & Hospital)
Medical Officer of
Health
Insecticide Officer
Asst. Insecticide
Officer (Zone)
Sanitary Inspector
Sanitary Sub
Inspector
Primary Health
Worker
Plague Surveillance Unit Cross Check Team Insect Collectors Lab. Tech. (Epidemiological)
(Entomological)
Dy. Medical Officer of
Health (Zone)
Surveillance, Anti-larval, Biological Measures, Anti - Adult:- Fogging, IEC, Health Education, Anti-Fly, Anti - Flea, Flea Control, Dengue control activity, Filaria:- Night survey, MDA, Bylaws Implementation, Inter Sectoral Co -
ordination.
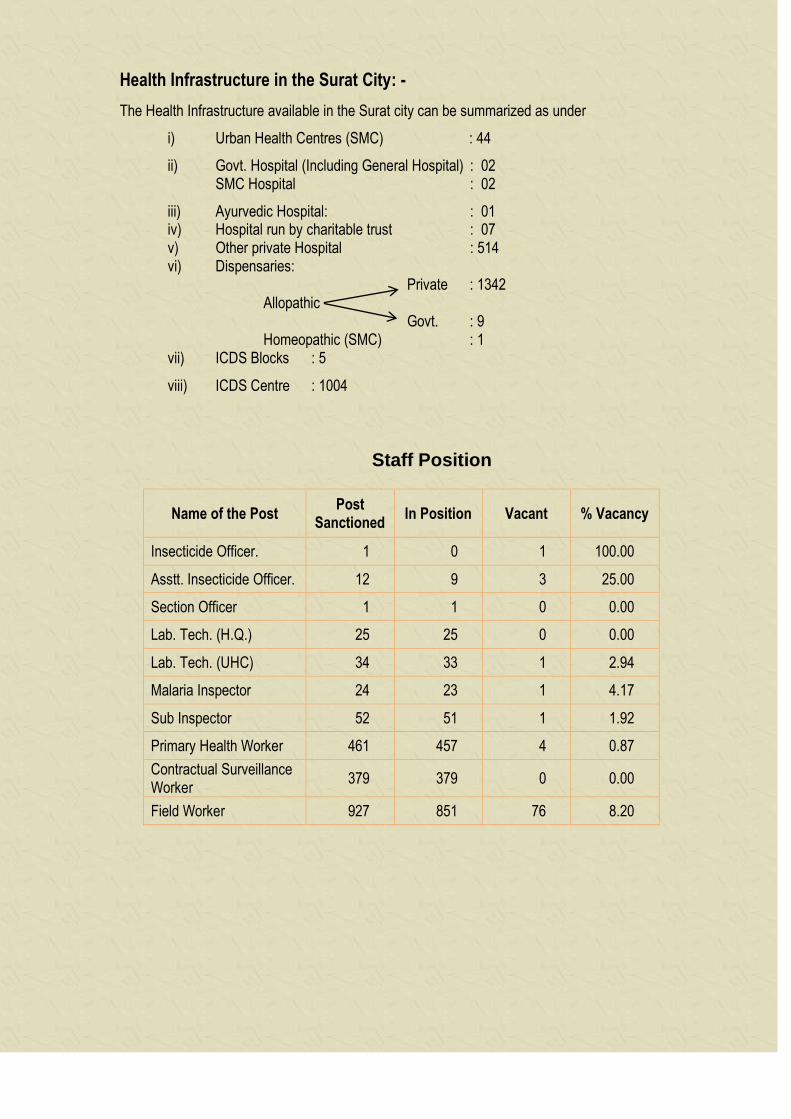
Health Infrastructure in the Surat City: -
The Health Infrastructure available in the Surat city can be summarized as under
i) Urban Health Centres (SMC) : 44
ii) Govt. Hospital (Including General Hospital) : 02 SMC Hospital : 02
iii) Ayurvedic Hospital: : 01 iv) Hospital run by charitable trust : 07 v) Other private Hospital : 514 vi) Dispensaries:
Private : 1342 Allopathic
Govt. : 9 Homeopathic (SMC) : 1
vii) ICDS Blocks : 5
viii) ICDS Centre : 1004
Staff Position
Name of the Post Post
Sanctioned In Position Vacant % Vacancy
Insecticide Officer. 1 0 1 100.00
Asstt. Insecticide Officer. 12 9 3 25.00
Section Officer 1 1 0 0.00
Lab. Tech. (H.Q.) 25 25 0 0.00
Lab. Tech. (UHC) 34 33 1 2.94
Malaria Inspector 24 23 1 4.17
Sub Inspector 52 51 1 1.92
Primary Health Worker 461 457 4 0.87
Contractual Surveillance Worker
379 379 0 0.00
Field Worker 927 851 76 8.20
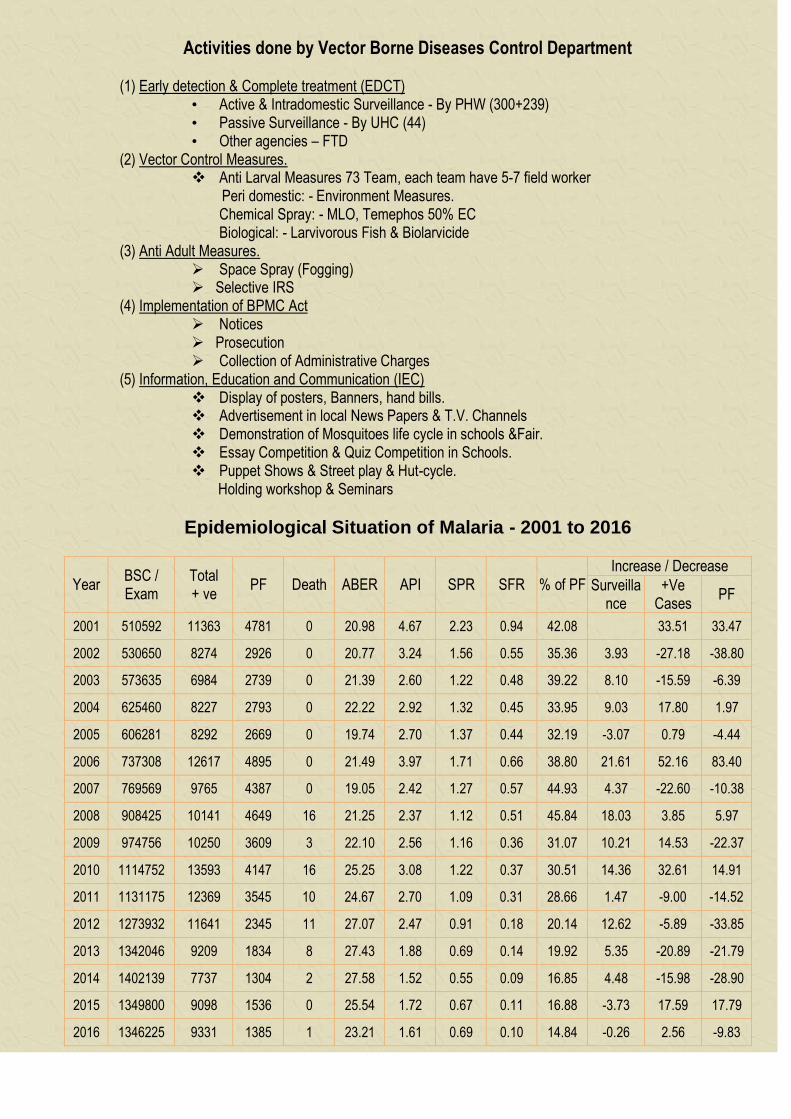
Activities done by Vector Borne Diseases Control Department (1) Early detection & Complete treatment (EDCT)
• Active & Intradomestic Surveillance - By PHW (300+239) • Passive Surveillance - By UHC (44) • Other agencies – FTD
(2) Vector Control Measures. Anti Larval Measures 73 Team, each team have 5-7 field worker
Peri domestic: - Environment Measures. Chemical Spray: - MLO, Temephos 50% EC Biological: - Larvivorous Fish & Biolarvicide (3) Anti Adult Measures.
Space Spray (Fogging) Selective IRS
(4) Implementation of BPMC Act Notices Prosecution Collection of Administrative Charges
(5) Information, Education and Communication (IEC) Display of posters, Banners, hand bills. Advertisement in local News Papers & T.V. Channels Demonstration of Mosquitoes life cycle in schools &Fair. Essay Competition & Quiz Competition in Schools. Puppet Shows & Street play & Hut-cycle.
Holding workshop & Seminars
Epidemiological Situation of Malaria - 2001 to 2016
Year BSC / Exam
Total + ve
PF Death ABER API SPR SFR % of PF Increase / Decrease
Surveillance
+Ve Cases
PF
2001 510592 11363 4781 0 20.98 4.67 2.23 0.94 42.08 33.51 33.47
2002 530650 8274 2926 0 20.77 3.24 1.56 0.55 35.36 3.93 -27.18 -38.80
2003 573635 6984 2739 0 21.39 2.60 1.22 0.48 39.22 8.10 -15.59 -6.39
2004 625460 8227 2793 0 22.22 2.92 1.32 0.45 33.95 9.03 17.80 1.97
2005 606281 8292 2669 0 19.74 2.70 1.37 0.44 32.19 -3.07 0.79 -4.44
2006 737308 12617 4895 0 21.49 3.97 1.71 0.66 38.80 21.61 52.16 83.40
2007 769569 9765 4387 0 19.05 2.42 1.27 0.57 44.93 4.37 -22.60 -10.38
2008 908425 10141 4649 16 21.25 2.37 1.12 0.51 45.84 18.03 3.85 5.97
2009 974756 10250 3609 3 22.10 2.56 1.16 0.36 31.07 10.21 14.53 -22.37
2010 1114752 13593 4147 16 25.25 3.08 1.22 0.37 30.51 14.36 32.61 14.91
2011 1131175 12369 3545 10 24.67 2.70 1.09 0.31 28.66 1.47 -9.00 -14.52
2012 1273932 11641 2345 11 27.07 2.47 0.91 0.18 20.14 12.62 -5.89 -33.85
2013 1342046 9209 1834 8 27.43 1.88 0.69 0.14 19.92 5.35 -20.89 -21.79
2014 1402139 7737 1304 2 27.58 1.52 0.55 0.09 16.85 4.48 -15.98 -28.90
2015 1349800 9098 1536 0 25.54 1.72 0.67 0.11 16.88 -3.73 17.59 17.79
2016 1346225 9331 1385 1 23.21 1.61 0.69 0.10 14.84 -0.26 2.56 -9.83
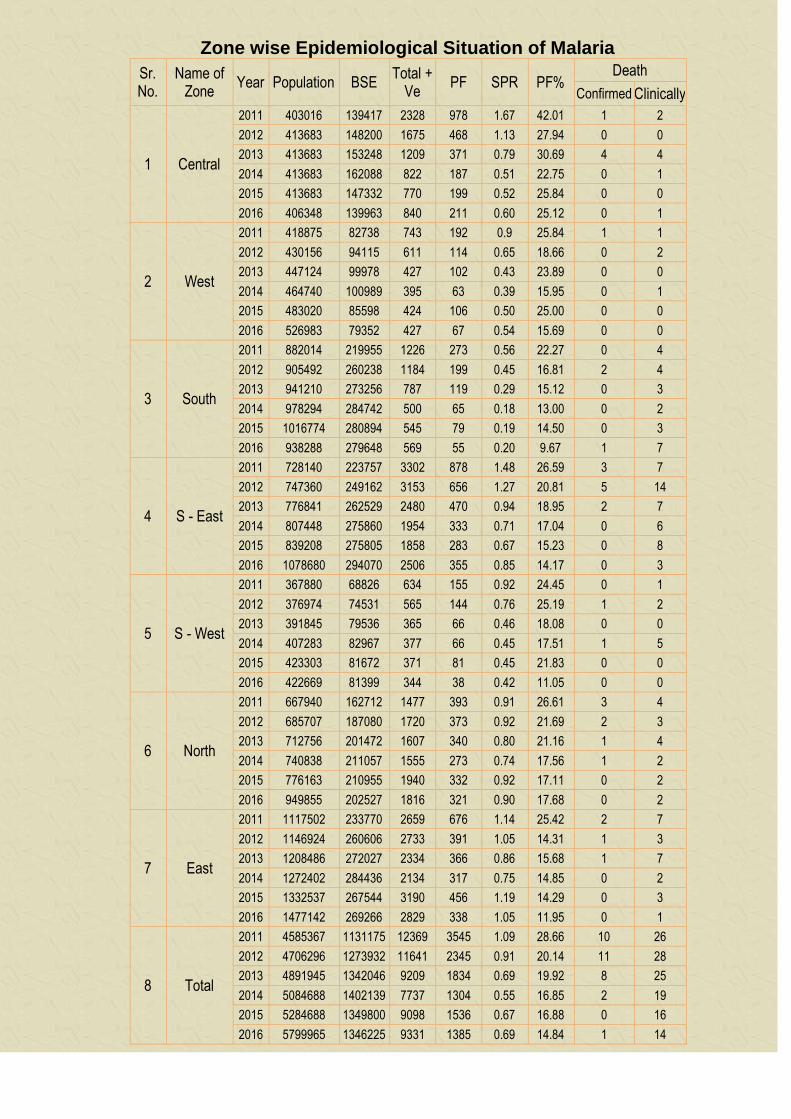
Zone wise Epidemiological Situation of Malaria
Sr. No.
Name of Zone
Year Population BSE Total +
Ve PF SPR PF%
Death
Confirmed Clinically
1 Central
2011 403016 139417 2328 978 1.67 42.01 1 2
2012 413683 148200 1675 468 1.13 27.94 0 0
2013 413683 153248 1209 371 0.79 30.69 4 4
2014 413683 162088 822 187 0.51 22.75 0 1
2015 413683 147332 770 199 0.52 25.84 0 0
2016 406348 139963 840 211 0.60 25.12 0 1
2 West
2011 418875 82738 743 192 0.9 25.84 1 1
2012 430156 94115 611 114 0.65 18.66 0 2
2013 447124 99978 427 102 0.43 23.89 0 0
2014 464740 100989 395 63 0.39 15.95 0 1
2015 483020 85598 424 106 0.50 25.00 0 0
2016 526983 79352 427 67 0.54 15.69 0 0
3 South
2011 882014 219955 1226 273 0.56 22.27 0 4
2012 905492 260238 1184 199 0.45 16.81 2 4
2013 941210 273256 787 119 0.29 15.12 0 3
2014 978294 284742 500 65 0.18 13.00 0 2
2015 1016774 280894 545 79 0.19 14.50 0 3
2016 938288 279648 569 55 0.20 9.67 1 7
4 S - East
2011 728140 223757 3302 878 1.48 26.59 3 7
2012 747360 249162 3153 656 1.27 20.81 5 14
2013 776841 262529 2480 470 0.94 18.95 2 7
2014 807448 275860 1954 333 0.71 17.04 0 6
2015 839208 275805 1858 283 0.67 15.23 0 8
2016 1078680 294070 2506 355 0.85 14.17 0 3
5 S - West
2011 367880 68826 634 155 0.92 24.45 0 1
2012 376974 74531 565 144 0.76 25.19 1 2
2013 391845 79536 365 66 0.46 18.08 0 0
2014 407283 82967 377 66 0.45 17.51 1 5
2015 423303 81672 371 81 0.45 21.83 0 0
2016 422669 81399 344 38 0.42 11.05 0 0
6 North
2011 667940 162712 1477 393 0.91 26.61 3 4
2012 685707 187080 1720 373 0.92 21.69 2 3
2013 712756 201472 1607 340 0.80 21.16 1 4
2014 740838 211057 1555 273 0.74 17.56 1 2
2015 776163 210955 1940 332 0.92 17.11 0 2
2016 949855 202527 1816 321 0.90 17.68 0 2
7 East
2011 1117502 233770 2659 676 1.14 25.42 2 7
2012 1146924 260606 2733 391 1.05 14.31 1 3
2013 1208486 272027 2334 366 0.86 15.68 1 7
2014 1272402 284436 2134 317 0.75 14.85 0 2
2015 1332537 267544 3190 456 1.19 14.29 0 3
2016 1477142 269266 2829 338 1.05 11.95 0 1
8 Total
2011 4585367 1131175 12369 3545 1.09 28.66 10 26
2012 4706296 1273932 11641 2345 0.91 20.14 11 28
2013 4891945 1342046 9209 1834 0.69 19.92 8 25
2014 5084688 1402139 7737 1304 0.55 16.85 2 19
2015 5284688 1349800 9098 1536 0.67 16.88 0 16
2016 5799965 1346225 9331 1385 0.69 14.84 1 14
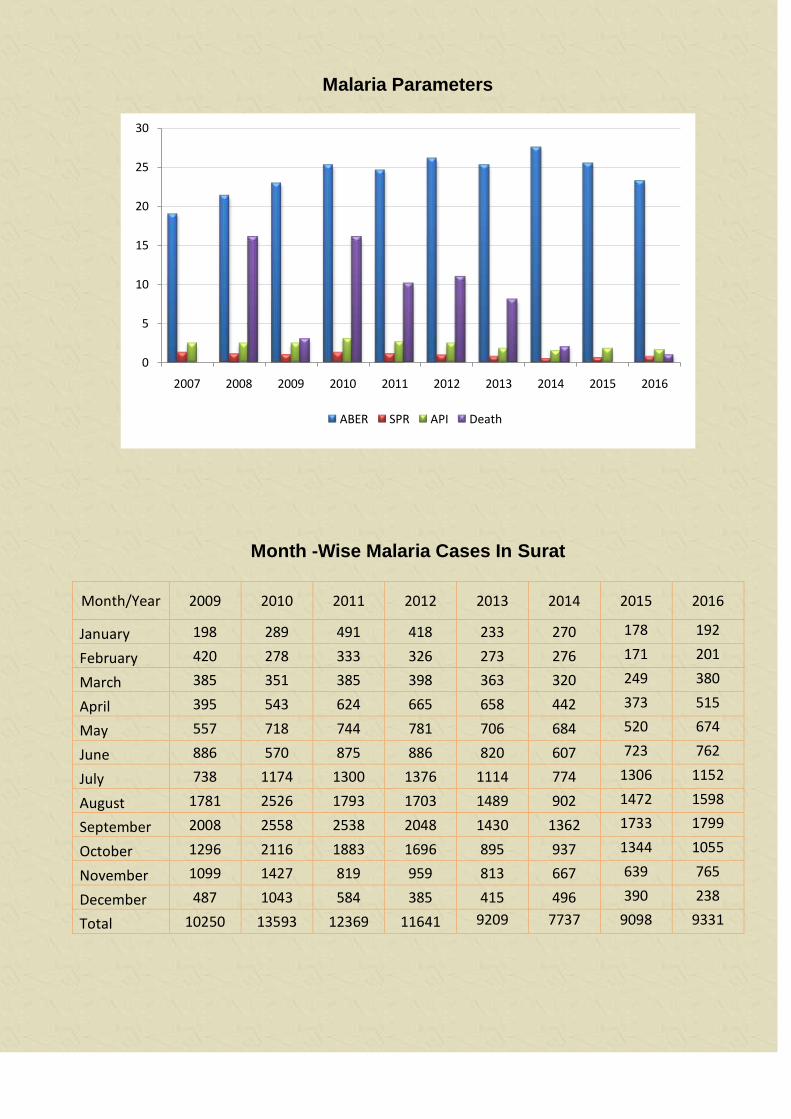
Malaria Parameters
Month -Wise Malaria Cases In Surat
Month/Year 2009 2010 2011 2012 2013 2014 2015 2016
January 198 289 491 418 233 270 178 192
February 420 278 333 326 273 276 171 201
March 385 351 385 398 363 320 249 380
April 395 543 624 665 658 442 373 515
May 557 718 744 781 706 684 520 674
June 886 570 875 886 820 607 723 762
July 738 1174 1300 1376 1114 774 1306 1152
August 1781 2526 1793 1703 1489 902 1472 1598
September 2008 2558 2538 2048 1430 1362 1733 1799
October 1296 2116 1883 1696 895 937 1344 1055
November 1099 1427 819 959 813 667 639 765
December 487 1043 584 385 415 496 390 238
Total 10250 13593 12369 11641 9209 7737 9098 9331
0
5
10
15
20
25
30
2007 2008 2009 2010 2011 2012 2013 2014 2015 2016
ABER SPR API Death
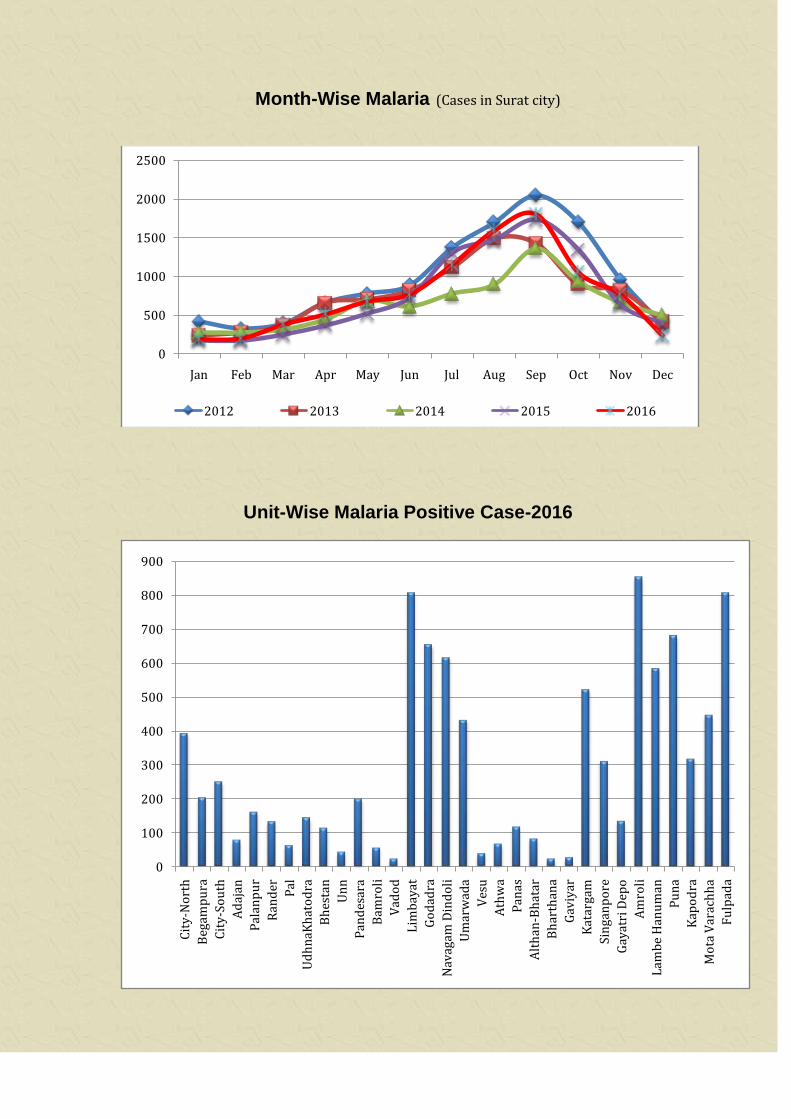
Month-Wise Malaria (Cases in Surat city)
Unit-Wise Malaria Positive Case-2016
0
500
1000
1500
2000
2500
Jan Feb Mar Apr May Jun Jul Aug Sep Oct Nov Dec
2012 2013 2014 2015 2016
0
100
200
300
400
500
600
700
800
900
Cit
y-N
ort
h
Beg
amp
ura
Cit
y-S
ou
th
Ad
ajan
Pal
anp
ur
Ran
der Pal
Ud
hn
aKh
ato
dra
Bh
esta
n
Un
n
Pan
des
ara
Bam
roli
Vad
od
Lim
bay
at
Go
dad
ra
Nav
agam
Din
do
li
Um
arw
ada
Ves
u
Ath
wa
Pan
as
Alt
han
-Bh
atar
Bh
arth
ana
Gav
iyar
Kat
arga
m
Sin
gan
po
re
Gay
atri
Dep
o
Am
roli
Lam
be
Han
um
an
Pu
na
Kap
od
ra
Mo
ta V
arac
hh
a
Fu
lpad
a
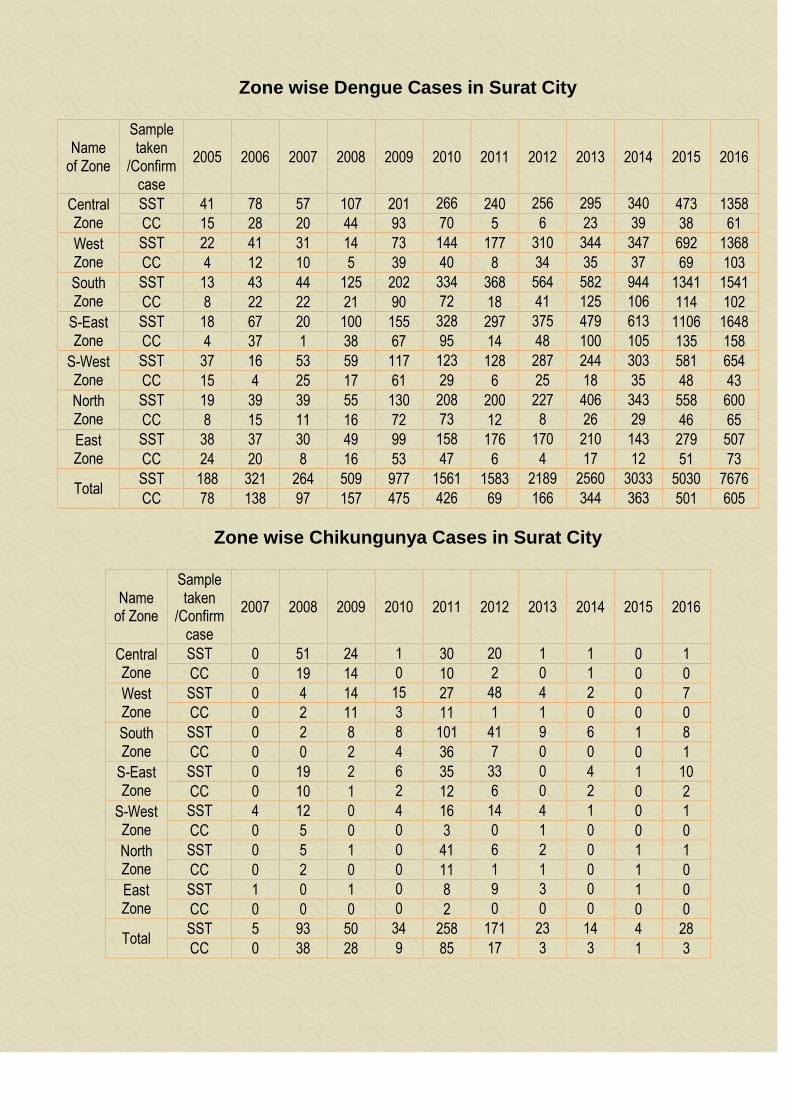
Zone wise Dengue Cases in Surat City
Name of Zone
Sample taken
/Confirm case
2005 2006 2007 2008 2009 2010 2011 2012 2013 2014 2015 2016
Central Zone
SST 41 78 57 107 201 266 240 256 295 340 473 1358
CC 15 28 20 44 93 70 5 6 23 39 38 61
West Zone
SST 22 41 31 14 73 144 177 310 344 347 692 1368
CC 4 12 10 5 39 40 8 34 35 37 69 103
South Zone
SST 13 43 44 125 202 334 368 564 582 944 1341 1541
CC 8 22 22 21 90 72 18 41 125 106 114 102
S-East Zone
SST 18 67 20 100 155 328 297 375 479 613 1106 1648
CC 4 37 1 38 67 95 14 48 100 105 135 158
S-West Zone
SST 37 16 53 59 117 123 128 287 244 303 581 654
CC 15 4 25 17 61 29 6 25 18 35 48 43
North Zone
SST 19 39 39 55 130 208 200 227 406 343 558 600
CC 8 15 11 16 72 73 12 8 26 29 46 65
East Zone
SST 38 37 30 49 99 158 176 170 210 143 279 507
CC 24 20 8 16 53 47 6 4 17 12 51 73
Total SST 188 321 264 509 977 1561 1583 2189 2560 3033 5030 7676
CC 78 138 97 157 475 426 69 166 344 363 501 605
Zone wise Chikungunya Cases in Surat City
Name of Zone
Sample taken
/Confirm case
2007 2008 2009 2010 2011 2012 2013 2014 2015 2016
Central Zone
SST 0 51 24 1 30 20 1 1 0 1
CC 0 19 14 0 10 2 0 1 0 0
West Zone
SST 0 4 14 15 27 48 4 2 0 7
CC 0 2 11 3 11 1 1 0 0 0
South Zone
SST 0 2 8 8 101 41 9 6 1 8
CC 0 0 2 4 36 7 0 0 0 1
S-East Zone
SST 0 19 2 6 35 33 0 4 1 10
CC 0 10 1 2 12 6 0 2 0 2
S-West Zone
SST 4 12 0 4 16 14 4 1 0 1
CC 0 5 0 0 3 0 1 0 0 0
North Zone
SST 0 5 1 0 41 6 2 0 1 1
CC 0 2 0 0 11 1 1 0 1 0
East Zone
SST 1 0 1 0 8 9 3 0 1 0
CC 0 0 0 0 2 0 0 0 0 0
Total SST 5 93 50 34 258 171 23 14 4 28
CC 0 38 28 9 85 17 3 3 1 3
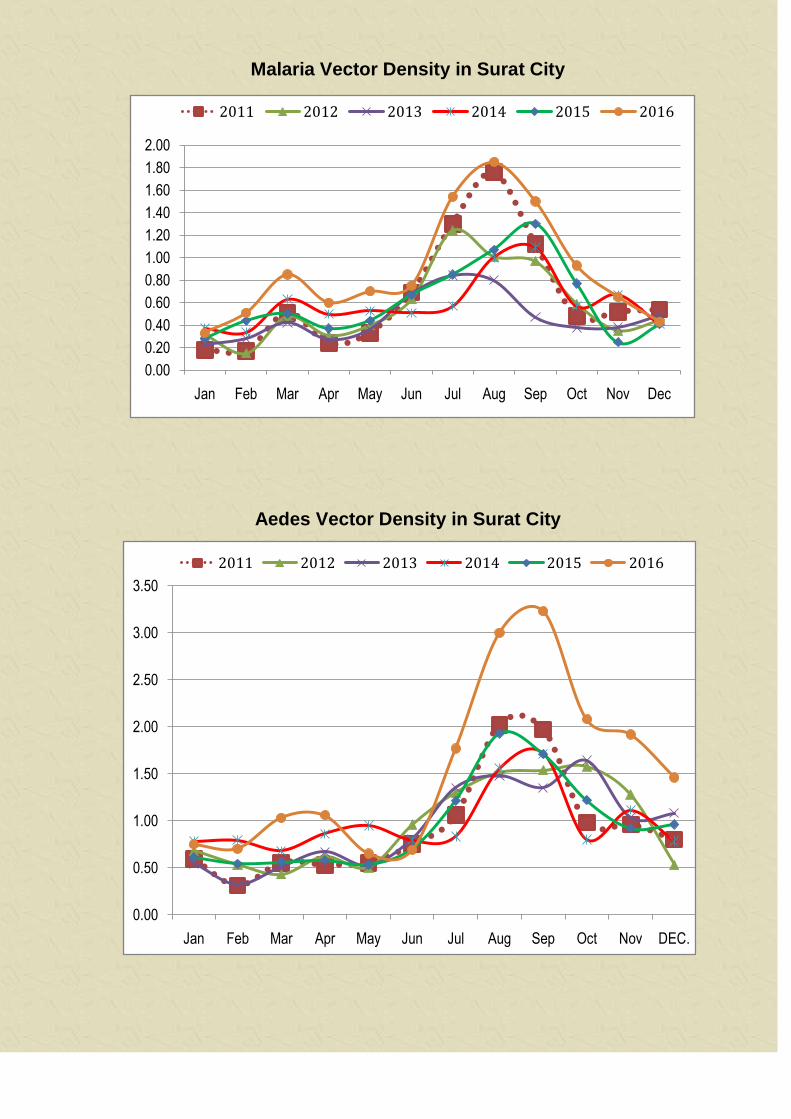
Malaria Vector Density in Surat City
Aedes Vector Density in Surat City
0.00
0.20
0.40
0.60
0.80
1.00
1.20
1.40
1.60
1.80
2.00
Jan Feb Mar Apr May Jun Jul Aug Sep Oct Nov Dec
2011 2012 2013 2014 2015 2016
0.00
0.50
1.00
1.50
2.00
2.50
3.00
3.50
Jan Feb Mar Apr May Jun Jul Aug Sep Oct Nov DEC.
2011 2012 2013 2014 2015 2016
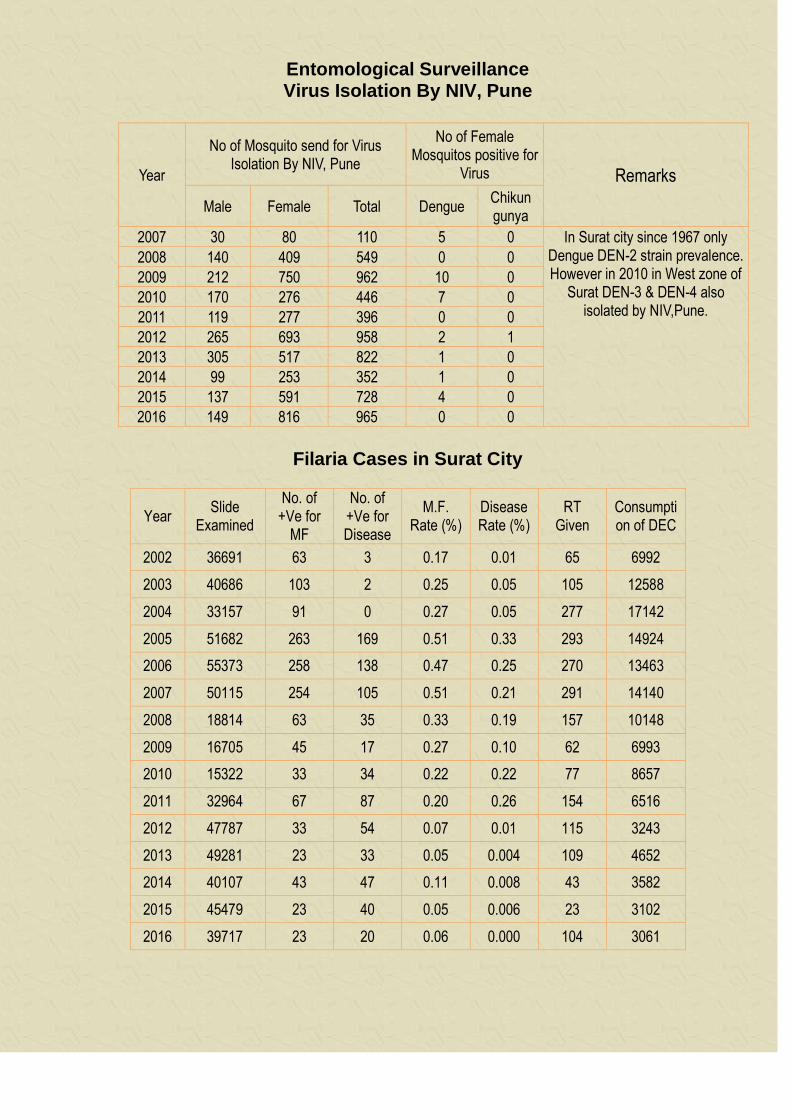
Entomological Surveillance Virus Isolation By NIV, Pune
Year
No of Mosquito send for Virus Isolation By NIV, Pune
No of Female Mosquitos positive for
Virus Remarks
Male Female Total Dengue Chikun gunya
2007 30 80 110 5 0 In Surat city since 1967 only Dengue DEN-2 strain prevalence. However in 2010 in West zone of
Surat DEN-3 & DEN-4 also isolated by NIV,Pune.
2008 140 409 549 0 0
2009 212 750 962 10 0
2010 170 276 446 7 0
2011 119 277 396 0 0
2012 265 693 958 2 1
2013 305 517 822 1 0
2014 99 253 352 1 0
2015 137 591 728 4 0
2016 149 816 965 0 0
Filaria Cases in Surat City
Year Slide
Examined
No. of +Ve for
MF
No. of +Ve for Disease
M.F. Rate (%)
Disease Rate (%)
RT Given
Consumption of DEC
2002 36691 63 3 0.17 0.01 65 6992
2003 40686 103 2 0.25 0.05 105 12588
2004 33157 91 0 0.27 0.05 277 17142
2005 51682 263 169 0.51 0.33 293 14924
2006 55373 258 138 0.47 0.25 270 13463
2007 50115 254 105 0.51 0.21 291 14140
2008 18814 63 35 0.33 0.19 157 10148
2009 16705 45 17 0.27 0.10 62 6993
2010 15322 33 34 0.22 0.22 77 8657
2011 32964 67 87 0.20 0.26 154 6516
2012 47787 33 54 0.07 0.01 115 3243
2013 49281 23 33 0.05 0.004 109 4652
2014 40107 43 47 0.11 0.008 43 3582
2015 45479 23 40 0.05 0.006 23 3102
2016 39717 23 20 0.06 0.000 104 3061
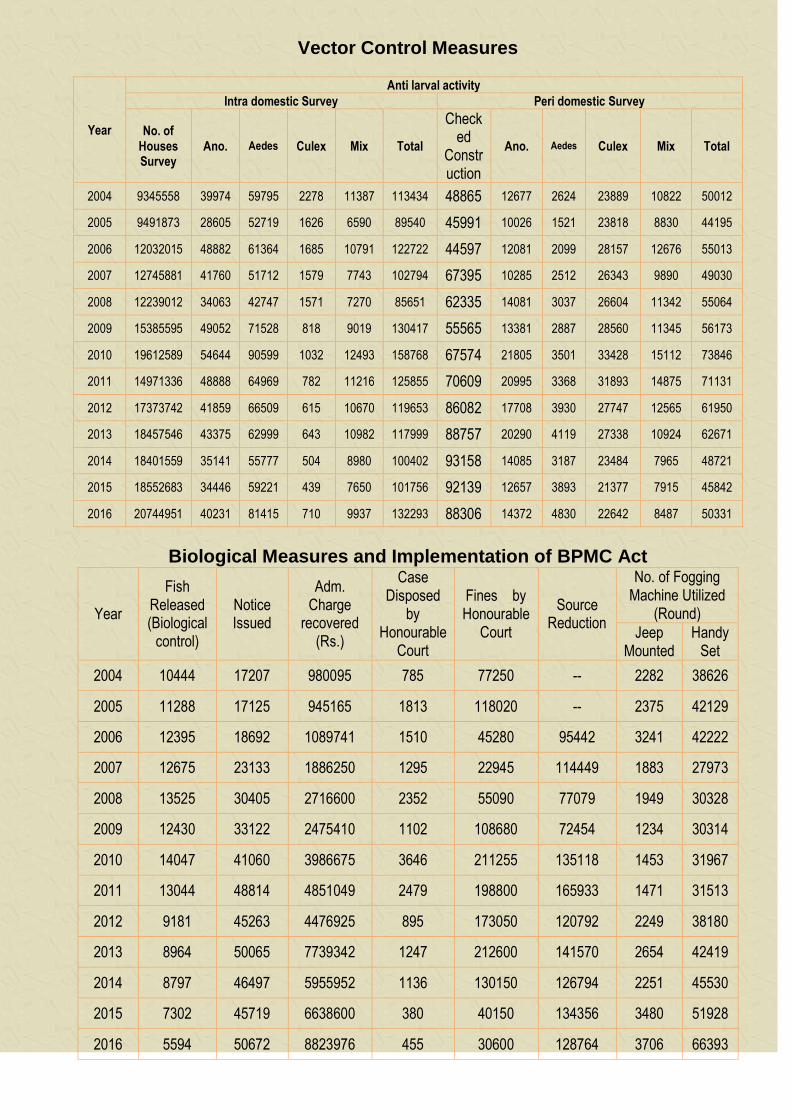
Vector Control Measures
Year
Anti larval activity
Intra domestic Survey Peri domestic Survey
No. of Houses Survey
Ano. Aedes Culex Mix Total
Checked
Construction
Ano. Aedes Culex Mix Total
2004 9345558 39974 59795 2278 11387 113434 48865 12677 2624 23889 10822 50012
2005 9491873 28605 52719 1626 6590 89540 45991 10026 1521 23818 8830 44195
2006 12032015 48882 61364 1685 10791 122722 44597 12081 2099 28157 12676 55013
2007 12745881 41760 51712 1579 7743 102794 67395 10285 2512 26343 9890 49030
2008 12239012 34063 42747 1571 7270 85651 62335 14081 3037 26604 11342 55064
2009 15385595 49052 71528 818 9019 130417 55565 13381 2887 28560 11345 56173
2010 19612589 54644 90599 1032 12493 158768 67574 21805 3501 33428 15112 73846
2011 14971336 48888 64969 782 11216 125855 70609 20995 3368 31893 14875 71131
2012 17373742 41859 66509 615 10670 119653 86082 17708 3930 27747 12565 61950
2013 18457546 43375 62999 643 10982 117999 88757 20290 4119 27338 10924 62671
2014 18401559 35141 55777 504 8980 100402 93158 14085 3187 23484 7965 48721
2015 18552683 34446 59221 439 7650 101756 92139 12657 3893 21377 7915 45842
2016 20744951 40231 81415 710 9937 132293 88306 14372 4830 22642 8487 50331
Biological Measures and Implementation of BPMC Act
Year
Fish Released (Biological
control)
Notice Issued
Adm. Charge
recovered (Rs.)
Case Disposed
by Honourable
Court
Fines by Honourable
Court
Source Reduction
No. of Fogging Machine Utilized
(Round)
Jeep Mounted
Handy Set
2004 10444 17207 980095 785 77250 -- 2282 38626
2005 11288 17125 945165 1813 118020 -- 2375 42129
2006 12395 18692 1089741 1510 45280 95442 3241 42222
2007 12675 23133 1886250 1295 22945 114449 1883 27973
2008 13525 30405 2716600 2352 55090 77079 1949 30328
2009 12430 33122 2475410 1102 108680 72454 1234 30314
2010 14047 41060 3986675 3646 211255 135118 1453 31967
2011 13044 48814 4851049 2479 198800 165933 1471 31513
2012 9181 45263 4476925 895 173050 120792 2249 38180
2013 8964 50065 7739342 1247 212600 141570 2654 42419
2014 8797 46497 5955952 1136 130150 126794 2251 45530
2015 7302 45719 6638600 380 40150 134356 3480 51928
2016 5594 50672 8823976 455 30600 128764 3706 66393
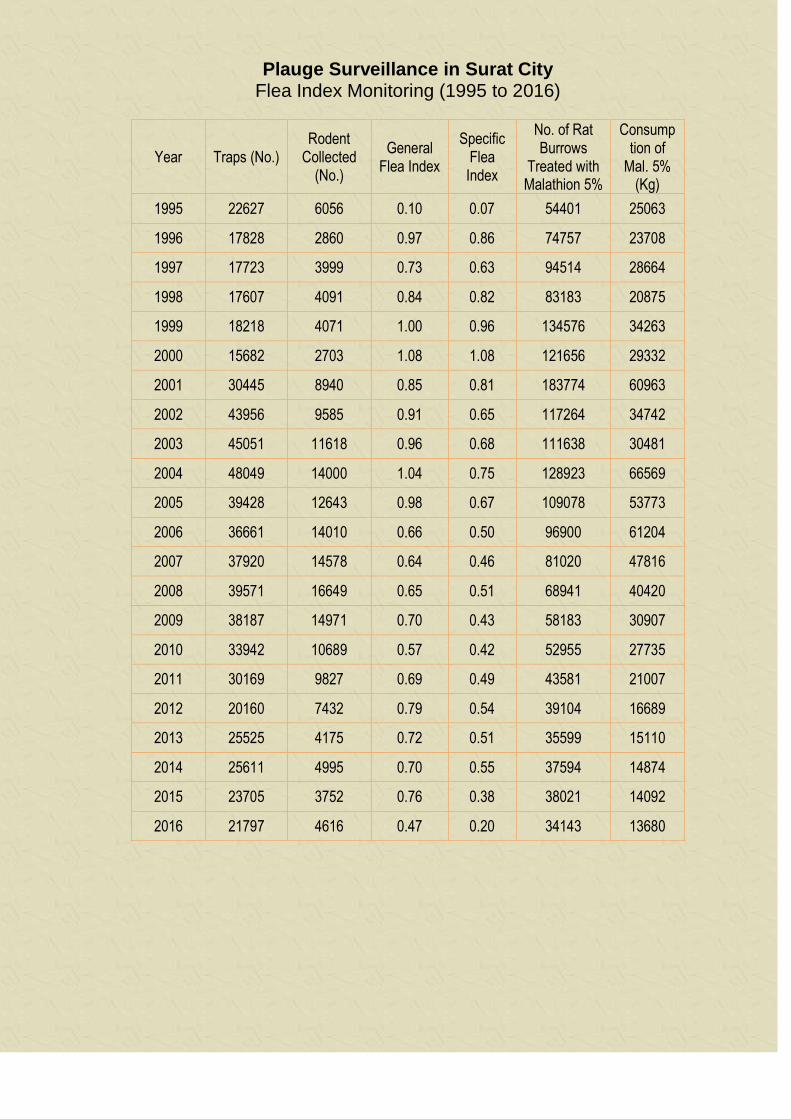
Plauge Surveillance in Surat City
Flea Index Monitoring (1995 to 2016)
Year Traps (No.) Rodent
Collected (No.)
General Flea Index
Specific Flea Index
No. of Rat Burrows
Treated with Malathion 5%
Consumption of
Mal. 5% (Kg)
1995 22627 6056 0.10 0.07 54401 25063
1996 17828 2860 0.97 0.86 74757 23708
1997 17723 3999 0.73 0.63 94514 28664
1998 17607 4091 0.84 0.82 83183 20875
1999 18218 4071 1.00 0.96 134576 34263
2000 15682 2703 1.08 1.08 121656 29332
2001 30445 8940 0.85 0.81 183774 60963
2002 43956 9585 0.91 0.65 117264 34742
2003 45051 11618 0.96 0.68 111638 30481
2004 48049 14000 1.04 0.75 128923 66569
2005 39428 12643 0.98 0.67 109078 53773
2006 36661 14010 0.66 0.50 96900 61204
2007 37920 14578 0.64 0.46 81020 47816
2008 39571 16649 0.65 0.51 68941 40420
2009 38187 14971 0.70 0.43 58183 30907
2010 33942 10689 0.57 0.42 52955 27735
2011 30169 9827 0.69 0.49 43581 21007
2012 20160 7432 0.79 0.54 39104 16689
2013 25525 4175 0.72 0.51 35599 15110
2014 25611 4995 0.70 0.55 37594 14874
2015 23705 3752 0.76 0.38 38021 14092
2016 21797 4616 0.47 0.20 34143 13680
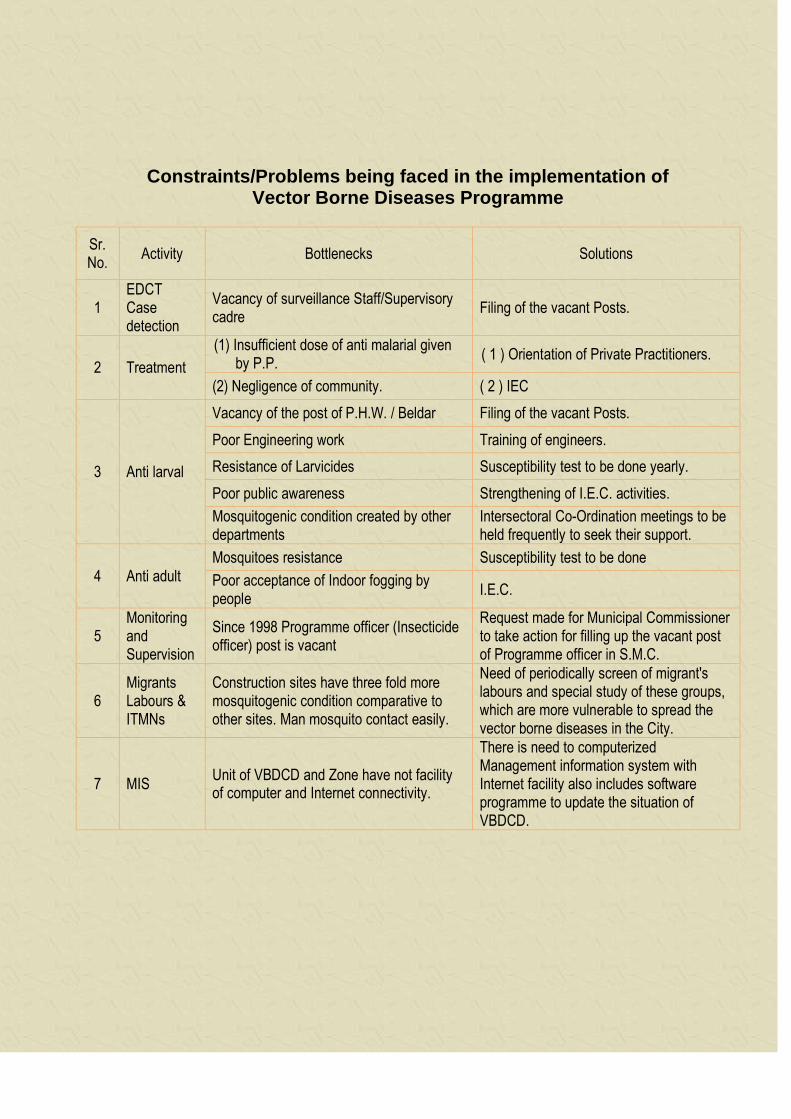
Constraints/Problems being faced in the implementation of Vector Borne Diseases Programme
Sr. No.
Activity Bottlenecks Solutions
1 EDCT Case detection
Vacancy of surveillance Staff/Supervisory cadre
Filing of the vacant Posts.
2 Treatment
(1) Insufficient dose of anti malarial given by P.P.
( 1 ) Orientation of Private Practitioners.
(2) Negligence of community. ( 2 ) IEC
3 Anti larval
Vacancy of the post of P.H.W. / Beldar Filing of the vacant Posts.
Poor Engineering work Training of engineers.
Resistance of Larvicides Susceptibility test to be done yearly.
Poor public awareness Strengthening of I.E.C. activities.
Mosquitogenic condition created by other departments
Intersectoral Co-Ordination meetings to be held frequently to seek their support.
4 Anti adult Mosquitoes resistance Susceptibility test to be done
Poor acceptance of Indoor fogging by people
I.E.C.
5 Monitoring and Supervision
Since 1998 Programme officer (Insecticide officer) post is vacant
Request made for Municipal Commissioner to take action for filling up the vacant post of Programme officer in S.M.C.
6 Migrants Labours & ITMNs
Construction sites have three fold more mosquitogenic condition comparative to other sites. Man mosquito contact easily.
Need of periodically screen of migrant's labours and special study of these groups, which are more vulnerable to spread the vector borne diseases in the City.
7 MIS Unit of VBDCD and Zone have not facility of computer and Internet connectivity.
There is need to computerized Management information system with Internet facility also includes software programme to update the situation of VBDCD.
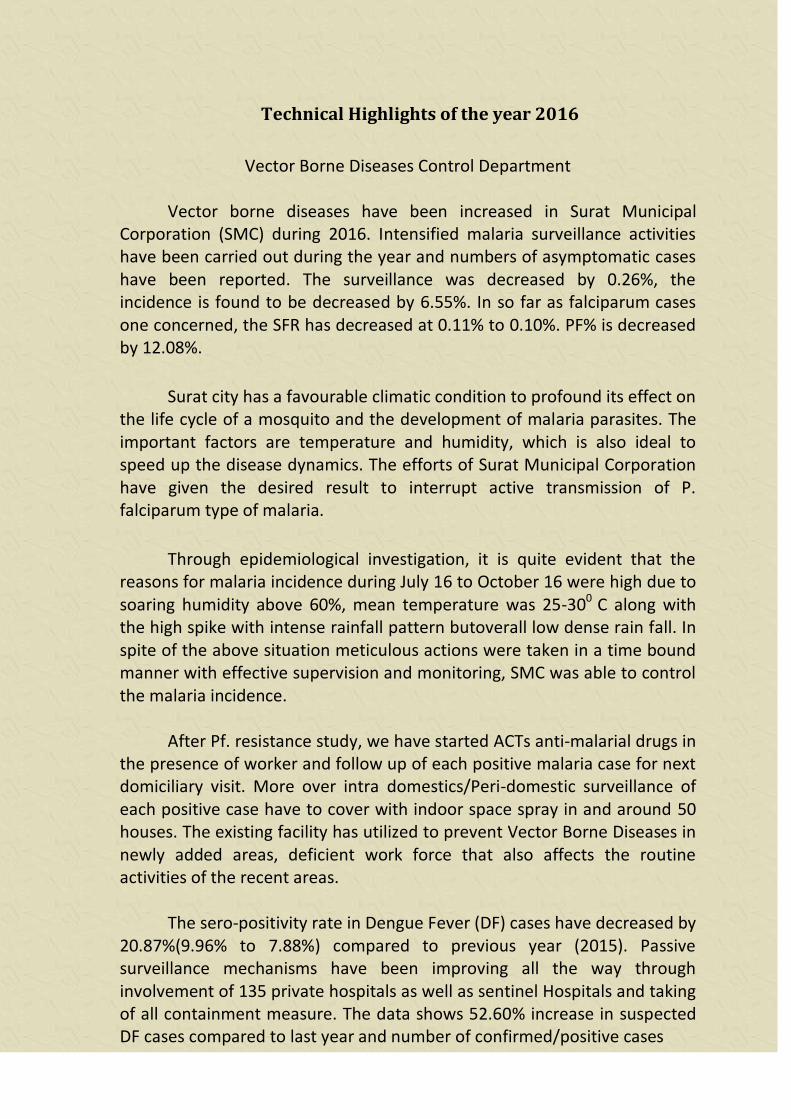
Technical Highlights of the year 2016
Vector Borne Diseases Control Department Vector borne diseases have been increased in Surat Municipal
Corporation (SMC) during 2016. Intensified malaria surveillance activities have been carried out during the year and numbers of asymptomatic cases have been reported. The surveillance was decreased by 0.26%, the incidence is found to be decreased by 6.55%. In so far as falciparum cases one concerned, the SFR has decreased at 0.11% to 0.10%. PF% is decreased by 12.08%.
Surat city has a favourable climatic condition to profound its effect on the life cycle of a mosquito and the development of malaria parasites. The important factors are temperature and humidity, which is also ideal to speed up the disease dynamics. The efforts of Surat Municipal Corporation have given the desired result to interrupt active transmission of P. falciparum type of malaria.
Through epidemiological investigation, it is quite evident that the reasons for malaria incidence during July 16 to October 16 were high due to soaring humidity above 60%, mean temperature was 25-300 C along with the high spike with intense rainfall pattern butoverall low dense rain fall. In spite of the above situation meticulous actions were taken in a time bound manner with effective supervision and monitoring, SMC was able to control the malaria incidence.
After Pf. resistance study, we have started ACTs anti-malarial drugs in the presence of worker and follow up of each positive malaria case for next domiciliary visit. More over intra domestics/Peri-domestic surveillance of each positive case have to cover with indoor space spray in and around 50 houses. The existing facility has utilized to prevent Vector Borne Diseases in newly added areas, deficient work force that also affects the routine activities of the recent areas.
The sero-positivity rate in Dengue Fever (DF) cases have decreased by
20.87%(9.96% to 7.88%) compared to previous year (2015). Passive surveillance mechanisms have been improving all the way through involvement of 135 private hospitals as well as sentinel Hospitals and taking of all containment measure. The data shows 52.60% increase in suspected DF cases compared to last year and number of confirmed/positive cases
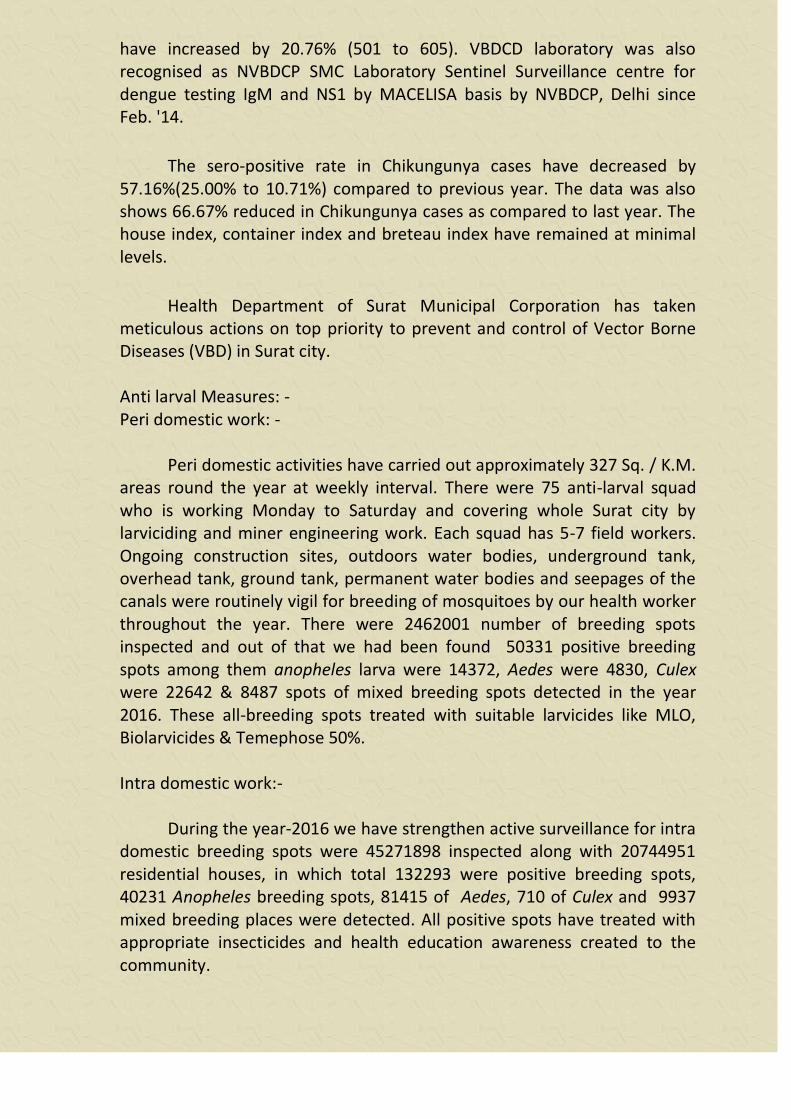
have increased by 20.76% (501 to 605). VBDCD laboratory was also recognised as NVBDCP SMC Laboratory Sentinel Surveillance centre for dengue testing IgM and NS1 by MACELISA basis by NVBDCP, Delhi since Feb. '14.
The sero-positive rate in Chikungunya cases have decreased by 57.16%(25.00% to 10.71%) compared to previous year. The data was also shows 66.67% reduced in Chikungunya cases as compared to last year. The house index, container index and breteau index have remained at minimal levels.
Health Department of Surat Municipal Corporation has taken meticulous actions on top priority to prevent and control of Vector Borne Diseases (VBD) in Surat city. Anti larval Measures: - Peri domestic work: - Peri domestic activities have carried out approximately 327 Sq. / K.M. areas round the year at weekly interval. There were 75 anti-larval squad who is working Monday to Saturday and covering whole Surat city by larviciding and miner engineering work. Each squad has 5-7 field workers. Ongoing construction sites, outdoors water bodies, underground tank, overhead tank, ground tank, permanent water bodies and seepages of the canals were routinely vigil for breeding of mosquitoes by our health worker throughout the year. There were 2462001 number of breeding spots inspected and out of that we had been found 50331 positive breeding spots among them anopheles larva were 14372, Aedes were 4830, Culex were 22642 & 8487 spots of mixed breeding spots detected in the year 2016. These all-breeding spots treated with suitable larvicides like MLO, Biolarvicides & Temephose 50%.
Intra domestic work:-
During the year-2016 we have strengthen active surveillance for intra domestic breeding spots were 45271898 inspected along with 20744951 residential houses, in which total 132293 were positive breeding spots, 40231 Anopheles breeding spots, 81415 of Aedes, 710 of Culex and 9937 mixed breeding places were detected. All positive spots have treated with appropriate insecticides and health education awareness created to the community.
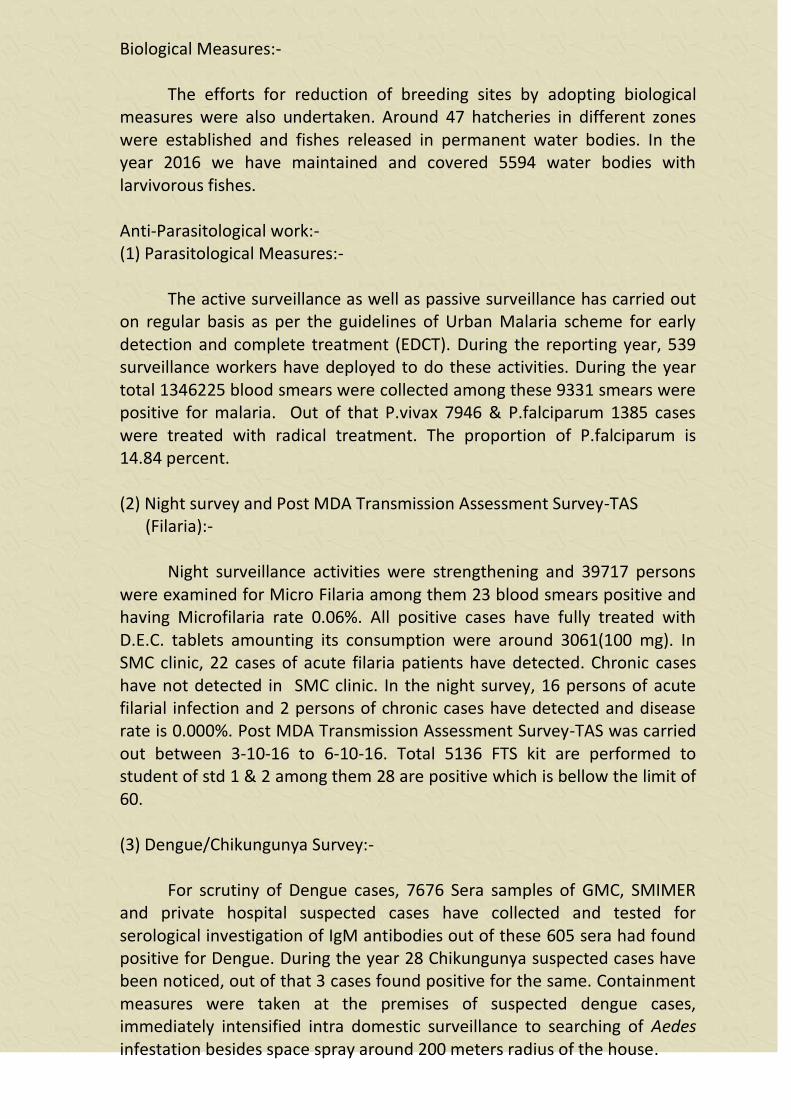
Biological Measures:- The efforts for reduction of breeding sites by adopting biological measures were also undertaken. Around 47 hatcheries in different zones were established and fishes released in permanent water bodies. In the year 2016 we have maintained and covered 5594 water bodies with larvivorous fishes. Anti-Parasitological work:- (1) Parasitological Measures:-
The active surveillance as well as passive surveillance has carried out on regular basis as per the guidelines of Urban Malaria scheme for early detection and complete treatment (EDCT). During the reporting year, 539 surveillance workers have deployed to do these activities. During the year total 1346225 blood smears were collected among these 9331 smears were positive for malaria. Out of that P.vivax 7946 & P.falciparum 1385 cases were treated with radical treatment. The proportion of P.falciparum is 14.84 percent. (2) Night survey and Post MDA Transmission Assessment Survey-TAS (Filaria):-
Night surveillance activities were strengthening and 39717 persons were examined for Micro Filaria among them 23 blood smears positive and having Microfilaria rate 0.06%. All positive cases have fully treated with D.E.C. tablets amounting its consumption were around 3061(100 mg). In SMC clinic, 22 cases of acute filaria patients have detected. Chronic cases have not detected in SMC clinic. In the night survey, 16 persons of acute filarial infection and 2 persons of chronic cases have detected and disease rate is 0.000%. Post MDA Transmission Assessment Survey-TAS was carried out between 3-10-16 to 6-10-16. Total 5136 FTS kit are performed to student of std 1 & 2 among them 28 are positive which is bellow the limit of 60.
(3) Dengue/Chikungunya Survey:-
For scrutiny of Dengue cases, 7676 Sera samples of GMC, SMIMER and private hospital suspected cases have collected and tested for serological investigation of IgM antibodies out of these 605 sera had found positive for Dengue. During the year 28 Chikungunya suspected cases have been noticed, out of that 3 cases found positive for the same. Containment measures were taken at the premises of suspected dengue cases, immediately intensified intra domestic surveillance to searching of Aedes infestation besides space spray around 200 meters radius of the house.
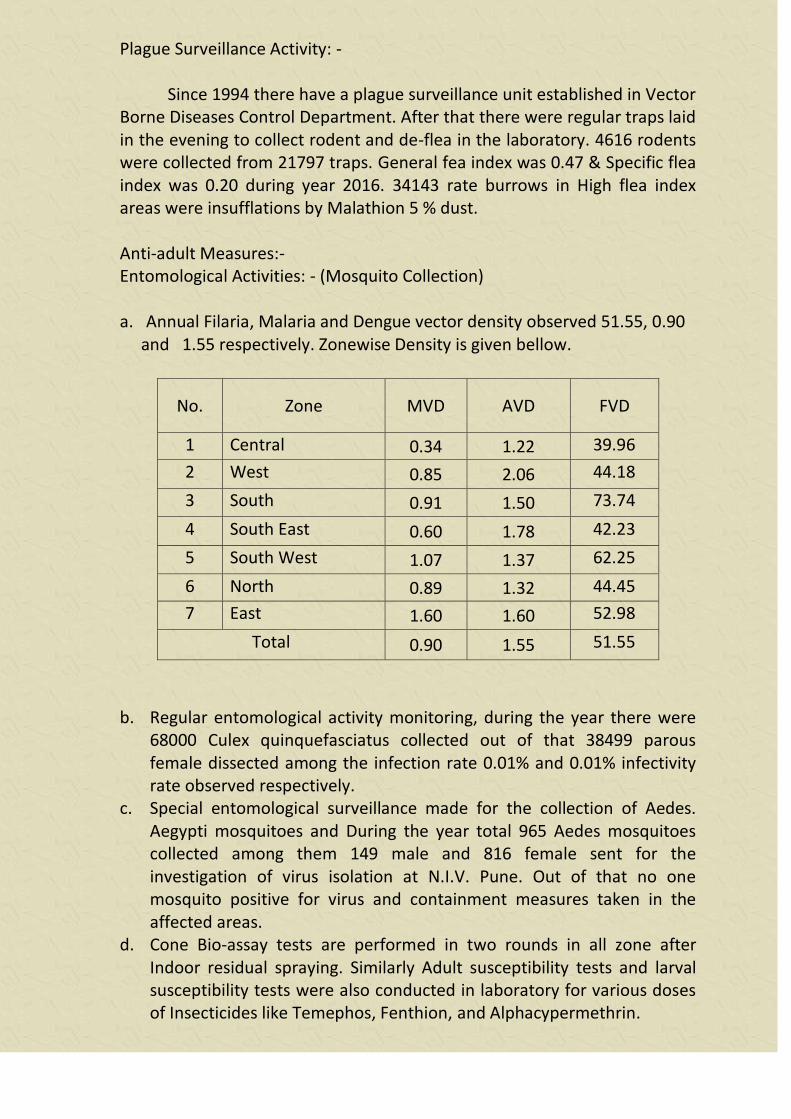
Plague Surveillance Activity: -
Since 1994 there have a plague surveillance unit established in Vector Borne Diseases Control Department. After that there were regular traps laid in the evening to collect rodent and de-flea in the laboratory. 4616 rodents were collected from 21797 traps. General fea index was 0.47 & Specific flea index was 0.20 during year 2016. 34143 rate burrows in High flea index areas were insufflations by Malathion 5 % dust. Anti-adult Measures:- Entomological Activities: - (Mosquito Collection) a. Annual Filaria, Malaria and Dengue vector density observed 51.55, 0.90 and 1.55 respectively. Zonewise Density is given bellow.
No. Zone MVD AVD FVD
1 Central 0.34 1.22 39.96
2 West 0.85 2.06 44.18
3 South 0.91 1.50 73.74
4 South East 0.60 1.78 42.23
5 South West 1.07 1.37 62.25
6 North 0.89 1.32 44.45
7 East 1.60 1.60 52.98
Total 0.90 1.55 51.55
b. Regular entomological activity monitoring, during the year there were
68000 Culex quinquefasciatus collected out of that 38499 parous female dissected among the infection rate 0.01% and 0.01% infectivity rate observed respectively.
c. Special entomological surveillance made for the collection of Aedes. Aegypti mosquitoes and During the year total 965 Aedes mosquitoes collected among them 149 male and 816 female sent for the investigation of virus isolation at N.I.V. Pune. Out of that no one mosquito positive for virus and containment measures taken in the affected areas.
d. Cone Bio-assay tests are performed in two rounds in all zone after Indoor residual spraying. Similarly Adult susceptibility tests and larval susceptibility tests were also conducted in laboratory for various doses of Insecticides like Temephos, Fenthion, and Alphacypermethrin.
Space Spray:-
The space spray done at the places of positive malaria cases, at the places found of P.falciparum cases, also at the places of vectors detected, in the slum & slum like areas and as on receiving complaints from the complainers. There are 66393 round handy set fogging machine and 3706 round Vehicle mounted machines with us for fumigation. Indoor Residual Spraying:- 103232 houses, 169991 rooms and 508356 populations high risk areas for malaria have been covered by Indoor Residual Spraying during year 2016. Training Programme:-
Newly recruited 216 primary health workers (5 batch) have taken training for vector borne diseases control between 07-01-2016 to 21-01-2016. They have informed about activity of department like malaria surveillance with intradomestic survey,antilarval,entomological surveillance ,vector borne diseases and their control methods, antimalarial drug, Insecticides and reporting system. One laboratory technician has taken training for malaria microscopy between 15-02-2016 to 26-02-2016 at Regional Director, Health & Family Welfare, Bapunagar,Ahmadabad. Insecticide Officer was participated & displayed presentation on "Innovative electronic data capture tools for prevention and control of malaria and other vector borne diseases system development in Surat City" in "XIst Joint Annual Conference" organized by ISMOCD & IAE, Bangalore between 10-06-2016 to 12-06-2016. Insecticide Officer was participated in "Conference on cities, climate forcing infectious disease dynamics" at Delhi between 12-09-2016 to 14-09-2016. A Training/workshop for TAS-transmission assessment survey for elimination of lymphatic filariasis was organized on 9 & 10 Sep 2016 and 26,28,30th Sep 2016. One laboratory technician has taken training for malaria microscopy between 05-12-2016 to 09-12-2016 at Civil hospital,Nadiad.
Health Education:-
Throughout the year, health education to the community has remained of prime importance for us. It has imparted with keen interest to seek optimal participation from the community regarding awareness of malaria & other mosquitoes borne diseases. A rally presided by Hon. Mayor, SMC, Commissioner, SMC and other delegates of Surat Municipal Corporation were organized from Solid waste transfer station,Pal to Palanpur Urban Health Centre for awareness of malaria on the 1st June of
anti malaria month (June). The slum communities at their residence have shown of life cycle of Mosquito. The causes of Malaria & the message of its prevention have displayed on TV with the use of local channels.
For the motivation of the communities, Essays, Quiz and drawing competitions were organized for awareness of mosquito borne diseases in school students. All contestants have given prizes with special prizes given to the top three contestants in each competition.SMC Special campaigns organized with the involvement of mass media including local channels, newspapers, radio and TV as well as outdoor publicity like hoarding, banners, rallies etc. The health education materials were prepared and widely disseminated in the form of posters, pamphlets and handbills. The slogans have created about awareness of Malaria along with hundred fifty flex banners made up and display in the community. The advertisement in local dailies used at every week throughout the antimalaria month. Interpersonal communication through Indian Medical Association (IMA), GPA and Private practitioners, group meetings, puppet-shows along with malaria slogan, antimalarial activities and preventive measures prepared and wandering during the month in seven of the SMC were optimally utilized. Court prosecution & Administration charges:-
Total 385 complain were filed before Honorable Court and 455 cases were disposed during the reporting year and penalty of Rs.30600 was imposed as fine. 50672 notice were issued & Administrative charges Rs. 88.24 lakhs were collected from the defaulters, who created the breeding potential sites in & around of their own premises. Containment measures were taken against the breeding sites by spraying of appropriate larvicides. Dryday campaign:- Department is carried out "Dry Day" campaign every Saturday for control of Dengue cases. During the year-2016, 4205851 breeding spots were inspected along with 1911813 residential houses, in which 15801 positive breeding spots were eliminated, 603464 containers were dried, 56140 containers were disposed. 6243 notices were issued to people & Administrative charges of Rs. 24.55 Lakh were collected against mosquitogenic issues. 1690464 containers were treated with Temephos and 751944 Pamphlets were distributed in community.
Shri J P Vagadia I/C Insecticide officer Surat Municipal Corporation