Embed Size (px)
Citation preview

Surat Basin population report, 2014
Introduction
The Surat Basin population report, 2014 (the report) provides
estimates of the population of non–resident fly-in/fly-out and
drive-in/drive-out (FIFO/DIDO) workers who were on-shift in the
region during the last week of June 2014. Information regarding the
supply and take-up of commercial accommodation utilised by these
workers is also summarised.
The Surat Basin’s non-resident population comprises people
working in the mining and gas industries, construction workers, and
associated sub-contractors. Non-resident workers are not included
in estimated resident population (ERP) data released annually by
the Australian Bureau of Statistics (ABS). As a result, the full–time
equivalent (FTE) population estimates presented in this report,
which combine the resident and non-resident populations, provide a
more complete indicator of total demand for certain services than
either measure used alone.
Key findings
Key findings of this report include:
Around 14,490 non–resident workers on–shift were counted in
the Surat Basin in late June 2014. This was an estimated
2,010 persons (or 16%) more than in June 2013, and 8,050
(125%) more than in June 2012.
The size of the region’s non-resident population is linked
closely to ongoing development of three coal seam gas (CSG)
projects. Workforce numbers for these projects expanded
during 2013–14 as construction of surface infrastructure
facilities and lateral pipelines ramped up.
Of the three LGAs in the region, Western Downs (R) had the largest non-resident population in June 2014, with 9,100
persons (or 63% of the total). Maranoa (R) accounted for 36% (5,210 persons), with the remaining 1% in Toowoomba
(R) (180 persons).
Western Downs (R) recorded the highest non–resident population growth in the year to June 2014 (1,615 persons). The
non-resident population of Maranoa (R) grew by 540 persons, while Toowoomba (R) fell by 145 persons.
An estimated 13,640 non–resident workers on–shift (or 94% of the total) were housed in worker accommodation
villages (WAVs) across the Surat Basin in June 2014. The remainder (850 persons or 6% of the total) occupied other
forms of accommodation, including hotels/motels and caravan parks.
There were 100 WAVs counted in the Surat Basin in June 2014, with most (91 WAVs) located in rural areas rather than
in towns. The number of rural WAVs increased by seven during the preceding year, largely in the form of temporary
medium-sized establishments (100–499 beds) built to service construction workforces.
The majority of non-resident workers in the Surat Basin in June 2014 stayed in rural areas rather than towns (85% in
Maranoa (R) and 80% in Western Downs (R)). The number of non-resident workers living in towns across Western
Downs (R) fell by 845 persons in 2013–14, as CSG construction activity moved further afield.
Demand for other forms of accommodation in towns eased during 2013–14 as utilisation of WAVs increased. The
proportion of hotel/motel rooms in the Surat Basin that were vacant and available more than doubled from 15% in June
2013 to reach 34% in June 2014, with a notable increase in Western Downs (R) (from 6% to 43%).
The Surat Basin — at a glance
The Surat Basin comprises the local government areas
(LGAs) of Maranoa (R), Western Downs (R) and
Toowoomba (R). Development of three major coal seam
gas/liquefied natural gas (CSG/LNG) projects in the Surat
Basin has created a surge in regional employment,
largely taken up by FIFO/DIDO workers.
Population at June 2014:
Non–resident workers on-shift ............................... 14,490
Resident population estimate .............................. 207,905
Full–time equivalent population ........................... 222,395
Figure 1: Surat Basin region

Surat Basin population report, 2014 2
Non–resident workers on–shift
According to Queensland Government Statistician’s Office (QGSO)
estimates, there were 14,490 non–resident workers on–shift in the Surat
Basin in late June 2014 (Table 1). Around 63% of these (or 9,100 persons)
were counted in the LGA of Western Downs (R), while 36% (5,210 persons)
were counted in Maranoa (R), and the remaining 1% (180 persons) in
Toowoomba (R).
The region’s non-resident population grew by 2,010 persons (or 16%) in the
year to June 2014. Most of this growth occurred in Western Downs (R)
(1,615 persons or 22%), while Maranoa (R) grew by 540 persons (or 12%).
The number of non–resident workers on–shift in Toowoomba (R) declined
over this period (–145 persons or –45%).
Construction of three CSG projects in the Surat Basin continued to be the
dominant influence on the size of the region’s non-resident population during
the year to June 2014. Time series data show, however, that the growth
experienced in 2013–14 was lower than that for 2012–13 (6,035 persons or 94%), when peak expansion of CSG gas field
development and pipeline construction workforces occurred.
With construction of all three CSG projects approaching completion in 2014–15, the number of non–resident workers
on–shift in the Surat Basin is expected to fall from current levels. While FIFO/DIDO workers will form part of the subsequent
production workforces, these will be relatively small in comparison with workforces during the construction phase.
Surat Basin update, 2013–14
The Surat Basin in southern Queensland is emerging as the state’s most significant energy province, in keeping with the advanced
development of three major coal seam gas (CSG) projects in the region. The CSG industry was responsible for strong employment
growth in the Surat Basin LGAs of Western Downs (R) and Maranoa (R) during 2013–14, as project proponents increased their efforts to
complete pipeline and surface infrastructure construction according to schedule. Much of this growth took the form of additional
FIFO/DIDO contract labour, which temporarily boosted the size of the region’s non-resident population.
By the end of June 2014, all three CSG projects were at least 75% completed, with construction of gas processing facilities nearing
completion or already commissioned. All three gas transmission pipelines linking the Surat Basin to port facilities at Gladstone were
completed and undergoing commission during 2013–14 (GasFields Commission, 2014).
The Queensland Curtis LNG (QCLNG) project (Queensland Gas Company (BG Group)) is the most advanced of the three
projects, with first LNG delivery to Gladstone expected in the fourth quarter of 2014 (BG Group, 2014). The major contractor for the
project significantly expanded its Surat Basin workforce in late 2013 to complete the construction of gas infrastructure (Thiess,
2013). By April 2014, construction of the Ruby Jo central processing plant (CPP) near Dalby and six associated field compression
stations (FCS) was substantially complete. A further three CPPs and 17 FCS were under construction between Dalby and Wandoan
(Thiess, 2014). More than 2,150 gas wells were drilled and completed by the end of June 2014, more than one-third of the
6,000 wells expected for the project’s two trains (GasFields Commission, 2014).
The Gladstone LNG (GLNG) project (Santos, Petronas, Total and Kogas) in Maranoa (R) was more than 85% complete and on
track for first LNG in 2015 (GasFields Commission, 2014). Two of the three upstream gas hubs at Fairview field near Injune were
ready for commissioning by the end of June 2014 and the third near Roma was almost completed. Production teams were in place
to deliver close out, completion and commissioning of these facilities (Santos 2014a). Welding of the lateral pipeline loop linking the
Wallumbilla gas compression facilities to Santos GLNG’s gas transmission pipeline at Comet Ridge was around 60% completed by
mid-2014 (Santos, 2014b).
The Australia Pacific LNG (APLNG) project (Origin Energy, ConocoPhillips and Sinopec) was 76% complete by June 2014
(GasFields Commission, 2014), with construction of gas processing facilities at Condibri near Miles and Talinga near Chinchilla
finalised in June 2014. First LNG delivery to Gladstone is expected in mid-2015 (GasFields Commission, 2014).
A fourth CSG/LNG project planned for the region (the Surat Gas Project component of the Arrow Energy LNG Project) received
Commonwealth Government approval in December 2013, and the associated Arrow Surat Pipeline to Gladstone was approved in 2010.
While these projects are yet to reach final investment decision, Arrow Energy had a small operational workforce in Western Downs (R)
engaged in domestic CSG production and power generation.
Coal mining activity in the Surat Basin during 2013–14 was limited to five mines—Cameby Downs (Yancoal Australia), Commodore
(Millmerran Power), Kogan Creek (CS Energy), New Acland (New Acland Coal) and Wilkie Creek (Peabody Energy)—producing thermal
coal for local energy markets and for limited export. Wilkie Creek coal mine ceased production in December 2013 (Peabody 2013).
Non–resident workers on–shift
Non-resident workers are people who
fly-in/fly-out or drive-in/drive-out (FIFO/DIDO)
to work and live in the area temporarily while
rostered on, and who have their usual place
of residence elsewhere.
Due to shift arrangements, not all members of
the non-resident workforce are present in the
local area at one time. For that reason,
figures given in this report refer to the number
of non–resident workers on–shift, rather than
total non–resident workforce numbers.
Surat Basin population report, 2014 3
Table 1: Non–resident workers on–shift, Surat Basin LGAs, June
LGA
2012 2013 2014 Change, 2013 to 2014
— number — — number — — % —
Maranoa (R) 2,075 4,665 5,210 540 12
Toowoomba (R) 190 330 180 –145 –45
Western Downs (R) 4,175 7,485 9,100 1,615 22
SURAT BASIN TOTAL 6,445 12,480 14,490 2,010 16
Figures in tables have been rounded to the nearest five; see notes for details.
Source: QGSO estimates
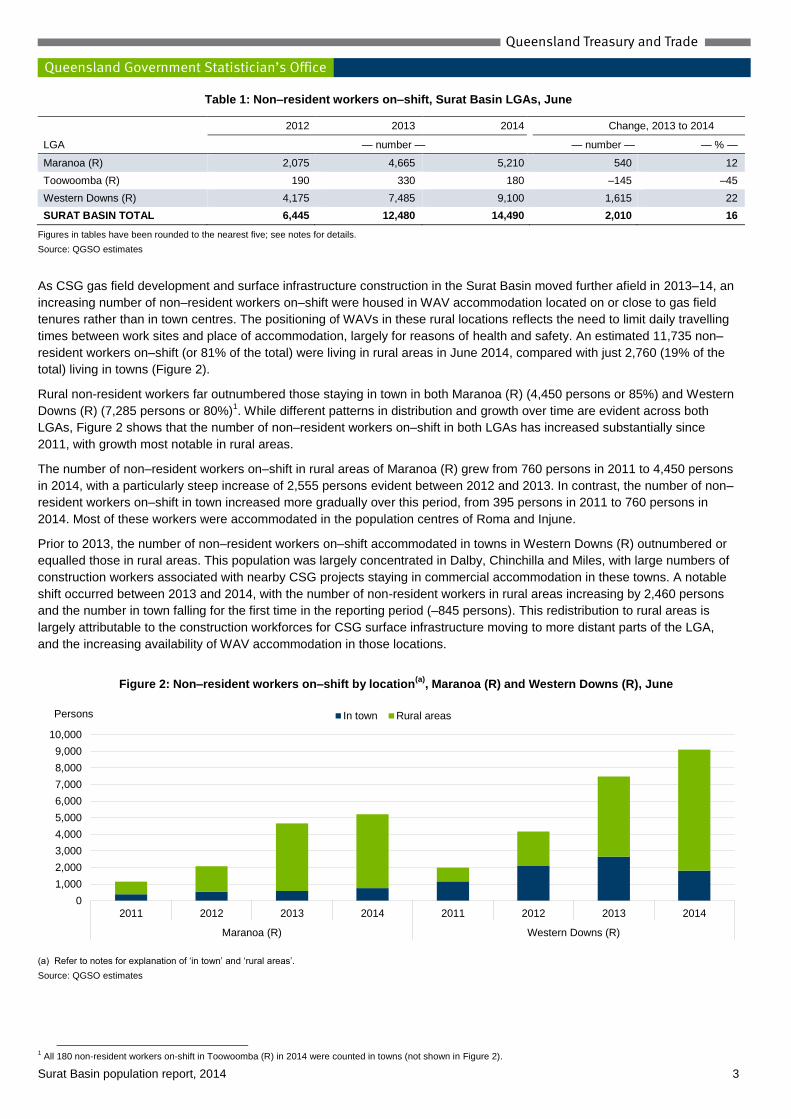
As CSG gas field development and surface infrastructure construction in the Surat Basin moved further afield in 2013–14, an
increasing number of non–resident workers on–shift were housed in WAV accommodation located on or close to gas field
tenures rather than in town centres. The positioning of WAVs in these rural locations reflects the need to limit daily travelling
times between work sites and place of accommodation, largely for reasons of health and safety. An estimated 11,735 non–
resident workers on–shift (or 81% of the total) were living in rural areas in June 2014, compared with just 2,760 (19% of the
total) living in towns (Figure 2).
Rural non-resident workers far outnumbered those staying in town in both Maranoa (R) (4,450 persons or 85%) and Western
Downs (R) (7,285 persons or 80%)1. While different patterns in distribution and growth over time are evident across both
LGAs, Figure 2 shows that the number of non–resident workers on–shift in both LGAs has increased substantially since
2011, with growth most notable in rural areas.
The number of non–resident workers on–shift in rural areas of Maranoa (R) grew from 760 persons in 2011 to 4,450 persons
in 2014, with a particularly steep increase of 2,555 persons evident between 2012 and 2013. In contrast, the number of non–
resident workers on–shift in town increased more gradually over this period, from 395 persons in 2011 to 760 persons in
2014. Most of these workers were accommodated in the population centres of Roma and Injune.
Prior to 2013, the number of non–resident workers on–shift accommodated in towns in Western Downs (R) outnumbered or
equalled those in rural areas. This population was largely concentrated in Dalby, Chinchilla and Miles, with large numbers of
construction workers associated with nearby CSG projects staying in commercial accommodation in these towns. A notable
shift occurred between 2013 and 2014, with the number of non-resident workers in rural areas increasing by 2,460 persons
and the number in town falling for the first time in the reporting period (–845 persons). This redistribution to rural areas is
largely attributable to the construction workforces for CSG surface infrastructure moving to more distant parts of the LGA,
and the increasing availability of WAV accommodation in those locations.
Figure 2: Non–resident workers on–shift by location(a)
, Maranoa (R) and Western Downs (R), June
(a) Refer to notes for explanation of ‘in town’ and ‘rural areas’.
Source: QGSO estimates
1 All 180 non-resident workers on-shift in Toowoomba (R) in 2014 were counted in towns (not shown in Figure 2).
0
1,000
2,000
3,000
4,000
5,000
6,000
7,000
8,000
9,000
10,000
2011 2012 2013 2014 2011 2012 2013 2014
Maranoa (R) Western Downs (R)
Persons In town Rural areas

Surat Basin population report, 2014 4
Full–time equivalent population estimates
In June 2014, the estimated FTE population of the Surat Basin was
222,395 persons, comprising an estimated 207,905 residents and
14,490 non–resident workers on–shift (Table 2). Non–resident workers
on–shift accounted for 27% of the FTE population in Maranoa (R), and 21%
of the FTE population of Western Downs (R). Because of its relatively large
resident population, non–resident workers on–shift made up a very small
proportion (less than 1%) of the FTE population of Toowoomba (R).
Many urban centres and localities (UC/Ls) in the Surat Basin housed
non–resident workers on–shift in 2014, boosting their total FTE populations.
Chinchilla in Western Downs (R) had the largest non-resident population
(1,165 persons), accounting for 18% of its FTE population. Roma in
Maranoa (R) had the second-largest non-resident population in town (610 persons or 8%). The majority of workers in these
towns stayed in WAVs, with smaller numbers in other commercial accommodation.
Wandoan recorded the highest proportion of non–resident workers on–shift in June 2014, with 230 workers accounting for
41% of its total FTE population of 560 persons. Other UC/Ls where the non-resident population accounted for a notable
share of the FTE included Injune (120 persons or 22%) and Miles (245 persons or 16%).
The number of non–resident workers on–shift counted in towns in Maranoa (R) (760 persons) and Western Downs (R)
(1,820 persons) in 2014 was small in comparison with the non-resident population in rural areas (4,450 persons and 7,285
persons respectively). Non–resident workers on–shift made up a sizeable proportion of the FTE population of rural areas in
both LGAs, accounting for more than half (52%) of the rural FTE in Maranoa (R) and more than one-third (36%) in Western
Downs (R). These workers were predominantly engaged in CSG drilling, construction and production activities, and were
almost all accommodated in WAVs located close to place of work.
Table 2: FTE population estimates, Surat Basin LGAs and selected UC/Ls, June 2014
LGA Location(a)
UC/L Resident
population(b)
Non–resident
workers on–shift FTE population
estimate
Maranoa (R) In town Injune 415 120 535
Roma 7,480 610 8,090
Other towns(c)
1,900 30 1,925
Rural areas 4,055 4,450 8,505
Maranoa (R) total 13,850 5,210 19,060
Toowoomba (R) In town Oakey 4,630 30 4,660
Toowoomba 103,005 125 103,130
Other towns(c)
30,025 25 30,050
Rural areas 22,905 0 22,905
Toowoomba (R) total 160,565 180 160,745
Western Downs (R) In town Chinchilla 5,150 1,165 6,315
Dalby 11,800 125 11,925
Miles 1,235 245 1,480
Tara 920 35 955
Wandoan 330 230 560
Other towns(c)
1,090 20 1,105
Rural areas 12,965 7,285 20,250
Western Downs (R) total 33,490 9,100 42,590
SURAT BASIN TOTAL 207,905 14,490 222,395
(a) Refer to notes for explanation of ‘in town’ and ‘rural areas’.
(b) QGSO estimates.
(c) UC/Ls with only one accommodation provider or fewer than 20 non-resident workers are aggregated in ‘other towns’.
Source: QGSO estimates
Full–time equivalent (FTE) population
The FTE population measure is the sum of the
resident population estimate (people who live
in the area permanently) and the number of
non–resident workers on–shift.
The FTE population provides a better measure
of total demand for certain services and
infrastructure in regions with a high incidence
of FIFO/DIDO workers.

Surat Basin population report, 2014 5
Figure 3: Surat Basin LGAs and selected UC/Ls
Source: QGSO, 2014
Surat Basin population report, 2014 6
Non–resident worker accommodation
WAVs were the predominant form of non–resident worker accommodation used across the Surat Basin in June 2014,
housing 13,640 non–resident workers on–shift (or 94% of the total) (Table 3). Other types of accommodation, including
hotels/motels and caravan parks, accounted for the remainder (850 persons or 6% of the total).
The proportion of non-resident workers accommodated in WAVs has increased markedly across the Surat Basin, growing by
16 percentage points since 2012. This trend coincides with the movement of CSG construction activity further away from
towns, and an increasing supply of temporary WAV accommodation in rural areas to house the growing workforce. As a
consequence, there has been a decreasing reliance on commercial accommodation in towns, including hotels, motels and
caravan parks, to accommodate FIFO/DIDO workforces.
Almost all non-resident workers in Maranoa (R) (4,975 persons or 96% of the total) and Western Downs (R) (8,670 persons
or 95% of the total) stayed in WAVs while on-shift in 2014. The share of non–resident workers on–shift in WAVs has
increased across both LGAs since 2012. Maranoa (R) recorded a particularly large increase between 2012 and 2013 (from
77% to 93%), while notable growth in Western Downs (R) occurred between 2013 and 2014 (from 88% to 95%).
Table 3: Non–resident workers on–shift by accommodation type, Surat Basin LGAs, June
LGA
WAVs Other(a)
Total Non–resident workers on–shift in WAVs
2014 2012 2013 2014
— number — — % —
Maranoa (R) 4,975 235 5,210 77 93 96
Toowoomba (R) 0 180 180 0 6 0
Western Downs (R) 8,670 435 9,100 82 88 95
SURAT BASIN TOTAL 13,640 850 14,490 78 88 94
(a) ‘Other’ includes hotels/motels, caravan parks and other accommodation. Refer to notes for additional information on hotels/motels.
Source: QGSO estimates
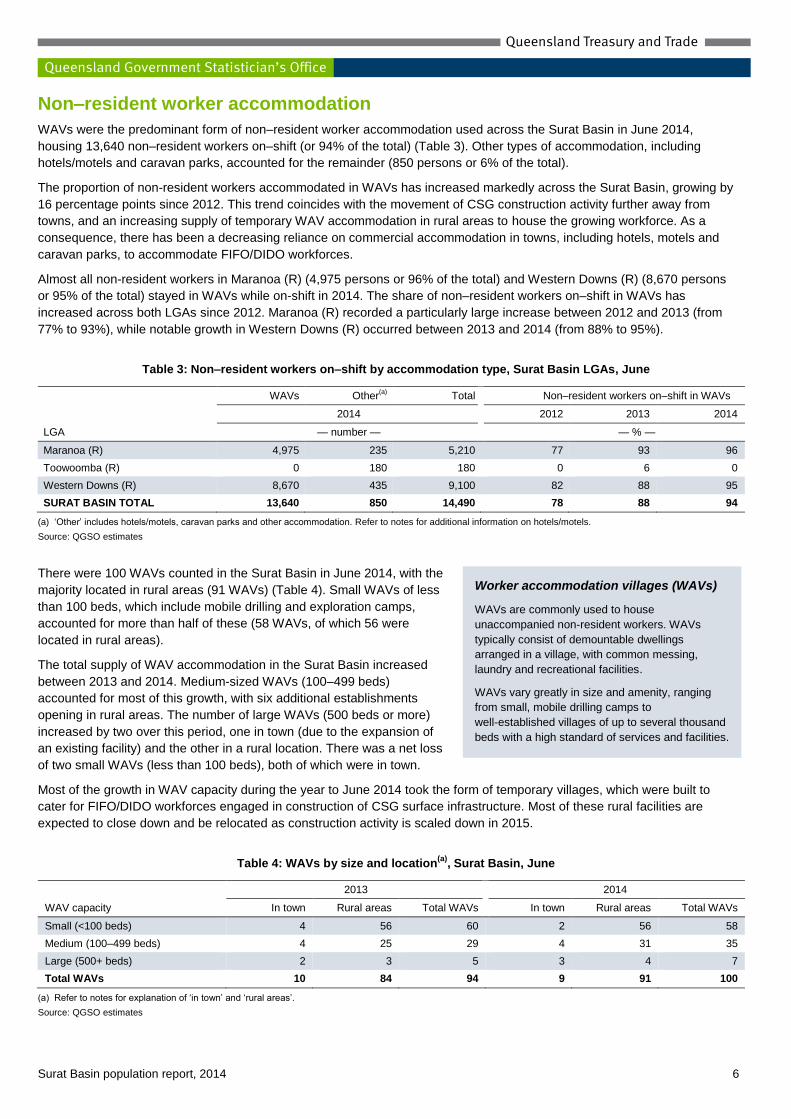
There were 100 WAVs counted in the Surat Basin in June 2014, with the
majority located in rural areas (91 WAVs) (Table 4). Small WAVs of less
than 100 beds, which include mobile drilling and exploration camps,
accounted for more than half of these (58 WAVs, of which 56 were
located in rural areas).
The total supply of WAV accommodation in the Surat Basin increased
between 2013 and 2014. Medium-sized WAVs (100–499 beds)
accounted for most of this growth, with six additional establishments
opening in rural areas. The number of large WAVs (500 beds or more)
increased by two over this period, one in town (due to the expansion of
an existing facility) and the other in a rural location. There was a net loss
of two small WAVs (less than 100 beds), both of which were in town.
Most of the growth in WAV capacity during the year to June 2014 took the form of temporary villages, which were built to
cater for FIFO/DIDO workforces engaged in construction of CSG surface infrastructure. Most of these rural facilities are
expected to close down and be relocated as construction activity is scaled down in 2015.
Table 4: WAVs by size and location(a)
, Surat Basin, June
WAV capacity
2013 2014
In town Rural areas Total WAVs In town Rural areas Total WAVs
Small (<100 beds) 4 56 60 2 56 58
Medium (100–499 beds) 4 25 29 4 31 35
Large (500+ beds) 2 3 5 3 4 7
Total WAVs 10 84 94 9 91 100
(a) Refer to notes for explanation of ‘in town’ and ‘rural areas’.
Source: QGSO estimates
Worker accommodation villages (WAVs)
WAVs are commonly used to house
unaccompanied non-resident workers. WAVs
typically consist of demountable dwellings
arranged in a village, with common messing,
laundry and recreational facilities.
WAVs vary greatly in size and amenity, ranging
from small, mobile drilling camps to
well-established villages of up to several thousand
beds with a high standard of services and facilities.
Surat Basin population report, 2014 7
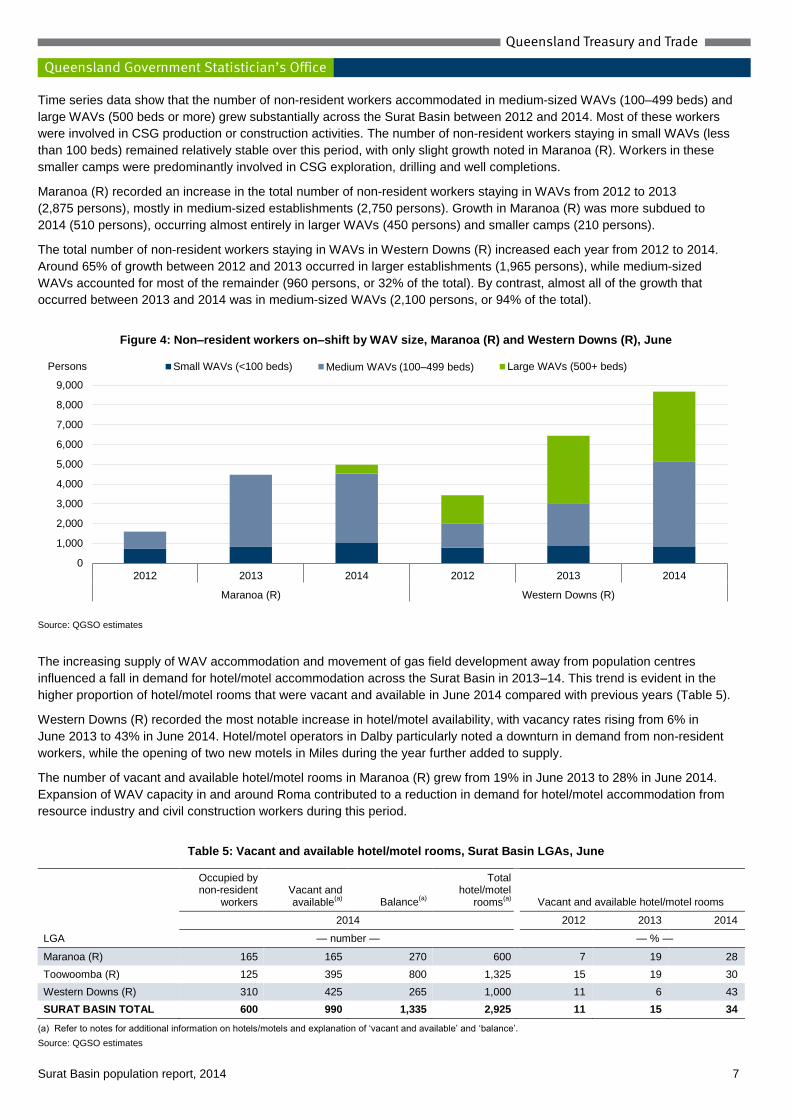
Time series data show that the number of non-resident workers accommodated in medium-sized WAVs (100–499 beds) and
large WAVs (500 beds or more) grew substantially across the Surat Basin between 2012 and 2014. Most of these workers
were involved in CSG production or construction activities. The number of non-resident workers staying in small WAVs (less
than 100 beds) remained relatively stable over this period, with only slight growth noted in Maranoa (R). Workers in these
smaller camps were predominantly involved in CSG exploration, drilling and well completions.
Maranoa (R) recorded an increase in the total number of non-resident workers staying in WAVs from 2012 to 2013
(2,875 persons), mostly in medium-sized establishments (2,750 persons). Growth in Maranoa (R) was more subdued to
2014 (510 persons), occurring almost entirely in larger WAVs (450 persons) and smaller camps (210 persons).
The total number of non-resident workers staying in WAVs in Western Downs (R) increased each year from 2012 to 2014.
Around 65% of growth between 2012 and 2013 occurred in larger establishments (1,965 persons), while medium-sized
WAVs accounted for most of the remainder (960 persons, or 32% of the total). By contrast, almost all of the growth that
occurred between 2013 and 2014 was in medium-sized WAVs (2,100 persons, or 94% of the total).
Figure 4: Non–resident workers on–shift by WAV size, Maranoa (R) and Western Downs (R), June
Source: QGSO estimates
The increasing supply of WAV accommodation and movement of gas field development away from population centres
influenced a fall in demand for hotel/motel accommodation across the Surat Basin in 2013–14. This trend is evident in the
higher proportion of hotel/motel rooms that were vacant and available in June 2014 compared with previous years (Table 5).
Western Downs (R) recorded the most notable increase in hotel/motel availability, with vacancy rates rising from 6% in
June 2013 to 43% in June 2014. Hotel/motel operators in Dalby particularly noted a downturn in demand from non-resident
workers, while the opening of two new motels in Miles during the year further added to supply.
The number of vacant and available hotel/motel rooms in Maranoa (R) grew from 19% in June 2013 to 28% in June 2014.
Expansion of WAV capacity in and around Roma contributed to a reduction in demand for hotel/motel accommodation from
resource industry and civil construction workers during this period.
Table 5: Vacant and available hotel/motel rooms, Surat Basin LGAs, June
LGA
Occupied by non-resident
workers Vacant and available
(a) Balance
(a)
Total hotel/motel
rooms(a)
Vacant and available hotel/motel rooms
2014 2012 2013 2014
— number — — % —
Maranoa (R) 165 165 270 600 7 19 28
Toowoomba (R) 125 395 800 1,325 15 19 30
Western Downs (R) 310 425 265 1,000 11 6 43
SURAT BASIN TOTAL 600 990 1,335 2,925 11 15 34
(a) Refer to notes for additional information on hotels/motels and explanation of ‘vacant and available’ and ‘balance’.
Source: QGSO estimates
0
1,000
2,000
3,000
4,000
5,000
6,000
7,000
8,000
9,000
2012 2013 2014 2012 2013 2014
Maranoa (R) Western Downs (R)
Persons Small WAVs (<100 beds) Medium WAVs (100–499 beds) Large WAVs (500+ beds)

Surat Basin population report, 2014 8
Notes
(R) – Regional Council (S) – Shire UC/L – Urban Centre/Locality
Data in this report are derived from surveys conducted by QGSO in 2014 and other sources. The Survey of Accommodation Providers counted non-resident workers staying in worker accommodation villages (WAVs), hotels, motels, caravan parks and other commercial accommodation on a medium to long-term basis during the last week of June 2014. Short-term and overnight visitors are not regarded as non-resident workers. The Resource Operations Employment Survey collected workforce information from all resource companies with existing operations and projects in the Surat Basin as at June 2014.
Non-resident workers are people who fly-in/fly-out or drive-in/drive-out (FIFO/DIDO) to work and live in the area temporarily while rostered on, and who have their usual place of residence elsewhere. Non-resident workers include FIFO/DIDO mining and gas industry employees and contractors, construction workers and associated sub-contractors. Figures in this report refer to the number of non–resident workers on–shift, or present in the area at a given point in time, and should not be confused with total non–resident workforce numbers.
Data for non–resident workers on–shift presented in this report are a point in time measure, based on best information available at the time of survey. Non–resident worker numbers may vary in response to changing production demands, prevailing weather and industrial disputes. At the time of the 2014 survey, the number of non–resident workers on–shift in the Surat Basin was unaffected by adverse weather events or industrial actions.
Resident population estimates for 2014 are QGSO estimates.
‘In town’ includes populations counted in defined urban centres and localities (UC/Ls) and non–resident workers on–shift within 5km of town. ‘Rural areas’ include populations outside of defined UC/Ls, including non-resident workers more than 5km from town.
WAVs within 5km of a UC/L are included ‘in town’. WAVs more than 5km from a UC/L are allocated to ‘rural areas’.
Hotels/motels include serviced apartments and other rental accommodation occupied by non-resident workers.
‘Vacant and available’ refers to hotel/motel rooms that were not occupied by non–resident workers on–shift or other guests, and were vacant and available on the night of the survey. ‘Balance’ includes hotel/motel rooms occupied by short-term visitors, held for non-resident workers under permanent booking arrangements but not actually occupied on the night of the survey, or otherwise unavailable to prospective guests.
Figures in tables (except Table 4) have been rounded to the nearest five. As a result of rounding, discrepancies may occur between sums of the component items and totals. Percentages and other calculations are made prior to rounding of figures and discrepancies might therefore exist between these calculations and those that could be derived from the rounded figures.
References
BG Group (2014) BG Group Data Book 2014 http://www.bg-group.com/databook/2014/40/where-we-work/australia/
GasFields Commission Queensland (2014) CSG–LNG Projects Update – as at end of June Quarter 2014 http://www.gasfieldscommissionqld.org.au/resources/gasfields/csg-lng-project-update-jun-2014.pdf
Peabody (2013) Peabody Energy Announces Closure of Wilkie Creek Mine in Australia http://www.peabodyenergy.com/investor-news-release-details.aspx?nr=231
Santos (2014a) Santos GLNG takes charge of gas compressor stations http://www.santosglng.com/the-project/project-update-august-september-2014/santos-glng-takes-charge-of-gas-compressor-stations.aspx
Santos (2014b) Progress at a glance http://www.santosglng.com/the-project/project-update-august-september-2014/read-progress-at-a-glance.aspx
Thiess (2013) Thiess and QGC sign landmark QCLNG contract, 6 September 2013 http://www.thiess.com.au/files/documents/Thiess%20QCLNG%20Release.pdf
Thiess (2014) Major Milestone for QCLNG http://www.thiess.com.au/news/2014/qclng-tackling-the-tyranny-of-distance
Queensland Government Statistician’s Office http://creativecommons.org/licenses/by/3.0/au Queensland Treasury and Trade © The State of Queensland www.qgso.qld.gov.au (Queensland Treasury and Trade) 2014