Embed Size (px)
Citation preview

Supporting Information
Photolytic, Radical-Mediated Hydrophosphination: A Convenient Post-Polymerisation Modification Route to P-
Di(organosubstituted) Polyphosphinoboranes [RR’PBH2]n
Alastair W. Knights,a Saurabh S. Chitnis,a, b Ian Mannersa,c
aSchool of Chemistry, University of Bristol, Cantock’s Close, BS8 1TS, United
Kingdom
bDepartment of Chemistry, Dalhousie University, Halifax, NS B3H 4R2, Canada
cDepartment of Chemistry, University of Victoria, Victoria, BC V8W 2Y2,
Canada. Email: [email protected]
Electronic Supplementary Material (ESI) for Chemical Science.This journal is © The Royal Society of Chemistry 2019

S2
Contents
1. General procedures, reagents, and equipment ..................................................................... 4
2. Procedures for the hydrophosphination of 1-octene using poly(phenylphosphinoborane) 6
2.1. General NMR scale reaction conditions for Table 1 ....................................................... 6
2.2. Attempted hydrophosphination by means of irradiation with blue light ...................... 6
2.3. Hydrophosphination of 1-octene by poly(phenylphosphinoborane) in the presence of
AIBN ........................................................................................................................................ 6
3. Investigations into the mechanism of the hydrophosphination of 1-octene using
poly(phenylphosphinoborane) .................................................................................................. 8
3.1. Hydrophosphination of 1-octene using poly(phenylphosphinoborane) in the presence
of DMPAP vs DMPAP and TEMPO .......................................................................................... 8
3.2. Mass spectrum after the irradiation of DMPAP with TEMPO ......................................... 9
3.3. Hydrophosphination reaction using N-tert-butyl-N-(2-methyl-1-phenylpropyl)-O-(1-
phenylethyl)hydroxylamine ................................................................................................. 10
3.4. Irradiation of poly(phenylphosphinoborane) with DMPAP and TEMPO ...................... 10
4. Synthesis and characterisation of P-disubstituted polyphosphinoboranes ........................ 12
4.1. General procedure for isolation of modified polyphosphinoborane derivatives: ........ 12
4.2. Synthesis and characterisation of polymer 2 ................................................................ 12
4.3. Synthesis and characterisation of polymer 3 ................................................................ 16
4.4. Synthesis and characterisation of polymer 4 ................................................................ 20
4.5. Synthesis and characterisation of polymer 5 ................................................................ 24
4.6. Synthesis and characterisation of polymer 6 ................................................................ 28
4.7. Synthesis and characterisation of polymer 7 ................................................................ 33
4.8. Synthesis and characterisation of polymer 8 ................................................................ 37
5. Synthesis and characterisation of crosslinked polyphosphinoborane ................................ 42
5.1. Irradiation of [PhHPBH2]n with DMPAP (10 mol%) in the absence of alkene. .............. 42

S3
5.2. Synthesis and characterisation of crosslinked poly(phenylphosphinoborane) ............ 42
5.3. Swellability of crosslinked poly(phenylphosphinoborane) ........................................... 45
6. Synthesis of a water-soluble bottlebrush polymer.............................................................. 46
6.1. Synthesis and characterisation of bottlebrush polymer 9 ............................................ 46
7. References ........................................................................................................................... 53

S4
1. General procedures, reagents, and equipment
All air and water-sensitive manipulations were carried out in glassware under a nitrogen
atmosphere using standard Schlenk line and glovebox techniques. Glassware was dried in an
oven at 200 °C overnight prior to use. Anhydrous solvents were dried via a Grubbs design
purification system. Anhydrous, deuterated solvents were purchased from Sigma Aldrich, and
stored over activated molecular sieves (4Å). PhH2-PBH3,1 CpFe(CO)2OTf,2 and [PhHPBH2]n3
were synthesised via literature procedures. All other commercially available compounds were
used without further purification.
Photoirradiation experiments under ultraviolet (UV) light were carried out with Pyrex-glass
filtered emission from a 125 W medium pressure mercury lamp. The emission lines of the
mercury lamp are: 577-579, 546, 436, 408-405, 366-365, 334, 313, 302, 297, 289, 270, 265,
254 nm. Experiments under blue light were performed using a 3 W lamp, emissions 450-495
nm.
NMR spectra were recorded using Oxford Jeol ECS 400 MHz, Bruker Nano 400 MHz, Bruker
Avance III HD 500 MHz Cryo, or Varian VNMR 500 MHz spectrometers. 1H and 13C NMR spectra
were reference to residual signals of the solvent (CDCl3: 1H: δ = 7.24, 13C: δ = 77.0; C6D5H: 1H:
δ = 7.20, 13C: δ = 128.0). 11B, 19F, and 31P NMR spectra were referenced to external standards
(11B: BF3·OEt2 (δ = 0.0); 19F: CFCl3 (δ = 0.0); 31P: 85% H3PO4(aq) (δ = 0.0)). Chemical shifts ()
are given in parts per million (ppm), and coupling constants (J) are given in Hertz (Hz), rounded
to the nearest 0.5 Hz.
Electrospary ionisation (ESI) mass spectra were recorded using a Waters Synapt G2S
spectrometer by NanoSpray Ionisation. Solutions (40 μL) of approximately 1 mg mL-1 were
loaded into the sample tray, and aliquots of 3 μL were introduced into the spectrometer using
a spray voltage of 1.5 kV. Positive and negative ion spectra were recorded at a rate of one
scan per second and summed to produce the final spectra. MALDI-TOF MS was performed
using a Bruker Ultraflextreme running in reflector mode. Samples were prepared using a
trans-2-(3-(4-tert-butylphenyl)-2-methyl-2-propenylidene) malononitrile matrix (20 mg/mL in
THF) which was mixed with the polymer sample (2 mg/mL in THF), in a 10:1 (v:v) ratio.
Approximately 1 μL of the mixed solution was deposited onto a MALDI-TOF MS sample plate
and allowed to dry in air prior to analysis.

S5
Gel permeation chromatography (GPC) was performed on a Malvern RI max Gel Permeation
Chromatograph, equipped with an automatic sampler, pump, injector, and inline degasser.
The columns (T5000) were contained within an oven (35 °C) and consisted of styrene / divinyl
benzene gels. Sample elution was detected by means of a differential refractometer. THF
(Fisher) containing 0.1 %w/w [n-Bu4N][Br] was used as the eluent at a flow rate of 1 mL/min.
Samples were dissolved in THF (2 mg/mL) and filtered with a Ministart SRP15 filter
(poly(tetrafluoroethylene) membrane of 0.45 μm pore size) before analysis. The calibration
was conducted using monodisperse polystyrene standards obtained from Aldrich. The lowest
and highest molecular weight standards used were 2,300 Da and 994,000 Da respectively.
Differential scanning calorimetry (DSC) thermograms were measured using a Thermal
Advantage DSCQ100 coupled to a RCS90 refrigerated cooling system with a heating/cooling
rate of 10 °C/min. DSC samples were placed in hermetic aluminium pans for analysis.
Thermal gravimetric analysis (TGA) was carried out using a Thermal Advantage TGAQ500 with
a heating rate of 10 °C/min under a nitrogen atmosphere. Samples were placed in platinum
pans for analysis. DSC and TGA results were analysed using WinUA V4.5A by Thermal
Advantage.
Dynamic light scattering (DLS) experiments were carried out using a Malvern Zetasizer Nano
S instrument using a 5 mW He-Ne laser (λ = 632 nm) at 20 °C. Samples dissolved in THF (1
mg/mL) were filtered through a 0.45 μm into an optical glass cuvette prior to analysis.

S6
2. Procedures for the hydrophosphination of 1-octene using
poly(phenylphosphinoborane)
2.1. General NMR scale reaction conditions for Table 1
An NMR tube was charged with polyphosphinoborane (0.2 mmol), 1-octene (0.2 mmol), and
solvent (0.5 mL) and any additive specified. The solution was irradiated ca. 3 cm away from a
mercury lamp. After the specified amount of time, a 31P NMR spectrum was recorded of the
crude reaction mixture and the conversion calculated from the integration of the signals.
2.2. Attempted hydrophosphination by means of irradiation with blue light
Poly(phenylphosphinoborane) (49 mg, 0.4 mmol), 1-octene (62.8 μL, 0.4 mmol),
diphenyliodonium triflate (86 mg, 0.2 mmol), 9-mesityl-10-methylacridinium perchlorate (0.8
mg, 2x10⁻³ mmol), and toluene (2 mL) were added to a Schlenk flask equipped with a magnetic
stirrer. The resultant solution was irradiated ca. 3 cm away from a 3 W blue light emitting
lamp for 16 h, after which an in situ 31P NMR spectrum was obtained to determine reaction
conversion (Table S1, entry 2).
The analogous reaction with no diphenyliodonium triflate or 9-mesityl-10-methylacridinium
perchlorate present was also attempted (Table S1, entry 1). In this case no reaction was
observed.
Table S1. Hydrophosphination attempts using blue light irradiation.
Entry Additives Temperature (°C) Time Conversiona
1 None 20 16 h 0
2 [Ph2I][OTf],
photocatalyst
20 16 h 25
aDetermined by 31P NMR integrations, conversion = x / (x + y) × 100
2.3. Hydrophosphination of 1-octene by poly(phenylphosphinoborane) in the presence of
AIBN
An NMR tube was charged with polyphosphinoborane (0.1 mmol), 1-octene (0.1 mmol), AIBN
(0.01 mmol) and THF (0.5 mL). The solution was heated to 60 °C for 27 h and then analysed
by 31P NMR spectroscopy.

S7
Figure S1. In situ 31P NMR spectrum (122MHz) of the hydrophosphination reaction of 1-octene using poly(phenylphosphinoborane) in the presence of AIBN after 27 h.

S8
3. Investigations into the mechanism of the hydrophosphination of
1-octene using poly(phenylphosphinoborane)
3.1. Hydrophosphination of 1-octene using poly(phenylphosphinoborane) in the presence of
DMPAP vs DMPAP and TEMPO
Two NMR tubes were charged with polyphosphinoborane (0.2 mmol), 1-octene (0.2 mmol),
DMPAP (0.02 mmol), THF (0.5 mL). To one was added TEMPO (0.02 mmol). The solutions were
irradiated ca. 3 cm away from a mercury lamp for 10 min and then analysed by 31P NMR
spectroscopy. The samples were then irradiated for a further 50 minutes and analysed again
by 31P NMR.
Figure S2. In situ 31P NMR spectra (122MHz) taken after 10 min of the hydrophosphination of 1-octene using poly(phenylphosphinoborane) in the presence of DMPAP (top) or DMPAP and TEMPO (bottom).

S9
Figure S3. In situ 31P NMR spectra (122MHz) taken after 1 h of the hydrophosphination of 1-octene using poly(phenylphosphinoborane) in the presence of DMPAP (top) or DMPAP and TEMPO (bottom).
3.2. Mass spectrum after the irradiation of DMPAP with TEMPO
Figure S4. ESI-MS (+) of the reaction of DMPAP and TEMPO in THF.

S10
3.3. Hydrophosphination reaction using N-tert-butyl-N-(2-methyl-1-phenylpropyl)-O-(1-
phenylethyl)hydroxylamine
An NMR tube was charged with poly(phenylphosphinoborane) (0.1 mmol), 1-octene (0.1
mmol), N-tert-butyl-N-(2-methyl-1-phenylpropyl)-O-(1-phenylethyl)hydroxylamine (0.01
mmol) and toluene (0.5 mL). The solution was heated to 100 °C and monitored by 31P NMR
spectroscopy.
Figure S5. In situ 31P NMR spectra of the hydrophosphination of 1-octene using poly(phenylphosphinoborane) in the presence of N-tert-butyl-N-(2-methyl-1-phenylpropyl)-O-(1-phenylethyl)hydroxylamine.
3.4. Irradiation of poly(phenylphosphinoborane) with DMPAP and TEMPO
To an NMR tube was added poly(phenylphosphinoborane) (0.2 mmol), DMPAP (0.2 mmol),
TEMPO (0.2 mmol) and THF (0.5 mL). This was irradiated at 20 °C for 4 h and then the crude
reaction mixture was analysed by 31P NMR spectroscopy (Figure S6). Subsequently, 1-octene
(0.2 mmol) was added and the mixture irradiated for a further 2 h and then again analysed by
31P NMR (Figure S7).
21 h
3.5 h
2 h
1.5 h
1 h
0.5 h

S11
Figure S6. In situ 31P{H} NMR spectra of the reaction between poly(phenylphosphinoborane), DMPAP and TEMPO after 4 h UV irradiation at 20 °C.
Figure S7. In situ 31P{H} NMR spectra after 1 eq. 1-octene was added to the reaction mixture and it was irradiated for a further 2 h at 20 °C.

S12
4. Synthesis and characterisation of P-disubstituted
polyphosphinoboranes
4.1. General procedure for isolation of modified polyphosphinoborane derivatives:
Polyphenylphosphinoborane (2 mmol), alkene (various equivalents), (DMPAP) (0.2 mmol),
TEMPO (0.2 mmol), and THF (5 mL) were added to a 14 mL vial equipped with a magnetic
stirrer. The resultant solution was irradiated ca. 3 cm away from a mercury lamp. Volatiles
were then removed under vacuum and the resultant solid was purified by precipitation (see
specific syntheses for details). The polymer was then dried under vacuum at 40 °C for a
minimum of 16 h.
4.2. Synthesis and characterisation of polymer 2
Poly(phenylphosphinoborane) (244 mg, 2 mmol), 1-octene (31.4 μL, 0.2 mmol), DMPAP (51
mg, 0.2 mmol), TEMPO (31 mg, 0.2 mmol), and THF (5 mL) were added to a 14 mL vial
equipped with a magnetic stirrer. The resultant solution was irradiated ca. 3 cm away from a
mercury lamp for 2 h. Volatiles were then removed under vacuum and the resultant solid was
purified by precipitation from DCM into pentane at -78 °C (3 × 25 mL). The polymer was then
dried under vacuum at 40 °C for 48 h yielding 2 as an orange solid (conversion: 8%; yield: 159
mg, 61%). Spectroscopic data: 1H NMR (400 MHz, CDCl3) δ 7.50 – 6.88 (br m, ArH), 4.28 (br d,
J = 360 Hz), 1.83 – 0.68 (br m, CH2, CH3, BH2); 11B NMR (128 MHz, CDCl3) δ -34.5 (br s); 31P
NMR (162 MHz, CDCl3) δ -23.6 (s, 8%, PhRPBH2), -48.7 (d, J = 358 Hz, 92%, PhHPBH2); GPC (2
mg/mL) Mn = 130,000 Da, PDI = 1.9; T5% = 160 °C; ceramic yield = 51%; Tg = 30 °C.

S13
Figure S8. 1H NMR spectrum (400 MHz, CDCl3) of 2. Deuterated chloroform residual signal denoted by *.
Figure S9. 11B (left) and 11B{H} (right) NMR spectra (128 MHz, CDCl3) of 2.
Figure S10. 31P (left) and 31P{H} (right) NMR spectra (162 MHz, CDCl3) of 2.
*
b + e
d
a + c + f

S14
Figure S11. ESI-MS (+) of 2 in DCM.
Figure S12. GPC chromatogram of 2 (2 mg/mL in THF, 0.1 w/w % n-Bu4NBr in the THF eluent).
10 15 20
-0.5
0.0
0.5
1.0
1.5
No
rma
lize
d I
nte
nsity (
a.u
.)
Elution Time (min)
234.2
122.0
122.0
234.2
234.2

S15
Figure S13. TGA thermogram of 2 (heating rate: 10 °C/min).
Figure S14. DSC thermogram of 2, first cycle excluded (heating rate: 10 °C/min).
0 100 200 300 400 500 600
50
60
70
80
90
100
We
igh
t (%
)
Temperature (°C )

S16
Figure S15. Photograph of isolated 2.
4.3. Synthesis and characterisation of polymer 3
Poly(phenylphosphinoborane) (1) (244 mg, 2 mmol), 1-octene (157 μL, 1.2 mmol), DMPAP (51
mg, 0.2 mmol), TEMPO (31 mg, 0.2 mmol), and THF (5 mL) were added to a 14 mL vial
equipped with a magnetic stirrer. The resultant solution was irradiated ca. 3 cm away from a
mercury lamp for 2 h. Volatiles were then removed under vacuum and the resultant solid was
purified by precipitation from THF into H2O/isopropanol (1:1 v/v) at -20 °C (3 x 25 mL). The
polymer was then dried under vacuum at 40 °C for 48 h yielding 3 as an orange solid
(conversion: 64%; yield: 293 mg, 76%). Spectroscopic data: 1H NMR (400 MHz, CDCl3) δ 7.51
– 6.80 (br m, ArH), 4.12 (br d, J = 355 Hz, PhPH), 1.75 – 0.58 (br m, CH2, CH3, BH2); 11B NMR
(128 MHz, CDCl3) δ -32.7 (br s); 31P NMR (162 MHz, CDCl3) δ -24.0 (s, 64%, PhRPBH2), -48.1 (d,
J = 359 Hz, 36%, PhHPBH2); GPC (2 mg/mL) Mn = 130,000 Da, PDI = 1.5; T5% = 208 °C; ceramic
yield = 27%; Tg = 15 °C.

S17
Figure S16. 1H NMR spectrum (400 MHz, CDCl3) of 3. Deuterated chloroform residual signal
denoted by *
Figure S17. 11B (left) and 11B{H} (right) NMR spectra (128 MHz, CDCl3) of 3.
b + e
d
a + c + f
*
S18
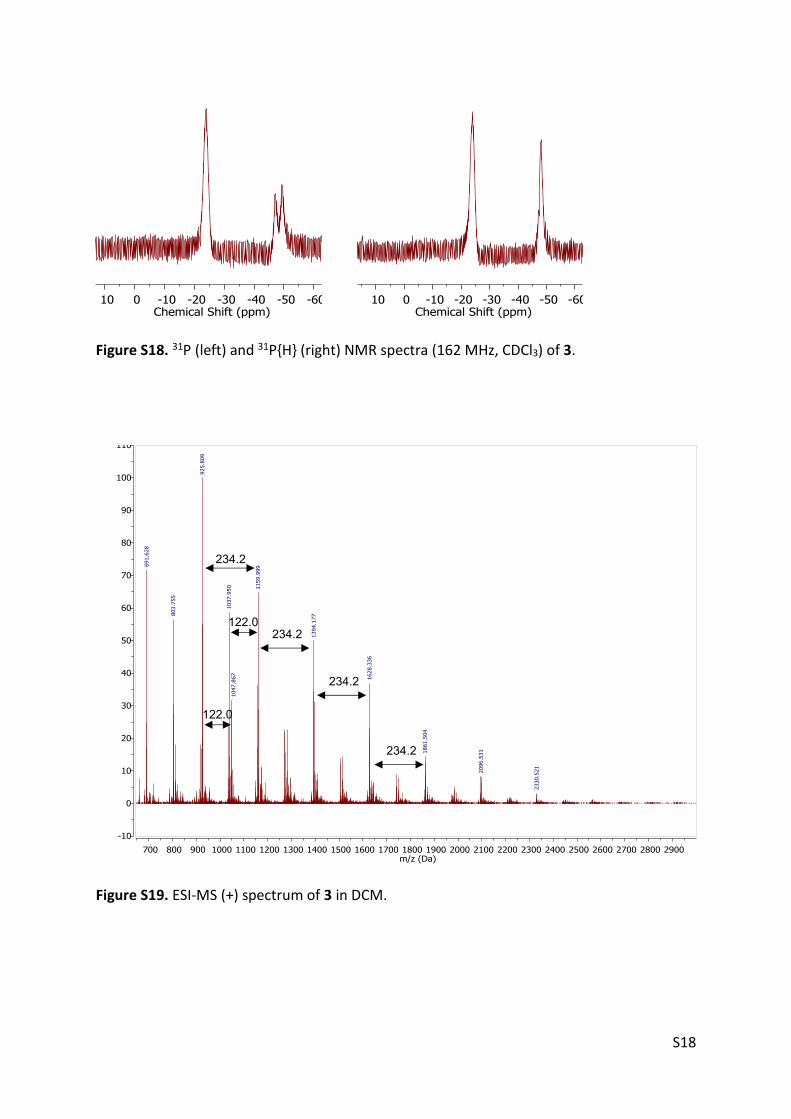
Figure S18. 31P (left) and 31P{H} (right) NMR spectra (162 MHz, CDCl3) of 3.
Figure S19. ESI-MS (+) spectrum of 3 in DCM.
234.2
122.0 234.2
234.2
234.2
122.0

S19
Figure S20. GPC chromatogram of 3 (2 mg/mL in THF, 0.1 w/w % n-Bu4NBr in the THF eluent).
Figure S21. TGA thermogram of 3 (heating rate: 10 °C/min).
10 15 20
-0.5
0.0
0.5
1.0
1.5N
orm
aliz
ed I
nte
nsity (
a.u
.)
Elution Time (min)
0 100 200 300 400 500 600
20
30
40
50
60
70
80
90
100
110
We
igh
t (%
)
Temperature (°C)

S20
Figure S22. DSC thermogram of 3, first cycle excluded (heating rate: 10 °C/min).
Figure S23. Photograph of isolated 3.
4.4. Synthesis and characterisation of polymer 4
Poly(phenylphosphinoborane) (244 mg, 2 mmol), 1-octene (159 μL, 2 mmol), DMPAP (51 mg,
0.2 mmol), TEMPO (31 mg, 0.2 mmol), and THF (5 mL) were added to a 14 mL vial equipped
with a magnetic stirrer. The resultant solution was irradiated ca. 3 cm away from a mercury
lamp for 2 h. Volatiles were then removed under vacuum and the resultant solid was purified

S21
by precipitation from THF into H2O/isopropanol (1:1 v/v) at -20 °C (3 x 25 mL). The polymer
was then dried under vacuum at 40 °C for 48 h yielding 4 as a gummy orange solid (conversion:
76%; yield: 305 mg, 72 %). Spectroscopic data: 1H NMR (400 MHz, CDCl3) δ 7.64 – 6.89 (br m,
ArH), 4.10 (br d, J = 343 Hz, PhPH), 2.02 – 0.59 (br m, CH2, CH3, BH2); 11B NMR (128 MHz, CDCl3)
δ -32.5 (br s); 31P NMR (162 MHz, CDCl3) δ -24.0 (s, 76%, PhRPBH2), -48.2 (d, J = 356.0 Hz, 24%,
PhHPBH2); GPC (2 mg/mL) Mn = 81,000 Da, PDI = 1.2 T5% = 197 °C; ceramic yield = 20%; Tg = 9
°C.
Figure S24. 1H NMR spectrum (400 MHz, CDCl3) of 4. Deuterated chloroform residual signal denoted by *.
Figure S25. 11B (left) and 11B{H} (right) NMR spectra (128 MHz, CDCl3) of 4.
b + e
d
a + c + f
*

S22
Figure S26. 31P (left) and 31P{H} (right) NMR spectra (162 MHz, CDCl3) of 4.
Figure S27. GPC chromatogram of 4 (2 mg/mL in THF, 0.1 w/w % n-Bu4NBr in the THF eluent).
10 15 20
-0.4
-0.2
0.0
0.2
0.4
0.6
0.8
1.0
1.2
1.4
No
rma
lize
d in
ten
sity (
a.u
.)
Elution Time (min)

S23
Figure S28. ESI-MS (+) spectrum of 4 in DCM.
Figure S29. TGA thermogram of 4 (heating rate: 10 °C/min).
0 100 200 300 400 500 600
20
40
60
80
100
We
igh
t (%
)
Temperature (°C)

S24
Figure S30. DSC thermogram of 4, first cycle excluded (heating rate: 10 °C/min).
Figure S31. Photographs of isolated 4.
4.5. Synthesis and characterisation of polymer 5
S25
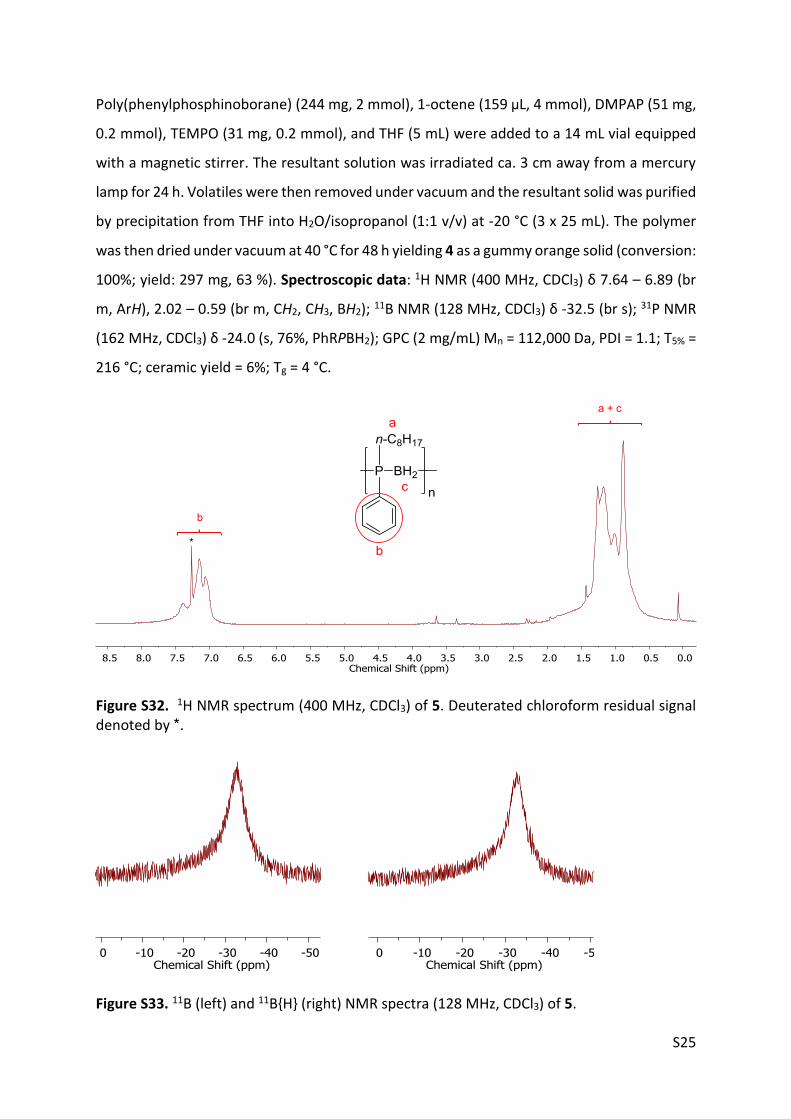
Poly(phenylphosphinoborane) (244 mg, 2 mmol), 1-octene (159 μL, 4 mmol), DMPAP (51 mg,
0.2 mmol), TEMPO (31 mg, 0.2 mmol), and THF (5 mL) were added to a 14 mL vial equipped
with a magnetic stirrer. The resultant solution was irradiated ca. 3 cm away from a mercury
lamp for 24 h. Volatiles were then removed under vacuum and the resultant solid was purified
by precipitation from THF into H2O/isopropanol (1:1 v/v) at -20 °C (3 x 25 mL). The polymer
was then dried under vacuum at 40 °C for 48 h yielding 4 as a gummy orange solid (conversion:
100%; yield: 297 mg, 63 %). Spectroscopic data: 1H NMR (400 MHz, CDCl3) δ 7.64 – 6.89 (br
m, ArH), 2.02 – 0.59 (br m, CH2, CH3, BH2); 11B NMR (128 MHz, CDCl3) δ -32.5 (br s); 31P NMR
(162 MHz, CDCl3) δ -24.0 (s, 76%, PhRPBH2); GPC (2 mg/mL) Mn = 112,000 Da, PDI = 1.1; T5% =
216 °C; ceramic yield = 6%; Tg = 4 °C.
Figure S32. 1H NMR spectrum (400 MHz, CDCl3) of 5. Deuterated chloroform residual signal denoted by *.
Figure S33. 11B (left) and 11B{H} (right) NMR spectra (128 MHz, CDCl3) of 5.
b
a + c
*
S26
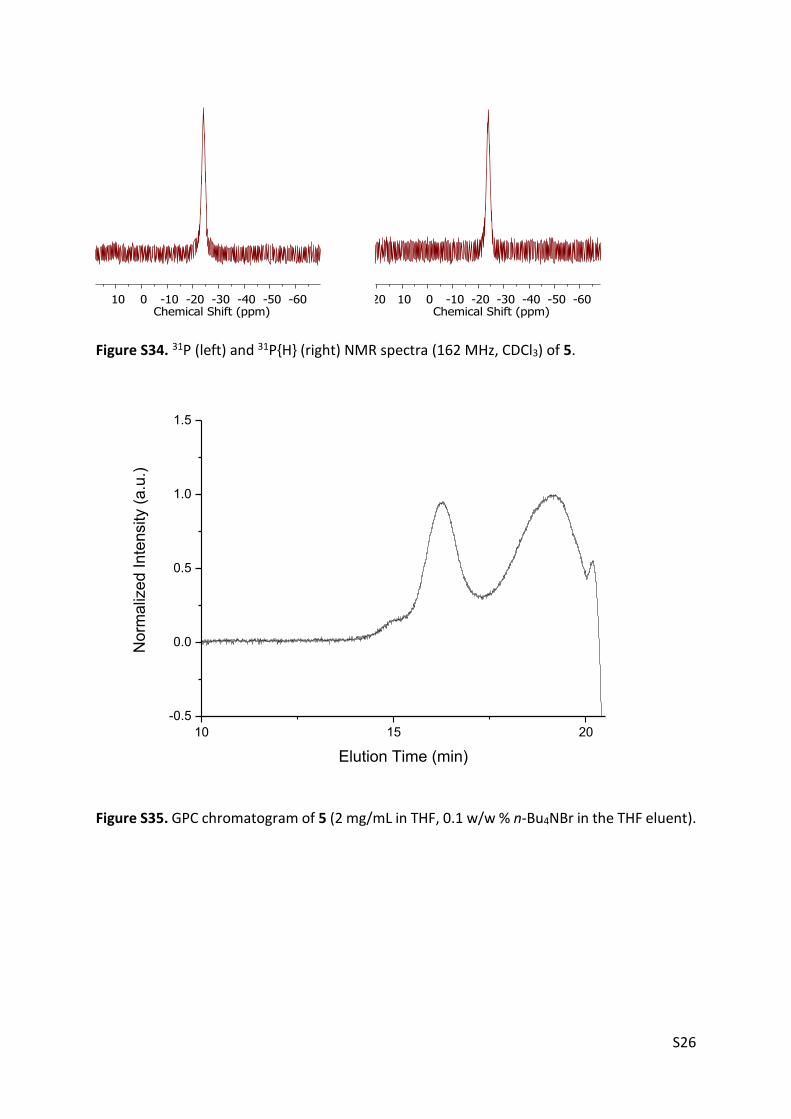
Figure S34. 31P (left) and 31P{H} (right) NMR spectra (162 MHz, CDCl3) of 5.
Figure S35. GPC chromatogram of 5 (2 mg/mL in THF, 0.1 w/w % n-Bu4NBr in the THF eluent).
10 15 20
-0.5
0.0
0.5
1.0
1.5
No
rma
lize
d I
nte
nsity (
a.u
.)
Elution Time (min)

S27
Figure S36. ESI-MS (+) spectrum of 5 in DCM.
Figure S37. TGA thermogram of 5 (heating rate: 10 °C/min).
0 200 400 600
0
50
100
Weig
ht (%
)
Temperature (°C)
234.2
234.2
234.2
234.2
S28
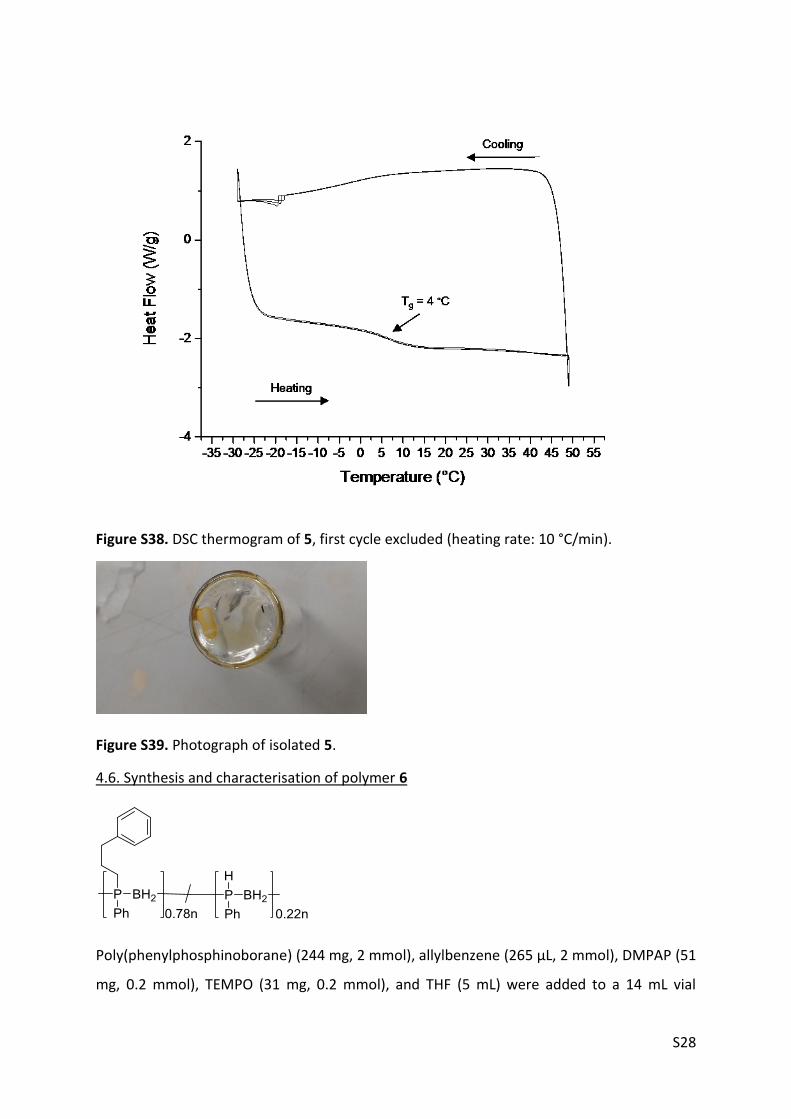
Figure S38. DSC thermogram of 5, first cycle excluded (heating rate: 10 °C/min).
Figure S39. Photograph of isolated 5.
4.6. Synthesis and characterisation of polymer 6
Poly(phenylphosphinoborane) (244 mg, 2 mmol), allylbenzene (265 μL, 2 mmol), DMPAP (51
mg, 0.2 mmol), TEMPO (31 mg, 0.2 mmol), and THF (5 mL) were added to a 14 mL vial

S29
equipped with a magnetic stirrer. The resultant solution was irradiated ca. 3 cm away from a
mercury lamp for 2 h. Volatiles were then removed under vacuum and the resultant solid was
purified by precipitation from DCM into pentane at -78 °C (3 x 25 mL). The polymer was then
dried under vacuum at 40 °C for 48 h yielding 6 as an orange solid (conversion: 78%; yield:
249 mg, 57%). Spectroscopic data: 1H NMR (400 MHz, CDCl3) δ 7.48 – 6.80 (m, ArH), 4.10 (br
d, J = 349 Hz, PhPH), 2.10 (br s, PhCH2), 1.79 – 0.80 (br m, PCH2, PCH2CH2, and BH2); 11B NMR
(128 MHz, CDCl3) δ -33.4 (br s); 31P NMR (162 MHz, CDCl3) δ -23.9 (s, 78%, PhRPBH2), -48.5 (d,
J = 354 Hz, 22%, PhHPBH2); Mn = 104,000 Da, PDI = 1.3; T5% = 194 °C; ceramic yield = 19%; Tg
= 50 °C.
Figure S40. 1H NMR spectrum (400 MHz, CDCl3) of 6. Deuterated chloroform residual signal denoted by *.
d + g
f
b + c + e + h
a
*

S30
Figure S41. 11B (left) and 11B{H} (right) NMR spectra (128 MHz, CDCl3) of 6.
Figure S42. 31P NMR (left) and 31P{H} (162 MHz, CDCl3) of 6.

S31
Figure S43. GPC chromatogram of 6 (2 mg/mL in THF, 0.1 w/w % n-Bu4NBr in the THF eluent).
Figure S44. ESI-MS (+) spectrum of 6 in DCM.
10 15 20
-0.4
-0.2
0.0
0.2
0.4
0.6
0.8
1.0
1.2
1.4
No
rma
lize
d I
nte
nsity (
a.u
.)
Elution Time (min)

S32
Figure S45. TGA thermogram of 6 (heating rate: 10 °C/min).
Figure S46. DSC thermogram of 6, first cycle excluded (heating rate: 10 °C/min).
0 100 200 300 400 500 600
20
40
60
80
100
We
igh
t (%
)
Temperature (°C)

S33
Figure S47. Photograph of isolated 6.
4.7. Synthesis and characterisation of polymer 7
Poly(phenylphosphinoborane) (244 mg, 2 mmol), allyl pentafluorobenzene (307 μL, 2 mmol),
DMPAP (51 mg, 0.2 mmol), TEMPO (31 mg, 0.2 mmol), and THF (5 mL) were added to a 14 mL
vial equipped with a magnetic stirrer. The resultant solution was irradiated ca. 3 cm away
from a mercury lamp for 2 h. Volatiles were then removed under vacuum and the resultant
solid was purified by precipitation from DCM into pentane at -78 °C (3 x 25 mL). The polymer
was then dried under vacuum at 40 °C for 48 h yielding 7 as an orange solid (conversion: 72%;
yield: 204 mg, 37%). Spectroscopic data: 1H NMR (400 MHz, CDCl3) δ 7.52 – 6.80 (br m, ArH),
4.09 (br d, J = 344 Hz, PhPH), 2.24 (br s, C6F5CH2), 1.68 – 0.92 (br m, CH2, CH3, BH2); 11B NMR
(128 MHz, CDCl3) δ -34.3 (br s); 31P NMR (162 MHz, CDCl3) δ -24.0 (s, 72%, PhRPBH2), -48.6 (d,
J = 368 Hz, 28%, PhHPBH2); 19F NMR (283 MHz, CDCl3) δ -143.63 (s), -157.72 (s), -162.83 (s);
GPC (2 mg/mL) Mn = 130,000 Da, PDI = 1.5; T5% = 209 °C; ceramic yield = 34%; Tg = 67 °C.

S34
Figure S48. 1H NMR spectrum (400 MHz, CDCl3) of 7. Deuterated chloroform residual signal
denoted by *.
Figure S49. 19F NMR (283 MHz, CDCl3) of 7. Signal arising from -OTf group originating from CpFe(CO)2OTf used in the polymerisation of PhH2PBH3 denoted by *.
*
d + g
f
b + c + e + h *
a

S35
Figure S50. 11B (left) and 11B{H} (right) NMR spectra (128 MHz, CDCl3) of 7.
Figure S51. 31P (left) and 31P{H} (right) NMR spectra (162 MHz, CDCl3) of 7.

S36
Figure S52. GPC chromatogram of 7 (2 mg/mL in THF, 0.1 w/w % n-Bu4NBr in the THF eluent).
Figure S53. TGA thermogram of 7 (heating rate: 10 °C/min).
10 15 20
-0.5
0.0
0.5
1.0
1.5N
orm
aliz
ed I
nte
nsity (
a.u
.)
Elution Time (min)
0 100 200 300 400 500 600
30
40
50
60
70
80
90
100
110
Weig
ht (%
)
Temperature (°C)

S37
Figure S54. DSC thermogram of 7, first cycle excluded (heating rate: 10 °C/min).
4.8. Synthesis and characterisation of polymer 8
Poly(phenylphosphinoborane) (244 mg, 2 mmol), 1H,1H,2H-perfluoro-1-hexene (339 mg, 2
mmol), DMPAP (51 mg, 0.2 mmol), TEMPO (31 mg, 0.2 mmol), and THF (5 mL) were added to
a 14 mL vial equipped with a magnetic stirrer. The resultant solution was irradiated ca. 3 cm
away from a mercury lamp for 2 h. Volatiles were then removed under vacuum and the
resultant solid was purified by precipitation from THF into H2O/isopropanol (1:1 v/v) at -20 °C
(3 x 25 mL). The polymer was then dried under vacuum at 40 °C for 48 h yielding 8 as an
orange solid (conversion: 82%; yield: 479 mg, 74%). Spectroscopic data: 1H NMR (400 MHz,
CDCl3) δ 7.54 – 6.80 (br m, ArH), 4.16 (br d, J = 357 Hz, PhPH) 2.28 – 0.94 (br m, CH2, BH2); 11B
NMR (128 MHz, CDCl3) δ -34.1 (br s); 31P NMR (162 MHz, CDCl3) δ -23.7 (s, 82%, PhRPBH2), -
49.9 (d, J = 357 Hz, 18%, PhHPBH2); 19F NMR (377 MHz, CDCl3) δ -81.31, -115.17, -124.30, -
126.30; GPC (2 mg/mL) Mn = 92,000 Da, PDI = 1.4; T5% = 173 °C; ceramic yield = 8%; Tg = 43 °C.

S38
Figure S55. 1H NMR spectrum (400 MHz, CDCl3) of 8. Deuterated chloroform residual signal denoted by *.
Figure S56. 19F NMR (377 MHz, CDCl3) of 8. Signal arising from -OTf group originating from CpFe(CO)2OTf used in the polymerisation of PhH2PBH3 denoted by *.
*
c + f
e
a + b + d + g
*

S39
Figure S57. 11B (left) and 11B{H} NMR spectra (128 MHz, CDCl3) of 8.
Figure S58. 31P (left) and 31P{H} (right) NMR spectra (162 MHz, CDCl3) of 8.

S40
Figure S59. GPC chromatogram of 8 (2 mg/mL in THF, 0.1 w/w % n-Bu4NBr in the THF eluent).
Figure S60. TGA thermogram of 8 (heating rate: 10 °C/min).
10 15 20
-0.5
0.0
0.5
1.0
1.5N
orm
aliz
ed I
nte
nsity (
a.u
.)
Elution Time (min)
0 100 200 300 400 500 600
0
20
40
60
80
100
We
igh
t (%
)
Temperature (°C)

S41
Figure S61. DSC thermogram of 8, first cycle excluded (heating rate: 10 °C/min).
Figure S62. Photograph of isolated 8.

S42
5. Synthesis and characterisation of crosslinked
polyphosphinoborane
5.1. Irradiation of [PhHPBH2]n with DMPAP (10 mol%) in the absence of alkene.
Figure S63. GPC chromatogram in THF (2 mg/mL, 0.1 w/w % n-Bu4NBr in the THF eluent) of material obtained via irradiation of [PhHPBH2]n with DMPAP (10 mol%) in the absence of alkene.
5.2. Synthesis and characterisation of crosslinked poly(phenylphosphinoborane)
Polyphenylphosphinoborane (122 mg, 1 mmol), 1,5-hexadiene (17.8 μL, 0.15 mmol), DMPAP
(25 mg, 0.1 mmol), TEMPO (15 mg, 0.1 mmol), and THF (1 mL) were added to a 14 mL vial.
The resultant solution was irradiated ca. 3 cm away from a mercury lamp for 2 h resulting in
the formation of an insoluble gel with exclusion of orange coloured solvent. Excess solvent
was decanted away, and volatiles were removed under vacuum yielding an orange solid. This
solid was purified by swelling in THF for 6 hours followed by decanting away of excess solvent
until no colouration of the solvent was observed (2 x 5 mL). Volatiles were removed under
vacuum yielding a brittle orange solid (yield: 89 mg). 31P NMR (202 MHz, THF-d8) δ -23.6 (s,
7%, PhRPBH2), -49.1 (d, J = 345.3 Hz, 93%, PhHPBH2); T5% = 138 °C; ceramic yield = 53%.
6 8 10 12 14 16 18 20 22
0.0
0.5
1.0
1.5
Norm
aliz
ed Inte
nsity (
a.u
.)
Elution Time (min)

S43
Figure S64. 31P NMR spectrum (202 MHz, THF-d8) of crosslinked poly(phenylphosphinoborane) swelled in THF-d8.
Figure S65. 31P{H} NMR spectrum (202 MHz, thf-d8) of crosslinked poly(phenylphosphinoborane) swelled in THF-d8.

S44
Figure S66. TGA thermogram of crosslinked poly(phenylphosphinoborane) (heating rate: 10 °C/min).
Figure S67. DSC thermogram of crosslinked poly(phenylphosphinoborane), first cycle excluded (heating rate: 10 °C/min).
0 100 200 300 400 500 600
50
60
70
80
90
100
We
igh
t (%
)
Temperature (°C)

S45
Figure S68. Photograph of crosslinked poly(phenylphosphinoborane) after irradiation (left) and after drying under vacuum for 48 h (right).
5.3. Swellability of crosslinked poly(phenylphosphinoborane)
A sample of dry crosslinked poly(phenylphosphinoborane) was weighed (54 mg) and swelled
in THF for 48 h. No coloration of the THF was observed after this time. Excess solvent was
decanted away, and surface solvent removed by careful swabbing with a Kimwipe. After this,
the sample was reweighed (114 mg) and the swellability in THF calculated (210% mass
increase).

S46
6. Synthesis of a water-soluble bottlebrush polymer
6.1. Synthesis and characterisation of bottlebrush polymer 9
Poly(phenylphosphinoborane) (244 mg, 2 mmol), poly(ethylene glycol) methyl ether
methacrylate (average Mn 950 Da, 1.90 g, 2 mmol), DMPAP (51 mg, 0.2 mmol), TEMPO (31
mg, 0.2 mmol), and THF (5 mL) were added to a 14 mL vial equip with a magnetic stirrer. The
resultant solution was irradiated ca. 3 cm away from a mercury lamp for 2 h. Volatiles were
removed under vacuum and the resultant material was dissolved in water. The yellow
solution obtained was transferred into a dialysis tube (MWCO: 12-14,000 g/mol) and dialysis
was performed against water for 48 h in order to remove excess poly(ethylene glycol) methyl
ether methacrylate. No colouring of the medium outside the dialysis tubing was observed.
The yellow solution remaining inside the dialysis tubing was dried under vacuum at 40 °C for
48 h yielding 9 as an orange solid (grafting density: 0.58; yield: 0.93 g, 69%). Spectroscopic
data: 11B NMR (128 MHz, CDCl3) δ -34.6 (br s); 31P NMR (162 MHz, CDCl3) δ -24.24 (s, PhRPBH-
2), -48.85 (d, J = 352 Hz, PhHPBH2); GPC (2 mg/mL) Mn = 156,000 Da, PDI = 1.3; Tm (PEG side
chains) = 40.0 °C; T5% = 301 °C; ceramic yield = 2.4%.

S47
Figure S69. 1H NMR spectrum (400 MHz, CDCl3) of 9. Deuterated chloroform residual signal
denoted by *.
Figure S70. 13C NMR spectrum (126 MHz, CDCl3) of 9.
Ar-H B-H
b + c
a + e
d + f
*

S48
Figure S71. 11B (left) and 11B{H} NMR spectra (128 MHz, CDCl3) of 9.
Figure S72. 31P (left) and 31P{H} (right) NMR spectra (162 MHz, CDCl3) of 9.
S49
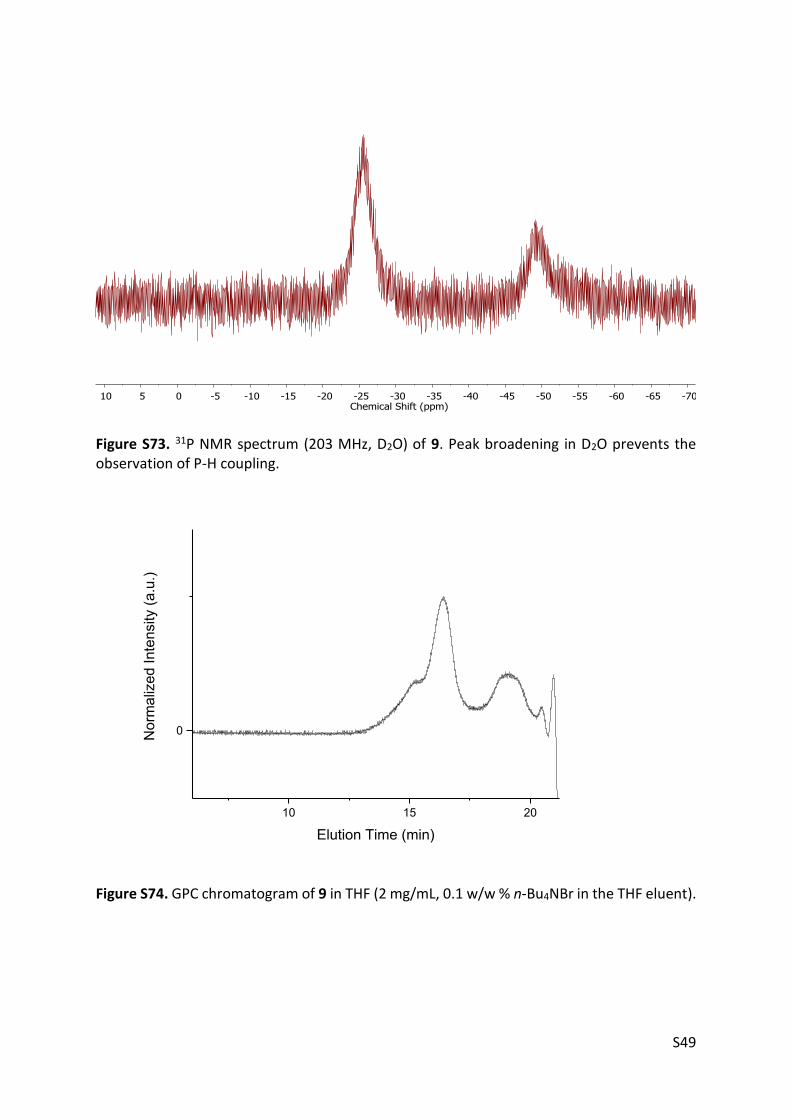
Figure S73. 31P NMR spectrum (203 MHz, D2O) of 9. Peak broadening in D2O prevents the observation of P-H coupling.
Figure S74. GPC chromatogram of 9 in THF (2 mg/mL, 0.1 w/w % n-Bu4NBr in the THF eluent).
10 15 20
0No
rma
lize
d I
nte
nsity (
a.u
.)
Elution Time (min)

S50
Figure S75. DLS size distribution by volume of 9 in THF (1 mg/mL). Multiple measurements in different colours show that the measured diameter is stable.
Figure S76. DLS size distribution by volume of poly(ethylene glycol) methyl ether methacrylate (average Mn 950) in THF (1 mg/mL). Multiple measurements in different colours show that the measured diameter is stable.

S51
Figure S77. MALDI-MS spectrum of 9. A complex spectrum is observed due to the presence of both a polymeric backbone and side chains. Each envelope arises from the distribution of molar mass of the polyethylene glycol side chains (molar mass of repeat unit = 44.1 g/mol). Multiple envelopes are observed due to ionisation of the poly(phosphinoborane) main chain units (PhRPBH2, R = CH2CH(CH3)C(O)O[CH2CH2O]mCH3, molar mass of repeat unit = 1072 g/mol).
Figure S78. TGA thermogram of 9 (heating rate: 10 °C/min).
0 100 200 300 400 500 600
0
20
40
60
80
100
We
igh
t (%
)
Temperature (°C)

S52
Figure S79. DSC thermogram of 9, first cycle excluded (heating rate: 10 °C/min).
Figure S80. Photograph of isolated 9.

S53
7. References
1. K. Bourumeau, A.-C. Gaumont and J.-M. Denis, J. Organomet. Chem., 1997, 529, 205-
213.
2. D. J. Liston, Y. J. Lee, W. R. Scheidt and C. A. Reed, J. Am. Chem. Soc., 1989, 111,
6643-6648.
3. A. Schäfer, T. Jurca, J. Turner, J. R. Vance, K. Lee, V. A. Du, M. F. Haddow, G. R.
Whittell and I. Manners, Angew. Chem. Int. Ed., 2015, 54, 4836-4841.

![Lanthanide(III) 2-Naphthoxide Complexes Stabilized by ...Synthesis of [Li(THF)][naphO]. 2-naphthol (2.46 g, 17.1 mmol) was dissolved in 15 mL of THF in a 20 mL scintillation vial and](https://img.pdfslide.us/doc/110x75/606eca4d4bb70b0df375f8d2/lanthanideiii-2-naphthoxide-complexes-stabilized-by-synthesis-of-lithfnapho.jpg)


![The Royal Society of Chemistry · Preparation of [{U(TrenDMBS)} 2(µ-N)][K(THF) 6] (5) and [{U(Tren DMBS)} 2(µ-N)] (6) THF (20 ml) was added slowly to a stirring mixture of 3 (2.568](https://img.pdfslide.us/doc/110x75/5f5c201f751c4d45574a5de9/the-royal-society-of-preparation-of-utrendmbs-2-nkthf-6-5-and-utren.jpg)