Embed Size (px)
Citation preview

www.sciencemag.org/cgi/content/full/314/5805/1585/DC1
Supporting Online Material for
Enzyme-Free Nucleic Acid Logic Circuits
Georg Seelig, David Soloveichik, David Yu Zhang, Erik Winfree*
*To whom correspondence should be addressed. E-mail: [email protected]
Published 8 December, Science 314, 1585 (2006)
DOI: 10.1126/science.1132493
This PDF file includes:
Materials and Methods Figs. S1 to S10 Tables S1 to S3
Enzyme-free Nucleic Acid Logic Circuits(supplementary information)
Georg Seelig,1 David Soloveichik,1 David Yu Zhang,1 and Erik Winfree1
1California Institute of Technology, MC 136-93, 1200 E. California Blvd., Pasadena, CA 91125
MATERIALS AND METHODS
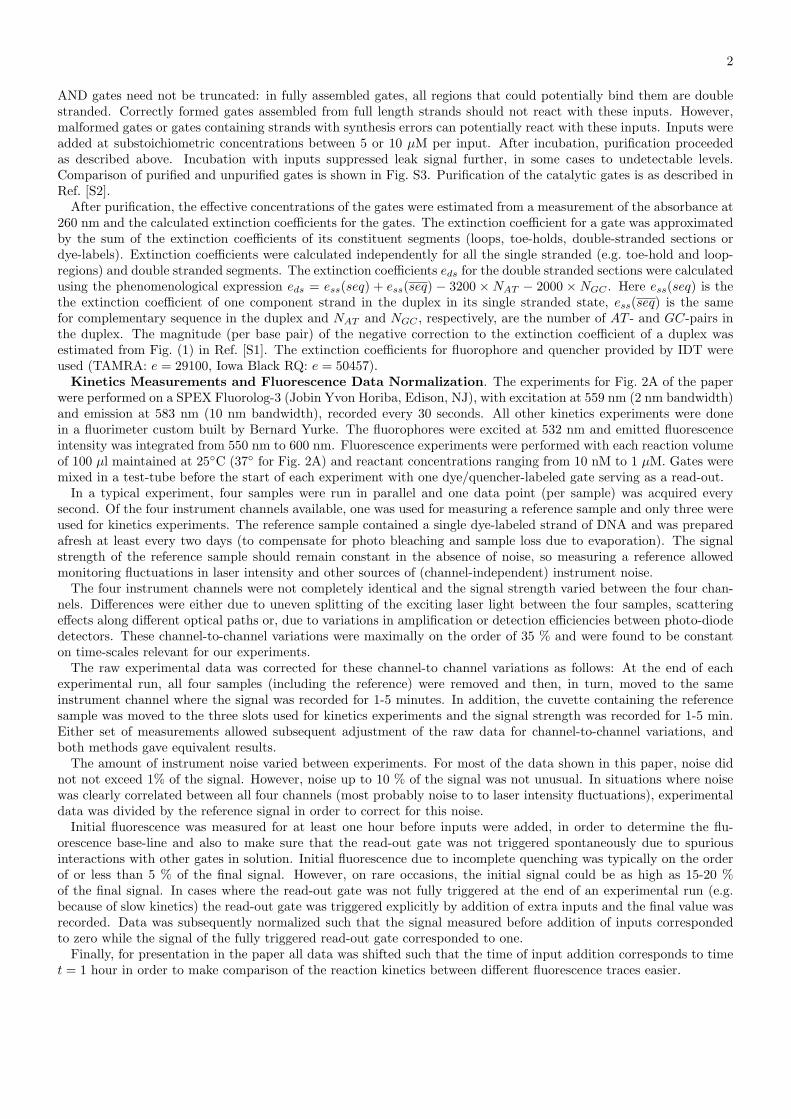
System Specifications. For microRNA translator gates, the length of the gate strand recognition region isdetermined by the length of the microRNA input and ranges from 20 to 22 nucleotides (nt). Toe-holds for inputbinding are six nt long. The recognition region of the output strand is 36 nt long of which 27 nt are single-strandedbefore output release. The double-stranded 9 base-pair (bp) part of the recognition region includes the toe-holdbinding sequence (6 nt) and a protecting three bp clamp. In all other gates, recognition regions for both input andoutput strands are 36 nt long. The first gate strand in any AND gate as well as the gate strands in gates HI, QoutPf ,and WY thus are 36 mers. Additional gates strands are 60 mers. Output strands are 57 mers. Before release, outputstrands are bound to their gate with both ends. The two binding regions are 15 bp long while the single stranded loopregion has length 27 nt. For design details, see Fig. S1.
DNA oligos were synthesized and purified by Integrated DNA Technologies, Coralville, IA. DNA stock solutionswere prepared at a concentration of 50 µM in ultra pure water (purified by a Milli-Q system, Millipore, Bedford, MA).Concentrations were determined from the measured absorbance at 260 nM and the calculated extinction coefficient(calculation based on the nearest-neighbor model with parameters of Ref. [S1]).
RNA oligos with sequences identical to biological microRNAs miR-124a and let-7c were also synthesized and purifiedby IDT. Mouse brain total RNA samples were obtained from Ambion, Inc., Austin, TX. In Fig. 2A, the concentrationof total RNA ≈ 200µg/ml. For comparison, a concentration of 60 nM for input strands corresponds to about 0.6 µg/mlRNA. DNA in gate complexes is at 2µg/ml. Total RNA samples mainly consist of ribosomal 18S and 28S RNA. Theconcentration of gates and added RNA inputs are several orders of magnitude higher than the concentration of anymicroRNA contained in the total RNA samples. Thus, additional input amplification circuitry would be required todetect endogenous miR-124a and let-7c.
Dye labels were used to follow reaction kinetics: Carboxytetramethylrhodamine (TAMRA) was used as a fluorophoreand Iowa Black RQ as a dark quencher. Even though the same fluorophore was used in all our experiments and alldye-labeled strands were ordered HPLC purified, fluorescence intensity was observed to vary strongly between strandswith different sequences and between different batches of the same strand.
TAE/Mg++ buffer (0.04 M Tris Acetate, 1 mM EDTA, 12.5 mM Mg Acetate, pH 8.3) was used for all reactionsincluding fluorescence experiments, formation gels and gel elutions for purification.
Gel Electrophoresis. Non-denaturing polyacrylamide gels (acrylamide-bis 19:1, 8% or 10%, 2-3 h at 15 V/cm,and 4◦C) were used to verify structure formation and to analyze reaction mixtures. For imaging, gels were stainedwith SybrGold (Molecular Probes, Eugene, OR) for 25 to 35 min, excited at 488 nm and imaged with 530 bandpassfilter on a Bio-Rad (Hercules, CA) Molecular Imager FX Pro Plus.
Gate Formation and Purification. Gates were formed in a slow anneal where the reaction mixture is heated upto 90◦C and then slowly (1◦C/min) cooled down to room temperature. Each gate sample was formed in a separatereaction.
For purification, gates were prepared at 10 or 20 µM. In our initial experiments gates were purified from a gel directlyafter annealing. Gel elution (4-5 h at 5 V/cm and 4◦C) was done using the Elutrap Electroelution System (Schleicherand Schuell Biosience, Dassel, Germany). Purification allowed for the separation of fully from partially assembledstructures and dramatically decreased leak signals due to false triggering in fluorescence experiments. However, falsetriggering could not be completely eliminated with this approach, probably because gates with only minor defects(e.g. gates containing incorrectly synthesized strands with only a few bases missing) co-migrate with the error-freegates in the gel.
In order to at least partially eliminate gates with minor defects, an improved purification scheme was developed. Inthis approach, gates were incubated with their inputs overnight at room temperature before purification. Importantly,first-acting inputs were truncated such that they would not react with correctly formed gates. Specifically, toe-holdbinding regions were removed from inputs targeting gate strands with a single stranded toe-hold, i.e. the first input inan AND gate and inputs to translator gates. (For translator gates taking microRNA input, in addition to truncatingthe toe-hold, the strand was extended by 3 nt to cover the 3 nt clamp shown in Fig. S1.) Second and third inputs to
2
AND gates need not be truncated: in fully assembled gates, all regions that could potentially bind them are doublestranded. Correctly formed gates assembled from full length strands should not react with these inputs. However,malformed gates or gates containing strands with synthesis errors can potentially react with these inputs. Inputs wereadded at substoichiometric concentrations between 5 or 10 µM per input. After incubation, purification proceededas described above. Incubation with inputs suppressed leak signal further, in some cases to undetectable levels.Comparison of purified and unpurified gates is shown in Fig. S3. Purification of the catalytic gates is as described inRef. [S2].
After purification, the effective concentrations of the gates were estimated from a measurement of the absorbance at260 nm and the calculated extinction coefficients for the gates. The extinction coefficient for a gate was approximatedby the sum of the extinction coefficients of its constituent segments (loops, toe-holds, double-stranded sections ordye-labels). Extinction coefficients were calculated independently for all the single stranded (e.g. toe-hold and loop-regions) and double stranded segments. The extinction coefficients eds for the double stranded sections were calculatedusing the phenomenological expression eds = ess(seq) + ess(seq) − 3200 × NAT − 2000 × NGC . Here ess(seq) is thethe extinction coefficient of one component strand in the duplex in its single stranded state, ess(seq) is the samefor complementary sequence in the duplex and NAT and NGC , respectively, are the number of AT - and GC-pairs inthe duplex. The magnitude (per base pair) of the negative correction to the extinction coefficient of a duplex wasestimated from Fig. (1) in Ref. [S1]. The extinction coefficients for fluorophore and quencher provided by IDT wereused (TAMRA: e = 29100, Iowa Black RQ: e = 50457).
Kinetics Measurements and Fluorescence Data Normalization. The experiments for Fig. 2A of the paperwere performed on a SPEX Fluorolog-3 (Jobin Yvon Horiba, Edison, NJ), with excitation at 559 nm (2 nm bandwidth)and emission at 583 nm (10 nm bandwidth), recorded every 30 seconds. All other kinetics experiments were donein a fluorimeter custom built by Bernard Yurke. The fluorophores were excited at 532 nm and emitted fluorescenceintensity was integrated from 550 nm to 600 nm. Fluorescence experiments were performed with each reaction volumeof 100 µl maintained at 25◦C (37◦ for Fig. 2A) and reactant concentrations ranging from 10 nM to 1 µM. Gates weremixed in a test-tube before the start of each experiment with one dye/quencher-labeled gate serving as a read-out.
In a typical experiment, four samples were run in parallel and one data point (per sample) was acquired everysecond. Of the four instrument channels available, one was used for measuring a reference sample and only three wereused for kinetics experiments. The reference sample contained a single dye-labeled strand of DNA and was preparedafresh at least every two days (to compensate for photo bleaching and sample loss due to evaporation). The signalstrength of the reference sample should remain constant in the absence of noise, so measuring a reference allowedmonitoring fluctuations in laser intensity and other sources of (channel-independent) instrument noise.
The four instrument channels were not completely identical and the signal strength varied between the four chan-nels. Differences were either due to uneven splitting of the exciting laser light between the four samples, scatteringeffects along different optical paths or, due to variations in amplification or detection efficiencies between photo-diodedetectors. These channel-to-channel variations were maximally on the order of 35 % and were found to be constanton time-scales relevant for our experiments.
The raw experimental data was corrected for these channel-to channel variations as follows: At the end of eachexperimental run, all four samples (including the reference) were removed and then, in turn, moved to the sameinstrument channel where the signal was recorded for 1-5 minutes. In addition, the cuvette containing the referencesample was moved to the three slots used for kinetics experiments and the signal strength was recorded for 1-5 min.Either set of measurements allowed subsequent adjustment of the raw data for channel-to-channel variations, andboth methods gave equivalent results.
The amount of instrument noise varied between experiments. For most of the data shown in this paper, noise didnot not exceed 1% of the signal. However, noise up to 10 % of the signal was not unusual. In situations where noisewas clearly correlated between all four channels (most probably noise to to laser intensity fluctuations), experimentaldata was divided by the reference signal in order to correct for this noise.
Initial fluorescence was measured for at least one hour before inputs were added, in order to determine the flu-orescence base-line and also to make sure that the read-out gate was not triggered spontaneously due to spuriousinteractions with other gates in solution. Initial fluorescence due to incomplete quenching was typically on the orderof or less than 5 % of the final signal. However, on rare occasions, the initial signal could be as high as 15-20 %of the final signal. In cases where the read-out gate was not fully triggered at the end of an experimental run (e.g.because of slow kinetics) the read-out gate was triggered explicitly by addition of extra inputs and the final value wasrecorded. Data was subsequently normalized such that the signal measured before addition of inputs correspondedto zero while the signal of the fully triggered read-out gate corresponded to one.
Finally, for presentation in the paper all data was shifted such that the time of input addition corresponds to timet = 1 hour in order to make comparison of the reaction kinetics between different fluorescence traces easier.
3
Sequence design. Except where constrained by biological sequences or pre-existing DNA devices, all sequenceswere design by computer optimization. In the design process, the main structural constraints were imposed from theoutset, such as domain lengths and complementarity requirements. In particular, recognition regions of output gatestrands must be complementary to their target and each gate strand must be able to correctly bind its neighboringgate strand(s). In some cases, double-helical domains were terminated by G-C pairs to reduce fraying. Input strandsequences were entirely determined by sequence of their target gate strand. Sequences were designed incrementally asthe research progressed; in each design stage, strand sequences from the previous stages constrained choices for thenew gate sequences.
In each stage, a set of random sequences obeying these structural constraints are then generated and an iterativeoptimization scheme is applied to them. The optimization process allows one to implement a set of additional soft con-straints. These included: (i) minimization of secondary structures in single-stranded species (the input and messengerstrands), as predicted by the minimum-free-energy (MFE) structure [S3] at 25◦C using DNA parameters [S4]; (ii)minimization of cross-talk between all single-stranded species, as measured by the ∆G◦ of association between pairs ofstrands (estimated as intramolecular MFE for a ‘virtual’ strand linking the two sequences via 5 unpaired nucleotides);(iii) especially avoiding secondary structure in messenger strands and single-stranded portions of partially-triggeredgates that hides the toe-hold binding region; (iv) avoiding a set of undesired sequences (e.g. more than three con-secutive repeats of the same base); (v) minimizing the occurrence of short subsequences (3 to 10 base pairs) thathave exact or near-exact complementary matches elsewhere either in the same strand or in other strands, except asintended by design (generally referred to as sequence symmetry minimization [S5, S6]); (vi) making all toe-holds ofsimilar strength (predicted ∆G◦ at 25◦C); (vii) avoiding branch migration of the bulge loop region in a bound outputstrand: this is achieved by imposing that the first four single-stranded nucleotides at the base on one side of theloop are different from the last four nucleotides in the double stranded region directly adjacent to the loop on theother side. Scores for each of these soft criteria were weighted and summed to obtain an overall score for the set ofsequences being designed. Sequence optimization proceeded by random descent to minimization of the overall score:sequence mutations were made randomly (subject to satisfying the structural constraints) and accepted if the scorewas reduced. If the final sequences were unsatisfactory, the scoring weights were adjusted, new initial sequences werechosen, and optimization was attempted again.
A set of toe-holds was designed in the first stage, then the ABCD gate was designed, then the WY and PQgates, then the EFG gate and most translators (including the full translator, but excluding UV and ST ), and finallythe UV and ST translators (whose microRNA targets were chosen to share a 6 nt toe-hold domain) were designedto demonstrate implicit OR. The catalytic amplifiers CA and R were designed by cutting-and-pasting appropriaterecognition domains into the molecules described in Ref. [S2]. Similarly, the sequences for the threshold gate wereprimarily defined by pre-existing sequences.
Derivation of sigmoidal threshold behavior. If the amount of Aout is small, and thus threshold gates remainmostly unreacted, then the probability that a single threshold gate reacts with two molecules of Aout is roughlyquadratic in the amount of Aout. Consequently, in this regime, the relationship between Aout and the amount oftriggered threshold should be approximately quadratic. If the amount of Aout is large and most of the threshold gatehas reacted with Aout at least once, then there is a linear relationship between Aout and the amount of triggeredthreshold, until Aout is greater than twice the amount of threshold where saturation is observed. A simple twoequation model is sufficient to approximately explain the resultant sigmoidal transfer function over the entire inputrange (a single parameter fit matches the data of Figs. 2C and S5D to within ≈ 10%):
Aout + Thk1→ Th′
Aout + Th′ k2→ Th′′
where Th, Th’, and Th” represent three states of the threshold gate, with the last state being triggered. (Includingthe intermediate reaction with Th2in is necessary for greater physical plausibility but the principle of the operationof the threshold gate can be explained without it.)
A larger threshold gate taking n > 2 molecules of Aout as input should provide a better than quadratic non-linearity:using the above intuition, the transfer function should be of power n for low amounts of Aout.
4
strand D, bases 1−36:recognition region
strand B, base 1−36:recognition region
strand Drecognition region
strand B:recognition region
strand C:recognition region
miR−122a: 22 nt
miR−122a, bases 1−6:bind toe−hold of strand O
N : 43 ntout
strand O, bases 1−22:recognition region
8 14
1
strand O, bases 17−22: toe−hold for miR−122a
N , bases 8−13:bind toe−hold of I
out
N , bases 8−42:output recognition region
outH : 57 ntout
strand I, bases 1−36:recognition region
H , bases 7−12:bind toe−hold of strand B
out
A : 57 ntout
42 753171
C: 60 nt
251 31 60
B: 60 nt
3137 106
out strand C, bases 25−60:recognition region
131
1 31 3742
mix and anneal
from 90 C to 20 C
2271
O: 25 nt
1
17
3 bp clamp
3 bp clamp
I: 36 nt
4213
17
131
D: 36 nt
36 31 1
27 nt loop
27 nt loop
3 bp clamp
strand A , bases 7−41:output recognition region
(A) GATE DESIGN AND ASSEMBLY
(B) TRANSLATOR DESIGN
strand I, bases 31−36:toe−hold for Nout
1
7 131
3137
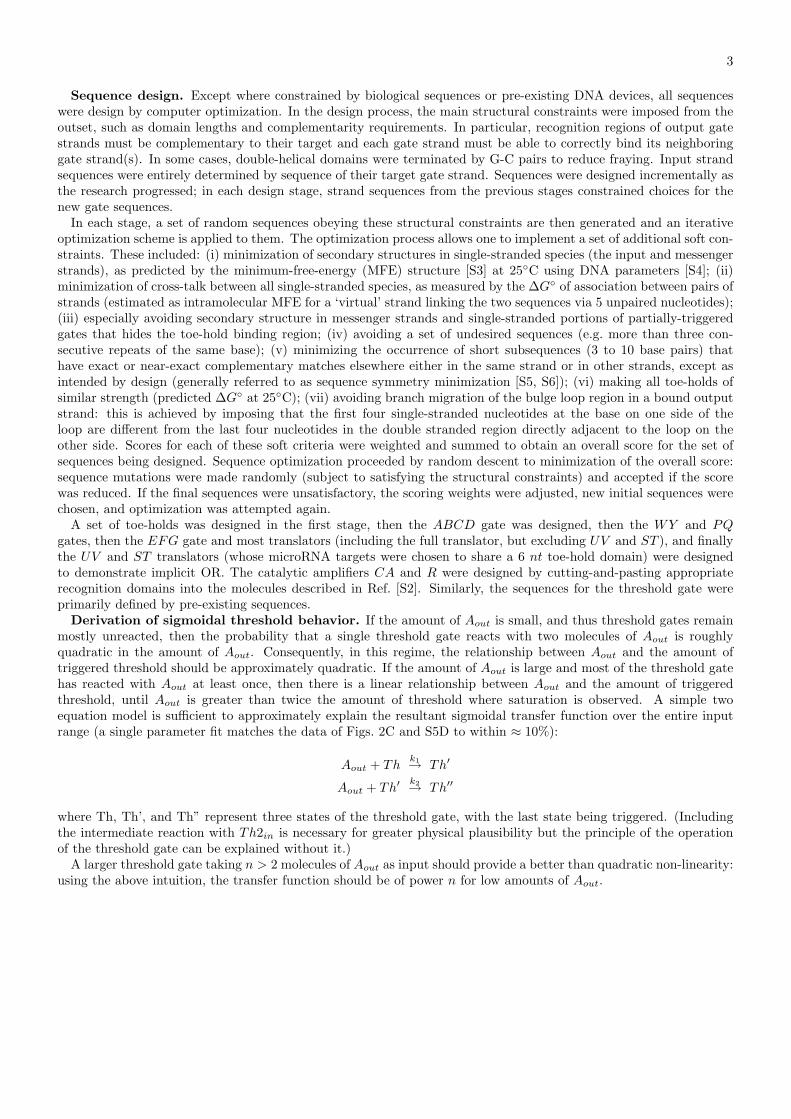
FIG. S1: Gate design. In all figures, solid arrows indicate a chemical reaction, in this case Aout + B + C + D → ABCD. Adashed arrow indicates where an input strand or output strand may bind to a toe-hold in a downstream gate complex andthereby serve as an input to the gate. All toe-hold sequences and toe-hold binding sequences are indicated in color. Sequencesof identical color bind to each other. Numbers refer to bases and the first base in every sub-sequence (i.e. region of differentcolor) is indicated. In unbound strands the last base of the strand is also labeled explicitly. (A) Gate design and assembly.Constituent strands of a three input AND gate and the final assembled gate are shown. Recognition regions are indicated. Ifthe output strand Aout is bound there are three base pairs between the (double-stranded) toe-hold binding sequence (red) andthe single-stranded loop. The toe-hold binding region was shifted inward to minimize interactions of a bound output strandwith down-stream gates due to spontaneous fraying of the double helix at the nick. This choice implies that a total of ninenucleotides are common to the upstream input and the downstream recognition region. (B) Two-stage translator cascade. Thelength of the recognition region of the first translator is imposed by the length of the microRNA. Only one end of output strandNout is bound to strand O. In order to better protect the toe-hold binding sequence, a three base clamp is introduced. Notethat strand O is longer than the input strand miR-122a and that the three nucleotides constituting the clamp remain singlestranded when input miR-122a is fully bound. These three bases on strand O in principle provide a toe-hold for the reversereaction, i.e. Nout binds to O and kicks off miR-122a. However, the toe-hold is short and this reaction does not seem to beimportant. The second translator in the cascade (gate HI) is designed analogously to the gate described in (A).
5
0 2 4 6Time (hours)
0
0.5
1
Flu
ores
cenc
e (a
rbitr
ary
units
)
Bin, Cin, DinCin, Din, BinDin, Bin, Cin
[purified gate AfBqCD] = 500 nM
B
C
D
B
D
C
B
B
B
B
A
A
C
C
A
C
A out
out
out
out
D in
D in
in
in
in
inCC ininBB
DD in
B in inC D in
ABCD
ABC
AB
A
3 4 5 6 7 80 1 2
100pb
10 bp
bindstoe−hold
toe−hold
toe−holdtoe−hold
strand Bstrand D
recognition region
strand C
recognition region
strand A: output
inC
inB
inC
inD
B in inC
B in
B in D ininC
DD in CC in
DD in
DD in
DD in inCC inBB
B in
A
1 ABCD, NO INPUTS
ABCD2
ABCD +
+
3
4 ABCD +
5 ABCD +
ABCD6
ABCD7 + +
8 ABCD + +
+
+ +
+
Din
D in
INITIAL STATE
SAME AS INITIAL
SAME AS INITIAL
SAME AS INITIAL
ABC +
SAME AS INITIAL
ABC +
AB + +
+ + +
+
FINAL STATE
Q
FA fC
D B q
82,3,4 5,6,7
(E)
(A) (B) (C)
(D)
firstinput
secondinput
thirdinput
1
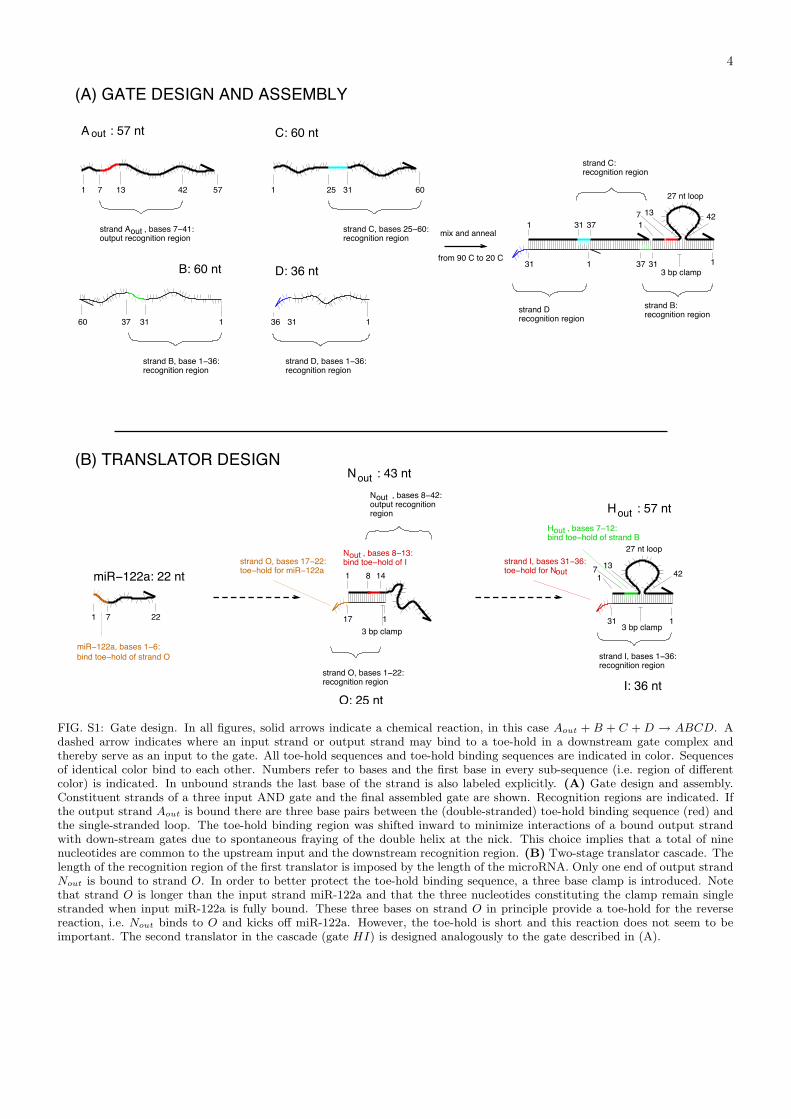
FIG. S2: Schematics of gate operation. (A) The gate consists of four DNA strands labeled A (output strand, 57 mer), B(60 mer), C (60 mer) and D (36 mer). The 3’-ends of all strands are marked by arrows. Toe-holds and toe-hold bindingregions (all 6 nt) are indicated in color. (B) Calculation of logical AND of three inputs. Input strands Bin, Cin and Din are36 mers complementary to recognition regions within the corresponding gate strands B, C and D (strand D consists entirelyof its recognition region). The calculation proceeds through a series of toe-hold mediated strand displacement reactions. Inputstrand Din binds at the exposed toe-hold (blue) of strand D and then displaces D from the gate by three-way branch migration.In the process, waste product DDin is formed and a toe-hold for Cin (cyan) becomes available. Subsequently, input Cin releasesstrand C forming the CCin-duplex. Then, input Bin forms a duplex with strand B and the output strand Aout is released intosolution. (C) Truth table for the three-input AND gate. Only if all three inputs are present the output strand will be released(entry 8). The released output strand is highlighted. (D) Fluorescence experiments. For fluorescence experiments, strands Af
(labeled with a fluorophore at the 3’-end, but without the bulge loop) and Bq (quencher at the 5’-end) were used instead ofAout and B. The gate used for fluorescence experiments is shown in the inset and fluorophore (F) and quencher (Q) positionsare indicated. Fluorescence is quenched initially; an increase in fluorescence is a measure of the progress of the reaction. Inputsare added sequentially with one hour delay between additions. The order of input addition is permuted cyclically between thethree fluorescence traces. In this way, all eight entries of the truth table are covered in only three experiments. In the bluetrace, for example, we start with the gate and no input (entry 1), then add Bin (entry 2), then Cin (entry 5) and finally Din
(entry 8). The numbers in the figure refer to the entries in the truth table. Experiments are done at 25◦C at a concentrationof 500 nM for all species. (E) Electrophoresis gel. Lane 0: 10 bp ladder. Lanes 1-8: The samples are as described in entries1-8 of the truth table. The gate used in this experiment is as shown in (A), except that for historical reasons strand A ratherthan Aout was used; these strands differ only in the bulge loop sequence.
6
0 2 4 6Time (hours)
0
0.5
1
Flu
ores
cenc
e (a
rbitr
ary
units
)
Bin, Cin, DinCin, Din, BinDin, Bin, Cin
[purified gate AfBqCDm] = 250 nM
0 2 4 6Time (hours)
0
0.5
1F
luor
esce
nce
(arb
itrar
y un
its)
Bin, Cin, DinCin, Din, BinDin, Bin, Cin
[unpurified gate AfBqCDm] = 250 nM
0 2 4 6Time (hours)
0
0.5
1
Flu
ores
cenc
e (a
rbitr
ary
units
)
Bin, Cin, DinCin, Din, BinDin, Bin, Cin
[unpurified gate AfBqCD] = 500 nM
0 2 4 6Time (hours)
0
0.5
1
Flu
ores
cenc
e (a
rbitr
ary
units
)
Bin, Cin, DinCin, Din, BinDin, Bin, Cin
[purified gate AfBqCD] = 500 nM
thirdinput
secondinput
firstinput
thirdinput
thirdinput
firstinput
secondinput
firstinput
secondinput
firstinput
secondinput
thirdinput
(A) (B)
(C) (D)
leak
leak
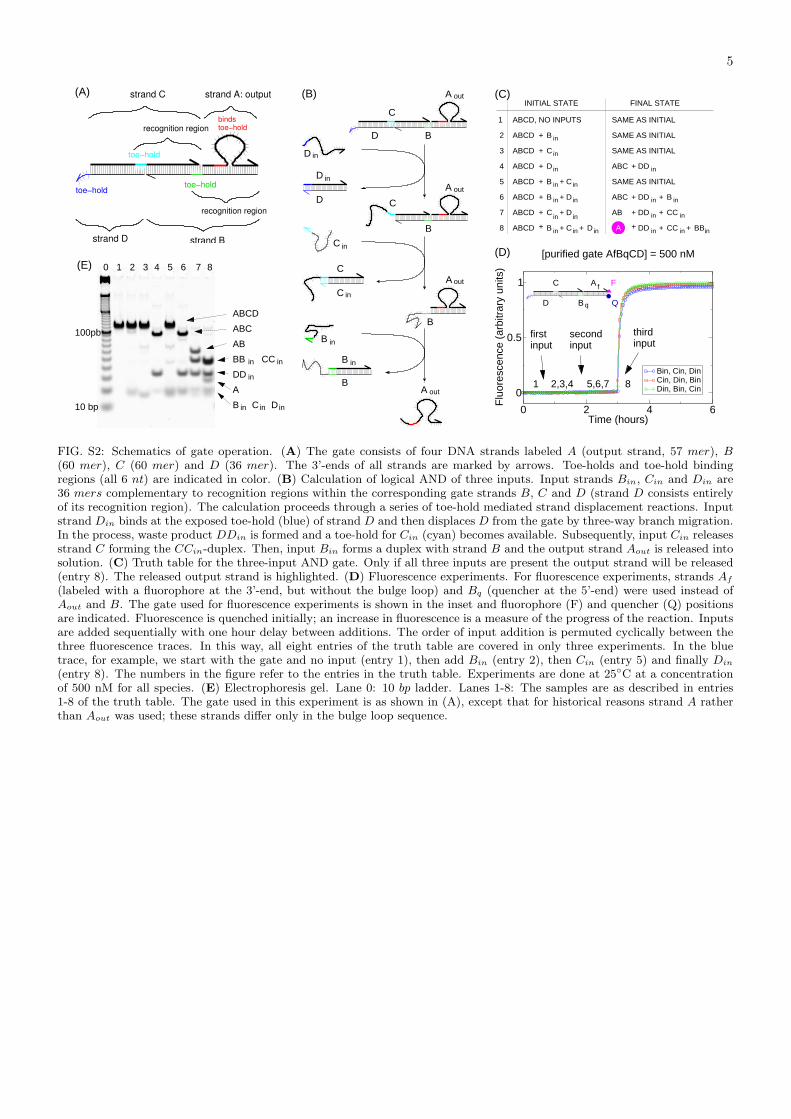
FIG. S3: Three-input AND gate fluorescence data: comparison of purified and unpurified gates. (A) Purified AND gate ABCDat 500 nM concentration. (B) Unpurified AND gate ABCD at 500 nM concentration. The gates in (A) and (B) were preparedwithin a few days from each other. The strands used for both gates came from the same DNA stocks. (C) Purified AND gateABCDm at 250 nM concentration. (D) Unpurified AND gate ABCDm at 250 nM concentration. The gates in (C) and (D)were also prepared within a few days from each other with strands from the same stock solutions. Note that the only differencebetween strands D and Dm is the sequence of the six nucleotide toe-hold. The gates are otherwise identical. Comparison of (A)and (B) (or (C) and (D)) shows that purification dramatically decreases the amount of false positive signal. For the samplescontaining unpurified gates (see (B) and (D)) a spurious signal is observed even if only some subset of inputs is present. Alsonote, that while purification always decreases the leak, the purified samples are not always equally pure. Clearly, the sampleused for (C) seems to be more leaky than the one use for (A).
7
K
outJ
L
M out0 1 2 3 4 5
Time (hours)
0
0.5
1
Fluo
resc
ence
(arb
itrar
y un
its)
let-7c, miR-124a (DNA)miR-124a, let-7c (DNA)let-7c, miR-124a (RNA)miR-124a, let-7c (RNA)
G E
F
QUENCHER
miR−124a
let−7c
FLUOROPHORE
q
f
(A) let−7c AND miR−124a
T
S out
FLUOROPHORE
QUENCHER
A f
B qUout
V
miR−10b
miR−15a
Cin
C
B in
Dm
0 1 2 3 4 5 6Time (hours)
0
0.5
1
Fluo
resc
ence
(arb
itrar
y un
its)
all inputsno miR-15ano miR-10bno miR-15a, no miR-10bno Cinno Bin
(B) (miR−15a OR miR−10b) AND B_in AND C_in
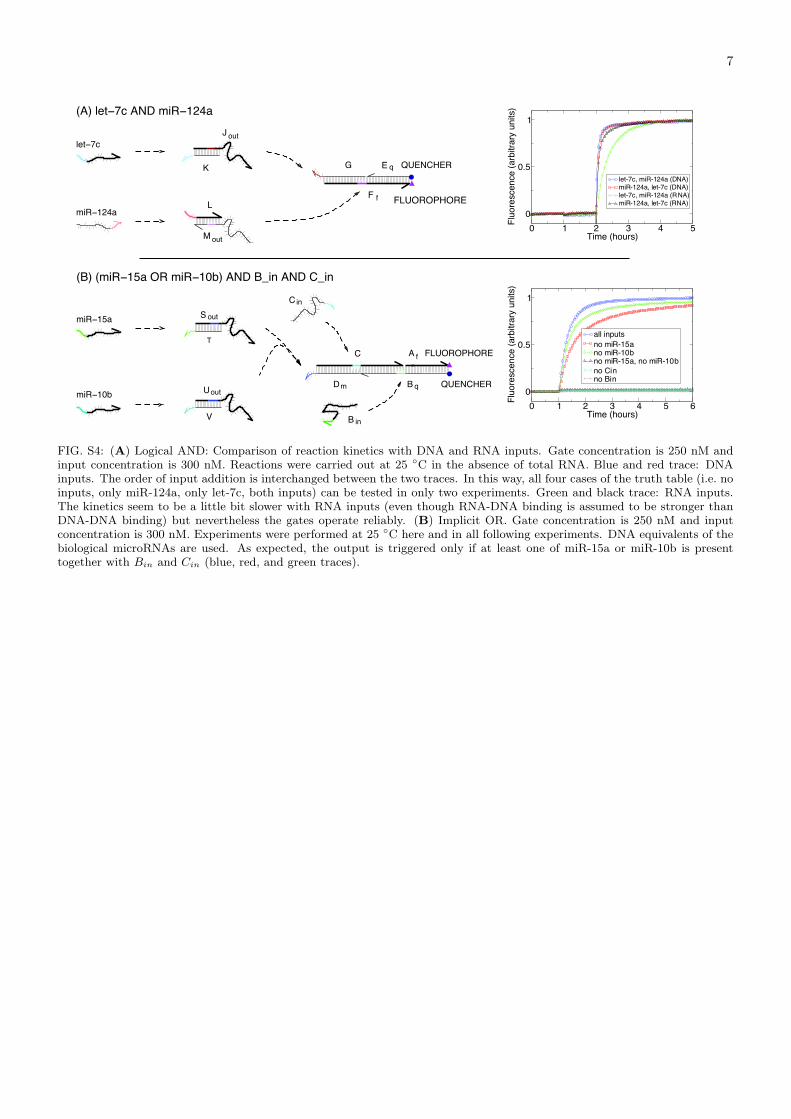
FIG. S4: (A) Logical AND: Comparison of reaction kinetics with DNA and RNA inputs. Gate concentration is 250 nM andinput concentration is 300 nM. Reactions were carried out at 25 ◦C in the absence of total RNA. Blue and red trace: DNAinputs. The order of input addition is interchanged between the two traces. In this way, all four cases of the truth table (i.e. noinputs, only miR-124a, only let-7c, both inputs) can be tested in only two experiments. Green and black trace: RNA inputs.The kinetics seem to be a little bit slower with RNA inputs (even though RNA-DNA binding is assumed to be stronger thanDNA-DNA binding) but nevertheless the gates operate reliably. (B) Implicit OR. Gate concentration is 250 nM and inputconcentration is 300 nM. Experiments were performed at 25 ◦C here and in all following experiments. DNA equivalents of thebiological microRNAs are used. As expected, the output is triggered only if at least one of miR-15a or miR-10b is presenttogether with Bin and Cin (blue, red, and green traces).
8
0 1 2 3 4Time (hours)
0
0.5
1
Flu
ores
cenc
e (a
rbitr
ary
units
)
[Aout] = 1uM[Aout] = 750 nM[Aout] = 500 nM[Aout] = 375 nM[Aout] = 250 nM[Aout] = 125 nM[Aout] = 75 nM[Aout] = 50 nM[Aout] = 25 nM
[Threshold] = 250 nM
0 1 2 3 4Time (hours)
0
0.5
1
Flu
ores
cenc
e (a
rbitr
ary
units
)
[Aout] = 375 nM[Aout] = 250 nM[Aout] = 187.5 nM[Aout] = 125[Aout] = 62.5 nM[Aout] = 37.5 nM[Aout] = 25 nM[Aout] = 12.5 nM
[Threshold] = 125 nM
0 1 2 3Time (hours)
0
0.5
1
Flu
ores
cenc
e (a
rbitr
ary
units
)
[Aout] = 500 nM[Aout] = 250 nM[Aout] = 125 nM[Aout] = 75 nM[Aout] = 50 nM[Aout] = 25 nM
[Threshold] = 250 nM
0 200 400 600[input] (nM)
0
0.5
1fin
al s
igna
l (fr
actio
n of
tota
l)
[threshold] = 125 nM[threshold] = 250 nM[threshold] = 250 nM
(C) (D)
(B)(A)
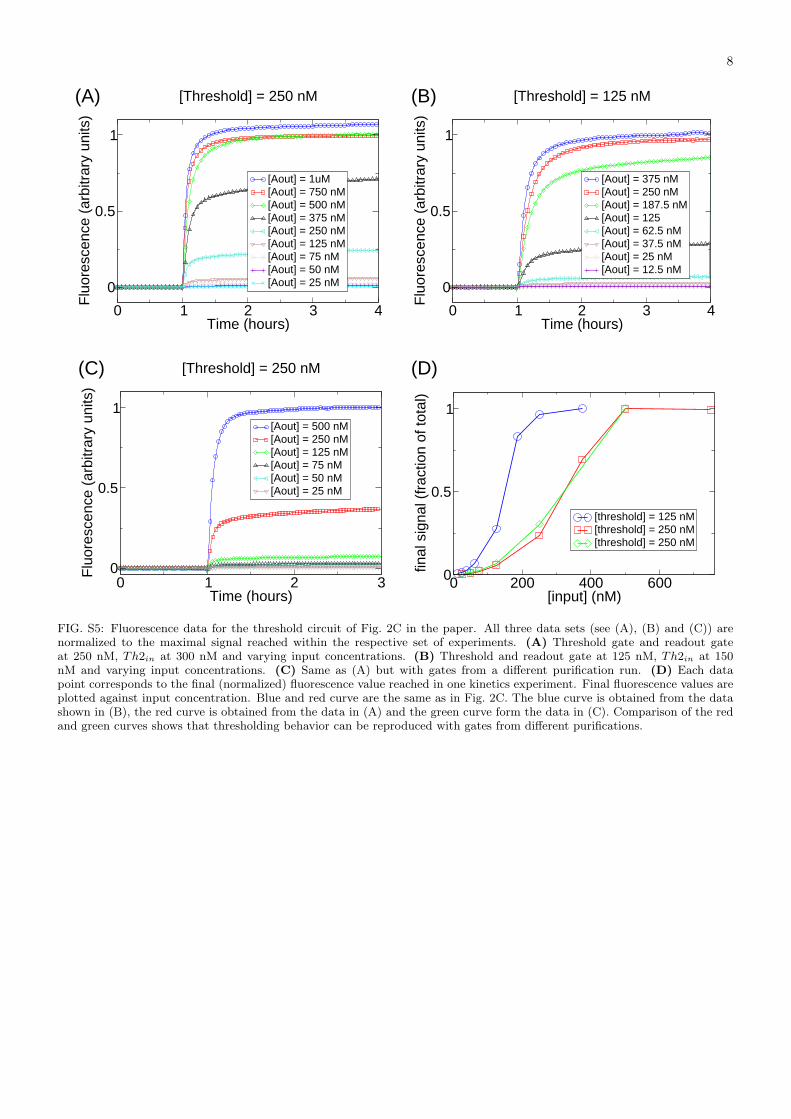
FIG. S5: Fluorescence data for the threshold circuit of Fig. 2C in the paper. All three data sets (see (A), (B) and (C)) arenormalized to the maximal signal reached within the respective set of experiments. (A) Threshold gate and readout gateat 250 nM, Th2in at 300 nM and varying input concentrations. (B) Threshold and readout gate at 125 nM, Th2in at 150nM and varying input concentrations. (C) Same as (A) but with gates from a different purification run. (D) Each datapoint corresponds to the final (normalized) fluorescence value reached in one kinetics experiment. Final fluorescence values areplotted against input concentration. Blue and red curve are the same as in Fig. 2C. The blue curve is obtained from the datashown in (B), the red curve is obtained from the data in (A) and the green curve form the data in (C). Comparison of the redand green curves shows that thresholding behavior can be reproduced with gates from different purifications.
9
Rout
3nt clamp
R2
R3
R4
R1
3nt clamp
miR−143
miR−143
Rout
R4
R1
R2
R3
+
+
+
+
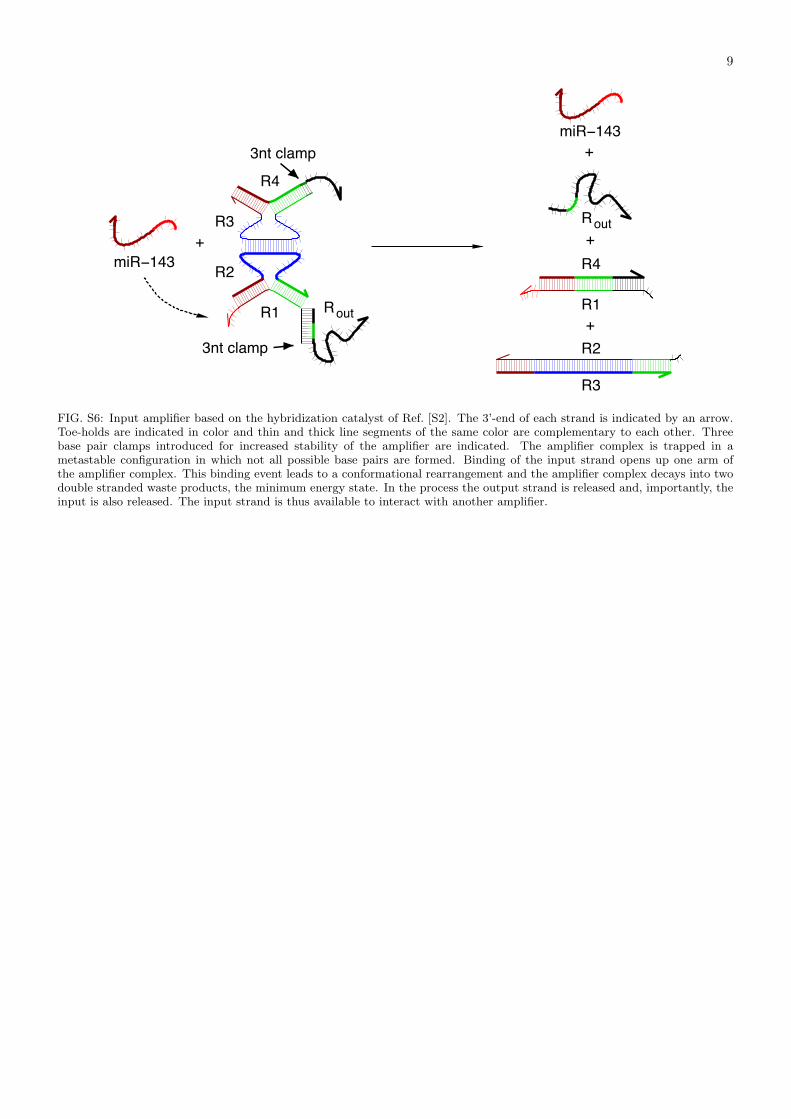
FIG. S6: Input amplifier based on the hybridization catalyst of Ref. [S2]. The 3’-end of each strand is indicated by an arrow.Toe-holds are indicated in color and thin and thick line segments of the same color are complementary to each other. Threebase pair clamps introduced for increased stability of the amplifier are indicated. The amplifier complex is trapped in ametastable configuration in which not all possible base pairs are formed. Binding of the input strand opens up one arm ofthe amplifier complex. This binding event leads to a conformational rearrangement and the amplifier complex decays into twodouble stranded waste products, the minimum energy state. In the process the output strand is released and, importantly, theinput is also released. The input strand is thus available to interact with another amplifier.
10
0 1 2 3 4 5 6Time (hours)
0
0.5
1
Fluo
resc
ence
(arb
itrar
y un
its)
[A] = 500 nM[A] = 100nM[A] = 50 nM[A] = 10 nM[A] = 5 nM[A] = 0 nM
[QoutPf] = [WY] = 500 nM
0 1 2 3 4 5 6Time (hours)
0
0.5
1
Fluo
resc
ence
(arb
itrar
y un
its)
[Aout] = 250 nM[Aout] = 50 nM[Aout] = 25 nM
[amplifier] = 250 nM(A) CATALYTIC SIGNAL AMPLIFIER
A
(B) FEEDBACK SIGNAL AMPLIFIER
Th
CA3
CA2
FLUOROPHORECA4
QUENCHER
CA1
Y
W
Q
Pf
QUENCHER
FLUOROPHORE
out
out
outaddedgate WY
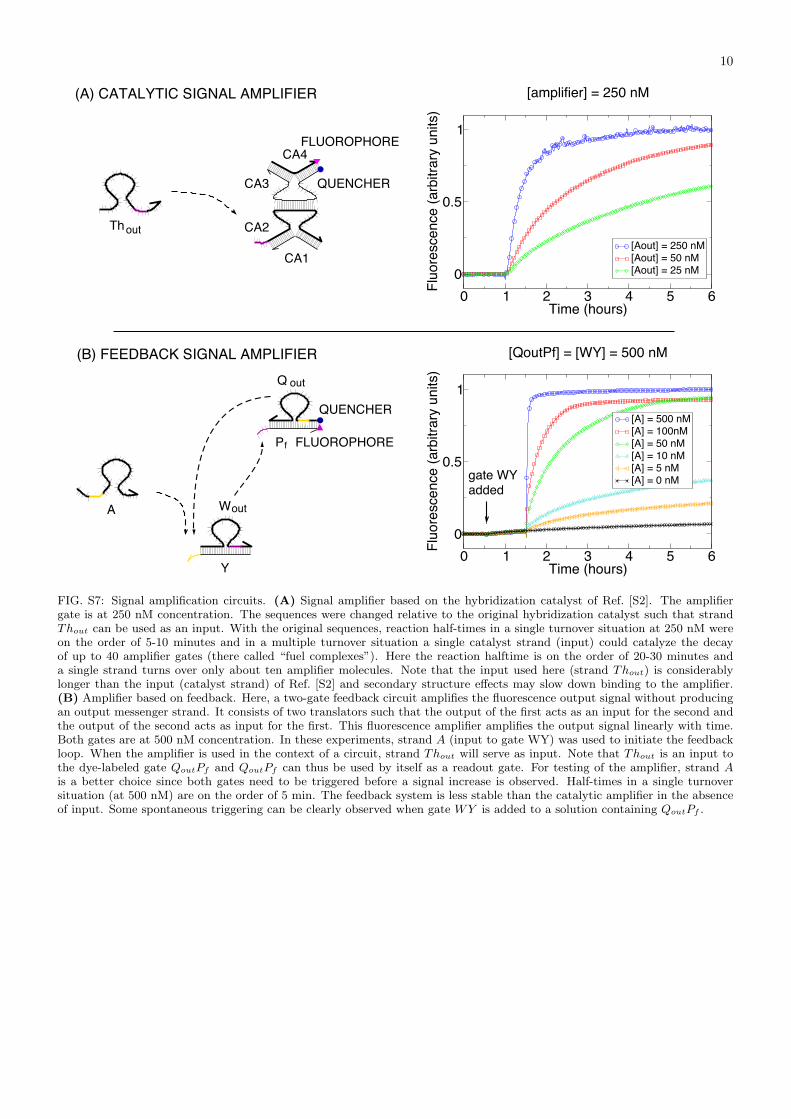
FIG. S7: Signal amplification circuits. (A) Signal amplifier based on the hybridization catalyst of Ref. [S2]. The amplifiergate is at 250 nM concentration. The sequences were changed relative to the original hybridization catalyst such that strandThout can be used as an input. With the original sequences, reaction half-times in a single turnover situation at 250 nM wereon the order of 5-10 minutes and in a multiple turnover situation a single catalyst strand (input) could catalyze the decayof up to 40 amplifier gates (there called “fuel complexes”). Here the reaction halftime is on the order of 20-30 minutes anda single strand turns over only about ten amplifier molecules. Note that the input used here (strand Thout) is considerablylonger than the input (catalyst strand) of Ref. [S2] and secondary structure effects may slow down binding to the amplifier.(B) Amplifier based on feedback. Here, a two-gate feedback circuit amplifies the fluorescence output signal without producingan output messenger strand. It consists of two translators such that the output of the first acts as an input for the second andthe output of the second acts as input for the first. This fluorescence amplifier amplifies the output signal linearly with time.Both gates are at 500 nM concentration. In these experiments, strand A (input to gate WY) was used to initiate the feedbackloop. When the amplifier is used in the context of a circuit, strand Thout will serve as input. Note that Thout is an input tothe dye-labeled gate QoutPf and QoutPf can thus be used by itself as a readout gate. For testing of the amplifier, strand Ais a better choice since both gates need to be triggered before a signal increase is observed. Half-times in a single turnoversituation (at 500 nM) are on the order of 5 min. The feedback system is less stable than the catalytic amplifier in the absenceof input. Some spontaneous triggering can be clearly observed when gate WY is added to a solution containing QoutPf .
11
miR−15a
miR−10b
0 1 2 3 4 5 6Time (hours)
0
0.5
1
Fluo
resc
ence
(arb
itrar
y un
its)
all inputsno miR-15ano miR-10bno miR-122a
no Cin
[all gates] = 250 nM
no miR-15a and no miR-10b
C
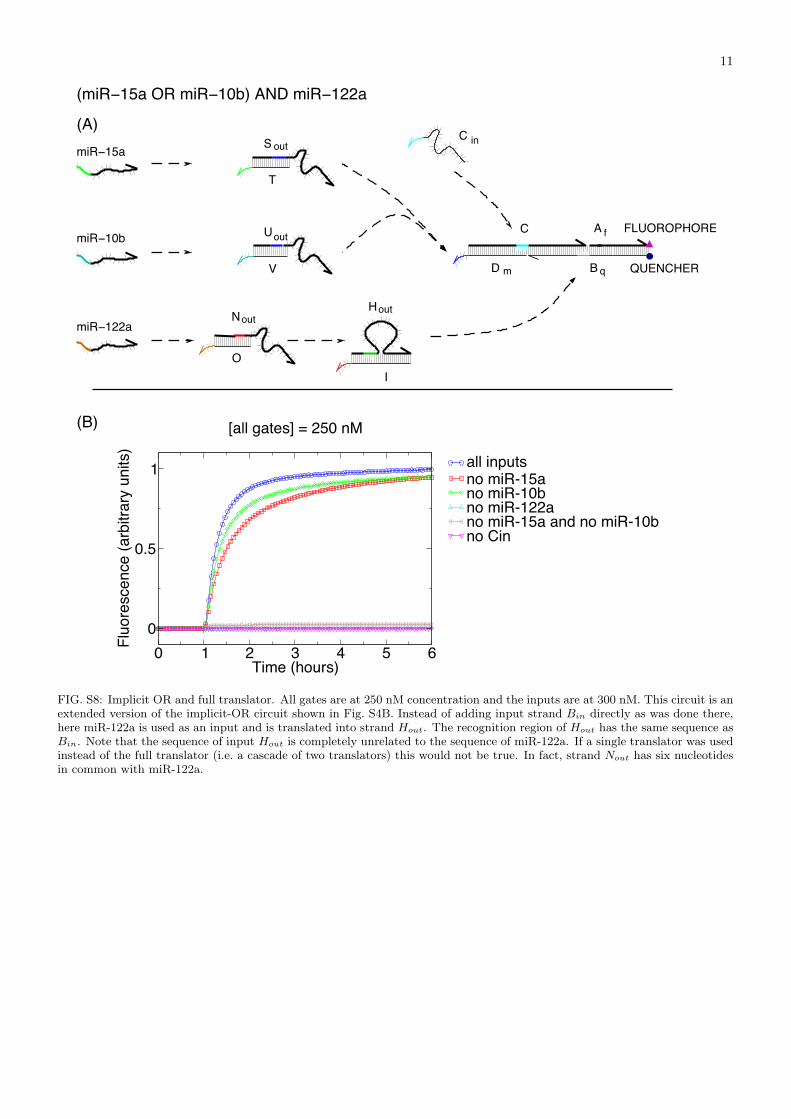
(miR−15a OR miR−10b) AND miR−122a
T
S
V
U
B
C
D QUENCHER
(A)
(B)
FLUOROPHORE
O
H
I
miR−122a
A
q
f
out
out
out in
Nout
m
FIG. S8: Implicit OR and full translator. All gates are at 250 nM concentration and the inputs are at 300 nM. This circuit is anextended version of the implicit-OR circuit shown in Fig. S4B. Instead of adding input strand Bin directly as was done there,here miR-122a is used as an input and is translated into strand Hout. The recognition region of Hout has the same sequence asBin. Note that the sequence of input Hout is completely unrelated to the sequence of miR-122a. If a single translator was usedinstead of the full translator (i.e. a cascade of two translators) this would not be true. In fact, strand Nout has six nucleotidesin common with miR-122a.
12
miR−143
miR−10b
miR−15a
miR−122a
0 1 2 3 4 5 6Time (hours)
0
0.5
1
Fluo
resc
ence
(arb
itrar
y un
its)
all inputsno miR-15ano miR-10bno miR-143no miR-122ano miR-15a and no miR-10bno miR-143 and no miR-122ano Cin
[all gates] = 250 nM
B
C
D
AV
U
T
S
R1
R2
R3
R4
R
Cin
q
f
out
out
out
IO
HNout
out
FLUOROPHORE
QUENCHER
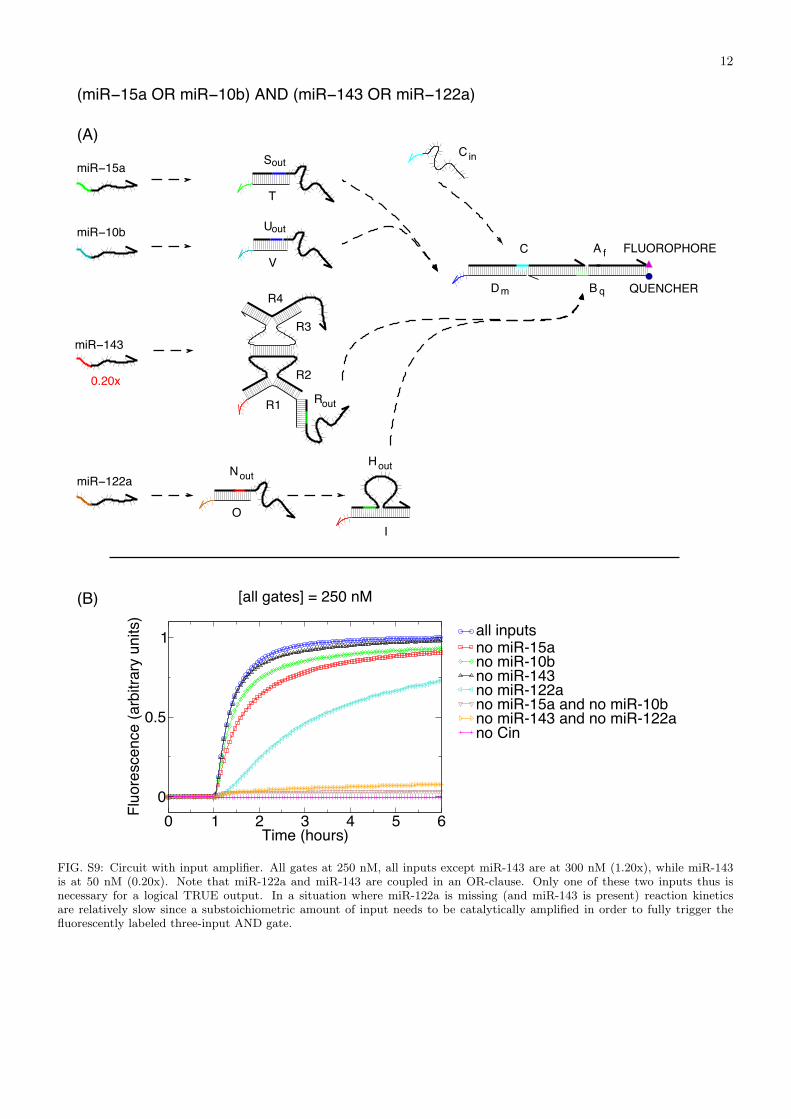
(miR−15a OR miR−10b) AND (miR−143 OR miR−122a)
(A)
m
(B)
0.20x
FIG. S9: Circuit with input amplifier. All gates at 250 nM, all inputs except miR-143 are at 300 nM (1.20x), while miR-143is at 50 nM (0.20x). Note that miR-122a and miR-143 are coupled in an OR-clause. Only one of these two inputs thus isnecessary for a logical TRUE output. In a situation where miR-122a is missing (and miR-143 is present) reaction kineticsare relatively slow since a substoichiometric amount of input needs to be catalytically amplified in order to fully trigger thefluorescently labeled three-input AND gate.
13
TRANSLATION AND INPUTAMPLIFICATION
miR−143
miR−122a
Th out
M out
S out
Uout
J out
Nout
Pf
miR−10b
miR−15a
let−7c
Wout
Y
miR−124a
0 2 4 6 8 10 12Time (hours)
0
0.5
Fluo
resc
ence
(arb
itrar
y un
its)
all inputsno miR-15ano miR-10bno miR-143no miR-122ano miR-15a and no miR-10bno miR-143 and no miR-122ano let-7cno miR-124a
[all gates] = 200 nM
B
C
D
ATh2
T
K
L
V
R1
R2
R3
R4
R
I
H
O
G
F
E Th2
Th1 Th1
out
out
out
out in
COMPUTATIONAL SUBCIRCUIT SIGNAL RESTORATION
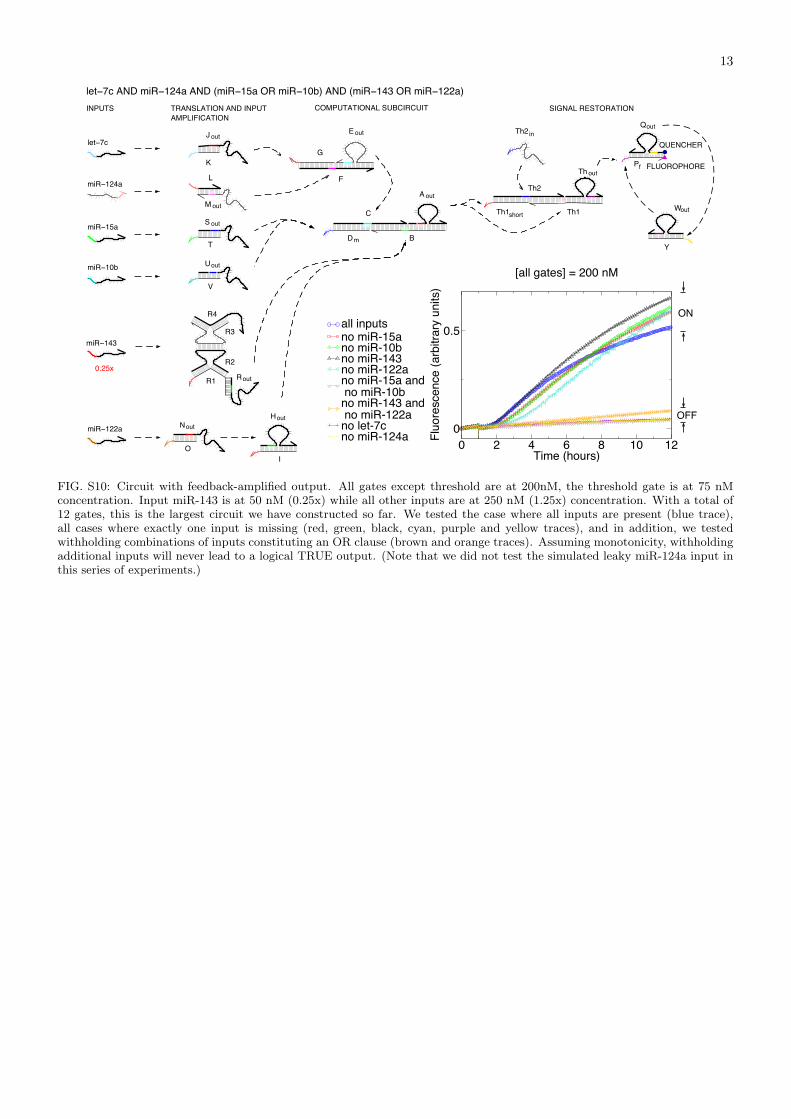
let−7c AND miR−124a AND (miR−15a OR miR−10b) AND (miR−143 OR miR−122a)INPUTS
ON
OFF
m
QUENCHER
FLUOROPHORE
outQ
short
0.25x
FIG. S10: Circuit with feedback-amplified output. All gates except threshold are at 200nM, the threshold gate is at 75 nMconcentration. Input miR-143 is at 50 nM (0.25x) while all other inputs are at 250 nM (1.25x) concentration. With a total of12 gates, this is the largest circuit we have constructed so far. We tested the case where all inputs are present (blue trace),all cases where exactly one input is missing (red, green, black, cyan, purple and yellow traces), and in addition, we testedwithholding combinations of inputs constituting an OR clause (brown and orange traces). Assuming monotonicity, withholdingadditional inputs will never lead to a logical TRUE output. (Note that we did not test the simulated leaky miR-124a input inthis series of experiments.)
14
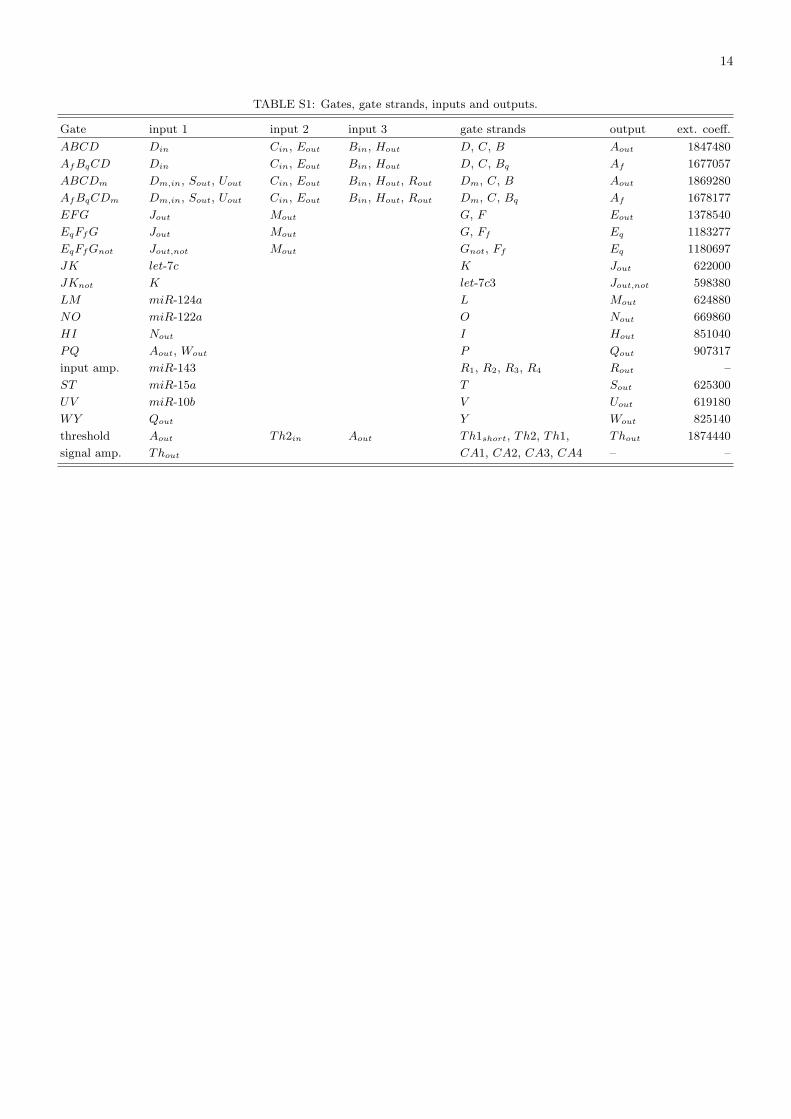
TABLE S1: Gates, gate strands, inputs and outputs.
Gate input 1 input 2 input 3 gate strands output ext. coeff.
ABCD Din Cin, Eout Bin, Hout D, C, B Aout 1847480
AfBqCD Din Cin, Eout Bin, Hout D, C, Bq Af 1677057
ABCDm Dm,in, Sout, Uout Cin, Eout Bin, Hout, Rout Dm, C, B Aout 1869280
AfBqCDm Dm,in, Sout, Uout Cin, Eout Bin, Hout, Rout Dm, C, Bq Af 1678177
EFG Jout Mout G, F Eout 1378540
EqFfG Jout Mout G, Ff Eq 1183277
EqFfGnot Jout,not Mout Gnot, Ff Eq 1180697
JK let-7c K Jout 622000
JKnot K let-7c3 Jout,not 598380
LM miR-124a L Mout 624880
NO miR-122a O Nout 669860
HI Nout I Hout 851040
PQ Aout, Wout P Qout 907317
input amp. miR-143 R1, R2, R3, R4 Rout –
ST miR-15a T Sout 625300
UV miR-10b V Uout 619180
WY Qout Y Wout 825140
threshold Aout Th2in Aout Th1short, Th2, Th1, Thout 1874440
signal amp. Thout CA1, CA2, CA3, CA4 – –
15
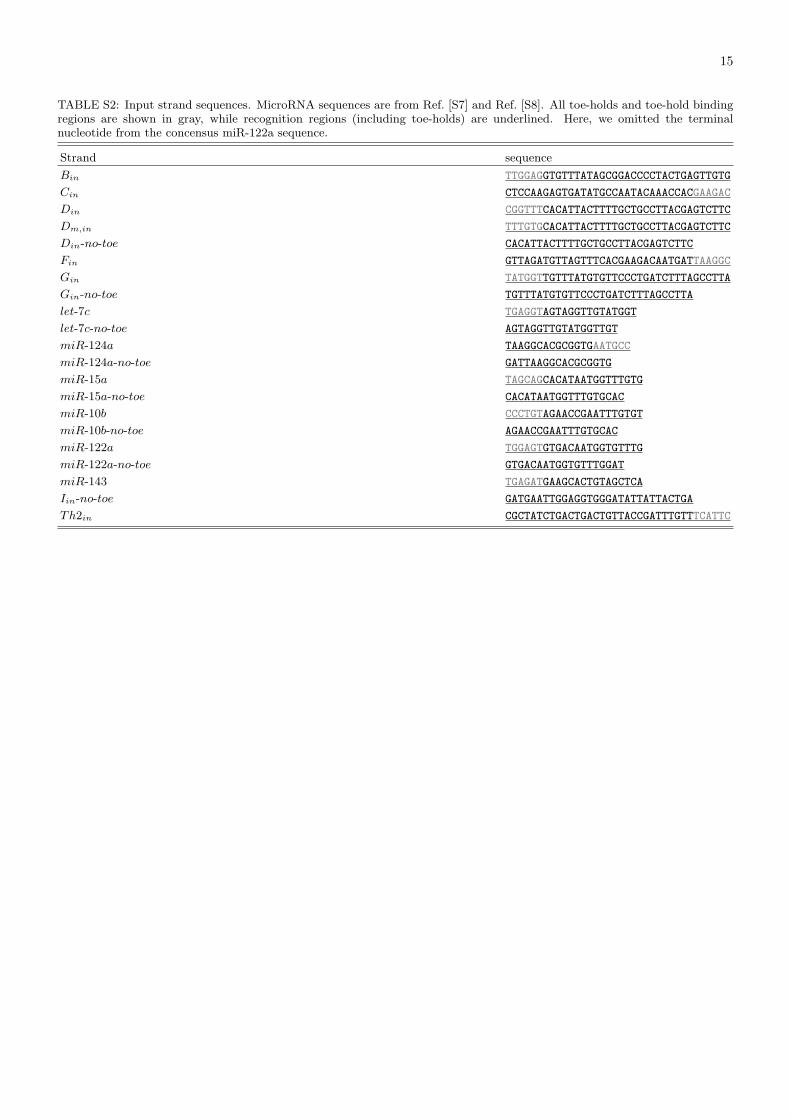
TABLE S2: Input strand sequences. MicroRNA sequences are from Ref. [S7] and Ref. [S8]. All toe-holds and toe-hold bindingregions are shown in gray, while recognition regions (including toe-holds) are underlined. Here, we omitted the terminalnucleotide from the concensus miR-122a sequence.
Strand sequence
Bin TTGGAGGTGTTTATAGCGGACCCCTACTGAGTTGTG
Cin CTCCAAGAGTGATATGCCAATACAAACCACGAAGAC
Din CGGTTTCACATTACTTTTGCTGCCTTACGAGTCTTC
Dm,in TTTGTGCACATTACTTTTGCTGCCTTACGAGTCTTC
Din-no-toe CACATTACTTTTGCTGCCTTACGAGTCTTC
Fin GTTAGATGTTAGTTTCACGAAGACAATGATTAAGGC
Gin TATGGTTGTTTATGTGTTCCCTGATCTTTAGCCTTA
Gin-no-toe TGTTTATGTGTTCCCTGATCTTTAGCCTTA
let-7c TGAGGTAGTAGGTTGTATGGT
let-7c-no-toe AGTAGGTTGTATGGTTGT
miR-124a TAAGGCACGCGGTGAATGCC
miR-124a-no-toe GATTAAGGCACGCGGTG
miR-15a TAGCAGCACATAATGGTTTGTG
miR-15a-no-toe CACATAATGGTTTGTGCAC
miR-10b CCCTGTAGAACCGAATTTGTGT
miR-10b-no-toe AGAACCGAATTTGTGCAC
miR-122a TGGAGTGTGACAATGGTGTTTG
miR-122a-no-toe GTGACAATGGTGTTTGGAT
miR-143 TGAGATGAAGCACTGTAGCTCA
Iin-no-toe GATGAATTGGAGGTGGGATATTATTACTGA
Th2in CGCTATCTGACTGACTGTTACCGATTTGTTTCATTC
16
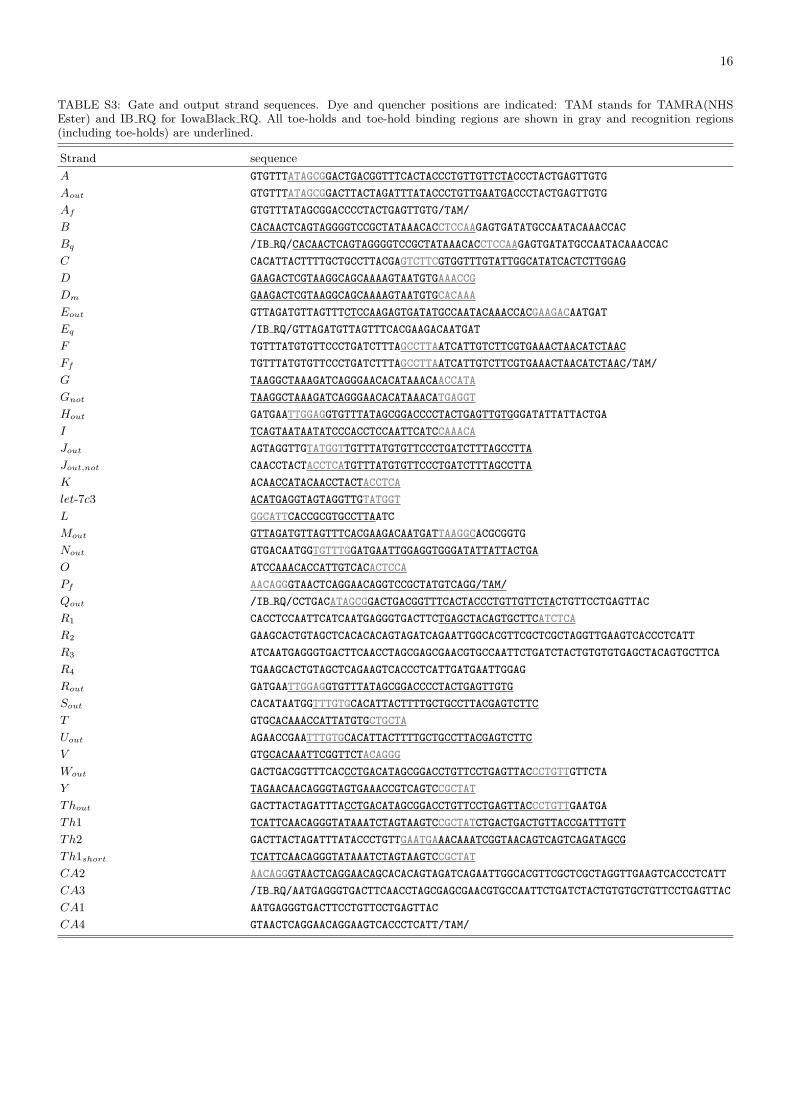
TABLE S3: Gate and output strand sequences. Dye and quencher positions are indicated: TAM stands for TAMRA(NHSEster) and IB RQ for IowaBlack RQ. All toe-holds and toe-hold binding regions are shown in gray and recognition regions(including toe-holds) are underlined.
Strand sequence
A GTGTTTATAGCGGACTGACGGTTTCACTACCCTGTTGTTCTACCCTACTGAGTTGTG
Aout GTGTTTATAGCGGACTTACTAGATTTATACCCTGTTGAATGACCCTACTGAGTTGTG
Af GTGTTTATAGCGGACCCCTACTGAGTTGTG/TAM/
B CACAACTCAGTAGGGGTCCGCTATAAACACCTCCAAGAGTGATATGCCAATACAAACCAC
Bq /IB RQ/CACAACTCAGTAGGGGTCCGCTATAAACACCTCCAAGAGTGATATGCCAATACAAACCAC
C CACATTACTTTTGCTGCCTTACGAGTCTTCGTGGTTTGTATTGGCATATCACTCTTGGAG
D GAAGACTCGTAAGGCAGCAAAAGTAATGTGAAACCG
Dm GAAGACTCGTAAGGCAGCAAAAGTAATGTGCACAAA
Eout GTTAGATGTTAGTTTCTCCAAGAGTGATATGCCAATACAAACCACGAAGACAATGAT
Eq /IB RQ/GTTAGATGTTAGTTTCACGAAGACAATGAT
F TGTTTATGTGTTCCCTGATCTTTAGCCTTAATCATTGTCTTCGTGAAACTAACATCTAAC
Ff TGTTTATGTGTTCCCTGATCTTTAGCCTTAATCATTGTCTTCGTGAAACTAACATCTAAC/TAM/
G TAAGGCTAAAGATCAGGGAACACATAAACAACCATA
Gnot TAAGGCTAAAGATCAGGGAACACATAAACATGAGGT
Hout GATGAATTGGAGGTGTTTATAGCGGACCCCTACTGAGTTGTGGGATATTATTACTGA
I TCAGTAATAATATCCCACCTCCAATTCATCCAAACA
Jout AGTAGGTTGTATGGTTGTTTATGTGTTCCCTGATCTTTAGCCTTA
Jout,not CAACCTACTACCTCATGTTTATGTGTTCCCTGATCTTTAGCCTTA
K ACAACCATACAACCTACTACCTCA
let-7c3 ACATGAGGTAGTAGGTTGTATGGT
L GGCATTCACCGCGTGCCTTAATC
Mout GTTAGATGTTAGTTTCACGAAGACAATGATTAAGGCACGCGGTG
Nout GTGACAATGGTGTTTGGATGAATTGGAGGTGGGATATTATTACTGA
O ATCCAAACACCATTGTCACACTCCA
Pf AACAGGGTAACTCAGGAACAGGTCCGCTATGTCAGG/TAM/
Qout /IB RQ/CCTGACATAGCGGACTGACGGTTTCACTACCCTGTTGTTCTACTGTTCCTGAGTTAC
R1 CACCTCCAATTCATCAATGAGGGTGACTTCTGAGCTACAGTGCTTCATCTCA
R2 GAAGCACTGTAGCTCACACACAGTAGATCAGAATTGGCACGTTCGCTCGCTAGGTTGAAGTCACCCTCATT
R3 ATCAATGAGGGTGACTTCAACCTAGCGAGCGAACGTGCCAATTCTGATCTACTGTGTGTGAGCTACAGTGCTTCA
R4 TGAAGCACTGTAGCTCAGAAGTCACCCTCATTGATGAATTGGAG
Rout GATGAATTGGAGGTGTTTATAGCGGACCCCTACTGAGTTGTG
Sout CACATAATGGTTTGTGCACATTACTTTTGCTGCCTTACGAGTCTTC
T GTGCACAAACCATTATGTGCTGCTA
Uout AGAACCGAATTTGTGCACATTACTTTTGCTGCCTTACGAGTCTTC
V GTGCACAAATTCGGTTCTACAGGG
Wout GACTGACGGTTTCACCCTGACATAGCGGACCTGTTCCTGAGTTACCCTGTTGTTCTA
Y TAGAACAACAGGGTAGTGAAACCGTCAGTCCGCTAT
Thout GACTTACTAGATTTACCTGACATAGCGGACCTGTTCCTGAGTTACCCTGTTGAATGA
Th1 TCATTCAACAGGGTATAAATCTAGTAAGTCCGCTATCTGACTGACTGTTACCGATTTGTT
Th2 GACTTACTAGATTTATACCCTGTTGAATGAAACAAATCGGTAACAGTCAGTCAGATAGCG
Th1short TCATTCAACAGGGTATAAATCTAGTAAGTCCGCTAT
CA2 AACAGGGTAACTCAGGAACAGCACACAGTAGATCAGAATTGGCACGTTCGCTCGCTAGGTTGAAGTCACCCTCATT
CA3 /IB RQ/AATGAGGGTGACTTCAACCTAGCGAGCGAACGTGCCAATTCTGATCTACTGTGTGCTGTTCCTGAGTTAC
CA1 AATGAGGGTGACTTCCTGTTCCTGAGTTAC
CA4 GTAACTCAGGAACAGGAAGTCACCCTCATT/TAM/

17
[S1] Puglisi, J. D. & Tinoco, I., Jr. (1989) in Methods in Enzymology 180, eds. Dahlberg, J. E. & Abelson, J. N. (AcademicPress, San Diego), 304–325.
[S2] Seelig, G., & Yurke, B., & Winfree, E. (2006) J. Am. Chem. Soc., 128, 12211–12220.[S3] Hofacker, I. & Fontana, W. & Stadler, P. & Bonhoeffer, L. & Tacker, M. & Schuster, P. (1994) Chemical Monthly 125,
167–188.[S4] SantaLucia, Jr., J. (1998) Proc. Natl. Acad. Sci. USA 95, 1460–1465.[S5] Seeman, N. C. (1982) J. Theor. Biol. 99, 237–247.[S6] Dirks, R. M., & Lin, M. & Winfree, E. & Pierce, N. A. (2004) Nucleic Acids Research 32, 1392–1403.[S7] Lagos-Quintana, M., & Rauhut, R., & Yalcin, A., & Meyer, J., & Lendeckel, W., & Tuschl, T. (2002) Current Biology 12,
735–739.[S8] Lagos-Quintana, M., & Rauhut, R., & Meyer, J., & Borkhardt, A., & Tuschl, T. (2003) RNA 9, 175–179.