Embed Size (px)
Citation preview

Supporting Older
People Conference
SP6: Private Rented Sector –
an opportunity or a risk too far?
Speakers: Dominic Martin
PRS Taskforce, Communities and Local Government
Jack Stephen
Finance Director and Deputy Chief Executive, Thames Valley Housing Association Chair: Robert Kerse
Executive Director of Finance, Circle Housing

The New Investor / Institutional
Private Rented Sector
Dominic Martin MRICS
PRS Taskforce

81
PRS Context: Understand the growing role of
PRS in the housing market and hear first-hand
how a housing association has successfully
diversified into the market
Location/Property Strategies: Discover
strategies for market, location, customer and
property type and design
Schemes: Hear about schemes that have been
developed and their typical characteristics
Identify how to protect your social housing
assets
Funding Initiatives & Op Costs: Find out
about funding initiatives and how to keep
operating costs down
Corporate Structures: Learn how to structure
the commercial corporate structure to make it
attractive to investors
To Cover
PRS / B2R
From a private
sector market
perspective
But
Relevance for
the HA
audience

Agenda
1. Market Activity / Context
2. Government Overview / Initiatives
3. Why Now
4. Investment Considerations
5. Management & Tenant Considerations
Appendices: Government Funding Initiatives
NPPF Planning Guidance
Valuation
Rental Premiums
Amenities – Importance vs Pay More Rent
Development Considerations
82

Market Context /
Activity
83

84
Market Context / Activity
Excluding Private Placement & Bond Issues
Transaction Type Example Location
Frwd Commitment to Purchase Macquarie: Fizzy Living / Thames Valley London/M25
Frwd Commitment to Purchase Notting Hill Group London
Frwd Commitment to Purchase APG: Delancey London
Frwd Commitment to Purchase L&Q & Bellway London
Joint Venture Grainger & Bouygues Barking
Joint Venture Sigma Barking Riverside
Joint Venture Amcorp Properties: Native Land, Grosvenor London
Joint Venture L&Q & Barratts London
Long-dated Income M&G: Popula HARCA & Be:Here Now London
Long-dated Income Aviva: Derwent Living Regions
Site Acquisition Qatari Diar: Delancey (East Village) London
Site Acquisition ADIA: Fizzy Living / Thames Valley tbc
Site Acquisition Gatehouse: Sigma Manchester / Liverpool
Site Acquisition Washington State Pension Board: Essential Living London
BTR1 R1 & R2 London,South East, Manc'ster
Not primarily the volume housebuilders
Developers: Dev Sec, Lend Lease, Grosvenor, Quintain, Delancey
Investors: Direct let; international investors!
Structures: Joint ventures, partnerships & corporate vehicles

85
The New PRS: What Does it Look Like
Wholesale not Retail: preferably c.£20m say
Commercial Product : Income driven; like a shopping centre or a
multi tenanted office. Valued as Investment (ie NOI * cap rate).
Professionally Managed
85
BUT
Physically can be low rise, medium rise or high rise
Urban or suburban
Pools / Concierge Not Obligatory
Low Rise Suburbia Low Rise Urban High Rise - Urban
Business Centre Roof Terrace ATM Cinema Room Concierge Shared Space Pool/Gym

86
NEW / RECENT HISTORIC
Skyline Central (130 units)
Manchester
Dolphin Square (1,200 units)
Pimlico, London
East Village (1,500 units)
Stratford, London
Hamlet Gardens (150 units)
Hammersmith, London
Halo (400 units)
Stratford, London
Genesis & M&G
Sales & Leaseback
Waverley Court (90 units )
Horsham
Fizzy Living (120 units)
Canning Town, London
Off-Plan Purchase
Viney Court (16 units)
Clapham, London
Market Context / Activity
Exists Already
Not ‘specifically designed’ as rental
HA
HA

Construction Costs (Height / Region - ECH)
Rents (Annual / Region - Hometrack)
Development Viability – National Context
End Value vs
Delivery Costs

GDV: £20m + GDV: £10m
Invest Unit
ValUnits
Unit Area
(sqft)£psf
Invest Unit
ValUnits
Unit Area
(sqft)£psf
£100,000 200 700 £143 £100,000 100 700 £143
£125,000 160 700 £179 £125,000 80 700 £179
£150,000 133 700 £214 £150,000 67 700 £214
£175,000 114 700 £250 £175,000 57 700 £250
£200,000 100 700 £286 £200,000 50 700 £286
£225,000 89 700 £321 £225,000 44 700 £321
88
Market Context / Activity
Investors: Min Lot Size vs Units??

Why Now
89

Barriers vs Favourable Conditions
Favourable Conditions: conditions for institutional investment in large scale developments more favourable than they have been in the past:
• Strong rental demand and good long term prospects
• Returns vs commercial property / low volatility (IPD)
• Tax changes (SDLT)
• Emerging models helping establish the concept & developing expertise
• Government support
Remaining barriers/concerns?: these include:
• Scale
• Management platforms & quality of teams to
underpin returns
• Rental returns / rental growth prospects (lack of
data)
• Planning system
• Government regulation “We are at a tipping point [in the PRS]. The journey from niche to mainstream is
just beginning.”
Martin Moore, Chairman PRUPIM – 16th April 2013
“It depends on the planning environment…but…it’s our…intention to have a much bigger role in the private
rented accommodation market”
Nigel Wilson – Chief Executive – Legal and General – 14th August 2013

91
Demand is Growing: PRS houses
3.8 million households in England,
compared to 2 million in the early
‘80s. Greater than AH housing stock
Small Landlords: Much of the
growth in the rented sector has
been driven by individual landlords.
Where 10% all stock, LL’s with 4 or
less properties
Institutional Ownership – Other
Countries: Contrast to international
comparators where institutional
ownership is more prevalent
(US@13%, Dutch @ 37%.
Germany @ 17%) .
Context

92
Favourable Conditions: Construction &
Returns of UK Resi Property
...versus other asset classes
6.6
3.2
6.6
10.1
0
2
4
6
8
10
12
All property
index
Equities Gilts Residential
Market Lets
Annualised total return
0
50
100
150
200
250
300
350
2001
2003
2005
2007
2009
2011
2013
2015
2017
2019
2021
2023
Permanent dwellings completed (thousands)
Projected new household formation (thousands)
Source: IPD Residential Index 2012 (last 12yrs)
Source: Hometrack Source: DCLG

Government
93

94
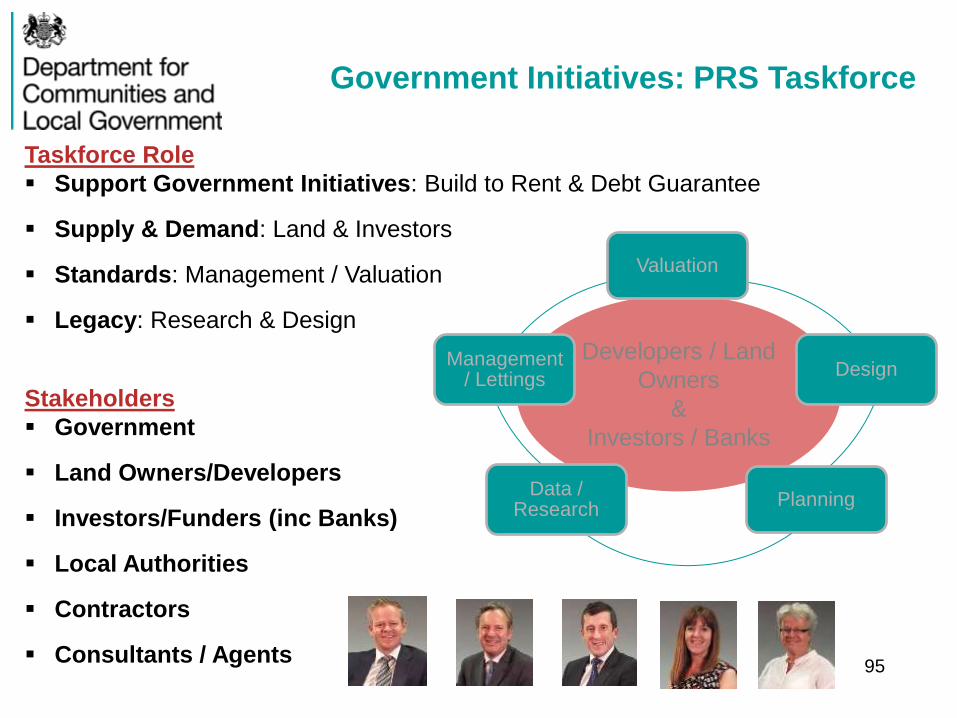
Government Initiatives: Overview
Recognition of Tenure: x 4 Housing Tenures: Private
ownership, shared ownership, social/affordable rents and
market rent (PRS)
Sir Adrian Montague review (summer 2012): Taskforce
and two Government funding schemes: Build to Rent Fund
and Long Term Debt Guarantees
National Planning Policy - Specific Recognition: PRS to
taken account of within the assessment of Housing Need,
and LPAs to understand that viability drivers are different
than housing for sale
Developers / Land
Owners
&
Investors / Banks
95
Government Initiatives: PRS Taskforce
Stakeholders
Government
Land Owners/Developers
Investors/Funders (inc Banks)
Local Authorities
Contractors
Consultants / Agents
Taskforce Role
Support Government Initiatives: Build to Rent & Debt Guarantee
Supply & Demand: Land & Investors
Standards: Management / Valuation
Legacy: Research & Design
Valuation
Design
Planning Data /
Research
Management / Lettings

Investment
Considerations
96

97
Investment Considerations
GVA Data – Top 10 (Gross Value Added) 1997 to 2011 2008 to 2011
Rank Location Growth Region Rank Location Growth Region
1 Inner London - East 160% London 1 Bedford 26% East
2 Inner London - West 110% London 2 West Cumbria 22% North West
3 Bath and North East Somerset, North Somerset and South Gloucestershire108% South West 3 Oxfordshire 18% South East
4 Oxfordshire 106% South East 4 East Derbyshire 17% East Midlands
5 Milton Keynes 105% South East 5 Inner London - East 16% London
6 Cambridgeshire CC 103% East 6 Bath and North East Somerset, North Somerset and South Gloucestershire16% South West
7 Berkshire 99% South East 7 Sandwell 15% West Midlands
8 Surrey 96% South East 8 Central Bedfordshire 14% East
9 Cornwall and Isles of Scilly 95% South West 9 Cambridgeshire CC 13% East
10 Hampshire CC 93% South East 10 Berkshire 13% South East
Region Count Region Count
East 1 East 3
East Midlands 0 East Midlands 1
London 2 London 1
North East 0 North East 0
North West 0 North West 1
South East 5 South East 2
South West 2 South West 1
West Midlands 0 West Midlands 1
Yorkshire & The Humber 0 Yorkshire & The Humber 0
East / Midlands
Income certainty…
Job market / Where is the Growth

98
Demographic Trends (8 ‘Core Cities’)
Pop
%
change
since Living in PRS
Location 2011 % 2001 2001 2011 % in 2011
%
change Location 16-24 25-34 16-24 25-34
Manchester 503,127 28.1 26,885 58,170 28.4 116 Manchester 65 114 6,598 19,757
Birmingham 1,073,045 9.8 34,508 73,405 17.9 113 Liverpool 71 90 4,065 13,006
Bristol 428,234 12.5 21,711 43,028 23.5 98 Birmingham 42 64 9,800 30,994
Liverpool 466,415 6.1 24,604 48,290 23.4 96 Bristol 40 64 5,829 21,823
Sheffield 552,698 7.7 18,544 35,760 15.6 93 Sheffield 50 62 5,206 17,133
Leeds 751,485 5.0 30,599 57,456 17.9 88 Leeds 35 61 9,318 28,749
Nottingham UA 305,680 14.5 16,307 29,098 23.1 78 Newcastle 54 47 3,525 10,862
Newcastle 280,177 7.9 13,466 22,318 19.1 66 Nottingham UA 10 44 3,979 10,470
% Change in
employed with
high level
qualifications
2001 Employed
with
high level
qualifications
98
Manchester: PRS up by 116% + High Level Qual up by 114%
Liverpool: PRS up by 96% + High Level Qual up by 90%
Living In PRS Employed with High Level Qual
CLG / ONS CLG / ONS
Investment Considerations

99
Investment Considerations
Affordability
Savills – Jacqui Daly (020 7016 3779 / [email protected])
Affordability & Culture of Sharing:
- Particular to cities / local markets
- Will influence mix of units
- Eye on:
- Initial Let-up
- Long term: limiting void
turnaround
- Long term; matching long-term
demographic changes

Management &
Tenants
100

Management & Tenants
101
Front of house:
gross rents
Back office
operation efficiency:
net rent
Do it yourself Buy in some
services X 2 Options:
X 2 Perspectives:

102
Estate Management
(Freeholder) Property / Unit
Management function
Unit Letting
Function
Estate Manager
Estate Management teams
(common parts repair &
maintenance; full time or
shared teams across
buildings)
Front of house/concierge
Data analysis and asset
management reporting
Property management team
Arrangement and scheduling of
emergency and routine repairs
and maintenance from initial
instruction to final payment
Voids repairs/refurbishment
Rent collection/credit control
General customer liaison
Emergency helpline service
Record keeping and reporting
Marketing / Tenant find
Viewing / Offer
Negotiating and agreeing
terms of AST
Reference / Credit check
Check in / check out
Inventories
Tenancy deposit liaison
Handover/intro to Property
Manager
Management & Tenants
UK Current – Property Functions: x 3
UK Future – Property Functions: x 1

103
Management & Tenants
Gross to Net Rental Attrition
With Sinking Fund
Void 2.50% 2.50% 5.00%
Bad Debt 2.50% 2.50% 5.00%
Management & Letting Costs 7.00% 10.00% 13.00%
Repairs and Maitenance 8.00% 10.00% 12.00%
Sinking Fund 2.50% 2.50% 5.00%
Sub-total 22.50% 27.50% 40.00%
Running Cost Range: 22.5% to 40.0%
Functions:Types: Strategy:
Estate Management Internal
Property Management Externalise
or
Lettings Combination
MFH Operation

What Tenants Want
Savills Tenant Survey (Oct 2013)
104
Savills – Susan Emmett (0203 107 5460/ [email protected])

105
QUESTIONS

106
• Up to £1bn commercial development finance at rates lower than would normally be available in the market
• Large-scale, professionally managed institutional quality rental homes
• Round 1. 2 deals contracted. Further 19 in pipeline.
•c£300m. Nearly 4000 units. Across England.
• Round 2. c£700m available. £2.7bn of bids. 36,000 units. Weighted to London, South East and Manchester
•Shortlisting by end February/DD commencing March 2014.
• Up to £6.5bn of direct debt guarantees to support long term ownership – 30 years
• Enable owners to borrow at a lower rate than might otherwise be possible • Min project size £10m (can be more than one site)
• Maximum loan/equity: 80:20
• Maximum rent/interest cover net – 1.2:1
• Probable dual approach – direct and indirect • First direct proposal received
Build to Rent Fund PRS Debt Guarantee Scheme
Government Initiatives: B2R Fund & Debt
Guarantee

107
PRS & Local Housing Strategies:
“Plan makers should look at the household types, tenure and size in the
current stock and in recent supply, and assess whether continuation of
these trends would meet future needs.”
Text thereafter follows in respect of PRS.
PRS & Viability:
“The viability of individual development types, both commercial and
residential, should be considered. Relevant factors will vary from one land
use type to another. For residential schemes, viability will vary with
housing type. For example, in respect of developments of multiple units
held in single ownership as private rented sector housing intended for long
term rental, viability considerations in decision-taking should take account
of the economics of such schemes, which will differ from build for sale.
This may require a different approach to planning obligations or an
adjustment of policy requirements.”
NPPF Planning Guidance
Planning Viability

108
Viability Negotiations / Local Requirements
Birmingham City Council & Evenbrook (2010)
RBKC & Grainger (2013)
City of Westminster & Mercers (2014)
LB Brent & Wembley City (2014)
Manchester City Council (ongoing)
LB Ealing (ongoing)
LLDC & Sweetwater & Eastwick (ongoing)
Planning Viability
- Every LA / Needs Are Different
- Negotiation therefore specific to those needs (no right or
wrong approach)
Examples

109
- Scale: 20 units vs 50 vs 100 vs 200 vs 300+
- Housing Type: apartments vs houses
- Local Market: Break up potential, tbc on demand for units for
sale and stock in question vs local market competition
Considerations:
- Net Operating Income
- Discount Vacant Possession Value (Open Market)
Approach:
Development Viability
Valuation

Development Viability
Notes:
Analysis of selected new build schemes in
mid-market inner London locations
Evidence of a new build rental premium but
driven by a variety of factors. 110
10%-15%
Premium Therefore:
1.New build proven @ c.10% to 15%
2.Service @ c.?
Target Rent But New Build Rental Premium?
Hometrack – Richard Donnell (0845 013 2360 / [email protected])

What Tenants Want
Savills Tenant Survey (Oct 2013)
111
Savills – Susan Emmett (0203 107 5460/ [email protected])

Development Considerations
I) Development Viability:
- Construction Costs
- Floor Areas & Efficiency*
- Rent Premiums
II) Investment Viability:
- Job Market / Growing Local Economy
- Running Costs / Gross 2 Net Attrition (front and back of house)
III) Planning & Local Authorities:
- Local Authorities – What are the Benefits / Concerns
- Flexible Negotiation (S106 / CIL / AH) & Covenant / Clawback
IV) What Tenants Want (Savills)*:
- Longer Leases Or Not
- Amenities or Not
V) Local Market Dynamics:
- Demographic trends / sharers or not
- Competition (amenities / quality / specification)
- Rental Growth Projections*
- Unit mix (local agents – shortage of stock) 112

PRIVATE RENTED SECTOR: AN OPPORTUNITY OR A RISK TOO FAR?
19 March 2014 Jack Stephen
Finance Director Thames Valley Housing

▸ Thames Valley Housing (TVH) is a Registered Provider.
▸ TVH owns and manages a portfolio of 14,500 properties valued at over £1.3bn across the rented, shared ownership, student and key worker sectors.
▸ Portfolio predominantly located in London, Berkshire, Surrey, Hampshire and Oxfordshire.
▸ Company has grown organically, developing its own stock using in-house development capabilities.
TVH Housing Stock Growth (No. of Dwellings) TVH Housing Tenure By Type
Overview
WHO ARE TVH?
7,646
10,415 10,521 11,057 13,037
14,077 14,663 14,639
2005 2006 2007 2008 2009 2010 2011 2012
36.0%
27.0%
16.0%
11.0%
7.0% 3.0% Social rented
SharedownershipKey worker loans
Key worker NHS
Leaseholder
Studentaccommodation

TVH INVOLVEMENT IN FIZZY LIVING
▸ TVH is a housing business with a social purpose.
▸ A longstanding element of its strategy is to invest in commercial and market based ventures to generate surpluses to invest back into its affordable housing.
▸ In 2009, it was becoming increasingly apparent to TVH that there was a need for a form of housing to bridge the gap between the owner-occupied and social housing sectors.
▸ With social housing grants declining and deposit requirements increasing, the number of tenants looking for an alternative accommodation model was rapidly increasing.
▸ TVH saw an opportunity to leverage its existing expertise and in-house capabilities through the establishment of Fizzy Living, and generate profits that could be repatriated to the group.
Background

FIZZY LIVING BACKGROUND
▸ Strategy is to capitalise on increasing demand for high quality, well managed private rented residential accommodation and create market leading platform of institutional scale.
▸ Target market is “Rentysomethings”, an increasingly large section of the population either priced out of home ownership or with no desire to own.
▸ Tenant service offering in the UK is notoriously poor, providing significant opportunity for specialist platform.
▸ Assets will be newly built, offering at least 40 units per scheme.
▸ Located in key Greater London and South East commuter locations.

THE INVESTMENT TO DATE
▸ The business of Fizzy Living is the acquisition, management and eventual disposal of a portfolio of branded, new build apartment blocks for private rental.
▸ TVH has invested its own equity into Fizzy to commit to the acquisition of four assets with a gross asset value of £64.8m. The acquisitions have been supported by debt financing from Macquarie Capital.
▸ TVH recently sold down a portion of its interest in Fizzy to a subsidiary of Abu Dhabi Investment Authority, Silver Arrow. ADIA has committed a significant amount of capital to grow the Fizzy platform and the venture is currently reviewing numerous pipeline acquisitions in and around Greater London.

▸ As at the end of February 2014, four buildings have been acquired, the two earliest acquisitions are now fully let.
▸ 3 sites in East London:
▸ Canning Town (75 flats) – completed September 2012.
▸ Poplar (45 flats) – completed February 2014.
▸ Stepney Green (63 flats) – completed February 2014.
▸ One South West of Central London:
▸ Epsom (63 flats) – completed March 2013.
Epsom Stepney Green Canning Town Poplar
FIZZY LIVING – EXISTING PORTFOLIO

Site and Building Criteria
▸ Freehold / Leasehold (> 99 years).
▸ No more than 25% by value outside M25.
▸ Maximum 40 minutes commute to City of London, West End or Canary Wharf and commuter hotspots outside the M25.
▸ Within 10 minutes’ walk from rail and/or tube stations.
▸ Minimum average space requirements of:
▸ 1 bed 500 sq ft / 2 bed 800 sq ft / 3 bed 1,000 sq ft
Stepney Green Canning Town Canning Town
FUTURE ACQUISITIONS – SITE AND BUILDING CRITERIA

▸ Income £25-60k p.a.
▸ Age 25-35
▸ Occupation Professionals across a range of industries
▸ Work location Likely to be Central London
▸ Good local amenities and social infrastructure.
▸ Buildings well designed, safe and secure.
▸ Buildings to be attractive to look at, and offer quality construction and finishes.
▸ Properties to have space for an on-site “Bob” management presence.
▸ Most two bedroom apartments to have equal-sized bedrooms and two bathrooms.
▸ Offering between 40 and 150 apartments per property.
▸ Some car parking allocation where possible.
▸ Typical tenant characteristics
▸ Typical building characteristics
KEY ASSET CRITERIA

FUTURE FUNDING
▸ Fizzy believes it offers a unique product in the market, thinking about renting in a fresh and exciting way:
▸ Fizzy was voted “Newcomer of the Year” in the RESI Awards 2013.
▸ As a well funded and energetic company, Fizzy has ambitions in the Greater London PRS market.
▸ With an exciting pipeline of schemes, Fizzy is looking to create strong relationships with lenders who will help fund the expansion of the portfolio.
▸ £200+m of equity to be invested over the next three years.
▸ £200m of external debt is being sourced.
▸ Total investment in four years to be £500m.

VALUE GENERATED BY FIZZY LIVING MODEL
▸ Source: MacCap estimates. Assumes gross yield of 6%.
▸ 1. Assumes Fizzy benefits from 15% developer’s profit above typical forward-purchase price.
Advantage Benefit Indicative impact on NOI
yield
Direct tenant sourcing Agents typically charge 5-7.5% of year 1 rent as a fee for sourcing tenants.
Economies of scale Fizzy leverages TVH scale economies.
Identifiable brand and service offering
Aids retention of tenants and reduces churn, refurbishment spend and void costs. Reduces new building lease-up period.
Development capabilities Benefit from developers’ margin and also design buildings offering maximum operational efficiency.
50-100bps
75-100bps1
▸ Target gross to net rent loss of less than 25%.

0
10,000
20,000
30,000
40,000
50,000
60,000
1991 1994 1997 2000 2003 2006 2009 2012 2015 2018
Strong demand: GOV.UK forecasts an additional 265,000 households over next 5 years in London
2,900
3,100
3,300
3,500
3,700
3,900
2011 2016 2021
'00
0s
Household Projections, London
8.1% 5yr growth
7.3% 5yr growth
The government figures also showed a widening gap between demand and supply in London
▸ Between 2011 and 2021, GOV.UK forecasts that there will be demand for an extra 52,579 units each year in London.
▸ Over the same period, only 27,240 units are forecasted to be completed per year.
▸ This housing shortage relative to household growth will continue to increase the upward pressure on house prices in the capital.
▸ The younger generations therefore find it harder and harder to purchase in London.
▸ First time buyer deposit requirement averages 170% of annual earnings.
▸ Average age of first time buyer now 38 years old1.
LONDON RESIDENTIAL RENTAL MARKET
1. Money Supermarket survey.
Source: Macquarie Capital, GOV.UK, NHCB, GLA.
Household growth
Dwellings completed
Oversupply
Undersupply
GOV.UK (f)
An
nu
al in
crea
se

0%
10%
20%
30%
40%
50%
60%
70%
1991 1994 1997 2000 2003 2006 2009 2012
▸ There is an established trend away from owner occupation and towards private renting:
▸ Home ownership increasingly unaffordable.
▸ Constrained mortgage availability and high deposit requirements expected to continue in medium term.
▸ Social and economic mobility trends causing home ownership to be less attractive for younger generations.
▸ PRS is therefore becoming increasingly popular, with the UK sector now housing 3.6m households compared to just 2m in early-1980s.
Over past 10 years in London, PRS grown 6.6% annually, while % owner occupied and social housing has declined
Owner Occupied
Social Housing
PRS
PRS – 6.6% 10yr CAGR
LONDON PRS MARKET

▸ The UK PRS sector now houses 3.6m h/holds compared to 2m in early-1980s.
▸ In London, % of owner-occupier stock has declined swiftly to 50%.
PRS EXPANDING, BUT NEW SUPPLY STILL SUBDUED
▸ Source: Macquarie Capital, ONS, Bloomberg, NAHB.
45%
50%
55%
60%
1991 1994 1997 2000 2003 2006 2009 2012
London: Owner-occupied As % Total Housing Stock
50%
59%

▸ 20 years ago, 30% of London tenants rented from PRS.
▸ Now increased to 53% and expected to rise further.
PRS EXPANDING, BUT NEW SUPPLY STILL SUBDUED
▸ Source: Macquarie Capital, ONS, Bloomberg, NAHB.
20%
30%
40%
50%
60%
70%
1991 1994 1997 2000 2003 2006 2009 2012
London Rented Housing Stock: Landlord
Public: Local Authorities, Housing Associations
Rented Privately
53%
30%

▸ High Gen Y population numbers support continued rental demand – a similar pattern to the US with multifamily the strongest investment sector.
GROWTH AND DEMOGRAPHIC DRIVERS
▸ Source: Macquarie Capital, IMF, ONS, UK Census.
250
500
750
1000
01020304050607080
'00
0s
Age (years)
UK Population By Age (2012)
Baby Boomers
Gen X Upgraders Gen Y Renter demographic

GROWTH AND DEMOGRAPHIC DRIVERS
▸ Source: Macquarie Capital, IMF, ONS, UK Census.
0%
2%
4%
6%
8%
10%
12%
0-4
5-9
10
-14
15
-19
20
-24
25
-29
30
-34
35
-39
40
-44
45
-49
50
-59
55
-59
60
-64
65
-69
70
-74
75
-79
80
+
Renter demographic
London
UK ex. London
% of Persons By 5 Year Age Group: 2011 Census
Years
▸ Recently released Census data shows the strong renter demographic profile is particularly pronounced in London.

▸ Source: Macquarie Capital, IMF, ONS, UK Census.
0%
10%
20%
30%
40%
1 person 2 person 3 person 4 person 5 person
London Households At 2011 Census, % Of Total
GROWTH AND DEMOGRAPHIC DRIVERS
▸ In line with demographic trends, 60% of London households comprise 1 or 2 persons – the smaller household size trend is expected to continue.

560
600
640
680
720
760
30%
35%
40%
45%
50%
2004 2005 2006 2007 2008 2009 2010 2011 2012
%16-64yrs with NVQ4+ education: London
£pw
Av. weekly earnings London (RHS)
PRIVATE RENTED SECTOR DEMAND DRIVERS
▸ Source: Macquarie Capital, ONS, BoE.
▸ Increase in persons higher education qualification underpins wages growth (+4.3% in 2012) and demand for modern rental housing in London.

▸ Source: Macquarie Capital, ONS, BoE.
5%
10%
15%
20%
25%
30%
1990 1993 1996 1999 2002 2005 2008 2011
UK first time buyers deposit as % of house price
28%
10%
PRIVATE RENTED SECTOR DEMAND DRIVERS
▸ Gen Y’s are finding it difficult to purchase in London where the first time buyer deposit requirement averages 170% of annual earnings.

▸ London residential has outperformed commercial real estate, equities and gilts over 10, 20 and 30 year time horizons (source: Knight Frank).
POTENTIAL FOR INSTITUTIONAL AND REIT INVESTMENT
▸ Source: Macquarie Capital, IPD, BoE, Knight Frank, RCA.
11.4%
10.0%
14.4%
7.3% 7.0%
9.9%
0.9%
8.0%
9.1%
5.7%
8.5%
10.7%
0%
5%
10%
15%
10 years 20 years 30 years
London Residential IPD Commercial Equities Gilts
Total Returns % p.a.
Commercial Real Estate

▸ UK residential property has outperformed other major asset classes.
▸ Delivered more attractive and less volatile returns over a long term.
POTENTIAL FOR INSTITUTIONAL AND REIT INVESTMENT
▸ Source: Macquarie Capital, IPD, BoE, Knight Frank, RCA.
Office
Industrial
Equities Gilts
Residential
7.0%
9.0%
11.0%
13.0%
15.0%
6.0% 8.0% 10.0% 12.0% 14.0% 16.0% 18.0%
Annualis
ed t
ota
l re
turn
Standard deviation
Annual Total Returns & Volatility (1991 to 2011)

2014 2015 2016 2017 2018 5 years to end 2018
Savills1 – London Mainstream 3.5% 3.5% 4.5% 6.0% 6.0% 25.8%
JLL2 – Greater London 2.0% 3.5% 3.5% 4.0% 3.0% 17.0%
Knight Frank3 – Prime Outer London
2.0% 3.0% 3.5% 3.8% 3.8% 17.2%
Hamptons4 – Greater London 3.5% 4.0% 4.0% 4.5% 5.0% 22.8%
▸ The high demand for PRS relative to the scarcity of supply is forecasted to result in high and stable levels of rental growth for Greater London’s private residential market.
PROJECTED RENTAL GROWTH - LONDON PRS
Source: Macquarie Capital, GOV.UK, ONS.
1. Savills Spotlight Prime Rental markets January 2014. 2. JLL Residential Eye, November 2013. 3. Knight Frank Residential Research Q4 2013. 4. Hamptons Housing Market
Forecasts Autumn 2013

— Tenancy agreements range from 6 months to 24 months, with the added peace of mind that the apartment will continue to be available for as long as they choose to stay.
— Each building has a dedicated on-site manager available to conduct viewings, and responsible for operations, security, and responsive repairs.
— Manager arranges and coordinates any specialist building/plumbing work and is a presence on site to sign for deliveries while tenants are away at work.
THE FIZZY LIVING EXPERIENCE
Superior service
Flexible lease terms
— Buildings are located within 10 minutes walk of public transport and provide on-site parking and bicycle storage.
— Focus on locations within 45 minutes work commute.
Excellent connectivity
— Upon moving in tenants can select from furniture package ranges, which they can pay for in monthly instalments to help spread out the costs of setting up home.
— All apartments come with high speed wireless broadband included in the rent.
— Tenants can communicate with building manager online at a time that suits them.
Stress free living

▸ By bringing an institutional approach to the private rental market we offer to our target market a considerably higher standard of management than they are accustomed to in this sector.
▸ The key features of the service offer to tenants is accessibility:
▸ Property managers (called “Bob”s) are accessible over the ‘phone and face-to-face 5 days a week. Bob’s days and hours of work vary to accommodate viewings and new lettings, so some days he/she may start late and finish late, and some weeks he/she may work Saturdays.
▸ Outside normal working hours, Fizzy provides an emergency response service. Non-emergency response will not necessarily be instant, but responding and providing a timescale for action within the following working day is a priority performance standard.
▸ The responsive repairs contractor will respond to emergency, out of hours repair phone calls. Again, follow-up action will be taken and communicated to the tenant within the following working day.
Epsom’s “Bob”
Poplar’s “Bob”
SERVICE OFFERING

▸ Innovative operational model
THE FIZZY LIVING ADVANTAGE
▸ Direct tenant sourcing model
▸ Media-led direct tenant acquisition strategy including web, facebook and twitter.
▸ Reduces ongoing operating costs by circumventing need for traditional letting agents.
▸ Builds direct tenant relationship.
▸ Marketing and branding strategy raises awareness and encourages loyalty.
▸ Quality and reliability of service offering encourages people to move within the buildings.
▸ Promotes word-of-mouth and online endorsement.

Fizzy targets the “Rentysomethings”! This demographic is professionals in the 25 - 35 age range, who would be first-time buyers if they were able to access mortgage finance or chose not to own their own home for simplicity and flexibility.
Strongly branded on to new tenants via website (www.fizzyliving.com) and social media (facebook and twitter).
The brand tone of voice is flexible and understanding. For example, Fizzy waives tenancy extension / renewal charges, and offers tenants the option to align annual rent review dates with their salary review dates.
BRANDING

FIZZY LIVING DEVELOPMENT CONCEPT
▸ Fizzy Living has been working with HTA Architects and EC Harris to design attractive and cost efficient schemes specifically for occupation by private renters.
▸ Although the initial portfolio comprises blocks that were built for owner occupation, these were carefully selected because they offer the characteristics that FizzyLiving considers important for a PRS building:
▸ Equal sized bedrooms, each with adequate storage.
▸ Versatile common areas, with sufficient space for entertaining friends.
▸ One bathroom per bedroom (not necessarily ensuite).
▸ Outside space, likely a balcony.
▸ Designs provide for optimal efficiency through innovative use of space, and are cost effective to reproduce given their modular nature.
▸ This cost efficiency translates to improved investment returns for Fizzy Living’s investors.

1 BEDROOM FLAT
LIVING SPACE
Living and dining space
separated just by
furniture, giving a flexible
and large open space.
KITCHEN
Easy to keep clean and
tidy with a place for
every gadget.
TERRACE
A substantial outdoor
terrace for entertaining or
relaxing with the papers.
BEDROOM
Enough space for a
home office or study,
fitted storage for all
your stuff and a big
bed. Sliding doors
separate bedroom
from living space for
privacy when your
friends stay over.

2 BEDROOM FLAT
BEDROOM
Enough space for a big
bed, a table to work at,
fitted storage, and an
exercise mat on the
floor.
LIVING SPACE
Separate dining,
cooking and
seating zones.
BATHROOM
Every bedroom has
a bathroom, for rest
and recuperation
TERRACE
A terrace, to catch
the sun and enjoy
the sound of the city
on an early summer
morning
LIVING ROOM
Sliding walls pull back to open up
the front of the flat to the city view,
and
to make a great flat for socialising.

TVH Silver Arrow
Fizzy Enterprises LLP
Fizzy One LLP
Fizzy
Canning
Town LLP
Fizzy
Epsom
LLP
Fizzy
Poplar LLP
Fizzy
Stepney
Green LLP
New
PropCos
Fizzy Services
Management LLP
Management Agreement
Se
cu
rity
Po
ol
FIZZY GROUP STRUCTURE

GOVERNANCE FOR FIZZY WITHIN THE TVHA GROUP
Fizzy Investment Committee (FIC)
Fizzy Enterprises LLP
Operational Management
TVHA Fizzy Holdings Limited
TVHA Board
Appoints Directors
Appoints its representative on Fizzy Enterprises LLP and provides representative with scheme of delegation for certain decisions. Other decisions will need to be referred back to FIC or to TVHA board.
Scheme of Delegation for day-today decisions.
Delegates authority to approve decisions in accordance with Fizzy Enterprises LLP’s Business Plan.
Delegates authority to approve decisions in accordance with TVHA Holdings Business Plan.
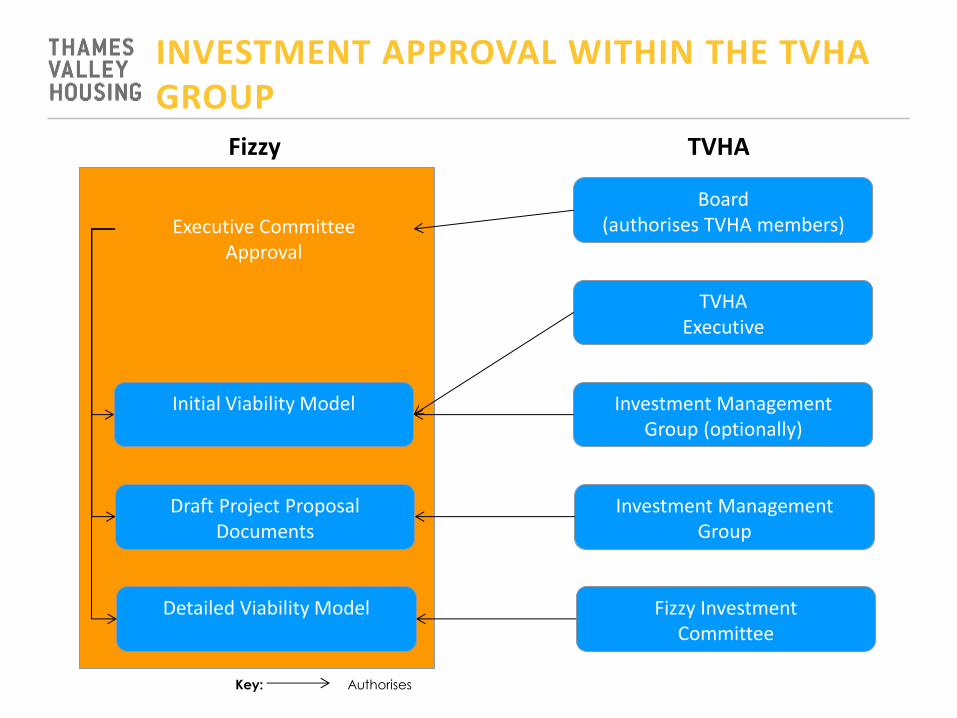
INVESTMENT APPROVAL WITHIN THE TVHA GROUP
Board (authorises TVHA members)
TVHA Executive
Investment Management Group (optionally)
Investment Management Group
Fizzy Investment Committee
TVHA
Executive Committee
Approval
Initial Viability Model
Draft Project Proposal Documents
Detailed Viability Model
Fizzy
Key: Authorises
Supporting Older
People Conference
SP6: Private Rented Sector –
an opportunity or a risk too far?
Speakers: Dominic Martin
PRS Taskforce, Communities and Local Government
Jack Stephen
Finance Director and Deputy Chief Executive, Thames Valley Housing Association Chair: Robert Kerse
Executive Director of Finance, Circle Housing


![WELCOME [leedsplayhouse.org.uk] · supporting creativity in schools PLAYHOUSE OLDER PEOPLE dynamic and pioneering projects with older adults and people living with dementia PLAYHOUSE](https://img.pdfslide.us/doc/110x75/5f031e5b7e708231d407a0e1/welcome-supporting-creativity-in-schools-playhouse-older-people-dynamic-and.jpg)