Embed Size (px)
Citation preview
SUPPORTING MOBILITY-IMPAIRED POPULATIONS IN
EMERGENCY EVACUATION
Lei Feng
Operations Analysis, FedEx Corporation
1000 Ridgeway Loop Rd, Suite 500, Memphis, TN, 38120
Tel: (901) 355-0098
Email: [email protected]
Neža Vodopivec
Applied Mathematics & Statistics and Scientific Computation
University of Maryland
Mathematics Building, College Park, MD 20742
Tel: (301) 405-7768
Email: [email protected]
Elise Miller-Hooks
Department of Civil & Environmental Engineering
University of Maryland
1173 Glenn L. Martin Hall, College Park, MD 20742
Tel: (301) 405-2046
Email: [email protected]
Word Count: 5540 + (6 Figures + 2 tables)*250 = 7,540 words
Revised Paper
October 16, 2014
Submitted for presentation at the 2015 Transportation Research Board 94th Annual Meeting and for
publication in the Transportation Research Record

Feng, Vodopivec and Miller-Hooks
ABSTRACT 1
One of the populations’ most vulnerable in emergencies is persons with impaired mobility. During an 2
evacuation, the mobility-impaired need special arrangements while being transported to shelters and special 3
accommodations during their shelter stays. With limited resources, not all shelters can be specially equipped 4
for low-mobility evacuees. In this paper, we address the problem of simultaneously choosing a particular 5
subset of shelters to equip, matching persons with impaired mobility to these shelters, and routing 6
paratransit vehicles to bring passengers to shelters accordingly. We formulate the problem as a mixed-7
integer program and propose a heuristic appropriate for solving real-world, large-scale instances. These 8
solution strategies can form the basis of a practical tool to be used for evacuation planning. We construct 9
an evacuation scenario based on real-world evacuation zones, shelter locations, and population statistics for 10
New York City, and we use this scenario to evaluate our heuristic. 11
Keywords: mobility-impaired population evacuation, location-routing problem, tabu search. 12

Feng, Vodopivec, Miller-Hooks 1
INTRODUCTION AND MOTIVATION 13
Urban populations are especially vulnerable when a disaster strikes. Whether such a disaster is caused by a 14
natural event, industrial accident, or terrorist attack, how well a city prepares and responds can be critical 15
in determining the outcome. Large-scale evacuation, though often the most viable response, requires 16
effective communication with the public, well-coordinated management of efforts, and carefully planned 17
traffic-control strategies. Urban evacuations are complicated by the fact that, in many large metropolitan 18
areas such as New York City (NYC) and Chicago, over 30% of households are without cars (1). A 19
mismanaged evacuation of the carless population during Hurricane Katrina has subsequently led emergency 20
planners and researchers to devote attention to bus-based evacuations (2-4). 21
In 2006, the United Nations (5) adopted a convention urging member states to undertake “all 22
necessary measures to ensure the protection and safety of persons with disabilities in situations of risk, 23
including situations of armed conflict, humanitarian emergencies and the occurrence of natural disasters.” 24
Nevertheless, NYC’s evacuation during Tropical Storm Irene in 2011, while successfully incorporating 25
buses, failed so completely at meeting the needs of disabled residents that the city was sued by disability-26
rights organizations. The city’s further failure to evacuate the disabled during Hurricane Sandy in 2012 led 27
the presiding judge to grant an expansion of the case to a class-action lawsuit (6). 28
While all persons with disabilities are disproportionately affected in disasters, it is the mobility-29
impaired who are particularly likely to be left behind or neglected during evacuation. For many persons 30
with low mobility, it is difficult or impossible to access the general public transit stops. Those who manage 31
are often forced to part with their wheelchairs, walkers, or other medical equipment at bus loading areas. 32
Upon their arrival at shelters, the mobility-impaired are frequently unable to obtain needed assistance and 33
medical care (7). 34
In 2010, 2.8% of United States households had at least one mobility-impaired member (1) and, as 35
the population ages, this percentage is expected to increase. Any successful emergency-response plan must 36
account for the fact that mobility-impaired populations need special accommodations both while being 37
transported to shelters and during their stay there. 38
The best, and perhaps only, way that emergency responders will be able to reach these populations 39
is by dispatching lift-equipped vehicles to provide them with door-to-door transportation. The most efficient 40
approach would be to use local paratransit providers who possess vehicles capable of transporting large 41
medical equipment and are familiar with the needs of the low-mobility population. Many local governments 42
already maintain contracts with such providers to support the daily activities of this population in 43

Feng, Vodopivec, Miller-Hooks 2
compliance with the Americans with Disabilities Act (ADA). The ADA mandates that all residents have 44
access to public transit (8). 45
All shelters housing mobility-impaired populations should staff medical personnel, maintain 46
necessary equipment, and incorporate wheelchair-accessible amenities. It is impractical to provide such 47
accommodations at the full range of shelters serving the general population. A more effective approach 48
would concentrate the necessary resources at a few shelters and assign mobility-impaired evacuees to only 49
these designated shelters. 50
This paper proposes optimization-based techniques to assist in planning large-scale evacuations of 51
a mobility-impaired population. Specifically, the problem of effectively: (1) selecting the subset of special 52
shelters to house the mobility-impaired population, (2) assigning each mobility-impaired evacuee to a 53
special shelter not too far from his or her home, and (3) designing a set of paratransit routes that will 54
transport evacuees to their assigned shelters is formulated as a mixed integer program. We refer to this 55
tripartite problem as the Mobility-Impaired Population Evacuation Problem (MIPEP). 56
Our model describes how emergency planners can most effectively allocate a city’s resources in an 57
evacuation of the mobility-impaired. More specifically, its solution identifies the most cost-effective way 58
to transport and house such populations while maintaining a high level of care. The model explicitly 59
accounts for evacuee welfare by removing solutions that are bad for them from consideration entirely. The 60
constraints achieving this removal account for several major medical and psychological considerations. In 61
particular, for medical reasons, there is an absolute maximum on passenger ride time. Each vehicle is 62
modeled as having some finite capacity, and each passenger with large medical equipment as taking up 63
more of this capacity. No equipment is left behind. Each shelter is modeled as having some finite capacity. 64
Consequently, no overcrowding or shortage of medical support occurs. Furthermore, for psychological 65
reasons, an evacuee must not be assigned to a shelter more than some constant times as far from his or her 66
home as the closest shelter, special or not. An evacuee’s route to his or her assigned shelter must not take 67
more than a constant times as long as the direct route. Finally, a vehicle must unload fully whenever it 68
arrives at a shelter. 69
The MIPEP is combinatorially difficult because all three of its components—location, allocation, 70
and routing—are interdependent. Our model and solution treat them as such. A more simple-minded 71
solution might proceed by: (1) making an educated guess at the right number of shelters S to open to the 72
mobility-impaired (by balancing an estimated marginal cost of an additional shelter against an estimated 73
marginal savings in transportation); (2) locating the S shelters as centrally as possible; (3) allocating each 74
evacuee to his or her nearest shelter; and then (4) solving the resulting fixed routing problem. Figure 1 75

Feng, Vodopivec, Miller-Hooks 3
shows an example of how such stage-wise solutions can perform badly. Specifically, the figure illustrates 76
that the choice of a best set of routes can vary significantly over different client assignment decisions. In 77
Figure 1(a), clients a - f are assigned to shelter s1 and g - i are assigned to shelter s2. In the route depicted 78
in Figure 1(b), client c is reassigned to shelter s2. The corresponding best routes can vary significantly. That 79
is, this seemingly minor modification in client assignment can lead to very different routing solutions with 80
significantly different performance. The MIPEP avoids these pitfalls by making location, allocation and 81
routing decisions simultaneously. 82
83
FIGURE 1. Illustration of One Vehicle Route with Different Assignments 84
Direct solution of the mathematical program on large-scale, real-world problem instances is 85
formidable, and thus, we develop a heuristic based on concepts of tabu search to solve the proposed 86
mathematical program. The solution methodology is applied on a case study of a hypothetical evacuation 87
of NYC’s mobility-impaired population using real data obtained on location from various government 88
databases. These aspects of the paper are described following a review of the related literature. 89
RELATED LITERATURE 90
Several works have addressed the use of public transit in evacuation. Margulis et al. (9) developed a 91
deterministic decision-support model for bus dispatching to maximize the number to egress in hurricane 92
evacuation. This model assumes that evacuees are assembled at their closest pickup points and the locations 93
of shelters are known. With a similar assumption of predetermined pickup and shelter locations, Sayyady 94
and Eksioglu (10) proposed a mixed integer linear program to optimize transit routing plans with the 95
objective of minimizing total evacuation time for no-notice evacuation. In their work, transit vehicles are 96
only allowed to perform one trip. Abdelgawad and Abdulhai (11) and Bish (4) formulated this transit-based 97
evacuation problem as types of vehicle routing problems. The objectives of both models are to transport 98
evacuees from preset pickup locations to known shelter locations in the minimal amount of time by 99
a
bc
d
e
f
g
hi
S1
S2
Holding Lot
Shelter
Client
a
bc
d
e
f
g
hi
S1
S2
(a)(b)
Trip Distance
Deadhead
Transit Distance

Feng, Vodopivec, Miller-Hooks 4
efficiently routing and scheduling a fleet of buses from a set of bus yards. Both works propose heuristic 100
solution concepts. 101
More recently, Kulshretha et al. (12) proposed a mixed integer linear program to determine the 102
optimal pickup locations for evacuees to assemble. Their model simultaneously considers the allocation of 103
available buses to transport the assembled evacuees between the pickup locations and specified shelters. 104
While these works are related in that they assign pickup locations to shelters, they do not capture many of 105
the elements of the MIPEP, such as the need for simultaneous routing, assignment and shelter location 106
decisions. They also focus on aspects of an evacuation that are not relevant in this context, such as selection 107
of pickup locations at which evacuees will assemble. 108
We are aware of only two prior studies in the literature that have proposed tools to aid in decisions 109
regarding the location of shelters for transit-based evacuation. Song et al. (13) formulated this transit-based 110
shelter location and evacuation problem in the context of hurricanes as a location-routing problem (LRP) 111
with uncertain demand. The LRP is used to determine optimal shelter locations and transit routes with the 112
objective of minimizing total evacuation time. Shelter locations are chosen from a pool of potential 113
locations based on their distances from the pickup locations assuming all pickup locations are assigned to 114
their nearest open shelter. Only the transportation cost is considered in the objective and each bus is 115
restricted to a single route per shelter. The authors compared three heuristics based on concepts of genetic 116
algorithms, artificial neural networks, and hill climbing. 117
Goerigk et al. (14) considered a location-routing bus evacuation problem in which both a subset of 118
shelters and a subset of pickup locations are chosen optimally from a set of candidates. They proposed a 119
branch-and-bound technique that takes an integrated rather than sequential approach to the location-120
allocation and routing components of the problem. The objective is to choose shelters and create bus 121
schedules that minimize the time required to transport all evacuees. In the model, a fixed number of buses 122
is available and the number of shelters used in limited. Buses must transport evacuees directly from a pickup 123
location to a shelter without visiting intermediate pickup locations. A case study is performed on a very 124
small instance of such a problem in which the population of a 500-meter radius must be evacuated from a 125
choice of 14 possible pickup locations. The computational complexity of generating an exact solution limits 126
real-world application of the algorithm proposed. The MIPEP generalizes the problem of Goerigk et al. by 127
assuming a more complex routing component in which multiple evacuees are picked up at their individual 128
locations on a single route to a shelter. The MIPEP is solved with a heuristic that can be applied to real-129
world, large-scale instances as we demonstrate with a case study for the evacuation of a mobility-impaired 130
population in New York City. 131

Feng, Vodopivec, Miller-Hooks 5
The general LRP has received significant attention over past decades. Applications primarily relate 132
to logistics. See (15) for a review of both models and solution methods for LRPs. Traditional LRP models 133
determine where to locate facilities and how to distribute or collect goods to or from customers through 134
simultaneously solving a joint location and routing problem. The MIPEP differs from the LRP in several 135
important ways. The MIPEP involves two types of facilities: the holding lots for paratransit vehicles 136
(depots) and shelters. The LRP has only depots from which vehicles start out and to which they return once 137
the goods are distributed or collected. The MIPEP has several additional constraints, such as that evacuees 138
should not spend an unreasonable amount of time onboard while additional pickups are made. The operating 139
patterns of these two classes of problems also differ. Specifically, in the LRP, each vehicle is restricted to 140
serve only one depot, while in the MIPEP each vehicle is allowed to perform multiple tours for multiple 141
shelters. 142
The MIPEP also has commonality with other ridesharing problems, including the Dial-A-Ride 143
Problem (DARP) (see (16) for a review of DARP). Like the MIPEP, the DARP is characterized by pairing 144
and precedence constraints, such that for each request the origin must precede the destination and both 145
locations must be visited by the same vehicle, and user inconvenience constraints, including a maximum 146
ride time limit. A primary concern in DARP, however, is the time windows that limit pickup and delivery 147
for customers. The routing aspects of MIPEP are similar, with some exceptions: (1) pickups assigned to the 148
same shelter share an identical destination; (2) customers do not choose their time windows and instead are 149
expected to be ready for the vehicle when it arrives; and (3) customers with different shelter destinations 150
must be transported on different vehicles. Additionally, shelter destinations are chosen for the evacuees in 151
the MIPEP in coordination with routing decisions; whereas, customer destinations in DARP are set by the 152
customers. Finally, the MIPEP is a multi-depot type of ridesharing problem, since resources from multiple 153
companies’ fleets will be drawn upon. 154
Thus, it appears that no previous work has proposed optimization tools that can directly support 155
sheltering and routing decisions for the mobility-impaired population in an evacuation. This paper seeks to 156
fill this gap. 157
MATHEMATICAL FORMULATION 158
The MIPEP is formulated next. Before proceeding to the formulation, notation is introduced. 159
Notation 160
w Number of paratransit holding lots
{1,..., }H w Set of paratransit holding lots
Feng, Vodopivec, Miller-Hooks 6
hV Number of vehicles at holding lot h H
{1,..., }h
h H
K V
Set of all vehicles in all holding lots
n Number of pickup nodes
1,...,P w w n Set of pickup nodes
( , )a bi iq q Number of persons, a, and wheelchairs, b, at pickup node i P
i Service time at pickup node i P
dim Distance of pickup node i P to its nearest shelter
tm Maximum onboard time for all passengers
Deviation parameter for the assigned distance to dim
m The number of potential shelters
{ 1,..., }S w n w n m Set of potential shelters
N Set of all nodes {H }P S
sF Fixed opening cost of shelter s S
sQ Capacity of shelter s S
C Capacity of vehicle
D Maximum driving distance for each vehicle
ijd Distance from node i to j, ,i j N
ijt Travel time from node i to j, ,i j N
dC Unit cost of driving distance for all vehicles
M Arbitrary large number
Decision Variables 161
1, if shelter is open
0, otherwise s
s Sy
1, if pickup is assigned to shelter and is transported by vehicle
0, otherwise
kis
i P s S k Kz
1, if arc ( , ) is traversed by vehicle
0, otherwise
kij
i j k Kx

Feng, Vodopivec, Miller-Hooks 7
kiL Load of vehicle k K after visiting node i N
Auxiliary decision variables associated with routing: 162
1, if vehicle comes from holding lot
0, otherwise kh
k K h Hu
kijT Trip duration of vehicle k K starting from node i N and ending at node j N
Formulation 163
Given the above notation, the MIPEP can be defined on a digraph ),,( ANG where N is the set of nodes 164
representing holding lots, pickup locations and shelters, and A is the set of directed arcs 165
{( , ) : , }A i j i j N connecting these locations. 166
min kMIPEP s s d ij ij
s S k K i N j N
C F y C d x
(1)
Subject to 1 ,kis
k K s S
z i P
(2)
( 2 ) ,a b ki i is s s
k K i P
q q z Q y s S
(3)
,k dis is i
k K s S
d z m i P
(4)
1 ,kij
k K i N
x j P
(5)
,,0 KkNixxNj
kij
Nj
kji
(6)
1 ,kh
h H
u k K
(7)
, ,khj kh
j P
x u k K h H
(8)
,kh h
k K
u V h H
(9)
(1 ) (1 ) , , , ,k k k kij is js ijM x z z M x i P j P k K s S (10)
1 (1 ) , , ,k kis isz M x i P s S k K (11)
0 , ,kiL i H S k K (12)

Feng, Vodopivec, Miller-Hooks 8
(1 ) 2 (1 ) , , ,k k a b kij j j j ijM x L q q M x j P i N k K (13)
, ,k kj ij
i N
L C x j P k K
(14)
,kij ij
i P S j P S
d x D k K
(15)
,,,0 KkNjSHiT kij (16)
(1 ) (1 ) , , ,k k k k kij ij ij ij j jq ij
q N
M x T t x T M x i P j P k K
(17)
, , ,k kij ijT M x i N j N k K (18)
, , ,k tijT m i P j N k K (19)
\
1 , 2 | |,kij
k K i P j N P
x P P P
(20)
, , , {0,1}, , , , , , .k k k ks ps ij kh i ijy z x u L T R h H p P i N j N s S (21)
Total costs include the fixed cost of operating shelters that can support this population and 167
operational costs of transporting these individuals to their assigned shelters. Objective function (1) 168
minimizes the sum of fixed and operational costs. It is reasonable to assume that the second term 169
(transportation cost) will be roughly proportional to the total distance driven by all paratransit vehicles. 170
Similarly, we assume that the first term (cost of providing special services at shelters) will be proportional 171
to the number of shelters at which special services are provided. 172
Constraints (2) ensure that each pickup node is assigned to exactly one shelter. By Constraints (3) 173
pickup nodes are assigned only to those shelters that are open, and capacity limits of open shelters are met. 174
Constraints (4) force that, for each pickup node, the assigned shelter is within times the distance to its 175
nearest shelter. Each customer is served exactly once through Constraints (5). Flow conservation is 176
expressed in Constraints (6). Constraints (7) and (8) ensure that each vehicle is used at most once, while 177
Constraints (9) force the number of vehicles that come from each holding lot do not exceed the number of 178
available vehicles in it. Constraints (10) and (11) ensure that clients travel toward their assigned shelters 179
without stopping at other intermediate shelters. Constraints (12) ensure vehicles are empty when leaving a 180
holding lot and after each stop at a shelter. Constraints (13) express that vehicle load when leaving a pickup 181
node increases by the number of passengers and wheelchairs that are loaded. It is assumed that one person 182
occupies one seat and one wheelchair two seats. Constraints (14) guarantee that vehicle load restrictions 183
are met. Constraints (15) define that the distance that each vehicle travels from its first pickup to its last 184

Feng, Vodopivec, Miller-Hooks 9
dropoff location is restricted to a maximum limit. Constraints (16) reset the incurred trip duration of each 185
vehicle to zero every time the vehicle leaves a holding lot or shelter. Constraints (17) and (18) express that 186
the trip duration of each vehicle increases when it traverses the nodes. Constraints (19) ensure that trip 187
duration is lower than the passenger maximum onboard time. Subtours are eliminated in Constraints (20). 188
Finally, integrality of the decision variables is stated in Constraints (21). 189
The formulation involves O(|K|∙|N|2) binary decision variables, O(|K|∙|N|2) integer decision 190
variables, and O(2|N|-2|P|) constraints. Only very small-scale instances can be solved exactly. The most recent 191
exact solution method is proposed by Akca et al. (17). The authors formulated a traditional location routing 192
and scheduling problem, which is comparable in complexity to the MIPEP, as a set-partitioning problem 193
and proposed a column generation framework with two-phase pricing in the subproblem. To deal with large 194
instances, they also proposed two heuristic pricing algorithms to solve the subproblem. The largest 195
instances that were tackled involved 5 facilities and 40 customers requiring 8 CPU hours of computing 196
time. Thus, the practical MIPEP instance is solved heuristically, as described next. 197
SOLVING THE MIPEP 198
Heuristics proposed for traditional LRPs with a size seen in real-world operations provide inspiration for 199
the proposed solution strategies. Three solution strategies for LRPs were described in (18): sequential, 200
interactive, and nested. Sequential methods are often ‘locate first and route second’ type heuristics, where 201
the location problem is solved first and the routing problem second. Without consideration for the 202
interrelations between the two problems, they usually obtain low-quality solutions (19). Interactive methods 203
treat the location and routing problems equally and iterate between the two problems until a stopping 204
criterion is met. For example, Tuzun and Burke (20) and Wu et al., (21) proposed tabu search and simulated 205
annealing solution methods, respectively, to solve traditional LRPs. Although these methods can provide 206
better solutions than the sequential methods, these interactive methods cannot explore the neighborhood 207
space extensively due to the equal treatment of the two problems. Nagy and Slahi (18) proposed a 208
hierarchical structure for the LRP, where the location problem is solved in the main problem and the routing 209
problem as a ‘subproblem’ to it. Based on this hierarchical structure, Gündüz (22) proposed a tabu search 210
algorithm to solve a combined location problem and multi-depot vehicle routing problem with time 211
windows. Results show that the nested methods outperformed the other two solution methods. 212
We present such a nested tabu search solution strategy for the MIPEP. Our strategy applies a 213
hierarchical structure similar to that proposed in (18). It decomposes the MIPEP into subproblems: (1) a 214
Capacitated Shelter Location-Allocation Problem (CSLAP) and (2) a Multi-depot Dial-A-Ride Problem 215
(MDARP). Thus, interactions between the CSLAP and the MDARP subproblems are explicitly considered. 216
Feng, Vodopivec, Miller-Hooks 10
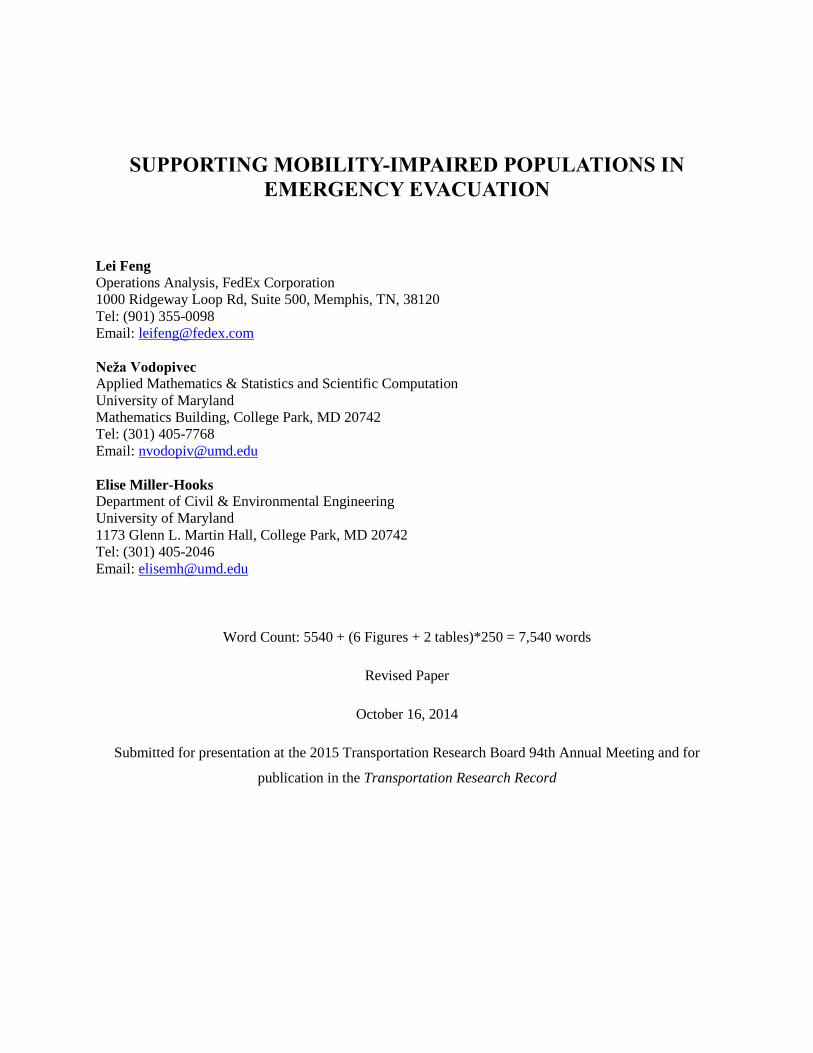
Capacitated Shelter Location-Allocation Problem (CSLAP) 217
Letting , ,kis is
k K
z z i P s S
, CSLAP can be formulated as follows. 218
min CSLAP s s d is is
s S i P s S
C F y C d z
(22)
subject to 1 ,is
s S
z i P
(23)
( 2 ) a bi i is s s
i P
q q z Q y s S
(24)
,dis is i
s S
d z m i P
(25)
, {0,1} , ,s isy z i p s S k K (26)
Objective function (22) minimizes the sum of fixed and assignment costs. The assignment cost is 219
calculated through the direct distance between the pickup location and the associated evacuees’ assigned 220
shelter. This direct distance is an approximation to the actual transportation distance. Constraints (23 - 25) 221
play the same roles as constraints (1-3) in the MIPEP formulation. Binary integrality is required through 222
Constraints (26). 223
The CSLAP can be solved exactly through a commercial solver. Two decision sets are identified 224
from its solution: 0 ,y which indicates whether or not each shelter s S is open, and 0 ,z which indicates 225
if a passenger i P has been assigned to shelter s S . 226
Multi-Depot Dial-A-Ride Problem (MDARP) 227
With 0z identified in CSLAP, the MDARP is formulated as follows. 228
min kMDARP d ij ij
k K i N j N
C C d x
(27)
subject to Constraints (5)-(20)
, {0,1}, , , Z , , , , , .k k kij kh i ijx u L T h H p P i N j N s S (28)
The MDARP is a difficult combinatorial problem. Its simpler single-depot problem even is known 229
to be NP-hard. Solutions of problem instances of a size seen in the real world are unobtainable with typical 230
computing power. Thus, a cheapest insertion heuristic adapted from (23) is proposed for its solution. This 231

Feng, Vodopivec, Miller-Hooks 11
algorithm first builds optimal routes for all pickup-shelter location pairs and then assigns the built routes to 232
vehicles in holding lots. The objective of this assignment is to minimize total route costs subject to 233
limitations on the number of available vehicles in each holding lot. The main steps of the cheapest insertion 234
heuristic are summarized next. 235
Cheapest Insertion Heuristic for the MDARP
Step a: Copy each pickup-shelter pair obtained from the CSLAP into the unrouted request list, URL.
Step b: Create an empty route. Set r =1.
Step c: Select the first unrouted pair (p, s) from URL. Find all feasible insertions within all existing routes,
1 to r.
(i) If a feasible insertion is found, insert (p, s) to the route r* with minimum insertion cost,
and update route r*.
(ii) If no feasible insertion exists, create a new empty route and insert (p, s) in it. Set r = r+1.
Step d: Repeat step c until URL is empty.
Step e: Add each depot to the starting and ending point of each route; calculate the updated route cost
matrix.
Step f: Assign routes to holding lots according to the updated route cost matrix.
236
Potential Feasible Insertions 237
Due to Constraints (10) and (11) that prevent vehicles from stopping at intermediate shelters while en route 238
to another destination shelter, the potential feasible insertions of pickup-shelter pair (p, s) on route r in step 239
c take one of the following forms: 240
(1) Insert (p, s) at the beginning of route r. 241
(2) Insert (p, s) immediately after each shelter, if any shelter already exists on route r. 242
(3) Insert p immediately before s and each of the pickup nodes before s until reaching another shelter 243
or the beginning of the route, if shelter s already exists on route r. 244
Feasibility Checking 245
An insertion of a pickup-shelter pair must ensure that vehicle capacity constraints (14), maximum driving 246
distance limit for drivers (15) and passenger maximum onboard time (19) are satisfied and do not create 247
violations of these constraints for other nodes already included in the route. 248
249
Nested Tabu Search Strategy 250
Figure 2 provides the overall framework of this strategy. 251

Feng, Vodopivec, Miller-Hooks 12
252
FIGURE 2. Flowchart of Nested Tabu Search Algorithm 253
The procedure begins with generation of an initial solution through a sequential solution strategy, 254
and setting the best solution to the obtained initial solution. Candidate solutions around the current best 255
solution are generated in a diversification step. A tabu list is maintained to prevent the search from getting 256
stuck at a local solution. An identification and intensification procedure is employed to filter out infeasible 257
candidate solutions that are generated in this procedure and calculate total costs. The best generated feasible 258
solution is assessed to see if it meets the aspiration criterion. Details of the aspiration, tabu list management, 259
and termination criteria are summarized next. This is followed by detailed descriptions of diversification 260
No
Step 2- Diversification: generate candidate solutions,
Ycand, within the exploration region of ybest.
Step 4- sort Ynew according to
corresponding cost in non-decreasing
order, select the first point ynewbest.
Step 5- aspiration
satisfied?
Step 6- update best known
solution, ybest, and total cost, Cbest
Yes
Step 7- tabu?No
Step 11- expand tabu
list
Step 12-
termination criteria
sastified?
Step 13- output optimal
solution ybest with Cbest
Yes
Step 8- is Ycand
fully scanned?
Yes
Step 9- select next element in Ycand
No
Step 10- set best known solution
to first element in tabu list
No
End
Step 1-Initialization: solve the MIPEP through solving
CSLAP first and MDARP second to generate an initial
solution y0 and calculate total cost CMIPEP(y0). Set the best
solution ybest = y0 and the best cost Cbest =CMIPEP(y0).
Step 3- Identification and Intensification: for each
generated candidate solution, Ycand, if it is feasible
and not tabu, calcuate the updated cost CMIPEP(Ycand).
Yes

Feng, Vodopivec, Miller-Hooks 13
and intensification steps. 261
Aspiration criterion Any feasible candidate solution that has the best total cost of all discovered solutions 262
will become the best solution regardless of its tabu status. 263
Tabu list Two tabu lists are applied within the overall procedure. Both employ a complete memory 264
approach. One maintains a list of solutions, considered in the last certain number of iterations (the tabu 265
tenure) of the search procedure. This list prevents revisiting of solutions within the iterations associated 266
with the tabu tenure. A solution may be removed from the list prematurely if no neighboring candidate 267
solution of the best solution outperforms this best solution. The second tabu list includes infeasible 268
candidate solutions generated in the diversification step. These solutions are maintained as tabu 269
permanently during the entire search procedure. This list is used to filter out infeasible candidate solutions 270
in steps 2 and 3. 271
Termination criteria The procedure terminates when either a predefined maximum number of iterations or 272
a predefined maximum number of iterations without improvement is reached. 273
Step 2-Diversification 274
In this step, a diversification strategy is applied to generate a set of candidate solutions Ycand, a set of 275
solutions vectors, within the neighborhood space of the best solution, ybest. The candidate solutions are 276
generated through adapted exploration moves ‘drop’, ‘add’ and ‘switch’, originally introduced in (24). 277
Before introducing the adapted exploration moves, a neighborhood relation between two shelters is defined 278
based on the definition proposed in (18): 279
Given constraints (4) or (25), which enforce that each client cannot be sent to shelters that are 280
beyond times the distance to the nearest shelter, a concept of neighboring shelters is defined. 281
Neighboring Shelters (depicted in Figure 3): Two shelters 1s and 2s are neighbors if and only if at least 282
one pickup node p exists such that 1s and 2s are the first and second nearest shelters to p, respectively, 283
and if 2 1d d , then 1 2( )s Nb s and 2 1( )s Nb s , where ( )Nb s denotes a set of neighboring shelters 284
of shelter s. 285
286
s1
s2
p
d2d1
2 1d d

Feng, Vodopivec, Miller-Hooks 14
FIGURE 3. Illustration of Neighboring Shelters 287
288
289
FIGURE 4. Flowchart of Identification and Intensification Processes 290
291
Based on the definition of neighboring shelters, Ycand can be generated through the following 292
actions. 293
294
select the 1st element, y, in Ycand
is y tabu or in the
infeasible list ?
solve the CSLAP(y)
is Ycand fully scanned ?
Step 4- sort Ynew according to
corresponding cost set CMIPEP(Ynew)
Yes
select next element
No
Yes
No
is y feasible ?
solve the MDARP with trip pairs from CSLAP(y), calculate
the cost, CMIPEP(y), add y to the new solution set, Ynew, and
CMIPEP(y) to the corresponding cost set CMIPEP(Ynew)
Yes
Step 2- generate candidate solution set,
Ycand
put y into the
infeasible listNo

Feng, Vodopivec, Miller-Hooks 15
For each open shelter ,s S and each closed shelter ( )s Nb s : 295
Drop - setting best ( ) 0s y 296
Add - setting best ( ) 1s y 297
Switch - setting best ( ) 0s y and best ( ) 1s y 298
In each case, if the resulting solution is not tabu, add it into Ycand. 299
Step 3-Identification and Intensification 300
Candidate shelter location decisions, Ycand, generated in the diversification step are not guaranteed to adhere 301
to Constraints (4). CSLAP is therefore re-solved to determine a feasible assignment given each candidate 302
solutions in Ycand. 303
Figure 4 gives details of the identification and intensification processes. In these processes, all 304
feasible generated candidate solutions y in Ycand are identified, the MDARP is solved with the assignment 305
results from CSLAP(y), and the total cost CMIPEP(y) is calculated. 306
Numerical Experiments 307
Experimental design 308
Concepts developed herein are illustrated on a real-world based case study. The case study involves a 309
hypothetical hurricane evacuation in NYC, one of the many hurricane vulnerable areas along the coastline 310
of the U.S. The evacuation scenario is shown in Figure 5 and involves evacuating mobility-impaired 311
individuals from 588 pickup locations (round nodes) within the hurricane evacuation zone (shaded area) to 312
238 potential shelters (triangles) using paratransit vehicles affiliated with 39 paratransit depots (squares). 313
The data on potential shelters, including location and capacity, as well as the hurricane evacuation zones, 314
were obtained from a technical report from the U.S. Army Corps of Engineers (25). 315
The information on paratransit vehicles comes from the NYC data website (26), which includes 316
information from 161 companies, including the depot locations and number of affiliated vehicles. Only 39 317
companies with more than 15 paratransit vehicles are considered. Each vehicle is assumed to have a 318
capacity of seven spaces with each person occupying one space and each wheelchair two spaces. To 319
preserve privacy issues, data on real pickup locations were not available. The 588 pickup locations were 320
thus chosen as the centroids of census tracts in U.S. Census 2010. In reality, the needed pickup information 321

Feng, Vodopivec, Miller-Hooks 16
for the mobility-impaired can be obtained information gathered through registration for paratransit services 322
during ordinary circumstances. Random numbers were generated to determine with equal odds whether 323
each location contained one or two evacuees awaiting assitance from each pickup location. Similarly, each 324
passenger was assigned a wheelchair with probability 0.5. The fixed opening cost of each shelter is assumed 325
to be proportional to the shelter’s capacity. For simplicity, the proportionality constant is assumed to be 326
$10/unit of capacity unit. 327
328
FIGURE 5. NYC Hurricane Evacuation 329
Parameters used in the proposed model and solution algorithm are presented in Table 1. The tabu 330
tenure was tuned from 10 to 80 iterations in increments of 5. A setting of 15 iterations was found to have 331
the best performance in terms of convergence and best solution found. Other parameters of the model and 332
algorithm were set as follows: unit cost of travel distance of vehicle Cd = 15.20 $/mile; identical vehicle 333
capacity C = 7 spaces; identical service time σi = 3 minutes; maximum driving distance (excluding deadhead 334
distance) D = 320 miles; maximum passenger onboard time mt = 2 hours; tabu tenure = 15; maximum 335
iterations = 500; and maximum non-improvement iterations = 30. 336
The proposed solution strategies were implemented in Visual C++ 2010 and run on a personal 337
computer with Intel(R) CPU 3.10GHz and 4.0GB RAM. The C++ Concert Technology of CPLEX in the 338
IBM-ILOG CPLEX 12.51 was applied to solve the CSLAP and CSAP problems. 339

Feng, Vodopivec, Miller-Hooks 17
RESULTS ANALYSIS 340
TABLE 1. Final Shelter Locations 341
Final Shelter Locations
# Shelter Index Shelter Design Capacity
(1 unit per person and 2 units per wheelchair) Fixed Opening Cost ($)
1 629 220 2,200
2 630 65 650
3 632 195 1,950
4 639 340 3,400
5 640 50 500
6 651 61 610
7 659 63 630
8 673 146 1,460
9 677 82 820
10 698 50 500
11 700 58 580
12 704 74 740
13 727 71 710
14 742 96 960
15 752 94 940
16 765 94 940
17 766 87 870
18 767 78 780
19 769 59 590
20 772 52 520
21 774 50 500
22 775 77 770
23 778 98 980
24 832 62 620
25 839 40 400
26 842 90 900
27 848 481 4,810
28 852 83 830
29 856 52 520
Opening Cost ($) 30,680
The convergence process of the proposed nested tabu search strategy with 5 was also studied. 342
The procedure terminates after 70 iterations; no improvement in solution value was obtained after 30 343
iterations. The resulting solution has a total cost of $56,880 compared with an initial total cost of $59,740 344
obtained in the initial step. 345

Feng, Vodopivec, Miller-Hooks 18
29 of 238 shelters are identified for providing service to the mobility impaired at a total fixed 346
opening cost of $30,680. These are listed in Table 1. 347
Fixed and operational costs are further explored in Table 2. Table 2 shows the final cost results for 348
different ƞ values. As expected, total cost decreases with increasing value of ƞ, because a larger ƞ relaxes 349
the constraints. Further, with increasing ƞ, the ratio of fixed to total cost decreases, while the ratio of 350
operational to total cost increases. This is reasonable. Consider that a lower value of ƞ means more shelters 351
should be opened, which infers that shorter distances will need to be traveled. On the other hand, a higher 352
value of ƞ means fewer shelters will be open or farther but cheaper shelters can be opened. This likely infers 353
that longer travel distances will be incurred, and thus higher operational (transportation) costs will exist. 354
TABLE 2. Cost Results with Different ƞ Values 355
Final Results Statistics
Fixed Cost ($) Transportation
Cost ($)
Total Cost
($) Iteration #
CPU Time
(hours:minutes:seconds)
ƞ=2 58,260 23,900 82,160 38 0:58:20
ƞ=3 45,820 23,600 69,420 52 1:06:35
ƞ=5 30,680 26,200 56,880 70 1:26:46
ƞ=7 20,190 27,700 47,890 87 1:57:22
ƞ=10 19,280 27,040 46,320 108 2:33:49
Figure 6 shows the final route set generated with ƞ=5. This solution contains a total of 15 routes 356
that are to be performed by 15 vehicles originating from 11 holding lots (identified in the figure). It may be 357
possible to reduce the number of vehicles serving this population as is noted by the existence of several 358
rather short vehicle routes. This would be achieved, for example, if higher costs for introducing additional 359
vehicles to perform the routes are assumed. Work balance constraints might also be enforced. 360
The number of pickup points visited, number of demand units (people and wheelchairs) transported, 361
number of different shelters providing service to the mobility impaired, and number of trips performed by 362
each vehicle are also indicated in the figure. A trip herein is defined as a circuit that starts from a holding 363
lot or shelter, collects passengers from pickup points en route, and ends at a shelter (or returns to the holding 364
lot). The number of trips performed, therefore, is equivalent to the number of shelters to serve the mobility 365
impaired. 366

Feng, Vodopivec, Miller-Hooks 19
367 Figure 6 Final Route Set with ƞ=5 368
TABLE 4. Characteristics of Routes in Final Set of 15 Routes 369
Max.
Onboard
Distance
(miles)
Ave. Onboard
Distance
(miles)
Max. Trip
Distance
(miles)
Ave. Trip
Distance
(miles)
Ave. Trip
Load
9.68 1.95 21.64 3.98 5.63
7.08 1.75 19.25 4.07 5.84
6.84 1.93 22.78 4.74 5.26
8.17 1.82 17.40 4.43 5.60
8.32 1.51 19.84 3.77 5.26
8.95 1.87 14.94 4.17 5.50
6.86 1.67 12.69 3.88 5.91
7.61 2.06 14.40 4.70 5.79
2.79 1.48 5.83 3.15 4.75
8.08 1.48 17.03 3.71 5.93
7.21 2.62 16.02 7.17 5.42
3.71 1.68 7.70 3.61 5.71
8.38 3.15 16.86 5.95 5.33
8.35 3.40 16.90 7.80 5.50
7.70 3.27 15.74 7.38 5.86
Details of maximum and average onboard distance, maximum and average trip distance, as well as 370
average trip load (passengers and wheelchairs) for each route are listed in Table 4. These results show that 371
the longest distance a passenger traveled is 9.68 miles and the longest trip distance is 22.78 miles. The last 372

Feng, Vodopivec, Miller-Hooks 20
column indicates that almost all routes have average passenger loads of more than 5.5, inferring high vehicle 373
utilization rates. 374
Conclusions and Extensions 375
This paper addresses an important humanitarian problem and provides a practical, efficient optimization-376
based approach that can be used in large-scale emergency-response planning. A primary outcome of the 377
developed model and solution methodology is the selection of shelters that can, once identified, be 378
adequately prepared to support an evacuation. These developments have additional tactical and operational 379
utilities. Pre-disaster, forecasts specific to a given impending hazard may be available, affecting the 380
potential utility of shelter locations. Thus, in this tactical phase, a subset of the equipped shelters may be 381
open, and the CSLAP model can be applied to re-allocate and route the evacuees using these services for 382
this smaller set of destinations. Similarly, in a no-notice evacuation, this routing and allocation component 383
of the decision problem can be re-solved once knowledge of the viability of the shelter locations and/or 384
roadways are determined. If the original locations are to be operated, the allocation of evacuees to the 385
shelters may be maintained and only the routing decisions may be reassessed in response to information 386
about roadway closures or other conditions affecting the predetermined routes. This latter problem can be 387
addressed by solving an MDARP. 388
This study addresses emergency evacuation with notice as is the case in situations involving 389
hurricanes; however, for no-notice emergency evacuations, an alternative objective function in which the 390
number of pickups that can be completed in a fixed amount of time is maximized or the time required to 391
complete the pickups is minimized given a fixed fleet might be appropriate. Additionally, emergency 392
situations are inherently uncertain. For example, travel times, shelter capacities, demand for assistance and 393
even available resources may be affected by the disaster and a priori knowledge of quantities may be 394
precluded. Thus, it could be beneficial to account for such uncertainties within the proposed model. Also, 395
as some disasters evolve over time, it may become necessary to evacuate the shelters, sending the evacuees 396
even further from the affected area. That is, a two-stage evacuation might be required. One could explore 397
the possibility of applying the proposed model and solution methodologies to each stage. 398
Acknowledgments. The authors are thankful to Sergeant Ira Promisel of New York for sharing his expertise on NYC 399
evacuation concerns. This work was partially funded by the National Science Foundation, United States Department 400
of Transportation through the Mid-Atlantic University Transportation Center, the Maryland Industrial Partnerships 401
(MIPS) and ITCurves. This support is gratefully acknowledged, but implies no endorsement of the findings. 402

Feng, Vodopivec, Miller-Hooks 21
REFERENCES 403
1. Census of Population and Housing 2010. U.S. Census Bureau, 2010. 404
2. Catastrophic Hurricane Evacuation Plan Evaluation: A Report to Congress. June 1, 2006, U. S. 405
Department of Transportation and U.S. Department of Homeland Security. . 406
3. Gutmann, A., et al., On Risk and Disaster: Lessons from Hurricane Katrina. 2011: University of 407
Pennsylvania Press. 408
4. Bish, D.R., Planning for a Bus-Based Evacuation. Or Spectrum, 2011. 33(3): p. 629-654. 409
5. Disability, Natural Disasters and Emergency Situations. United Nations, Article 11, 2006. Available 410
from: http://www.un.org/disabilities/default.asp?id=1546. 411
6. Santora, M. and B. Weiser. Court Says New York Neglected Disabled in Emergencies. New York 412
Times, November 7, 2013. Available from: http://nyti.ms/1hn3KXD. 413
7. Houston, N., et al., Routes to Effective Evacuation Planning Primer Series: Evacuating Populations 414
with Special Needs. 2009, Federal Highway Administration, HOTO-1, U. S. Department of 415
Transportation. . 416
8. Americans with Disabilities Act of 1990, as Amended (in 2008), Title 42. Available from: 417
http://www.ada.gov/pubs/adastatute08.htm. 418
9. Margulis, L., et al. Hurricane Evacuation Decision-Support Model for Bus Dispatch. in Fourth 419
International Latin American and Caribbean Conference on Engineering and Technology, Puerto Rico. 420
2006. 421
10. Sayyady, F. and S.D. Eksioglu, Optimizing the Use of Public Transit System During No-Notice 422
Evacuation of Urban Areas. Computers & Industrial Engineering, 2010. 59(4): p. 488-495. 423
11. Abdelgawad, H. and B. Abdulhai, Managing Large-Scale Multimodal Emergency Evacuations. Journal 424
of Transportation Safety & Security, 2010. 2(2): p. 122-151. 425
12. Kulshrestha, A., Y. Lou, and Y. Yin (2012) Pick-up Locations and Bus Allocation for Transit-Based 426
Evacuation Planning with Demand Uncertainty. Journal of Advanced Transportation, DOI: 427
10.1002/atr.1221. 428
13. Song, R., S.W. He, and L. Zhang, Optimum Transit Operations During the Emergency Evacuations. 429
Jiaotong Yunshu Xitong Gongcheng Yu Xinxi/ Journal of Transportation Systems Engineering and 430
Information Technology, 2009. 9(6): p. 154-160. 431
14. Goerigk, M., B. Grün, and P. Heßler. A Branch-Cut-and-Price Approach to the Bus Evacuation 432
Problem with Integrated Collection Point and Shelter Decisions. 2013. Available from: 433
https://kluedo.ub.uni-kl.de/frontdoor/index/index/docId/3527. 434
15. Nagy, G. and S. Salhi, Location-Routing: Issues, Models and Methods. European Journal of 435
Operational Research, 2007. 177(2): p. 649-672. 436
16. Cordeau, J.F. and G. Laporte, The Dial-a-Ride Problem: Models and Algorithms. Annals of Operations 437
Research, 2007. 153(1): p. 29-46. 438
17. Akca, Z., R. Berger, and T. Ralphs. Modeling and Solving Location Routing and Scheduling Problems. 439
in Proceedings of the eleventh INFORMS computing society meeting. 2008. 440
18. Nagy, G. and S. Salhi, Nested Heuristic Methods for the Location-Routeing Problem. Journal of the 441
Operational Research Society, 1996: p. 1166-1174. 442
19. Laporte, G., Y. Nobert, and S. Taillefer, Solving a Family of Multi-Depot Vehicle Routing and 443

Feng, Vodopivec, Miller-Hooks 22
Location-Routing Problems. Transportation Science, 1988. 22(3): p. 161-172. 444
20. Tuzun, D. and L.I. Burke, A Two-Phase Tabu Search Approach to the Location Routing Problem. 445
European Journal of Operational Research, 1999. 116(1): p. 87-99. 446
21. Wu, T.-H., C. Low, and J.-W. Bai, Heuristic Solutions to Multi-Depot Location-Routing Problems. 447
Computers & Operations Research, 2002. 29(10): p. 1393-1415. 448
22. Gündüz, H.I., The Single-Stage Location-Routing Problem with Time Windows, in Computational 449
Logistics. 2011, Springer. p. 44-58. 450
23. Jaw, J.J., et al., A Heuristic Algorithm for the Multivehicle Advance Request Dial-a-Ride Problem with 451
Time Windows. Transportation Research Part B-Methodological, 1986. 20(3): p. 243-257. 452
24. Kuehn, A.A. and M.J. Hamburger, A Heuristic Program for Locating Warehouses. Management 453
Science, 1963. 9(4): p. 643-666. 454
25. New York State Hurricane Evacuation Restudy Technical Data Report. 2009, Federal Emergency 455
Management Agency (FEMA) and the U.S. Army Corps of Engineers (USACE). NYC. 456
26. Nyc Data Sets. Weir, J., 2013. Available from: https://github.com/jweir/nyc-gov-457
data/blob/master/data/nyc_data_sets.markdown. 458
459
460