Embed Size (px)
Citation preview

1
Supporting Information
Europium Single Atom Based Heterojunction Photocatalyst with Enhanced
Visible-light Catalytic Activity
Yini li, Yang Qu, and Guofeng Wang*
Key Laboratory of Functional Inorganic Material Chemistry, Ministry of Education, School of
Chemistry and Materials Science, Heilongjiang University, Harbin 150080, China
1. Materials and characterizations
Chemicals: All reagents and solvents, including analytical-grade Na3VO4·12H2O, InCl3·4H2O,
Cd(CH3COO)2·2H2O, S powder, EuCl3·6H2O, aqueous nitric acid, dodecylamine, methanol, ethanol,
carbon disulfide (CS2), were used as received without further purification.
Characterization: X-ray diffraction (XRD) patterns were recorded on a Bruker D8 Advance
diffractometer equipped with Cu Kα radiation (λ= 1.5406Å, 40 kV, 40 mA). The scanning electron
microscope (SEM, Hitachi, S-4800) and transmission electron microscope (TEM, JEOL, JEM-2100)
were used to characterize the morphology and size of the samples. The Fourier transform infrared
(FT-IR) spectra were recorded with KBr pellets in the range of 4000-400 cm-1 on a Perkin-Elmer
Spectrum One spectrometer. UV-vis diffuse reflectance spectroscopy (UV-vis DRS) was performed
using a spectrophotometer (SHIMADZU UV-2550). Tristar II 3020 was used to analyze N2
adsorption and desorption isotherms. The photoluminescence (PL) spectra were measured at room
temperature using a Hitachi F-4600 fluorescence spectrophotometer equipped with a 150W Xe lamp.
Electronic Supplementary Material (ESI) for Journal of Materials Chemistry A.This journal is © The Royal Society of Chemistry 2021

2
The elemental composition of the catalyst was measured by using X-ray photoelectron spectroscopy
(Kratos-AXIS ULTRA DLD device with Al (single) X-ray source). Use a thermal analyzer (TGA-7,
Perkin-Elmer, USA) to perform thermogravimetric analysis (TGA) in air at 20 ℃ to 800 ℃.
Photoelectrochemical measurement: A computer-controlled CHI-660 electrochemical workstation
(Chenhua Instrument, Shanghai, China), with a 300W Xe arc lamp as the light source, was used to
characterize the photoelectrochemical performance (PEC). A three-electrode configuration with the
sample membrane as the working electrode, saturated Ag/AgCl as the reference electrode, platinum
foil as the counter-level, and 0.5M Na2SO4 aqueous solution as the electrolyte was used for
photocurrent measurement. Disperse 0.1 g of the photocatalyst into 1 mL of isopropanol, add 0.05 g
of Macrogol-2000 with constant stirring, mix with ultrasonic for 10 minutes, and then vigorously stir
the suspension for 30 minutes. Afterwards, add 0.05 mL of acetylacetone, and keep the obtained
solution for a week under full stirring to obtain the desired paste. 1 cm×1 cm conductive fluorine-
doped tin oxide (FTO) coated glass is used as the substrate. The prepared paste is coated on the
substrate by the doctor blade method. Finally, the electrode was dried at room temperature and
annealed at 150 °C for 2 hours in a N2 atmosphere. Before the experiment, the high-purity nitrogen
gas needs to be introduced into the electrolyte for 30 minutes and then tested.
Hydroxyl radical (OH) measurement: The coumarin fluorescence strategy was used to analyze the
amount of OH produced during the photocatalytic reaction. 50 mg of photocatalyst was dissolved in
40 mL of coumarin aqueous solution (0.001M), stirred with constant magnetic force for 10 min to
make it fully mixed, and illuminated with a 300 W Xe lamp for 1 h. Centrifuge the solution, take the
supernatant through the filter membrane and put it into the Pyrex glass cell. The obtained solution
(Perkin-Elmer LS55) was analyzed by fluorescence measurement of 7-hydroxycoumarin using a
spectrofluorometer at an excitation wavelength of 370 nm.
Photocatalytic measurement: Under visible light irradiation, the photocatalytic performance of
typical samples was evaluated. A certain amount of powder sample was dispersed into a cylindrical

3
steel reactor with a volume of 100 ml and an area of 3.5 cm2, and 4 mL of water was added. The
high-purity CO2 gas enters the reaction device through water to reach the ambient pressure and
further remove the original air and impurities in the reaction device, and achieve the adsorption and
desorption balance before irradiation. A 300W Xe lamp (PLSSXE300/300UV, Perfect light, Beijing)
with a 420 nm cut-off filter was used as the light source for the photocatalytic reaction, and the
sample was continuously irradiated with a light intensity of 455 mW cm-1 for 6 hours. Quantitative
chromatograph (GC2002) was used to analyze and detect the produced gas. In order to ensure the
accuracy of the data, all reported photocatalytic reactions have been tested more than five times. We
conduct a stability test by recycling the photocatalyst sample 5 times, and the time of each
photocatalytic reaction was 6 hours. In addition, after each photocatalytic reaction, the sample was
washed with water and dried at 60 ℃, and then the next photocatalytic test experiment was carried
out. We have added more details to the supporting information of the revised manuscript.
The calculation of quantum efficiency (QE) is based on the method reported in the literature
(ACS Nano, 2014, 8, 7229-7238). Under the visible light irradiation, the wavelength of visible light
is from 420 to 720 nm, and the light intensity is 420 mW/cm2. The irradiating area is 3.5 cm2.
Therefore, the absorption rate of incident photons (R) was determined to be 2.26×10¹⁸ quanta・sec-1
using the following equation: R = ∫(S×I)/(hc/λ) (S is the irradiating area, I is the light intensity at
each wavelength, and (hc/) is photon energy at each wavelength). Here, according to the light
intensity and wavelength diagram of xenon lamp, we assume that the light intensity of each
wavelength is the same. The integral wavelength range is from 420 nm to 600 nm because the
catalyst material does not respond to light after 600 nm. It is well known that two and eight photons
are required to produce one CO2 and CH4 molecules, respectively. Thus the QE for CO and CH4
generations were calculated using the following equation: QE = (2×CO generation rate + 8×CH4
generation rate)/(absorption rate of incident photon). For 1g 10-CdS/IVO:Eu3+ catalyst, the CO and
CH4 generation rate are 11.02 and 8.24 μmol/h, respectively. Thus, QE = (3.69 ×10¹⁵

4
+1.09866×10¹⁶)/ 2.26×1018 = 0.65%. Thus, the QE in the visible range are 0.65%, 0.13%, and 0.21%
for 10-CdS/IVO:Eu3+, CdS, and IVO:Eu3+, respectively.
Computational Details: All the geometric optimizations, band structure, partial density of states
(PDOS), work function and charge density difference were simulated with the plane-wave ultrasoft
(PWUS) pseudopotential method as implemented in the Cambridge Sequential Total Energy Package
(CASTEP) code. The absorption spectra were obtained with the Perdew-Burke-Ernzerhof (PBE)
functional in CASTEP. The generalized gradient approximation (GGA) with the PBE exchange-
correlation functional was used in the calculations. The cutoff energy for the plane-wave expansion
was set to 400 eV. For geometry optimization, the convergence criterion of total energy was 2.010-5
eV/atom. The spin-polarized magnetic calculation was used to do geometry optimization, electronic
structure, and optical property calculation.
2. Supplementary figures and tables.
Table S1. Comparison of the contents of different references concerning rare-earth single atom
materials.
Properties and
applicationSingle atom materials References
Electrocatalysis Y1/NC and Sc1/NC ACS Nano, 2020, 14, 1093
g-C3N4:Er Angew. Chem. Int. Ed, 2020, 59, 10651
g-C3N4:La ACS Nano, 2020, 14, 15841
CdS:Dy/g-C3N4 Adv. Funct. Mater, 2021, 31, 2104976
Zn2GeO4:Er/g-C3N4 Small, 2021, 17, 2101089
SrTiO4:Er/g-C3N4 J. Mater. Chem. A, 2021, 9, 15820
Photocatalytic CO2
reduction
CdS/InVO4:Eu This work
5
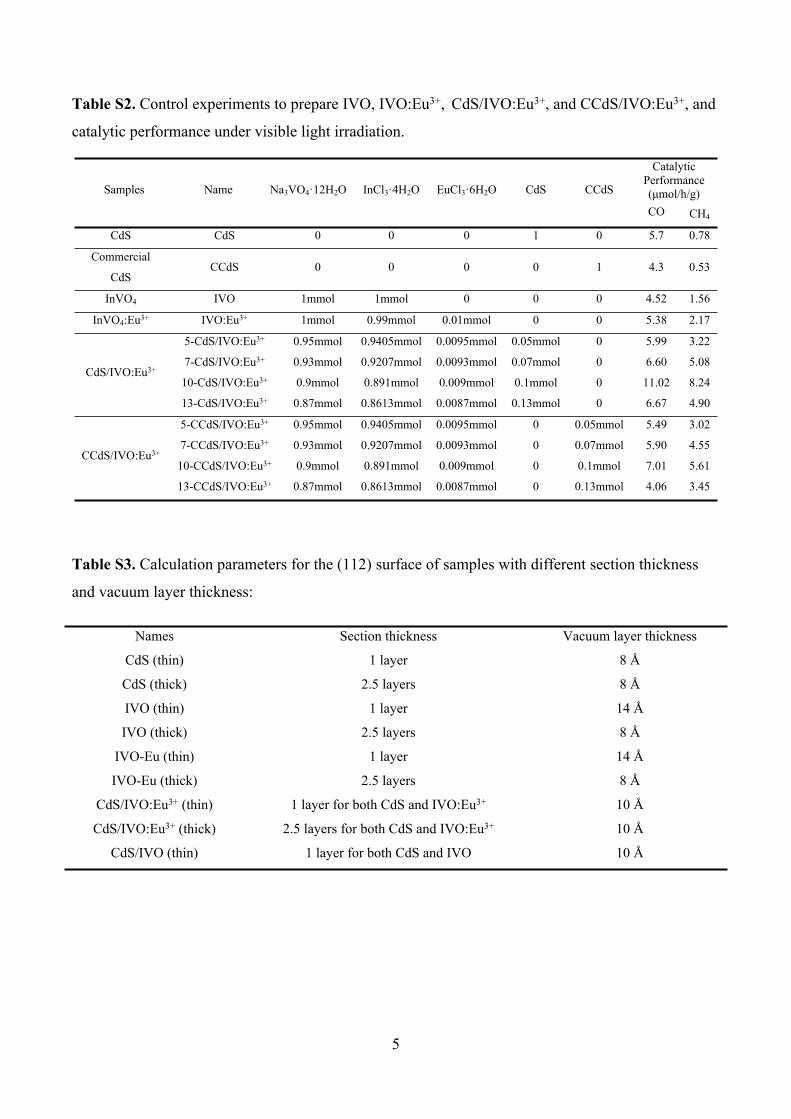
Table S2. Control experiments to prepare IVO, IVO:Eu3+, CdS/IVO:Eu3+, and CCdS/IVO:Eu3+, and
catalytic performance under visible light irradiation.
Catalytic Performance (μmol/h/g)Samples Name Na3VO4·12H2O InCl3·4H2O EuCl3·6H2O CdS CCdS
CO CH4
CdS CdS 0 0 0 1 0 5.7 0.78
Commercial
CdSCCdS 0 0 0 0 1 4.3 0.53
InVO4 IVO 1mmol 1mmol 0 0 0 4.52 1.56
InVO4:Eu3+ IVO:Eu3+ 1mmol 0.99mmol 0.01mmol 0 0 5.38 2.17
5-CdS/IVO:Eu3+ 0.95mmol 0.9405mmol 0.0095mmol 0.05mmol 0 5.99 3.22
7-CdS/IVO:Eu3+ 0.93mmol 0.9207mmol 0.0093mmol 0.07mmol 0 6.60 5.08
10-CdS/IVO:Eu3+ 0.9mmol 0.891mmol 0.009mmol 0.1mmol 0 11.02 8.24CdS/IVO:Eu3+
13-CdS/IVO:Eu3+ 0.87mmol 0.8613mmol 0.0087mmol 0.13mmol 0 6.67 4.90
5-CCdS/IVO:Eu3+ 0.95mmol 0.9405mmol 0.0095mmol 0 0.05mmol 5.49 3.02
7-CCdS/IVO:Eu3+ 0.93mmol 0.9207mmol 0.0093mmol 0 0.07mmol 5.90 4.55
10-CCdS/IVO:Eu3+ 0.9mmol 0.891mmol 0.009mmol 0 0.1mmol 7.01 5.61CCdS/IVO:Eu3+
13-CCdS/IVO:Eu3+ 0.87mmol 0.8613mmol 0.0087mmol 0 0.13mmol 4.06 3.45
Table S3. Calculation parameters for the (112) surface of samples with different section thickness
and vacuum layer thickness:
Names Section thickness Vacuum layer thickness
CdS (thin) 1 layer 8 Å
CdS (thick) 2.5 layers 8 Å
IVO (thin) 1 layer 14 Å
IVO (thick) 2.5 layers 8 Å
IVO-Eu (thin) 1 layer 14 Å
IVO-Eu (thick) 2.5 layers 8 Å
CdS/IVO:Eu3+ (thin) 1 layer for both CdS and IVO:Eu3+ 10 Å
CdS/IVO:Eu3+ (thick) 2.5 layers for both CdS and IVO:Eu3+ 10 Å
CdS/IVO (thin) 1 layer for both CdS and IVO 10 Å
6
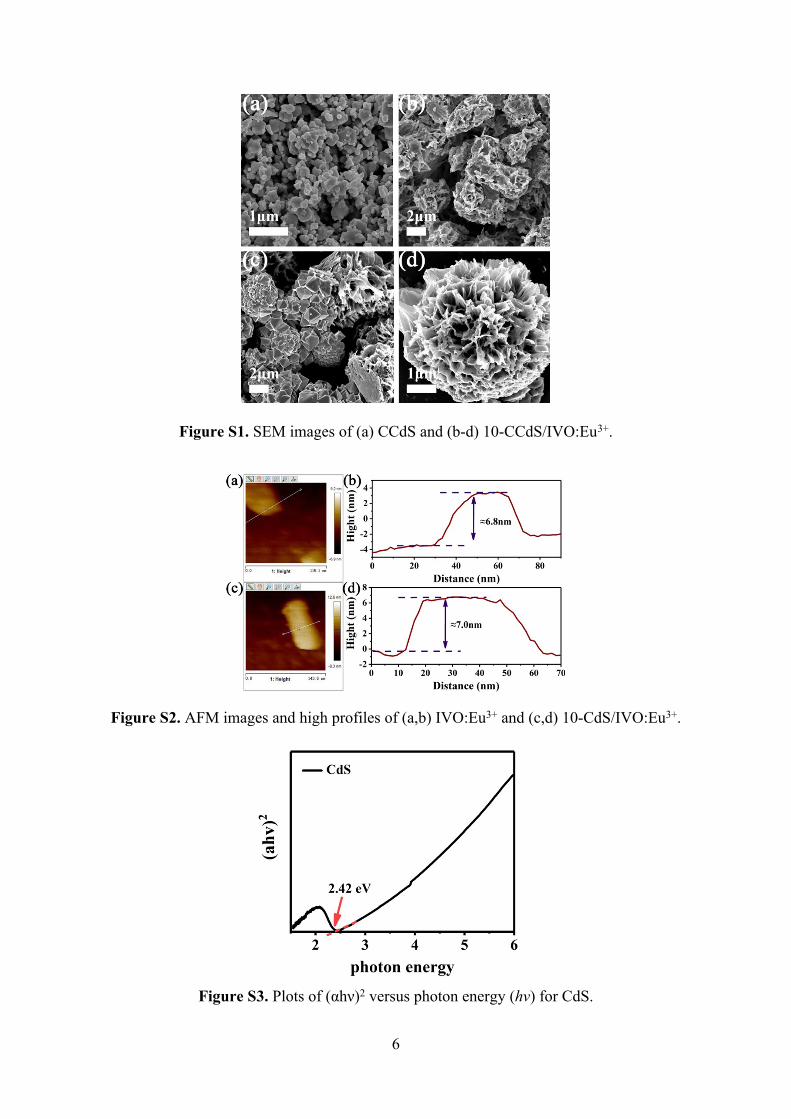
Figure S1. SEM images of (a) CCdS and (b-d) 10-CCdS/IVO:Eu3+.
Figure S2. AFM images and high profiles of (a,b) IVO:Eu3+ and (c,d) 10-CdS/IVO:Eu3+.
Figure S3. Plots of (αhν)2 versus photon energy (hν) for CdS.

7
Figure S4. TGA spectrum of 10-CdS/IVO:Eu3+.
Figure S5. XPS survey spectra of IVO:Eu3+, 10-CdS/IVO:Eu3+, and CdS.
Figure S6. CO2-TPD of IVO and 10-CdS/IVO:Eu3+.

8
Figure S7. The amount of photocatalytic production for IVO, 10-CdS/IVO:Eu3+, and CdS.
Figure S8. Evaluation of the stability of 10-CdS/IVO:Eu3+ under visible light irradiation.
Figure S9. SEM images and XRD patterns of 10-CdS/IVO:Eu3+ (a) before photocatalysis test and (b) after photocatalysis test.

9
Figure S10. Deformation charge density: (a,b) InVO4 and (c,d) InVO4:Eu3+.
Figure S11. (a) The geometric structure of the (112) surface of InVO4:Eu3+ (thick). (b) The geometric structure and calculated adsorption energies (Eads) of CO2 on the (112) surface of
InVO4:Eu3+ (thick).

10
Figure S12. Theoretical simulation of optical properties for bulk CdS, IVO, and IVO:Eu3+: (a) absorption coefficient, (b,c) optical conductivity, (d) loss function, (e,f) dielectric function, (g)
reflectivity, and (h,i) refractive index.
Figure S13. Theoretical simulation of optical properties: (a) absorption coefficient, (b,c) optical conductivity, (d) loss function, (e,f) dielectric function, (g) reflectivity, and (h,i) refractive index.