Embed Size (px)
Citation preview

1
Supporting Information 1
Population Samples and Data 2
We report 168 new samples from 20 populations of Oceania and Southeast Asia 3
(Table S1) genotyped on the Affymetrix Human Origins SNP Array, in which SNPs 4
are cleanly ascertained (1). We merged the new data with those previously released 5
samples (2) genotyped on the same array, resulting in 2890 samples from 236 world 6
wide modern human populations, and one chinpanzee sample. The full dataset was 7
filtered to 2493 individuals from 221 populations (Table S2) after removing outlier 8
individuals or relatives, based on visual inspection of PCA plots and/or model-based 9
clustering analysis as described previously (2). We then merged high coverage 10
sequences of archaic hominins into the dataset: Altai Neanderthal (52×) (3) and 11
Denisova (31×) (4). Problematic SNPs were filtered out following the approach 12
described previously (2), and analyses were carried out on a set of 594,903 autosomal 13
SNPs. 14
Principal Component Analysis 15
Principal component analysis was performed with EIGENSOFT (5) version 5.0.1. We 16
performed PCA on a subset of individuals from which the top two eigenvectors could 17
determine a plane and then projected others onto the plane. To explore the 18
relationship between modern humans and archaic hominins, we carried out PCA on 19
the chimpanzee, Neanderthal and Denisovan only and projected present-day human 20
samples onto the map defined by the top two eigenvectors of archaic hominins and 21

2
chimpanzee. 1
Statistical Analysis to Detect Archaic Ancestry in Modern Humans 2
We applied 𝑓! statistics (1, 6) with the form 3
𝑓! 𝐴,𝐵;𝐶,𝐷 = (!!!!!)×(!!!!!)!!!!!!"#$%&"'×(!!!!"#$%&"')!
!!!, where 𝑝 is the allele frequency for 4
populations A, B, C, D or outgroup, to assess the correlation between the allele 5
frequency differences of the two pairs of populations. If populations A and B are 6
consistent with forming a clade in an unrooted tree with respect to populations C and 7
D, the statistic is expected to be 0. We computed 𝑓! statistics with the form 8
𝑓!(𝐴𝑓𝑟𝑖𝑐𝑎𝑛,𝐴𝑟𝑐ℎ𝑎𝑖𝑐;𝑊𝑒𝑠𝑡𝐸𝑢𝑟𝑎𝑠𝑖𝑎𝑛,𝐸𝐸/𝑁𝐴) to detect gene flow between archaic 9
hominins and non-Africans. Additional gene flow from archaic hominins to EE/NA 10
will yield significant positive values, while additional gene flow from archaic humans 11
to West Eurasian will yield significant negative values. A Weighted Block Jackknife 12
procedure (7, 8), which drops 5 centimorgan (cM) blocks of the genome in each run, 13
was used to compute standard errors. 14
Estimating Denisovan Ancestry in Oceanians 15
Oceanians have been previously shown to contain both Denisovan and Neanderthal 16
ancestry (9, 10). We computed the proportion of Denisovan ancestry in Oceanians 17
𝑝!(𝑋) by the following 𝑓! 𝑟𝑎𝑡𝑖𝑜: 18
𝑝𝐷(𝑋) =𝑓4(𝑌𝑜𝑟𝑢𝑏𝑎,𝑁𝑒𝑎𝑛𝑑𝑒𝑟𝑡ℎ𝑎𝑙;𝐻𝑎𝑛,𝑋)
𝑓4(𝑌𝑜𝑟𝑢𝑏𝑎,𝑁𝑒𝑎𝑛𝑑𝑒𝑟𝑡ℎ𝑎𝑙;𝐻𝑎𝑛,𝐷𝑒𝑛𝑖𝑠𝑜𝑣𝑎𝑛)
which assumes that Han and Oceanians have similar amounts of Neanderthal 19

3
ancestry. 1
To evaluate if Neanderthal ancestry in Oceanians is indeed similar to that in Han, 2
we investigated the following 𝑓! statistics (1, 6) for each population of Oceania: 3
𝑓! 𝑌𝑜𝑟𝑢𝑏𝑎,𝑁𝑒𝑎𝑛𝑑𝑒𝑟𝑡ℎ𝑎𝑙;𝐻𝑎𝑛,𝑋 =𝑊×𝑞 + (𝑊 +𝑀)×𝑟 4
𝑓! 𝑌𝑜𝑟𝑢𝑏𝑎,𝐷𝑒𝑛𝑖𝑠𝑜𝑣𝑎𝑛;𝐻𝑎𝑛,𝑋 = 𝑊 + 𝐿 ×𝑞 +𝑊×𝑟 5
in which 𝑊 , 𝑀 and 𝐿 are the quantitative measures of branch length in the 6
phylogenetic model (Fig. S8), and 𝑞 and 𝑟 are the proportion of Denisovan ancestry 7
and Neanderthal ancestry, respectively. If there is no Neanderthal ancestry (𝑟 = 0), 8
then the values of these two 𝑓! statistics should be correlated and correspond to a 9
linear model crossing the origin point (0,0) with 10
𝑆𝑙𝑜𝑝𝑒 =𝑓! 𝑌𝑜𝑟𝑢𝑏𝑎,𝑁𝑒𝑎𝑛𝑑𝑒𝑟𝑡ℎ𝑎𝑙;𝐻𝑎𝑛,𝑋! − 𝑓! 𝑌𝑜𝑟𝑢𝑏𝑎,𝑁𝑒𝑎𝑛𝑑𝑒𝑟𝑡ℎ𝑎𝑙;𝐻𝑎𝑛,𝑋!𝑓! 𝑌𝑜𝑟𝑢𝑏𝑎,𝐷𝑒𝑛𝑖𝑠𝑜𝑣𝑎𝑛;𝐻𝑎𝑛,𝑋! − 𝑓! 𝑌𝑜𝑟𝑢𝑏𝑎,𝐷𝑒𝑛𝑖𝑠𝑜𝑣𝑎𝑛;𝐻𝑎𝑛,𝑋!
= !×!!!!×!!!!! ×!!!(!!!)×!!
= !!!!
11
Otherwise, Neanderthal ancestry (r>0) will yield a linear model with the same slope 12
𝑆𝑙𝑜𝑝𝑒 =𝑓! 𝑌𝑜𝑟𝑢𝑏𝑎,𝑁𝑒𝑎𝑛𝑑𝑒𝑟𝑡ℎ𝑎𝑙;𝐻𝑎𝑛,𝑋! − 𝑓! 𝑌𝑜𝑟𝑢𝑏𝑎,𝑁𝑒𝑎𝑛𝑑𝑒𝑟𝑡ℎ𝑎𝑙;𝐻𝑎𝑛,𝑋!𝑓! 𝑌𝑜𝑟𝑢𝑏𝑎,𝐷𝑒𝑛𝑖𝑠𝑜𝑣𝑎𝑛;𝐻𝑎𝑛,𝑋! − 𝑓! 𝑌𝑜𝑟𝑢𝑏𝑎,𝐷𝑒𝑛𝑖𝑠𝑜𝑣𝑎𝑛;𝐻𝑎𝑛,𝑋!
= !×(!!!!!)!(!!!!!)×(!!!)!!! ×(!!!!!)!(!!!!!)×!
≈ !!!!
13
and the same intercept (0,0) if 𝑟! ≈ 𝑟!. If ri ≠ rj, then the intercept will be shifted. 14
With Han as the comparison to different Oceanian populations, the intercept does not 15

4
differ from (0,0), whereas replacing Han with French results in an intercept that is 1
significantly different from (0,0) (Fig. S5). Thus, this analysis indicates that the 2
amount of Neanderthal ancestry is roughly the same in Han and Oceanians, but not in 3
French and Oceanians. 4
Detecting Denisovan introgression in East Eurasian and Native 5
American populations 6
To detect Denisovan introgression in EE/NA populations, we investigated the ratio of 7
two 𝑓! statistics 8
𝑅!(𝑋) =𝑓!(𝑌𝑜𝑟𝑢𝑏𝑎,𝐷𝑒𝑛𝑖𝑠𝑜𝑣𝑎𝑛;𝐹𝑟𝑒𝑛𝑐ℎ,𝑋)𝑓!(𝑌𝑜𝑟𝑢𝑏𝑎,𝑁𝑒𝑎𝑛𝑑𝑒𝑟𝑡ℎ𝑎𝑙;𝐹𝑟𝑒𝑛𝑐ℎ,𝑋)
Given the null hypothesis that there is no Denisovan admixture in population 𝑋, the 9
expected value of the numerator should be 𝑊×𝑟, which is smaller than the expected 10
value of the denominator ((𝑊 +𝑀)×𝑟), in which 𝑊 and 𝑀 are the branch lengths 11
in the phylogenetic model (the same as that in Fig. S8, replacing Han with French), 12
and 𝑟 is the admixture proportion from Neanderthals. If population 𝑋 has 13
Denisovan ancestry, then the numerator could be larger than the denominator, 14
depending on the admixture proportion 𝑞 from Denisovans and the branch length 𝐿 15
(Fig. S8). Thus, populations with large ratios (𝑅!(𝑋) > 1) are inferred to have 16
Denisovan ancestry. 17
Simulations for evaluating 𝑹𝑫(𝑿) 18
We applied coalescent simulations implemented in ms (11) to evaluate the 19
performance of 𝑅!(𝑋) in investigating Denisovan ancestry in EE/NA populations. 20
5
We specify the population split time between modern humans and the common 1
ancestor of Neanderthals and Denisovans to be 560 kya ago, and the split time 2
between Neanderthals and Denisovans to be 380 kya ago (3). We assumed a 3
generation time of 29 years and mutation rate of 5×10!! per base pair per year. We 4
simulated 100 EE/NA populations for each scenario: (1) no admixture with 5
Denisovan and (2) admixture with Denisovan, with the admixture proportion set as a 6
random variables ranging from 0.005 to 0.015. Neanderthal admixture was set to a 7
constant value of 0.02 before the split of West and East populations. The excess of 8
Neanderthal ancestry in East populations was set as a random variable ranging from 9
0.005 to 0.015. We sampled 20 haploid sequences from each simulated modern 10
human population. Simulations followed the demographic model in Fig. S6. 11
12
13
References 14
1. Patterson N et al. (2012) Ancient admixture in human history. Genetics 15 192:1065–93. 16
2. Lazaridis I et al. (2014) Ancient human genomes suggest three ancestral 17 populations for present-day Europeans. Nature 513:409–413. 18
3. Prüfer K et al. (2014) The complete genome sequence of a Neanderthal from 19 the Altai Mountains. Nature 505:43–9. 20
4. Meyer M et al. (2012) A high-coverage genome sequence from an archaic 21 Denisovan individual. Science 338:222–6. 22
5. Patterson N, Price AL, Reich D (2006) Population structure and eigenanalysis. 23 PLoS Genet 2:e190, doi:10.1371/journal.pgen.0020190. 24
6
6. Reich D, Thangaraj K, Patterson N, Price AL, Singh L (2009) Reconstructing 1 Indian population history. Nature 461:489–494. 2
7. Busing F, Meijer E, Leeden R Van Der (1999) Delete-m jackknife for unequal 3 m. Stat Comput:2–7. 4
8. Kunsch H (1989) The jackknife and the bootstrap for general stationary 5 observations. Ann Stat:1217–1241. 6
9. Reich D et al. (2010) Genetic history of an archaic hominin group from 7 Denisova Cave in Siberia. Nature 468:1053–60. 8
10. Reich D et al. (2011) Denisova admixture and the first modern human 9 dispersals into Southeast Asia and Oceania. Am J Hum Genet 89:516–28. 10
11. Hudson RR (2002) Generating samples under a Wright-Fisher neutral model of 11 genetic variation. Bioinformatics 18:337–338. 12
13
7
1
Fig. S1. PCA to explore the relationships of modern humans relative to archaic 2
humans and chimpanzee. (A) Modern humans (2493 individuals from 221 3
populations) were projected onto the top two eigenvectors defined by the PCA of 4
archaic humans and chimpanzee. (B) Enlargement of the modern human portion of 5
the plot. We also plotted the mean of eigenvectors 1 and 2 for each of the populations 6
in Fig. 1A to more clearly visualize the patterns. 7
8
0.005 0.010 0.015 0.020 0.025 0.030
0.08
50.
090
0.09
50.
100
0.10
50.
110
0.11
5
PC1 (61%)
PC2
(39%
)
●
●
●
●
●
●
●●
●
●
●
●
●
●●
●●
●
●
●
●●
●
●
●
●
●
●
●
●
●
● ●
●
●●
●● ●
●
●
●
●●●
●
●
●
●●
●
●
●
●
●
●
●●
●
●
●
●
●
●
●
●
●●
●
●●●
●
●
●
●
●
●
●
●●
●
●
●
●
●
●
●
●
●
●
●
●●
●●
● ●
●
●●
●
●
●
●
●
●
●
●
●●
●
●
●
●
●● ●
●
●
●
●
●
●
●
●●
●
●
●
●
●
●
●
●
●
●●
●
●
●
●
●
●
●●
● ●●
●
●
●●
●
●
●
●●
● ●
●
●
●
●
●
●
●
●●
●●
●●
●
●
●
●
●
●
●
●
●
●
●
●
●●
●●●
●
●
●●
●
●●
● ●
●
●
●
●●
●
●
●
●
●●
●
●●●
●●
●●
●
●
●
●
●
●
●
●
●
●
●●
●
●
● ●
●
●
●
● ● ●●
●
●
●
●●
●
●
●●
●
●
●
●
●
●
●
●
●
●
●
●
●
●
● ● ●
●
●
●
●
●
●
●
●●
●●
●
●
●●
● ●
●
●
●
●●●
●
●
●
●
●
●
●
●
● ●
●●
●
●●
●
●
●
●
●●●●
●
●
●
●
●
●
●
●
●
●
●
●
●●
●
●
●
●
●
●
●●
●●
●
●
●● ●
●●
●
●
●
●
●
●
●
●
●
●
●●
●
●
●
●●
●●
●●
●
●●
●
●
●
●
●
●
●●
●
●
●●
●
●
●
●
●●
●
●
●
●
●
●
●
●
●
●
●
●
●
●
●
●
●
●●
●
●
●●
●●
●
●
●
●
●
●●
●
●
●●
●
●●
●●●
●
●
●
●●●
●● ●
●
●
●
●●
●
●
●●
●
●
●
●
●
●
●●
●
●
●
●
●●
●
●
●
●
●
●
●
●●
●●
●
●●
●
●
●
●
●
●
●
●
●
●
●
● ●●
●
●
●
●●●
●
●
● ●●
●
●●
●●
●
●
●
●
●
● ●●
●
●●
●
●
●
●
●
●
●
●
● ●
●●
●
●
●●
●
●
●
●●●
●
●
●
●
●
●●
−0.8 −0.6 −0.4 −0.2 0.0 0.2 0.4 0.6
−0.8
−0.6
−0.4
−0.2
0.0
0.2
0.4
0.6
PC1 (61%)
PC2
(39%
)
●●●●●●●●●●●●●●●●●●●●●●●●●●●●●●●●●●●●●●●●●●●●●●●●●●●●●●●●●●●●●●●●●●●●●●●●●●●●●●●●●●●●●●●●●●●●●●●●●●●●●●●●●●●●●●●●●●●●●●●●●●●●●●●●●●●●●●●●●●●●●●●●●●●●●●●●●●●●●●●●●●●●●●●●●●●●●●●●●●●●●●●●●●●●●●●●●●●●●●●●●●●●●●●●●●●●●●●●●●●●●●●●●●●●●●●●●●●●●●●●●●●●●●●●●●●●●●●●●●●●●●●●●●●●●●●●●●●●●●●●●●●●●●●●●●●●●●●●●●●●●●●●●●●●●●●●●●●●●●●●●●●●●●●●●●●●●●●●●●●●●●●●●●●●●●●●●●●●●●●●●●●●●●●●●●●●●●●●●●●●●●●●●●●●●●●●●●●●●●●●●●●●●●●●●●●●●●●●●●●●●●●●●●●●●●●●●●●●●●●●●●●●●●●●●●●●●●●●●●●●●●●●●●●●●●●●●●●●●●●●●●●●●●●●●●●●●●●●●●●●●●●●●●●●●●●●●●●●●●●●●●●●●●●●●●●●●●●●●●●●●●●●
●
A B
●
●
●
●
●
●
●
●
●
AfricanBantuSAMandenkaMbutiTunisianDatogHadzaKikuyuLuhyaLuoMasaiOromoSandaweSomaliAlgerianDinkaMozabiteDamaraGanaGuiHaiomHimbaHoanJu_hoan_NorthJu_hoan_South
KhomaniKhweNamaNaroShuaTaa_EastTaa_NorthTaa_WestTshwaTswanaWamboXuunBantuKenyaBiakaEsanGambianKgalagadiMendeSaharawiYorubaEthiopian_JewLibyan_JewMoroccan_JewTunisian_Jew
●
●
●
●
●
●
●
●
●
●
●
●
West EurasianAbkhasianAdygeiBalkarBedouinABedouinBChechenDruzeEgyptianGeorgianIranianJordanianKumykLebaneseLezginNogaiNorth_OssetianPalestinianSaudiSyrianTurkishUkrainianYemenAlbanianArmenianBasqueBelarusianBergamoBulgarianCanary_IslandersCroatian
CypriotCzechEnglishEstonianFinnishFrenchFrench_SouthGreekHungarianIcelandicItalian_SouthLithuanianMalteseMordovianNorwegianOrcadianRussianSardinianScottishSicilianSpanishSpanish_NorthTuscanChuvashAshkenazi_JewGeorgian_JewIranian_JewIraqi_JewTurkish_JewYemenite_Jew
●
●
●
●
●
●
●
●
●
●
●
●
●
●
East EurasianKalmykKyrgyzTajik_PomiriTurkmenUzbekTubalarUlchiAleutAltaianChukchiDolganEskimoEvenItelmenKoryakMansiMongolaNganasanSelkupTlingitTuvinianYakutYukagirXiboCambodianDaiDaurHanHan_NChinaHezhenJapaneseKinhKoreanLahuMiaoNaxi
OroqenSheThaiTuTujiaUygurYiAmiAtayalBorneoMamanwaSemendeTonganVella_LavellaBengaliBalochiBrahuiBurushoGujaratiAGujaratiBGujaratiCGujaratiDHazaraKalashKhariaKusundaLodhiMakraniMalaOngePathanPunjabiSindhiTiwariVishwabrahminCochin_Jew
●
●
●
●
●
AmericanAfricanAmericanAymaraBolivianCabecarKaqchikelMayanMixeMixtecPimaWayuuZapotecAlgonquinChipewyanCreeOjibwaChaneChiloteGuaraniIngaKaritianaPiapocoQuechuaSuruiTicuna
●
●
●
●
OceanianAustralianBougainvilleChoiseulGelaIsabelKolombangaraMakiraMalaitaNew_GuineaOntong_JavaPapuanRanonggaRenBelRussellSanta_CruzSavoTikopiaTonganVella_Lavella
●
Primate and ArchaicAltaiDenisovanChimp
Eurasian, American
OceanianAfrican

8
1
Fig. S2. Cline of Neanderthal vs. Denisovan ancestry in the PCA plot. This is a 2
magnified view of Oceanians and Mamanwa in Fig. 1A. 3
4
0.022 0.024 0.026 0.028
0.090
0.095
0.100
0.105
PC1
PC2
●
●
●
●
●
●
AustralianBougainvilleChoiseulGelaIsabelKolombangaraMakiraMalaitaNew_GuineaOntong_JavaPapuanRanonggaRenBelRussellSanta_CruzSavoTikopiaTonganVella_LavellaMamanwa
9
1
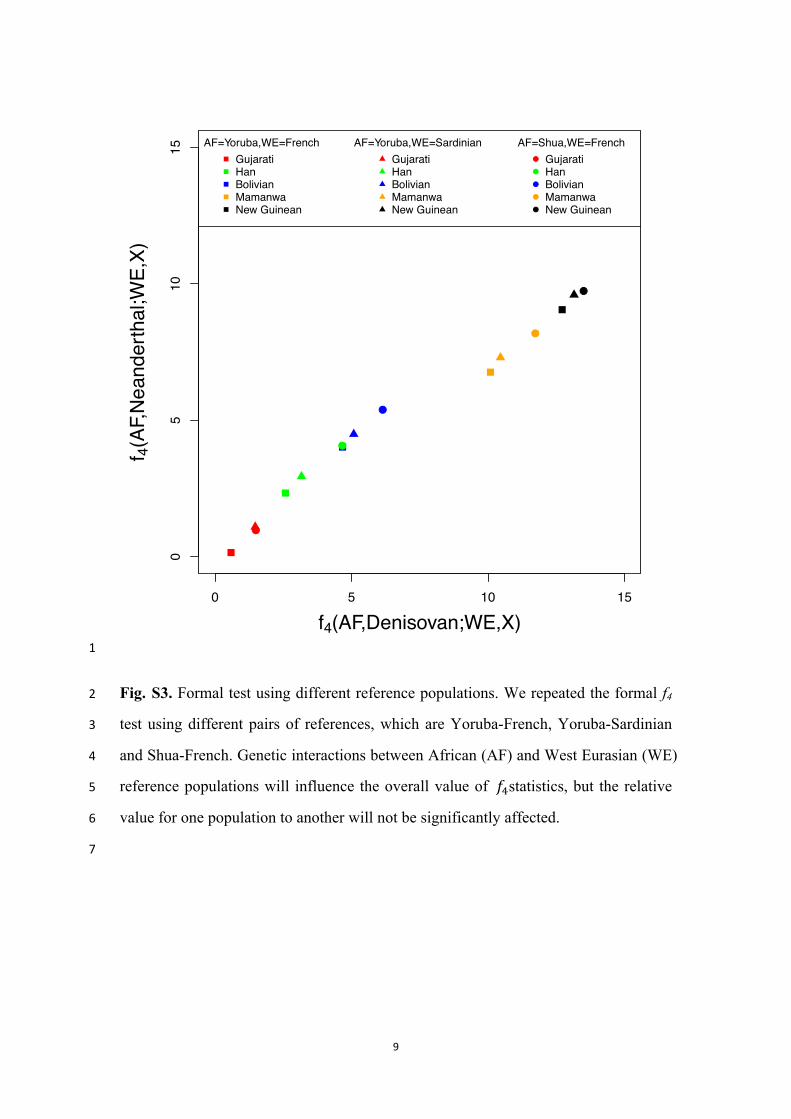
Fig. S3. Formal test using different reference populations. We repeated the formal f4 2
test using different pairs of references, which are Yoruba-French, Yoruba-Sardinian 3
and Shua-French. Genetic interactions between African (AF) and West Eurasian (WE) 4
reference populations will influence the overall value of 𝑓!statistics, but the relative 5
value for one population to another will not be significantly affected. 6
7
0 5 10 15
05
1015
f4(AF,Denisovan;WE,X)
f 4(AF
,Nea
nder
thal
;WE,
X)AF=Yoruba,WE=French
GujaratiHanBolivianMamanwaNew Guinean
AF=Yoruba,WE=SardinianGujaratiHanBolivianMamanwaNew Guinean
●
●
●
●
●
●
●
●
●
●
AF=Shua,WE=FrenchGujaratiHanBolivianMamanwaNew Guinean

10
1
−100 −50 0 50 100 150
−40
−20
020
4060
−0.014
−0.012
−0.010
−0.008
−0.006
−0.004
−0.002
Denisovan
Neandertal
Longitude
Latitude
−100 −50 0 50 100 150
−40
−20
020
4060
−0.010
−0.008
−0.006
−0.004
−0.002
0.000
0.002
Denisovan
Neandertal
Longitude
Latitude
−100 −50 0 50 100 150
−40
−20
020
4060
−0.016
−0.014
−0.012
−0.010
−0.008
−0.006
−0.004
Denisovan
Neandertal
Longitude
Latitude
A
B
C
11
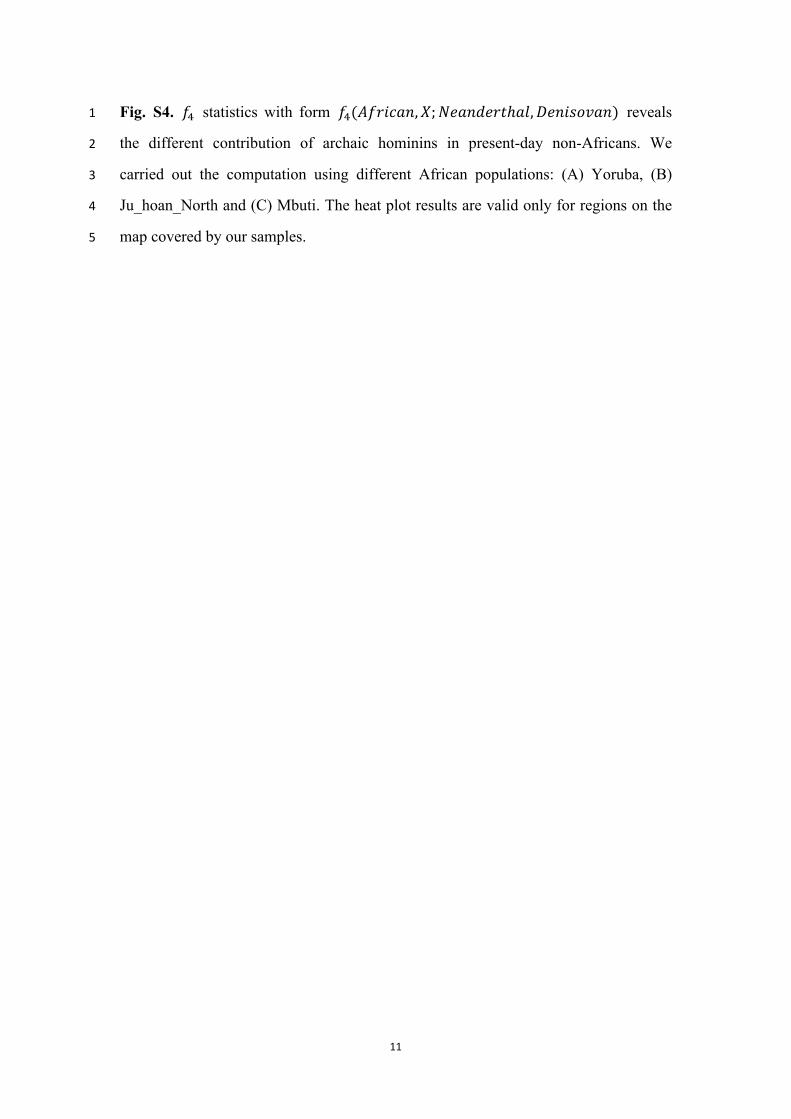
Fig. S4. 𝑓! statistics with form 𝑓!(𝐴𝑓𝑟𝑖𝑐𝑎𝑛,𝑋;𝑁𝑒𝑎𝑛𝑑𝑒𝑟𝑡ℎ𝑎𝑙,𝐷𝑒𝑛𝑖𝑠𝑜𝑣𝑎𝑛) reveals 1
the different contribution of archaic hominins in present-day non-Africans. We 2
carried out the computation using different African populations: (A) Yoruba, (B) 3
Ju_hoan_North and (C) Mbuti. The heat plot results are valid only for regions on the 4
map covered by our samples. 5
12
1
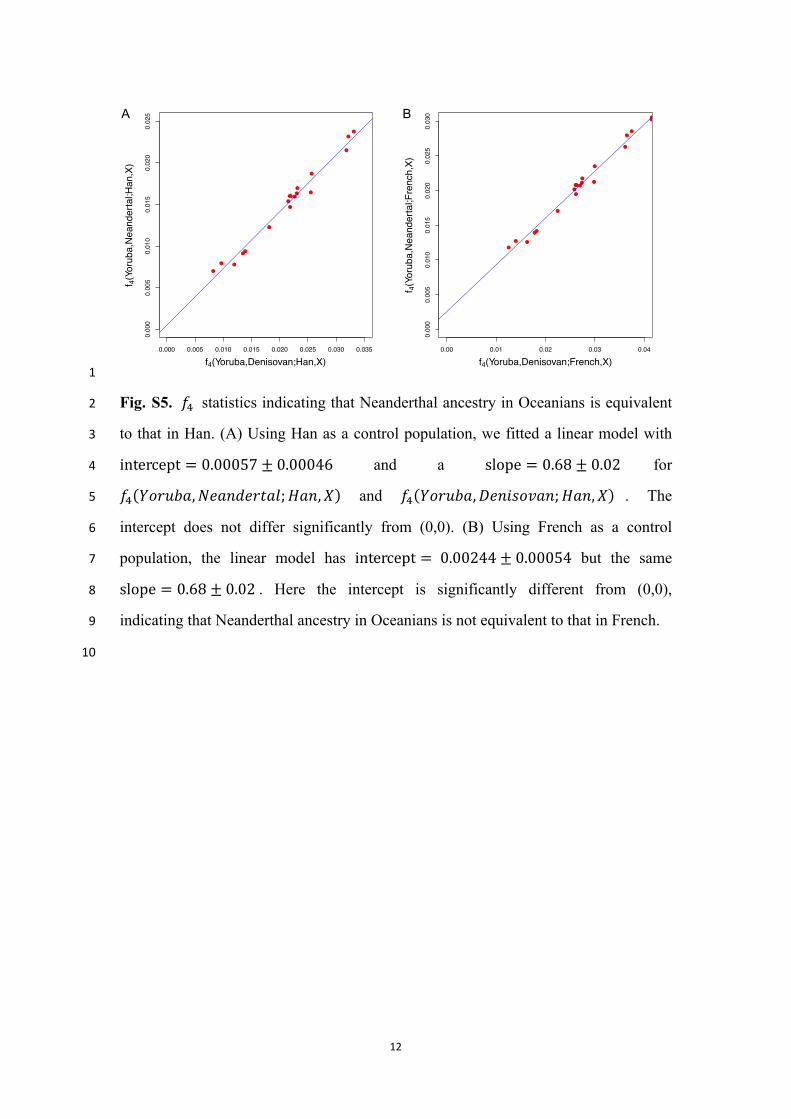
Fig. S5. 𝑓! statistics indicating that Neanderthal ancestry in Oceanians is equivalent 2
to that in Han. (A) Using Han as a control population, we fitted a linear model with 3
intercept = 0.00057± 0.00046 and a slope = 0.68± 0.02 for 4
𝑓! 𝑌𝑜𝑟𝑢𝑏𝑎,𝑁𝑒𝑎𝑛𝑑𝑒𝑟𝑡𝑎𝑙;𝐻𝑎𝑛,𝑋 and 𝑓! 𝑌𝑜𝑟𝑢𝑏𝑎,𝐷𝑒𝑛𝑖𝑠𝑜𝑣𝑎𝑛;𝐻𝑎𝑛,𝑋 . The 5
intercept does not differ significantly from (0,0). (B) Using French as a control 6
population, the linear model has intercept = 0.00244± 0.00054 but the same 7
slope = 0.68± 0.02 . Here the intercept is significantly different from (0,0), 8
indicating that Neanderthal ancestry in Oceanians is not equivalent to that in French. 9
10
A B
●
●
●
●
●
●
●●
●
●
●
●
●
●
●
●
●
●
●
●
0.000 0.005 0.010 0.015 0.020 0.025 0.030 0.035
0.000
0.005
0.010
0.015
0.020
0.025
f4(Yoruba,Denisovan;Han,X)
f 4(Yoruba,Neandertal;Han,X)
●
●
●
●
●
●
●●
●
●
●
●
●
●
●
●
●
●
●
●
0.00 0.01 0.02 0.03 0.04
0.000
0.005
0.010
0.015
0.020
0.025
0.030
f4(Yoruba,Denisovan;French,X)
f 4(Yoruba,Neandertal;French,X)

13
1
2
Fig. S6. Demographic model for simulations. We simulated 100 East populations with 3
both Neanderthal and Denisovan admixture ranging from 0.005-0.015, and another 4
100 East populations with Neanderthal but without Denisovan admixture. 5
African West East East
N D
0.005-0.015
0.0260 kya
37.5 kya
560 kya
380 kya
0.005-0.015
East
100 populations

14
1
Fig. S7. The 𝑅!(𝑋) ratio in simulated data. (A) with Denisovan admixture; (B) 2
without Denisovan admixture. 3
4
●
●
●
●
●●
●●
●
●
●
●
●
●
●
●
●
●
●
●
●
●
●
●
●
●
●
●
●
●
●
●
●
●●
●
●
●
●
●
●
●
●
●
●
●
●
●
●
●
●
●
●
●
●●
●
●
●
●
●
●
●
●
●
●
●
●
●
●
●
●
●
●
●
●
0 20 40 60 80 100
0.0
0.5
1.0
1.5
2.0
2.5
Simualted Populations
Rat
ioA B
●
●
●
●●
●
●
●
●
●
●
●●
●
●
●
●
●
●
●
●
●
●
●
●
●
●
●●
●●
●
●
●
●
●
●
●
●
●
●
●
●
●
●
●●
●
●
●
●
●
●●
●
●
●
●
●
●
●
●●
●
●
●
●
●
●
●
●
●
●
●
●
●
●
●
●
●
●
●
●
●
●
●
●
●
●
●
●
●
●
●
●
●●
●
●
0 20 40 60 80 100
0.0
0.2
0.4
0.6
0.8
1.0
1.2
Simulated Populations
Rat
io

15
1
2
3
Fig. S8. Phylogenetic model for admixture between archaic humans and Oceanians. 4
Han is used as a control for the Neanderthal ancestry in Oceanians (X), as equivalent 5
Neanderthal ancestry in Han and X will result in r = 0. 6
7
W
Han X Denisovan
p
Yoruba Neanderthal
q
r
L M
16
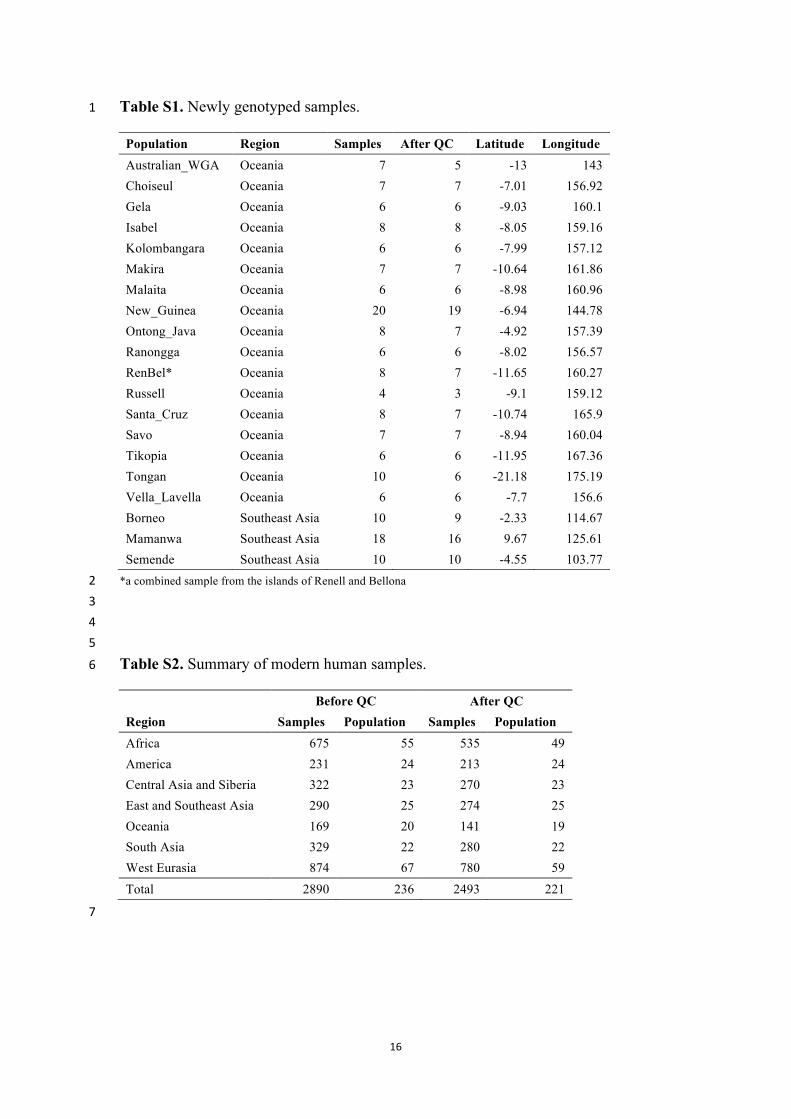
Table S1. Newly genotyped samples. 1
Population Region Samples After QC Latitude Longitude Australian_WGA Oceania 7 5 -13 143 Choiseul Oceania 7 7 -7.01 156.92 Gela Oceania 6 6 -9.03 160.1 Isabel Oceania 8 8 -8.05 159.16 Kolombangara Oceania 6 6 -7.99 157.12 Makira Oceania 7 7 -10.64 161.86 Malaita Oceania 6 6 -8.98 160.96 New_Guinea Oceania 20 19 -6.94 144.78 Ontong_Java Oceania 8 7 -4.92 157.39 Ranongga Oceania 6 6 -8.02 156.57 RenBel* Oceania 8 7 -11.65 160.27 Russell Oceania 4 3 -9.1 159.12 Santa_Cruz Oceania 8 7 -10.74 165.9 Savo Oceania 7 7 -8.94 160.04 Tikopia Oceania 6 6 -11.95 167.36 Tongan Oceania 10 6 -21.18 175.19 Vella_Lavella Oceania 6 6 -7.7 156.6 Borneo Southeast Asia 10 9 -2.33 114.67 Mamanwa Southeast Asia 18 16 9.67 125.61 Semende Southeast Asia 10 10 -4.55 103.77
*a combined sample from the islands of Renell and Bellona 2 3 4 5
Table S2. Summary of modern human samples. 6
Before QC After QC
Region Samples Population Samples Population Africa 675 55 535 49 America 231 24 213 24 Central Asia and Siberia 322 23 270 23 East and Southeast Asia 290 25 274 25 Oceania 169 20 141 19 South Asia 329 22 280 22 West Eurasia 874 67 780 59 Total 2890 236 2493 221
7

17
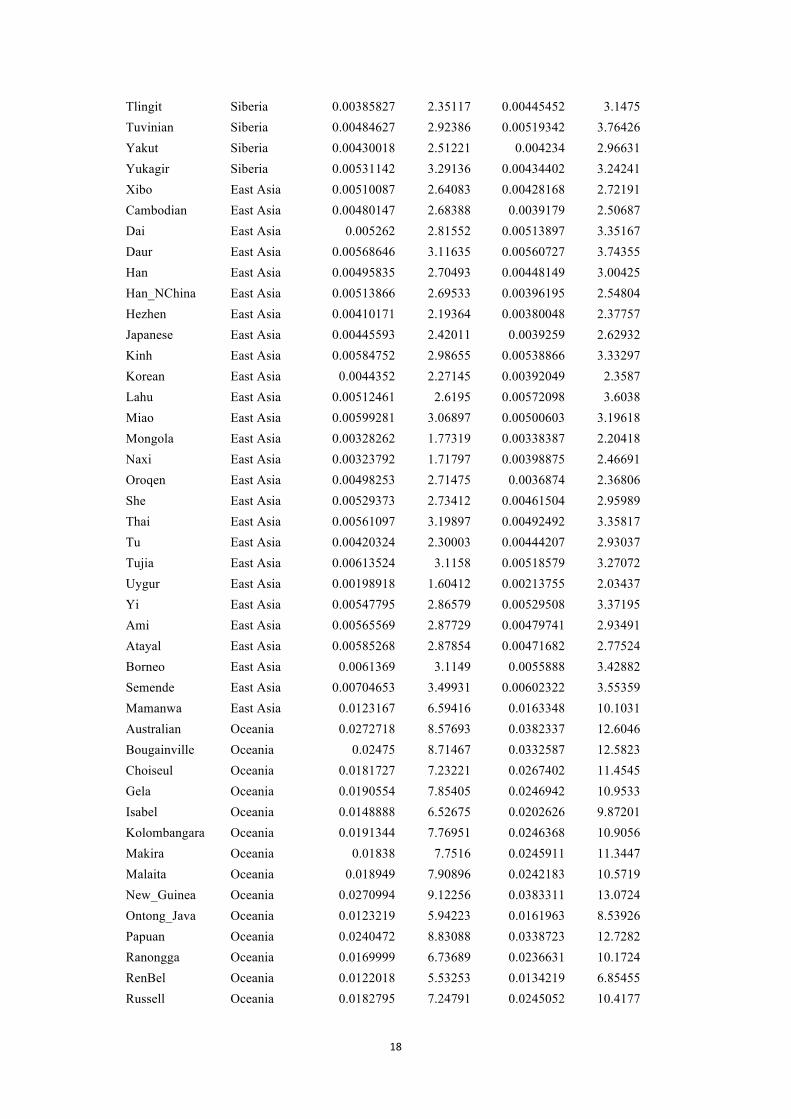
Table S3. Formal test for archaic admixture in EE/NA populations. 1
Population Region 𝒇𝟒_𝑵 Z score 𝒇𝟒_𝑫 Z score Aymara America 0.00654649 3.34581 0.00780973 4.41745 Bolivian America 0.0073668 4.13747 0.00761626 4.7924 Cabecar America 0.00502822 2.29092 0.00633129 3.17902 Kaqchikel America 0.00592824 3.00805 0.00637507 3.60876 Mayan America 0.0057727 3.325 0.00634171 4.06068 Mixe America 0.005752 3.05527 0.00536758 3.13379 Mixtec America 0.00491685 2.70694 0.00534292 3.38178 Pima America 0.00587814 3.00055 0.00674086 3.86248 Wayuu America 0.0047155 1.73693 0.00406557 1.72637 Zapotec America 0.00567177 3.03781 0.00588349 3.56508 Algonquin America 0.00341791 2.10024 0.00359057 2.51794 Chipewyan America 0.00476624 3.06588 0.00459867 3.35761 Cree America 0.00326052 2.35353 0.00399524 3.16568 Ojibwa America 0.00295479 2.1697 0.00405415 3.34406 Chane America 0.00501931 1.95521 0.00483637 2.06794 Chilote America 0.00413504 2.61033 0.00437527 3.13003 Guarani America 0.00765614 3.88535 0.00805691 4.45616 Inga America 0.00756856 3.39662 0.00787352 3.92312 Karitiana America 0.00658685 3.29439 0.00782881 4.21389 Piapoco America 0.00437142 2.02264 0.00553827 2.91193 Quechua America 0.00629271 3.41472 0.00747954 4.58026 Surui America 0.00764527 3.38808 0.00587283 2.89066 Ticuna America 0.00839289 3.27438 0.00926771 3.83763 Kalmyk Central Asia 0.00449149 2.75855 0.00378622 2.72755 Kyrgyz Central Asia 0.00335323 2.22386 0.00323688 2.65414 Tajik_Pomiri Central Asia 0.000552145 0.528045 0.00143518 1.58415 Turkmen Central Asia 0.00165259 1.4982 0.00252873 2.64956 Uzbek Central Asia 0.00345197 3.15598 0.0033855 3.55886 Tubalar Siberia 0.00371812 2.78705 0.00354145 3.10848 Ulchi Siberia 0.00551125 3.01392 0.00466307 3.11411 Aleut Siberia 0.0024954 2.06782 0.00291119 2.66344 Altaian Siberia 0.00472344 2.98713 0.00435998 3.28925 Chukchi Siberia 0.00722322 3.98002 0.00572292 3.67359 Dolgan Siberia 0.0046463 2.27193 0.00325963 1.95252 Eskimo Siberia 0.00669728 3.66117 0.00645787 4.16728 Even Siberia 0.00330756 2.28224 0.00357582 2.949 Itelmen Siberia 0.0059248 2.95508 0.00412718 2.42011 Koryak Siberia 0.00613465 3.05767 0.00470671 2.75689 Mansi Siberia 0.00361749 2.5565 0.00382578 3.19162 Nganasan Siberia 0.00579826 2.92769 0.00543281 3.1507 Selkup Siberia 0.00341876 2.27007 0.00433584 3.36862
18
Tlingit Siberia 0.00385827 2.35117 0.00445452 3.1475 Tuvinian Siberia 0.00484627 2.92386 0.00519342 3.76426 Yakut Siberia 0.00430018 2.51221 0.004234 2.96631 Yukagir Siberia 0.00531142 3.29136 0.00434402 3.24241 Xibo East Asia 0.00510087 2.64083 0.00428168 2.72191 Cambodian East Asia 0.00480147 2.68388 0.0039179 2.50687 Dai East Asia 0.005262 2.81552 0.00513897 3.35167 Daur East Asia 0.00568646 3.11635 0.00560727 3.74355 Han East Asia 0.00495835 2.70493 0.00448149 3.00425 Han_NChina East Asia 0.00513866 2.69533 0.00396195 2.54804 Hezhen East Asia 0.00410171 2.19364 0.00380048 2.37757 Japanese East Asia 0.00445593 2.42011 0.0039259 2.62932 Kinh East Asia 0.00584752 2.98655 0.00538866 3.33297 Korean East Asia 0.0044352 2.27145 0.00392049 2.3587 Lahu East Asia 0.00512461 2.6195 0.00572098 3.6038 Miao East Asia 0.00599281 3.06897 0.00500603 3.19618 Mongola East Asia 0.00328262 1.77319 0.00338387 2.20418 Naxi East Asia 0.00323792 1.71797 0.00398875 2.46691 Oroqen East Asia 0.00498253 2.71475 0.0036874 2.36806 She East Asia 0.00529373 2.73412 0.00461504 2.95989 Thai East Asia 0.00561097 3.19897 0.00492492 3.35817 Tu East Asia 0.00420324 2.30003 0.00444207 2.93037 Tujia East Asia 0.00613524 3.1158 0.00518579 3.27072 Uygur East Asia 0.00198918 1.60412 0.00213755 2.03437 Yi East Asia 0.00547795 2.86579 0.00529508 3.37195 Ami East Asia 0.00565569 2.87729 0.00479741 2.93491 Atayal East Asia 0.00585268 2.87854 0.00471682 2.77524 Borneo East Asia 0.0061369 3.1149 0.0055888 3.42882 Semende East Asia 0.00704653 3.49931 0.00602322 3.55359 Mamanwa East Asia 0.0123167 6.59416 0.0163348 10.1031 Australian Oceania 0.0272718 8.57693 0.0382337 12.6046 Bougainville Oceania 0.02475 8.71467 0.0332587 12.5823 Choiseul Oceania 0.0181727 7.23221 0.0267402 11.4545 Gela Oceania 0.0190554 7.85405 0.0246942 10.9533 Isabel Oceania 0.0148888 6.52675 0.0202626 9.87201 Kolombangara Oceania 0.0191344 7.76951 0.0246368 10.9056 Makira Oceania 0.01838 7.7516 0.0245911 11.3447 Malaita Oceania 0.018949 7.90896 0.0242183 10.5719 New_Guinea Oceania 0.0270994 9.12256 0.0383311 13.0724 Ontong_Java Oceania 0.0123219 5.94223 0.0161963 8.53926 Papuan Oceania 0.0240472 8.83088 0.0338723 12.7282 Ranongga Oceania 0.0169999 6.73689 0.0236631 10.1724 RenBel Oceania 0.0122018 5.53253 0.0134219 6.85455 Russell Oceania 0.0182795 7.24791 0.0245052 10.4177

19
Santa_Cruz Oceania 0.0248267 8.99604 0.0337085 12.8569 Savo Oceania 0.0193718 7.91406 0.0250535 10.9694 Tikopia Oceania 0.0116368 5.22349 0.0153103 7.79193 Tongan Oceania 0.011057 5.2166 0.0117895 6.29913 Vella_Lavella Oceania 0.0200786 7.90191 0.0265223 11.4415 Bengali South Asia 0.00245897 1.80571 0.00268206 2.2135 Balochi South Asia -0.000701985 -0.782533 0.000208284 0.271057 Brahui South Asia -0.000168224 -0.171206 0.000737734 0.88433 Burusho South Asia 0.00104818 1.10133 0.00206653 2.45138 GujaratiA South Asia 0.00024821 0.192169 0.00075845 0.643199 GujaratiB South Asia 0.000249215 0.187538 0.00173418 1.49323 GujaratiC South Asia 0.00184462 1.31043 0.00207006 1.65486 GujaratiD South Asia 0.00206003 1.43988 0.00276332 2.16368 Hazara South Asia 0.0019354 1.51528 0.00242988 2.245 Kalash South Asia 5.62E-05 0.0500881 0.000631432 0.630337 Kharia South Asia 0.00388438 2.46146 0.00534866 3.9163 Kusunda South Asia 0.0041205 2.3395 0.00438097 2.89026 Lodhi South Asia 0.00132816 1.0136 0.00291791 2.59425 Makrani South Asia -0.00012384 -0.134554 0.00108029 1.37866 Mala South Asia 0.00283812 2.14096 0.00352956 3.03696 Onge South Asia 0.00640251 3.02734 0.00528425 2.81071 Pathan South Asia 0.000358011 0.403034 0.00151379 1.89172 Punjabi South Asia 0.001061 0.825519 0.00220053 1.89477 Sindhi South Asia 0.000571881 0.560093 0.00184129 2.04613 Tiwari South Asia 0.00115799 1.10369 0.00208327 2.20532 Vishwabrahmin South Asia 0.00302711 2.22717 0.00420248 3.52604 Cochin_Jew South Asia -0.000707713 -0.536855 -0.000617467 -0.537841
Note: 𝑓!_𝑁 and 𝑓!_𝐷 stand for 𝑓!(𝑆𝑎𝑛,𝑁𝑒𝑎𝑛𝑑𝑒𝑟𝑡ℎ𝑎𝑙;𝐹𝑟𝑒𝑛𝑐ℎ,𝑋) and 𝑓!(𝑆𝑎𝑛,𝐷𝑒𝑛𝑖𝑠𝑜𝑣𝑎𝑛;𝐹𝑟𝑒𝑛𝑐ℎ,𝑋) , 1 respectively. Weighted Block Jackknife (block size of 5 cM) was used to correct LD among SNPs and estimate 2 standard deviations. For these tests, we interpreted |Z-score| ≥ 2 as significant evidence of admixture. 3 4
20
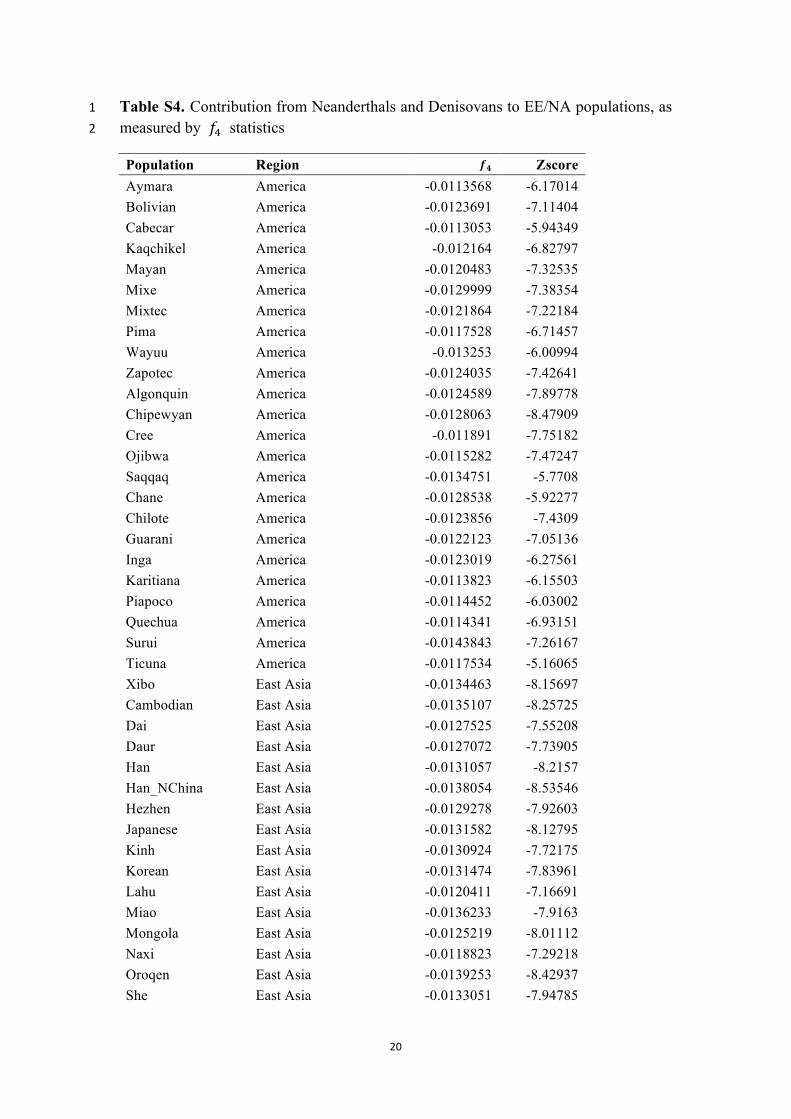
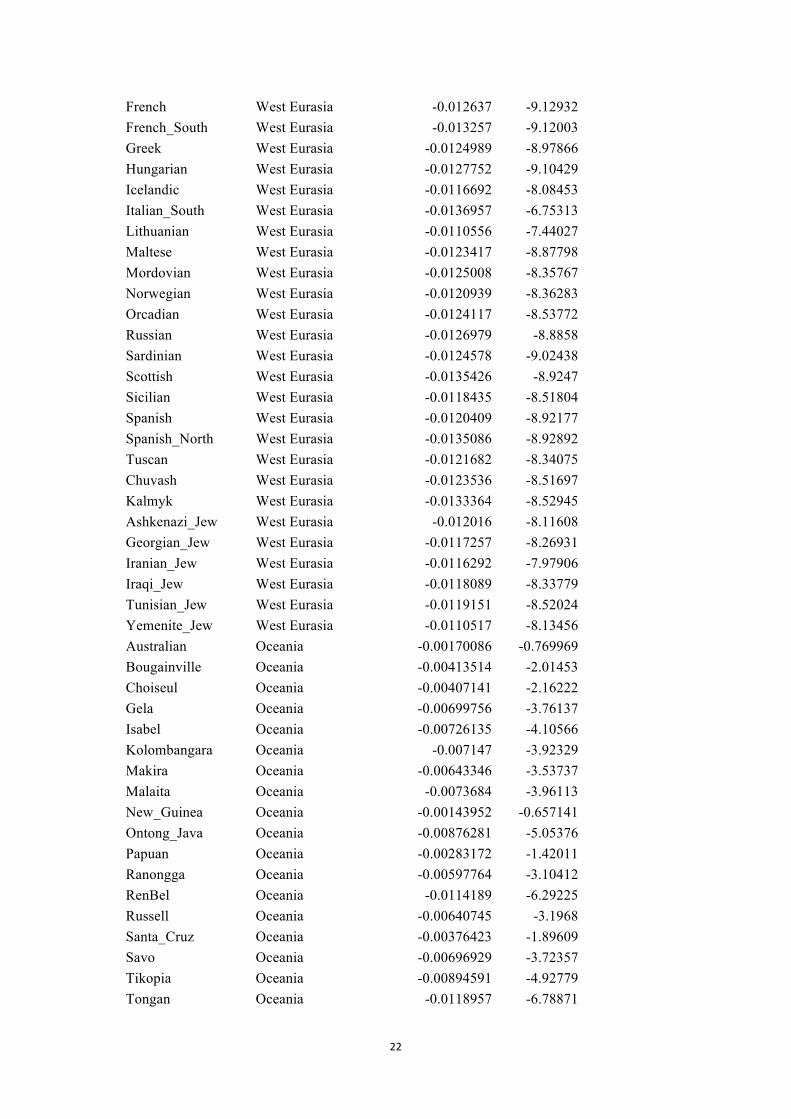
Table S4. Contribution from Neanderthals and Denisovans to EE/NA populations, as 1 measured by 𝑓! statistics 2
Population Region 𝒇𝟒 Zscore Aymara America -0.0113568 -6.17014 Bolivian America -0.0123691 -7.11404 Cabecar America -0.0113053 -5.94349 Kaqchikel America -0.012164 -6.82797 Mayan America -0.0120483 -7.32535 Mixe America -0.0129999 -7.38354 Mixtec America -0.0121864 -7.22184 Pima America -0.0117528 -6.71457 Wayuu America -0.013253 -6.00994 Zapotec America -0.0124035 -7.42641 Algonquin America -0.0124589 -7.89778 Chipewyan America -0.0128063 -8.47909 Cree America -0.011891 -7.75182 Ojibwa America -0.0115282 -7.47247 Saqqaq America -0.0134751 -5.7708 Chane America -0.0128538 -5.92277 Chilote America -0.0123856 -7.4309 Guarani America -0.0122123 -7.05136 Inga America -0.0123019 -6.27561 Karitiana America -0.0113823 -6.15503 Piapoco America -0.0114452 -6.03002 Quechua America -0.0114341 -6.93151 Surui America -0.0143843 -7.26167 Ticuna America -0.0117534 -5.16065 Xibo East Asia -0.0134463 -8.15697 Cambodian East Asia -0.0135107 -8.25725 Dai East Asia -0.0127525 -7.55208 Daur East Asia -0.0127072 -7.73905 Han East Asia -0.0131057 -8.2157 Han_NChina East Asia -0.0138054 -8.53546 Hezhen East Asia -0.0129278 -7.92603 Japanese East Asia -0.0131582 -8.12795 Kinh East Asia -0.0130924 -7.72175 Korean East Asia -0.0131474 -7.83961 Lahu East Asia -0.0120411 -7.16691 Miao East Asia -0.0136233 -7.9163 Mongola East Asia -0.0125219 -8.01112 Naxi East Asia -0.0118823 -7.29218 Oroqen East Asia -0.0139253 -8.42937 She East Asia -0.0133051 -7.94785

21
Thai East Asia -0.0133096 -8.39116 Tu East Asia -0.0123944 -7.84026 Tujia East Asia -0.0135744 -8.17807 Yi East Asia -0.012814 -7.75979 Ami East Asia -0.0134913 -7.88516 Atayal East Asia -0.0137697 -7.87468 Borneo East Asia -0.0131807 -7.88718 Mamanwa East Asia -0.00861153 -5.40503 Semende East Asia -0.0136523 -8.0916 Abkhasian West Eurasia -0.0116847 -8.14947 Adygei West Eurasia -0.0130862 -9.30735 Balkar West Eurasia -0.0119961 -8.27538 Balochi West Eurasia -0.0117241 -8.94501 BedouinA West Eurasia -0.0105699 -8.66895 Chechen West Eurasia -0.0114145 -7.9253 Druze West Eurasia -0.0110122 -8.32917 Egyptian West Eurasia -0.00952254 -8.04347 Georgian West Eurasia -0.0127099 -8.79379 Iranian West Eurasia -0.0119381 -8.62838 Jordanian West Eurasia -0.0119378 -9.14616 Kumyk West Eurasia -0.0114202 -7.94278 Lebanese West Eurasia -0.00970762 -7.06883 Lezgin West Eurasia -0.0114489 -7.96432 Nogai West Eurasia -0.0120184 -8.30905 North_Ossetian West Eurasia -0.012407 -8.8656 Palestinian West Eurasia -0.0111138 -9.14775 Saudi West Eurasia -0.0102548 -7.77089 Syrian West Eurasia -0.0105918 -7.93587 Turkish West Eurasia -0.0118317 -9.08823 Ukrainian West Eurasia -0.0123904 -8.32331 Yemen West Eurasia -0.0113953 -8.99184 Albanian West Eurasia -0.0127503 -8.743 Armenian West Eurasia -0.0116677 -8.54457 Basque West Eurasia -0.0117103 -8.36297 Belarusian West Eurasia -0.01283 -8.84929 Bergamo West Eurasia -0.0119658 -8.58631 Bulgarian West Eurasia -0.0129029 -8.88617 Canary_Islanders West Eurasia -0.0105437 -6.07032 Croatian West Eurasia -0.0124387 -8.60522 Cypriot West Eurasia -0.0116234 -8.16788 Czech West Eurasia -0.012375 -8.53252 English West Eurasia -0.0114766 -7.98421 Estonian West Eurasia -0.0119931 -8.25819 Finnish West Eurasia -0.0125811 -8.1898
22
French West Eurasia -0.012637 -9.12932 French_South West Eurasia -0.013257 -9.12003 Greek West Eurasia -0.0124989 -8.97866 Hungarian West Eurasia -0.0127752 -9.10429 Icelandic West Eurasia -0.0116692 -8.08453 Italian_South West Eurasia -0.0136957 -6.75313 Lithuanian West Eurasia -0.0110556 -7.44027 Maltese West Eurasia -0.0123417 -8.87798 Mordovian West Eurasia -0.0125008 -8.35767 Norwegian West Eurasia -0.0120939 -8.36283 Orcadian West Eurasia -0.0124117 -8.53772 Russian West Eurasia -0.0126979 -8.8858 Sardinian West Eurasia -0.0124578 -9.02438 Scottish West Eurasia -0.0135426 -8.9247 Sicilian West Eurasia -0.0118435 -8.51804 Spanish West Eurasia -0.0120409 -8.92177 Spanish_North West Eurasia -0.0135086 -8.92892 Tuscan West Eurasia -0.0121682 -8.34075 Chuvash West Eurasia -0.0123536 -8.51697 Kalmyk West Eurasia -0.0133364 -8.52945 Ashkenazi_Jew West Eurasia -0.012016 -8.11608 Georgian_Jew West Eurasia -0.0117257 -8.26931 Iranian_Jew West Eurasia -0.0116292 -7.97906 Iraqi_Jew West Eurasia -0.0118089 -8.33779 Tunisian_Jew West Eurasia -0.0119151 -8.52024 Yemenite_Jew West Eurasia -0.0110517 -8.13456 Australian Oceania -0.00170086 -0.769969 Bougainville Oceania -0.00413514 -2.01453 Choiseul Oceania -0.00407141 -2.16222 Gela Oceania -0.00699756 -3.76137 Isabel Oceania -0.00726135 -4.10566 Kolombangara Oceania -0.007147 -3.92329 Makira Oceania -0.00643346 -3.53737 Malaita Oceania -0.0073684 -3.96113 New_Guinea Oceania -0.00143952 -0.657141 Ontong_Java Oceania -0.00876281 -5.05376 Papuan Oceania -0.00283172 -1.42011 Ranongga Oceania -0.00597764 -3.10412 RenBel Oceania -0.0114189 -6.29225 Russell Oceania -0.00640745 -3.1968 Santa_Cruz Oceania -0.00376423 -1.89609 Savo Oceania -0.00696929 -3.72357 Tikopia Oceania -0.00894591 -4.92779 Tongan Oceania -0.0118957 -6.78871

23
Vella_Lavella Oceania -0.00619917 -3.29251 Aleut Siberia -0.0122087 -7.88472 Altaian Siberia -0.0129901 -8.25945 Chukchi Siberia -0.0141254 -8.62916 Dolgan Siberia -0.0140169 -7.80672 Eskimo Siberia -0.012859 -7.69417 Even Siberia -0.0123609 -7.94565 Itelmen Siberia -0.0144184 -8.12758 Koryak Siberia -0.014047 -8.22844 Mansi Siberia -0.0124248 -7.78388 Nganasan Siberia -0.0129817 -7.4184 Selkup Siberia -0.0117082 -7.54102 Tubalar Siberia -0.0128086 -8.55665 Tuvinian Siberia -0.0122805 -7.5059 Ulchi Siberia -0.0134762 -8.27474 Yakut Siberia -0.0126828 -7.79545 Yukagir Siberia -0.013593 -8.93147 Tlingit Siberia -0.0120285 -7.45217 Hazara Central Asia -0.0121362 -8.43054 Kyrgyz Central Asia -0.0127431 -8.26805 Tajik_Pomiri Central Asia -0.0117521 -8.38948 Turkmen Central Asia -0.0117556 -8.24613 Uygur Central Asia -0.0124826 -8.69796 Uzbek Central Asia -0.0126931 -8.80867 Bengali South Asia -0.0124116 -8.65175 Brahui South Asia -0.0117316 -8.84525 Burusho South Asia -0.0116154 -8.39052 GujaratiA South Asia -0.0121207 -8.33293 Kalash South Asia -0.0120513 -8.16289 Kharia South Asia -0.011161 -7.61859 Kusunda South Asia -0.0123753 -7.64658 Lodhi South Asia -0.0110348 -7.92198 Makrani South Asia -0.0114286 -9.07434 Mala South Asia -0.0119417 -8.55961 Onge South Asia -0.0137441 -7.91119 Pathan South Asia -0.0114744 -8.55508 Punjabi South Asia -0.0114895 -7.67388 Sindhi South Asia -0.0113607 -8.5113 Tiwari South Asia -0.0117085 -8.73025 Vishwabrahmin South Asia -0.0114583 -8.13037 Cochin_Jew South Asia -0.012539 -8.65825
Note: We computed the value of 𝑓!(𝑌𝑜𝑟𝑢𝑏𝑎,𝑋;𝑁𝑒𝑎𝑛𝑑𝑒𝑟𝑡ℎ𝑎𝑙,𝐷𝑒𝑛𝑖𝑠𝑜𝑣𝑎𝑛). Weighted Block Jackknife (block 1 size of 5 cM) was used to estimate standard deviations. An excess of allele sharing with Denisovan yields positive 2 values while an excess with Neanderthal yields negative values. 3

24
Table S5. Genetic affinity of EE/NA populations with New Guineans and 1 Australians. 2
Population Region 𝒇𝟒 Zscore Aymara America -0.000785737 -0.386815 Bolivian America -5.21E-05 -0.0272089 Cabecar America -0.00127859 -0.575843 Kaqchikel America -0.000526751 -0.263213 Mayan America -0.000826238 -0.462707 Mixe America -0.000212424 -0.107201 Mixtec America 0.000499114 0.259937 Pima America 0.00149914 0.749923 Zapotec America 0.00123898 0.655582 Algonquin America 0.00260927 1.45921 Chipewyan America 0.00192564 1.11258 Cree America 0.00140592 0.804392 Ojibwa America 0.00188398 1.17199 Chilote America 0.00289384 1.64472 Guarani America 0.000957188 0.487047 Inga America -0.00226077 -1.05582 Karitiana America -0.0014192 -0.669221 Piapoco America 0.000123469 0.0591158 Quechua America 0.000777798 0.410668 Surui America -0.0029972 -1.2922 Ticuna America -0.00142008 -0.530124 Kalmyk Central Asia 0.00128024 0.789235 Kyrgyz Central Asia 0.0016012 1.02886 Turkmen Central Asia 0.00188986 1.28262 Uzbek Central Asia 0.00106518 0.758476 Tubalar Siberia 0.000528495 0.341376 Ulchi Siberia 0.0017784 1.04411 Altaian Siberia 0.00148443 0.898508 Chukchi Siberia 0.00204021 1.18434 Dolgan Siberia 0.00257933 1.44473 Eskimo Siberia 0.000641111 0.368333 Even Siberia 0.000827268 0.514633 Itelmen Siberia 0.00188349 1.02502 Koryak Siberia 0.00209552 1.13464 Mansi Siberia 0.0017999 1.12985 Nganasan Siberia 0.00153285 0.838453 Selkup Siberia 0.000361015 0.220014 Tlingit Siberia 0.00172224 1.01126 Tuvinian Siberia 0.000457009 0.266018 Yakut Siberia 0.00141006 0.853411

25
Yukagir Siberia 0.00133165 0.813767 Xibo East Asia 0.00118664 0.688472 Cambodian East Asia -0.000948265 -0.572967 Dai East Asia -0.000974977 -0.569941 Daur East Asia 0.00123902 0.736565 Han East Asia -0.000170255 -0.102856 Han_NChina East Asia -0.000528713 -0.316984 Hezhen East Asia 0.000476965 0.279418 Japanese East Asia 0.000891427 0.53743 Kinh East Asia -0.000482928 -0.279248 Korean East Asia 0.000712585 0.405167 Lahu East Asia -0.00148382 -0.879844 Miao East Asia 0.0002751 0.155482 Mongola East Asia -0.000732019 -0.435802 Naxi East Asia 0.000767063 0.429103 Oroqen East Asia 0.00134608 0.777567 She East Asia -0.000220156 -0.127331 Thai East Asia -0.0010863 -0.674188 Tu East Asia 0.000785474 0.475262 Tujia East Asia 5.16E-05 0.0303204 Yi East Asia -0.00022672 -0.126796 Ami East Asia 0.000198484 0.112919 Atayal East Asia -0.00111366 -0.619895 Borneo East Asia -0.00172608 -1.02057 Mamanwa East Asia -0.00346479 -2.13711 Semende East Asia -0.00088986 -0.527028 Hazara South Asia 0.000996639 0.660642 Kharia South Asia 0.00104571 0.66734 Kusunda South Asia 0.000770568 0.46811 Mala South Asia 0.00196905 1.33881 Onge South Asia -0.00130388 -0.671311 Vishwabrahmin South Asia 0.00154133 1.05551 Bougainville Oceania -0.0162316 -8.07864 Choiseul Oceania -0.0130027 -7.06624 Gela Oceania -0.0197012 -10.7974 Isabel Oceania -0.00944564 -5.44678 Kolombangara Oceania -0.0122022 -6.6586 Makira Oceania -0.0269032 -15.3172 Malaita Oceania -0.0195023 -10.4345 Ontong_Java Oceania -0.0181257 -10.0548 Papuan Oceania -0.0792317 -39.7834 Ranongga Oceania -0.0122975 -6.78325 RenBel Oceania -0.013556 -6.95393 Russell Oceania -0.0164172 -7.86517

26
Santa_Cruz Oceania -0.0393444 -19.6526 Savo Oceania -0.0224406 -12.4621 Tikopia Oceania -0.0160977 -8.75951 Tongan Oceania -0.0136881 -7.61813 Vella_Lavella Oceania -0.0115974 -6.495
Note: We computed 𝑓!(𝑌𝑜𝑟𝑢𝑏𝑎,𝑋;𝑁𝑒𝑤𝐺𝑢𝑖𝑛𝑒𝑎𝑛,𝐴𝑢𝑠𝑡𝑟𝑎𝑙𝑖𝑎𝑛) for each EE/NA population. Closer genetic 1 affinity with New Guineans will yield negative 𝑓! statistics, while closer affinities with Australians will yield 2 positive statistics. A weighted Block Jackknife (block size of 5 cM) was used to correct LD among SNPs and 3 estimate standard deviations. We interpreted |Z-score| ≥ 2 (bold) as a significant difference of affinity with New 4 Guinean vs. Australian. 5 6 7 8
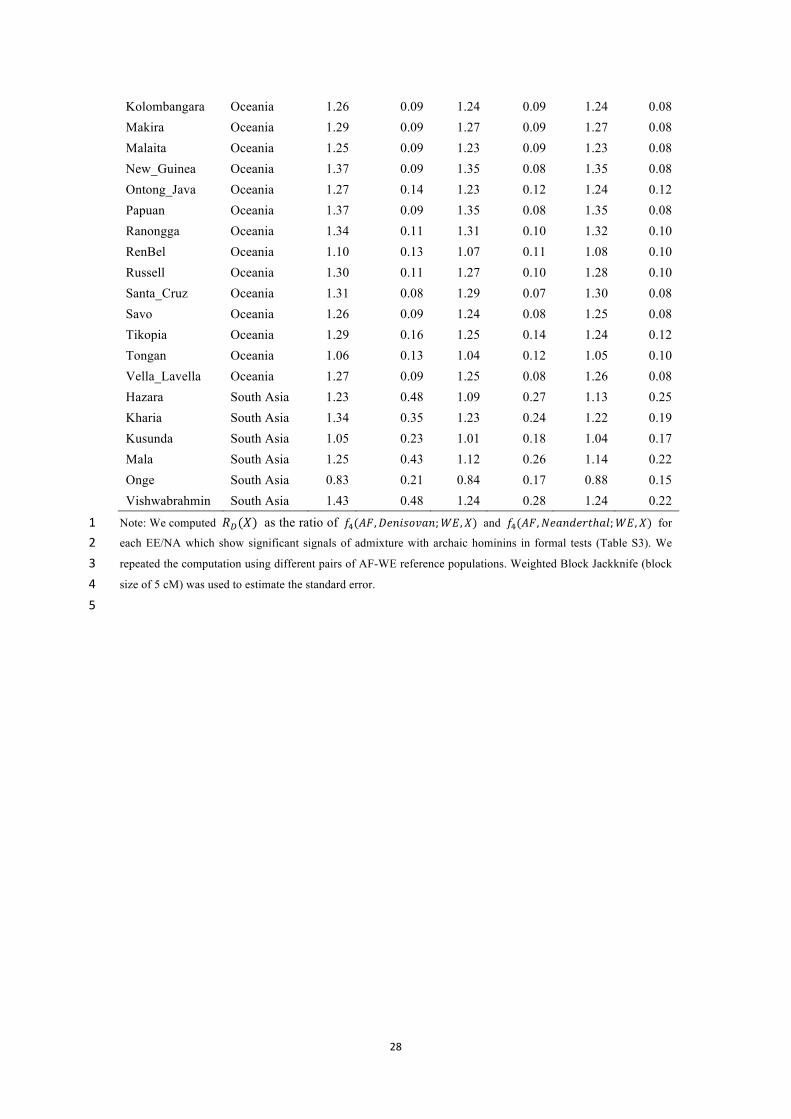
Table S6. 𝑅!(𝑋) ratios using different reference populations. 9
Population Region Yoruba-French Yoruba-Sardinian Shua-French
𝑅!(𝑋) SE 𝑅!(𝑋) SE 𝑅!(𝑋) SE Aymara America 1.20 0.27 1.14 0.22 1.13 0.16 Bolivian America 1.03 0.16 1.01 0.14 1.03 0.12 Cabecar America 1.22 0.30 1.15 0.24 1.15 0.19 Kaqchikel America 1.08 0.27 1.04 0.21 1.05 0.16 Mayan America 1.12 0.28 1.06 0.21 1.07 0.14 Mixe America 0.94 0.21 0.93 0.18 0.96 0.14 Mixtec America 1.09 0.27 1.04 0.21 1.05 0.16 Pima America 1.13 0.22 1.09 0.19 1.09 0.14 Zapotec America 1.04 0.21 1.01 0.18 1.02 0.14 Algonquin America 1.05 0.32 1.00 0.23 1.03 0.19 Chipewyan America 0.96 0.23 0.94 0.18 0.98 0.15 Cree America 1.22 0.35 1.12 0.25 1.13 0.20 Ojibwa America 1.37 0.44 1.21 0.28 1.21 0.22 Chilote America 1.07 0.36 1.01 0.25 1.04 0.19 Guarani America 1.06 0.21 1.03 0.17 1.04 0.14 Inga America 1.04 0.22 1.02 0.19 1.03 0.15 Karitiana America 1.22 0.30 1.15 0.23 1.12 0.15 Piapoco America 1.28 0.48 1.18 0.33 1.16 0.24 Quechua America 1.18 0.22 1.12 0.18 1.13 0.15 Surui America 0.75 0.21 0.77 0.18 0.83 0.14 Ticuna America 1.11 0.26 1.07 0.22 1.09 0.21 Kalmyk Central Asia 0.87 0.18 0.87 0.15 0.91 0.13 Kyrgyz Central Asia 0.97 0.27 0.94 0.20 0.98 0.18 Turkmen Central Asia 1.52 0.74 1.22 0.32 1.31 0.38 Uzbek Central Asia 0.98 0.21 0.95 0.16 0.99 0.15 Tubalar Siberia 0.96 0.23 0.93 0.17 0.97 0.15 Ulchi Siberia 0.86 0.18 0.87 0.15 0.90 0.13

27
Altaian Siberia 0.93 0.20 0.92 0.16 0.95 0.14 Chukchi Siberia 0.80 0.14 0.81 0.13 0.85 0.11 Dolgan Siberia 0.76 0.21 0.78 0.18 0.82 0.17 Eskimo Siberia 0.97 0.18 0.95 0.15 0.98 0.14 Even Siberia 1.08 0.30 1.02 0.22 1.05 0.19 Itelmen Siberia 0.71 0.20 0.74 0.17 0.79 0.15 Koryak Siberia 0.78 0.19 0.80 0.16 0.84 0.14 Mansi Siberia 1.05 0.23 1.01 0.18 1.03 0.16 Nganasan Siberia 0.95 0.21 0.94 0.17 0.96 0.16 Selkup Siberia 1.27 0.38 1.15 0.26 1.17 0.22 Tlingit Siberia 1.16 0.33 1.08 0.23 1.12 0.25 Tuvinian Siberia 1.07 0.23 1.03 0.18 1.05 0.16 Yakut Siberia 0.99 0.23 0.96 0.18 0.99 0.16 Yukagir Siberia 0.83 0.16 0.84 0.14 0.88 0.12 Xibo East Asia 0.85 0.21 0.85 0.17 0.90 0.14 Cambodian East Asia 0.82 0.24 0.83 0.19 0.89 0.14 Dai East Asia 0.98 0.26 0.95 0.21 0.99 0.16 Daur East Asia 0.99 0.24 0.96 0.19 0.99 0.15 Han East Asia 0.90 0.23 0.90 0.19 0.94 0.14 Han_NChina East Asia 0.79 0.19 0.81 0.16 0.86 0.13 Hezhen East Asia 0.93 0.29 0.92 0.22 0.96 0.17 Japanese East Asia 0.87 0.26 0.87 0.20 0.93 0.15 Kinh East Asia 0.92 0.22 0.91 0.18 0.95 0.14 Korean East Asia 0.90 0.24 0.89 0.19 0.93 0.16 Lahu East Asia 1.11 0.29 1.06 0.22 1.08 0.19 Miao East Asia 0.84 0.19 0.85 0.16 0.89 0.13 Mongola Siberia 1.03 0.33 0.99 0.24 1.02 0.19 Naxi East Asia 1.20 0.42 1.11 0.29 1.11 0.21 Oroqen East Asia 0.76 0.19 0.79 0.16 0.83 0.14 She East Asia 0.86 0.24 0.87 0.20 0.92 0.15 Thai East Asia 0.88 0.20 0.88 0.17 0.91 0.14 Tu East Asia 1.06 0.31 1.01 0.22 1.03 0.17 Tujia East Asia 0.86 0.17 0.87 0.15 0.91 0.12 Yi East Asia 0.97 0.21 0.95 0.17 0.98 0.14 Ami East Asia 0.85 0.21 0.86 0.18 0.90 0.14 Atayal East Asia 0.80 0.22 0.82 0.18 0.87 0.15 Borneo East Asia 0.91 0.20 0.91 0.17 0.94 0.14 Mamanwa East Asia 1.28 0.11 1.25 0.10 1.24 0.09 Semende East Asia 0.87 0.16 0.87 0.14 0.90 0.12 Australian Oceania 1.36 0.09 1.34 0.08 1.34 0.08 Bougainville Oceania 1.30 0.08 1.28 0.08 1.29 0.08 Choiseul Oceania 1.40 0.11 1.37 0.10 1.38 0.10 Gela Oceania 1.28 0.10 1.25 0.09 1.25 0.09 Isabel Oceania 1.31 0.11 1.28 0.11 1.28 0.10
28
Kolombangara Oceania 1.26 0.09 1.24 0.09 1.24 0.08 Makira Oceania 1.29 0.09 1.27 0.09 1.27 0.08 Malaita Oceania 1.25 0.09 1.23 0.09 1.23 0.08 New_Guinea Oceania 1.37 0.09 1.35 0.08 1.35 0.08 Ontong_Java Oceania 1.27 0.14 1.23 0.12 1.24 0.12 Papuan Oceania 1.37 0.09 1.35 0.08 1.35 0.08 Ranongga Oceania 1.34 0.11 1.31 0.10 1.32 0.10 RenBel Oceania 1.10 0.13 1.07 0.11 1.08 0.10 Russell Oceania 1.30 0.11 1.27 0.10 1.28 0.10 Santa_Cruz Oceania 1.31 0.08 1.29 0.07 1.30 0.08 Savo Oceania 1.26 0.09 1.24 0.08 1.25 0.08 Tikopia Oceania 1.29 0.16 1.25 0.14 1.24 0.12 Tongan Oceania 1.06 0.13 1.04 0.12 1.05 0.10 Vella_Lavella Oceania 1.27 0.09 1.25 0.08 1.26 0.08 Hazara South Asia 1.23 0.48 1.09 0.27 1.13 0.25 Kharia South Asia 1.34 0.35 1.23 0.24 1.22 0.19 Kusunda South Asia 1.05 0.23 1.01 0.18 1.04 0.17 Mala South Asia 1.25 0.43 1.12 0.26 1.14 0.22 Onge South Asia 0.83 0.21 0.84 0.17 0.88 0.15 Vishwabrahmin South Asia 1.43 0.48 1.24 0.28 1.24 0.22
Note: We computed 𝑅!(𝑋) as the ratio of 𝑓!(𝐴𝐹,𝐷𝑒𝑛𝑖𝑠𝑜𝑣𝑎𝑛;𝑊𝐸,𝑋) and 𝑓!(𝐴𝐹,𝑁𝑒𝑎𝑛𝑑𝑒𝑟𝑡ℎ𝑎𝑙;𝑊𝐸,𝑋) for 1 each EE/NA which show significant signals of admixture with archaic hominins in formal tests (Table S3). We 2 repeated the computation using different pairs of AF-WE reference populations. Weighted Block Jackknife (block 3 size of 5 cM) was used to estimate the standard error. 4 5