Embed Size (px)
Citation preview
Supporting InformationWu et al. 10.1073/pnas.1207327109SI Materials and MethodsMice, Infection, and Plaque Assays. Six- to eight-week-old C57BL/6mice were purchased from The Jackson Laboratory. Thy1.1+ orThy1.1− CD45.1+ P14 TCR transgenic mice were on the C57BL/6 background and maintained in the laboratory as describedpreviously (1). Dicer flox/flox and miR-17-92 flox/flox mutant micewere purchased from The Jackson Laboratory (2, 3). GzB-cretransgenic mice were a kind gift from Joshy Jacob (Emory VaccineCenter). CD4-cre transgenic mice were purchased from Taconic(4). For acute infection, mice were i.p. injected with 2 × 10⁵ pfuof LCMV Arm. Plaque assays were used to determine viral titers(5). All animal experiments were approved by the InstitutionalAnimal Care and Use Committee of Emory University.
In Vitro T-Cell Stimulation. Splenic T cells were purified by MACSmagnetic beads (Miltenyi Biotec), labeled with carboxy-fluorescein succinimidyl ester (CFSE), plated at 105 cells per wellin the 96-well plate, and stimulated with plate-bound anti-CD3and soluble anti-CD28 (BD Biosciences).
Lymphocyte Isolation and Flow Cytometry. Splenocytes and pe-ripheral blood mononuclear cells (PBMC) were isolated as de-scribed previously (6). MHC class I tetramer and intracellularcytokine staining were performed as previously described (5).Live cells were determined by LIVE/DEAD Fixable Near-IRDead Cell Stain Kit (Invitrogen). For phospho-S6 staining,splenocytes were fixed with BD Lyse/Fix Buffer (BD Bio-sciences) immediately after isolation, permeabilized with BDPhosflow Perm/Wash Buffer I (BD Biosciences), and stainedwith anti–phospho-S6 antibody (Cell Signaling Technology).Samples were analyzed on a BD FACSCanto II flow cytometer(BD Biosciences).
Retroviral Transduction. The MSCV-Puro-IRES-GFP (MSCV-PIG) empty vector and MSCV-PIG with miR-17-92 (7) were giftsfrom Andrea Ventura (Memorial Sloan-Kettering Cancer Cen-ter, New York, NY). For transduction with MSCV-PIG, Thy1.1+
P14 mice were i.v. injected with 2 × 10⁶ pfu of lymphocytic cho-riomeningitis virus (LCMV) Armstrong strain (Arm). CD8+
T cells were purified from P14 splenocytes at 24 h postinfection(p.i.), and infected by retrovirus packaged with either MSCV-PIG or MSCV-PIG inserted with miR-17-92. The cells were thencultured with IL-2 for 2–3 d and sorted for GFP+ T cells. Then,2 × 104 GFP+ T cells were transferred to each C57BL/6 re-cipient. The MSCV-IRES-Thy1.1 (MIT) plasmid (17442;Addgene) was kindly provided by Anjana Rao (La Jolla Institutefor Allergy and Immunology, La Jolla, CA) (8). A genomicfragment containing miR-17-92 was cloned as previously de-scribed (9) and inserted into the MIT vector. Transduction with
the MIT vector was performed by first infecting CD45.1+
Thy1.1− P14 mice i.v. with 2 × 10⁶ pfu of LCMV Arm. Spleno-cytes were collected 24 h later, infected with retrovirus pack-aged with MIT or miR-17-92-MIT vector, and immediatelytransferred into C57BL/6 recipients at 105 P14 CD8+ T cellsper mouse.
In Vivo BrdU Incorporation. Mice were injected with 1 mg of BrdUsolution i.p. on day 6 p.i. or day 7 p.i. and killed 4 h (as in Fig. S2A)or 6 h (as in Fig. 3B) later. The BrdU staining was performedwith BrdU Flow Kit (BD Biosciences).
RNA Isolation, Microarray Analysis, and Quantitative RT-PCR (QRT-PCR). For the microRNA (miRNA) microarray, each mousewas transferred with 104 P14 CD8+ T cells and infected i.p. withLCMV Arm. Day 5 p.i., day 8 p.i., or memory (day 60–70 p.i.)P14 CD8+ T cells were sorted on the basis of the expression ofThy1.1 congenic marker. Naïve P14 CD8+ T cells were directlysorted from naïve P14 mice. Total RNA including the smallRNA fraction was isolated with miRNeasy kit (Qiagen), thenlabeled and hybridized to Mouse miRNA Microarray (AgilentTechnologies). The data analysis was performed with Gene-Spring GX 11.5 (Agilent Technologies) according to the manu-facturer’s manual. The raw data were normalized by 90th-percentile shift, baseline-transformed, and filtered on the basis offlag. For the mRNA microarray, retroviral transduction with themiR-17-92-MIT vector was performed as described above.Splenocytes were collected on day 8 p.i. Transduced (CD45.1+
CD8+ Thy1.1+) and nontransduced (CD45.1+ CD8+ Thy1.1−)P14 cells were sorted on the basis of the surface markers. RNAwas isolated with RNeasy kit (Qiagen), labeled, and hybridizedto mouse 430.2 microarray (Affymetrix). Data analysis wasperformed with GenePattern (Broad Institute). The raw datawere normalized by the robust multichip averaging method.Gene-set enrichment analysis (GSEA) was performed as pre-viously described (10). The microarray data of CD127high
memory precursors and CD127low terminal effectors were ob-tained from a previous study (11), the Gene Expression Omnibus(GEO) accession no. of which is GSE8678. The genes up-regu-lated by greater than or equal to twofold (P < 0.05) in theCD127high or CD127low effectors relative to CD127low orCD127high effectors were selected into the gene set represent-ing the gene signature of the CD127high or CD127low effectors.miRNA QRT-PCR was performed with TaqMan MicroRNAReverse Transcription Kit, TaqMan MicroRNA Assays, andTaqMan Universal PCR Master Mix (Applied Biosystems) ac-cording to the manufacturer’s instructions.
Statistical Analysis. All data analysis was performed with Prism 5.
1. Kaech SM, et al. (2003) Selective expression of the interleukin 7 receptor identifieseffector CD8 T cells that give rise to long-lived memory cells. Nat Immunol 4:1191–1198.
2. Ventura A, et al. (2008) Targeted deletion reveals essential and overlapping functionsof the miR-17 through 92 family of miRNA clusters. Cell 132:875–886.
3. Harfe BD, McManus MT, Mansfield JH, Hornstein E, Tabin CJ (2005) The RNaseIIIenzyme Dicer is required for morphogenesis but not patterning of the vertebratelimb. Proc Natl Acad Sci USA 102:10898–10903.
4. Lee PP, et al. (2001) A critical role for Dnmt1 and DNA methylation in T celldevelopment, function, and survival. Immunity 15:763–774.
5. Wherry EJ, et al. (2003) Lineage relationship and protective immunity of memory CD8T cell subsets. Nat Immunol 4:225–234.
6. Masopust D, Vezys V, Marzo AL, Lefrançois L (2001) Preferential localization ofeffector memory cells in nonlymphoid tissue. Science 291:2413–2417.
7. Mu P, et al. (2009) Genetic dissection of the miR-17∼92 cluster of microRNAs in Myc-induced B-cell lymphomas. Genes Dev 23:2806–2811.
8. Wu Y, et al. (2006) FOXP3 controls regulatory T cell function through cooperationwith NFAT. Cell 126:375–387.
9. Lu Y, Thomson JM, Wong HY, Hammond SM, Hogan BL (2007) Transgenic over-expression of the microRNA miR-17-92 cluster promotes proliferation and inhibitsdifferentiation of lung epithelial progenitor cells. Dev Biol 310:442–453.
10. Subramanian A, et al. (2005) Gene set enrichment analysis: A knowledge-basedapproach for interpreting genome-wide expression profiles. Proc Natl Acad Sci USA102:15545–15550.
11. Joshi NS, et al. (2007) Inflammation directs memory precursor and short-lived effectorCD8+ T cell fates via the graded expression of T-bet transcription factor. Immunity 27:281–295.
Wu et al. www.pnas.org/cgi/content/short/1207327109 1 of 8
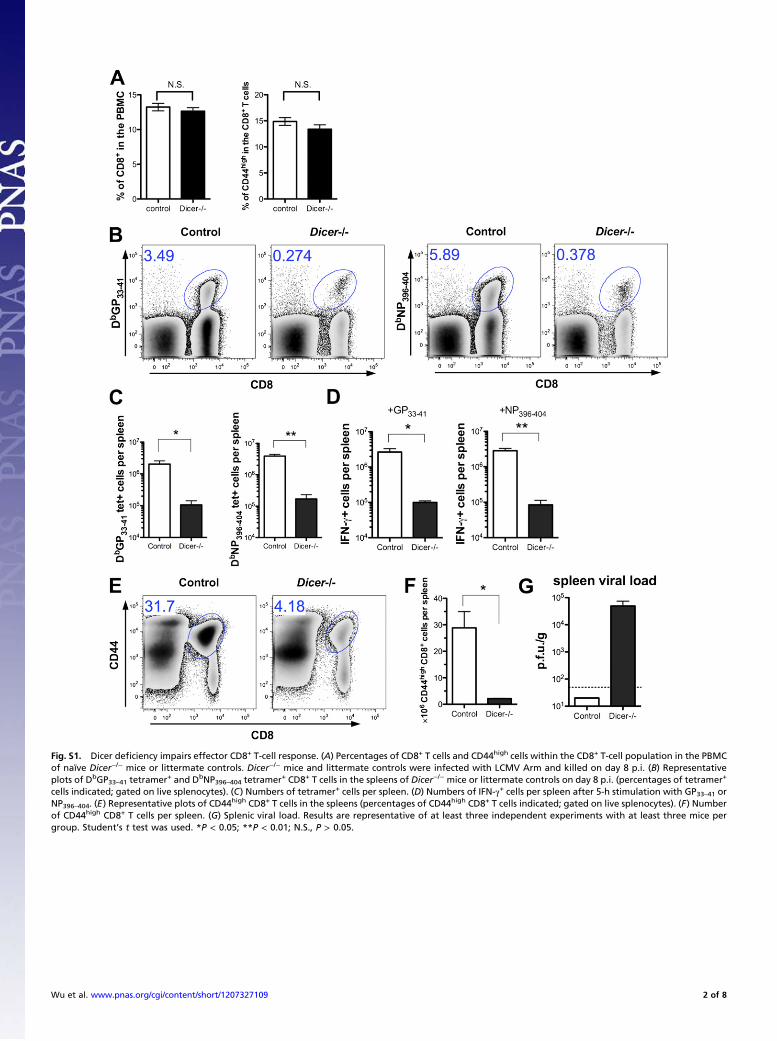
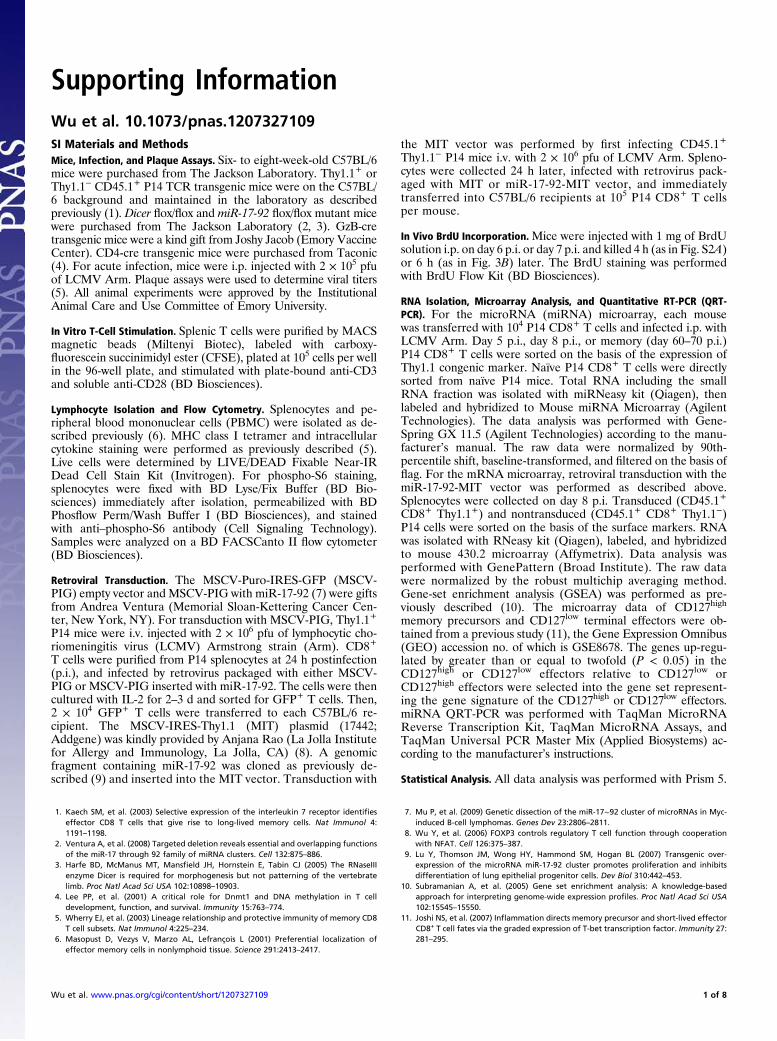
Fig. S1. Dicer deficiency impairs effector CD8+ T-cell response. (A) Percentages of CD8+ T cells and CD44high cells within the CD8+ T-cell population in the PBMCof naïve Dicer−/− mice or littermate controls. Dicer−/− mice and littermate controls were infected with LCMV Arm and killed on day 8 p.i. (B) Representativeplots of DbGP33–41 tetramer+ and DbNP396–404 tetramer+ CD8+ T cells in the spleens of Dicer−/− mice or littermate controls on day 8 p.i. (percentages of tetramer+
cells indicated; gated on live splenocytes). (C) Numbers of tetramer+ cells per spleen. (D) Numbers of IFN-γ+ cells per spleen after 5-h stimulation with GP33–41 orNP396–404. (E) Representative plots of CD44high CD8+ T cells in the spleens (percentages of CD44high CD8+ T cells indicated; gated on live splenocytes). (F) Numberof CD44high CD8+ T cells per spleen. (G) Splenic viral load. Results are representative of at least three independent experiments with at least three mice pergroup. Student’s t test was used. *P < 0.05; **P < 0.01; N.S., P > 0.05.
Wu et al. www.pnas.org/cgi/content/short/1207327109 2 of 8
Fig. S2. miRNAs up-regulated in day 5 effectors relative to naïve P14 CD8+ T cells. (A) Mice were transferred with 104 P14 CD8+ T cells and infected with LCMVArm. On day 5 or day 8 p.i., the mice were injected with 1 mg of BrdU i.p. and killed 4 h later. For each time point, the frequency of P14 CD8+ T cells (Thy1.1+) isshown in Upper (percentage of P14 cells indicated; gated on live splenocytes) and histograms of BrdU staining in P14 cells (line) and CD44low naïve CD8+ T cells(shaded) are shown in Lower (percentages of BrdU+ P14 cells indicated). (B) Unsupervised hierarchical clustering of naïve, day 5 p.i., day 8 p.i., and memory P14CD8+ T cells with the miRNAs present in all of the samples from at least one of the four populations. Colors represent the fold change in expression comparedwith the mean of all samples for each probe. (C) Heat map of the expression at all time points of the miRNAs that were up-regulated more than twofold (P <0.05) in day 5 effector P14 CD8+ T cells relative to naïve P14 cells. Those miRNAs belonging to the miR-17-92, miR-106a-363, or miR-106b-25 clusters are in bold.
Wu et al. www.pnas.org/cgi/content/short/1207327109 3 of 8
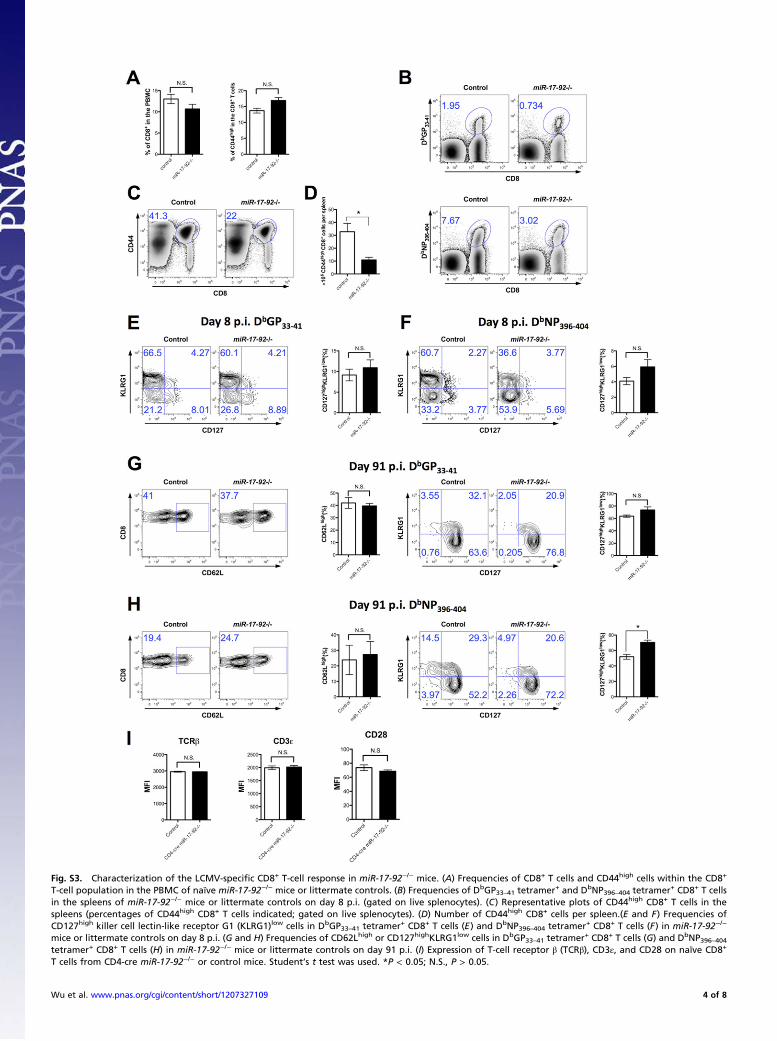
Fig. S3. Characterization of the LCMV-specific CD8+ T-cell response in miR-17-92−/− mice. (A) Frequencies of CD8+ T cells and CD44high cells within the CD8+
T-cell population in the PBMC of naïve miR-17-92−/− mice or littermate controls. (B) Frequencies of DbGP33–41 tetramer+ and DbNP396–404 tetramer+ CD8+ T cellsin the spleens of miR-17-92−/− mice or littermate controls on day 8 p.i. (gated on live splenocytes). (C) Representative plots of CD44high CD8+ T cells in thespleens (percentages of CD44high CD8+ T cells indicated; gated on live splenocytes). (D) Number of CD44high CD8+ cells per spleen.(E and F) Frequencies ofCD127high killer cell lectin-like receptor G1 (KLRG1)low cells in DbGP33–41 tetramer+ CD8+ T cells (E) and DbNP396–404 tetramer+ CD8+ T cells (F) in miR-17-92−/−
mice or littermate controls on day 8 p.i. (G and H) Frequencies of CD62Lhigh or CD127highKLRG1low cells in DbGP33–41 tetramer+ CD8+ T cells (G) and DbNP396–404tetramer+ CD8+ T cells (H) in miR-17-92−/− mice or littermate controls on day 91 p.i. (I) Expression of T-cell receptor β (TCRβ), CD3ε, and CD28 on naïve CD8+
T cells from CD4-cre miR-17-92−/− or control mice. Student’s t test was used. *P < 0.05; N.S., P > 0.05.
Wu et al. www.pnas.org/cgi/content/short/1207327109 4 of 8
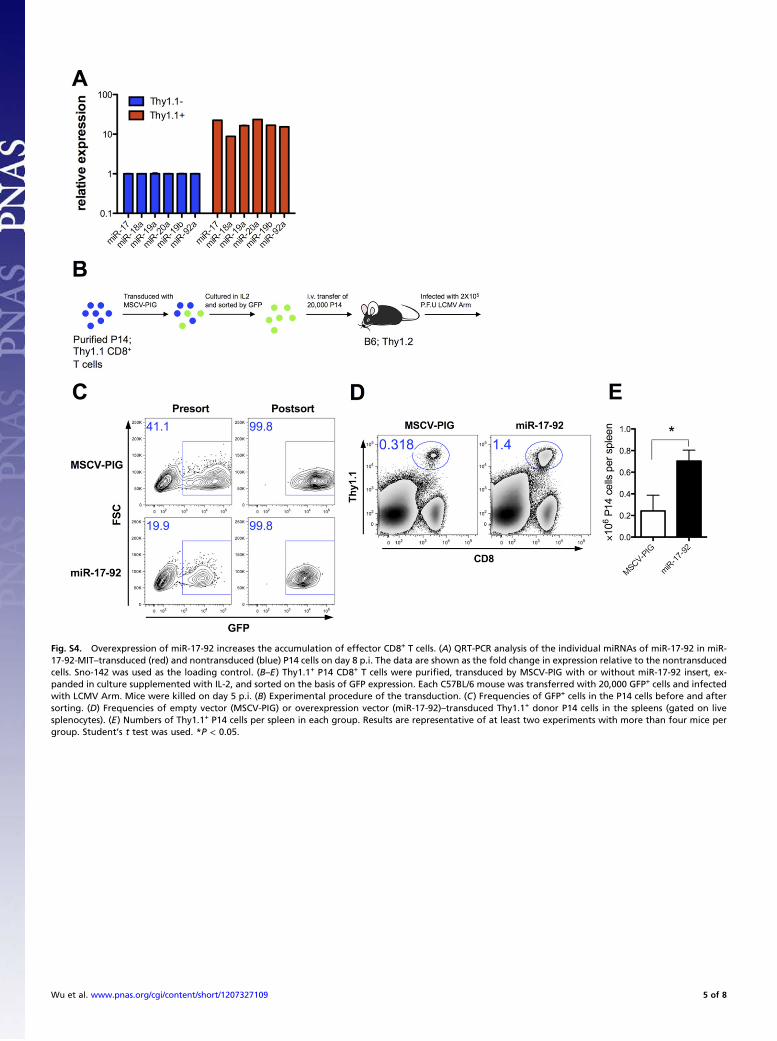
Fig. S4. Overexpression of miR-17-92 increases the accumulation of effector CD8+ T cells. (A) QRT-PCR analysis of the individual miRNAs of miR-17-92 in miR-17-92-MIT–transduced (red) and nontransduced (blue) P14 cells on day 8 p.i. The data are shown as the fold change in expression relative to the nontransducedcells. Sno-142 was used as the loading control. (B–E) Thy1.1+ P14 CD8+ T cells were purified, transduced by MSCV-PIG with or without miR-17-92 insert, ex-panded in culture supplemented with IL-2, and sorted on the basis of GFP expression. Each C57BL/6 mouse was transferred with 20,000 GFP+ cells and infectedwith LCMV Arm. Mice were killed on day 5 p.i. (B) Experimental procedure of the transduction. (C) Frequencies of GFP+ cells in the P14 cells before and aftersorting. (D) Frequencies of empty vector (MSCV-PIG) or overexpression vector (miR-17-92)–transduced Thy1.1+ donor P14 cells in the spleens (gated on livesplenocytes). (E) Numbers of Thy1.1+ P14 cells per spleen in each group. Results are representative of at least two experiments with more than four mice pergroup. Student’s t test was used. *P < 0.05.
Wu et al. www.pnas.org/cgi/content/short/1207327109 5 of 8
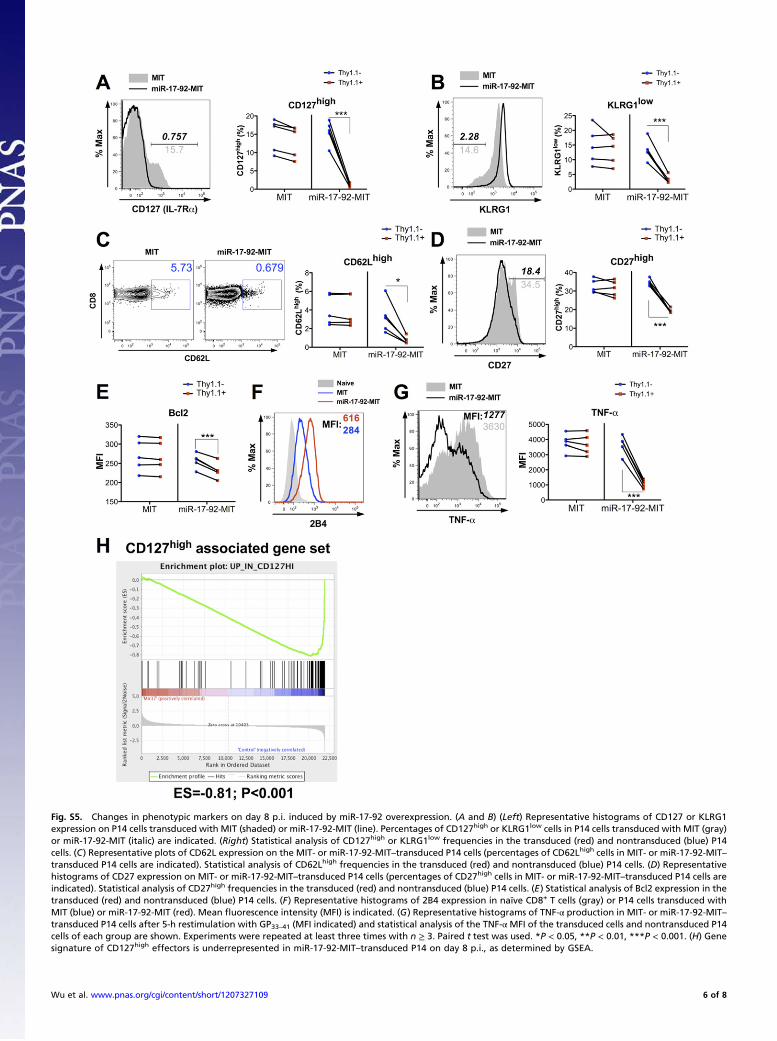
Fig. S5. Changes in phenotypic markers on day 8 p.i. induced by miR-17-92 overexpression. (A and B) (Left) Representative histograms of CD127 or KLRG1expression on P14 cells transduced with MIT (shaded) or miR-17-92-MIT (line). Percentages of CD127high or KLRG1low cells in P14 cells transduced with MIT (gray)or miR-17-92-MIT (italic) are indicated. (Right) Statistical analysis of CD127high or KLRG1low frequencies in the transduced (red) and nontransduced (blue) P14cells. (C) Representative plots of CD62L expression on the MIT- or miR-17-92-MIT–transduced P14 cells (percentages of CD62Lhigh cells in MIT- or miR-17-92-MIT–transduced P14 cells are indicated). Statistical analysis of CD62Lhigh frequencies in the transduced (red) and nontransduced (blue) P14 cells. (D) Representativehistograms of CD27 expression on MIT- or miR-17-92-MIT–transduced P14 cells (percentages of CD27high cells in MIT- or miR-17-92-MIT–transduced P14 cells areindicated). Statistical analysis of CD27high frequencies in the transduced (red) and nontransduced (blue) P14 cells. (E) Statistical analysis of Bcl2 expression in thetransduced (red) and nontransduced (blue) P14 cells. (F) Representative histograms of 2B4 expression in naïve CD8+ T cells (gray) or P14 cells transduced withMIT (blue) or miR-17-92-MIT (red). Mean fluorescence intensity (MFI) is indicated. (G) Representative histograms of TNF-α production in MIT- or miR-17-92-MIT–transduced P14 cells after 5-h restimulation with GP33–41 (MFI indicated) and statistical analysis of the TNF-αMFI of the transduced cells and nontransduced P14cells of each group are shown. Experiments were repeated at least three times with n ≥ 3. Paired t test was used. *P < 0.05, **P < 0.01, ***P < 0.001. (H) Genesignature of CD127high effectors is underrepresented in miR-17-92-MIT–transduced P14 on day 8 p.i., as determined by GSEA.
Wu et al. www.pnas.org/cgi/content/short/1207327109 6 of 8
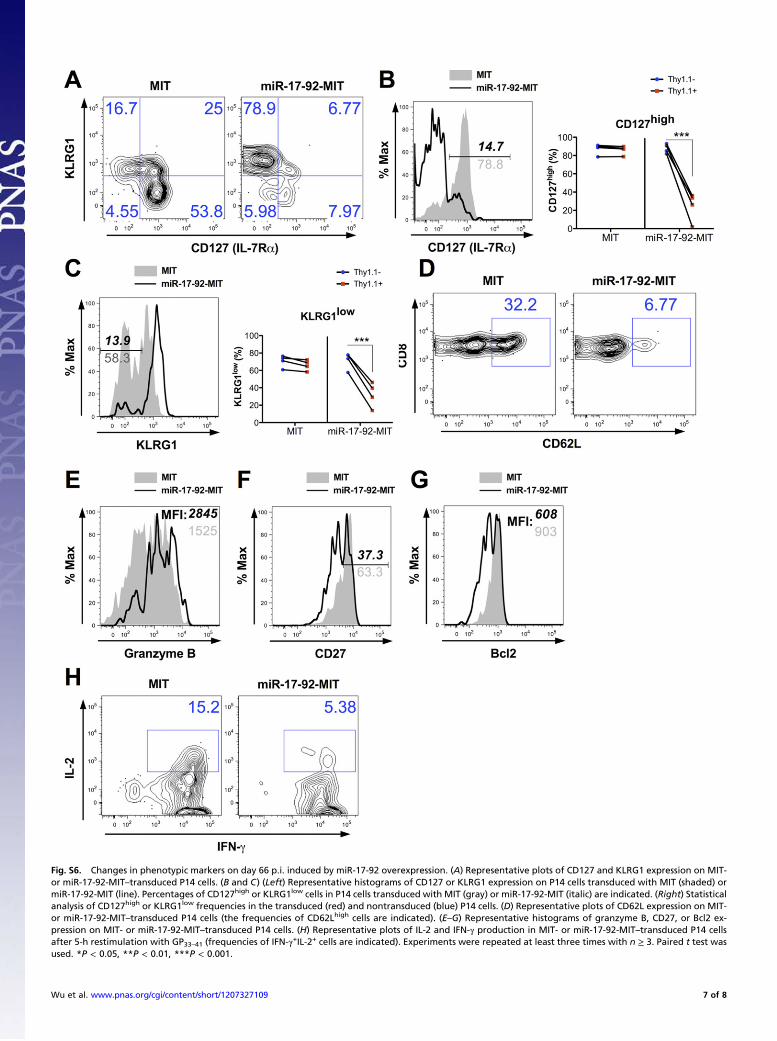
Fig. S6. Changes in phenotypic markers on day 66 p.i. induced by miR-17-92 overexpression. (A) Representative plots of CD127 and KLRG1 expression on MIT-or miR-17-92-MIT–transduced P14 cells. (B and C) (Left) Representative histograms of CD127 or KLRG1 expression on P14 cells transduced with MIT (shaded) ormiR-17-92-MIT (line). Percentages of CD127high or KLRG1low cells in P14 cells transduced with MIT (gray) or miR-17-92-MIT (italic) are indicated. (Right) Statisticalanalysis of CD127high or KLRG1low frequencies in the transduced (red) and nontransduced (blue) P14 cells. (D) Representative plots of CD62L expression on MIT-or miR-17-92-MIT–transduced P14 cells (the frequencies of CD62Lhigh cells are indicated). (E–G) Representative histograms of granzyme B, CD27, or Bcl2 ex-pression on MIT- or miR-17-92-MIT–transduced P14 cells. (H) Representative plots of IL-2 and IFN-γ production in MIT- or miR-17-92-MIT–transduced P14 cellsafter 5-h restimulation with GP33–41 (frequencies of IFN-γ+IL-2+ cells are indicated). Experiments were repeated at least three times with n ≥ 3. Paired t test wasused. *P < 0.05, **P < 0.01, ***P < 0.001.
Wu et al. www.pnas.org/cgi/content/short/1207327109 7 of 8
Dataset S1. The list of miRNAs in the Agilent miRNA microarray that were identified as differentially expressed within the four timepoints (naïve, day 5 p.i., day 8 p.i., and memory) by one-way ANOVA
Dataset S1
Dataset S2. The list of genes in the Affymetrix mouse 430 microarray that were differentially expressed in the miR-17-92-MIT–transducedvs. nontransduced P14 cells by ≥1.5-fold (P < 0.05) identified by Student’s t test
Dataset S2
Wu et al. www.pnas.org/cgi/content/short/1207327109 8 of 8