Embed Size (px)
Citation preview
SUPPORTING INFORMATION (SI)
Hexagonal Ice Stability and Growth in the presence of Glyoxal and Secondary Organic
Aerosols
Vangelis Daskalakis* and Marios Hadjicharalambous
Cyprus University of Technology, Department of Environmental Science and Technology, P.O. Box 50329, 3603 Limassol – Cyprus.
*Corresponding Author: Vangelis Daskalakis
Tel: +357 25002458, Fax. +357 25002820. E-mail: [email protected]
Contents
1. Force Field parameters for the organics (glyoxal, glyoxal hydrates and dimer, as well as
the oxalic acid)
2. Evaluation of the adopted Force Fields
3. Superheating at the target temperature of 320K
4. Selection process for the supercooling initial conformations
5. Partial growth of ice crystals in the multi-compound systems in the presence of CO2
KEYWORDS: Ice 1h, atmospheric physics, glyoxal, secondary organic aerosol, superheating,
supercooling, total dipole moment.
S1
Electronic Supplementary Material (ESI) for Physical Chemistry Chemical Physics.This journal is © the Owner Societies 2014
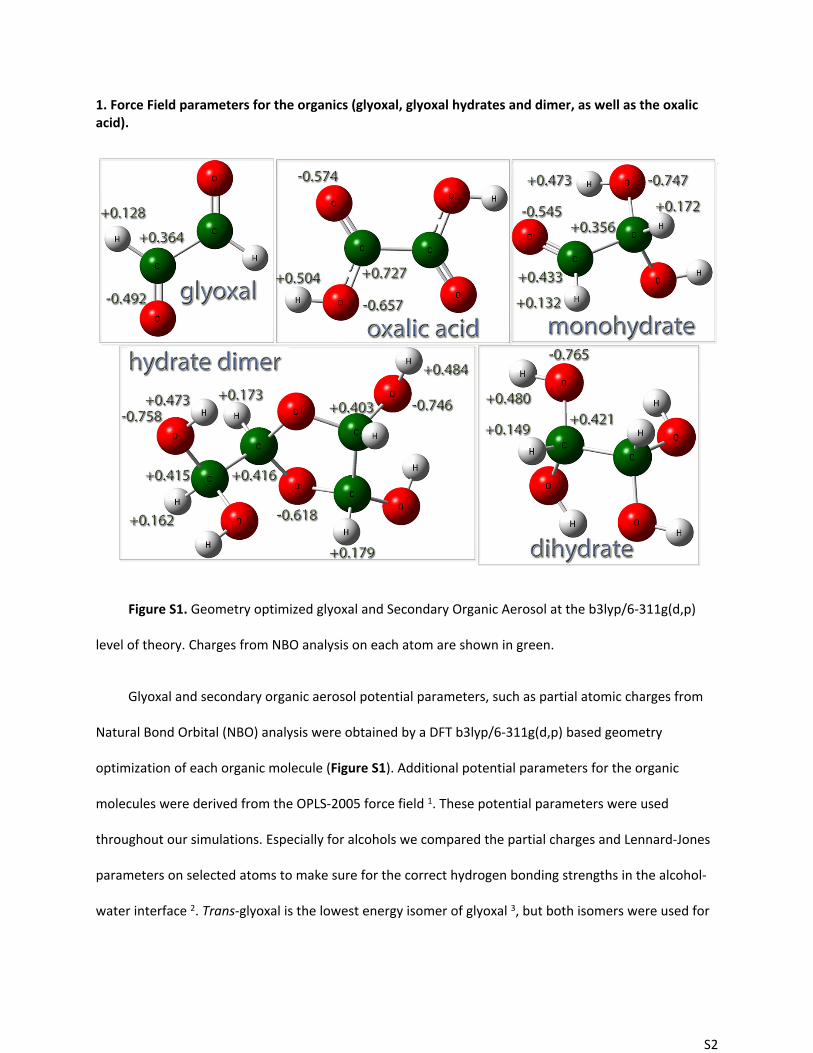
1. Force Field parameters for the organics (glyoxal, glyoxal hydrates and dimer, as well as the oxalic acid).
Figure S1. Geometry optimized glyoxal and Secondary Organic Aerosol at the b3lyp/6-311g(d,p)
level of theory. Charges from NBO analysis on each atom are shown in green.
Glyoxal and secondary organic aerosol potential parameters, such as partial atomic charges from
Natural Bond Orbital (NBO) analysis were obtained by a DFT b3lyp/6-311g(d,p) based geometry
optimization of each organic molecule (Figure S1). Additional potential parameters for the organic
molecules were derived from the OPLS-2005 force field 1. These potential parameters were used
throughout our simulations. Especially for alcohols we compared the partial charges and Lennard-Jones
parameters on selected atoms to make sure for the correct hydrogen bonding strengths in the alcohol-
water interface 2. Trans-glyoxal is the lowest energy isomer of glyoxal 3, but both isomers were used for
S2

our Molecular Dynamics (MD) models as initial input structures. During the MD simulations we have
observed trans to cis-glyoxal and vice-versa transitions.
2. Evaluation of the adopted Force Fields.
The NE6 4 potential for the water molecules was implemented. The six-site water potential NE6
succeeds in predicting the nucleation process at conditions close to experimental reality 5-6. NE6
predicted melting point at 289K was calculated in a recent study using a combination of a Gibbs-Duhem
integration and free energy calculations, and determined by a direct coexistence of ice and liquid 7.
Adsorbates FEP Free Energies of Solvation [this study] DFT/ x3lyp 12
Glyoxal -5.34±0.08 -4.14
Monohydrate -11.56±0.17 -10.56
Dihydrate -16.83±0.16 -15.34
Hydrate Dimer -19.51±0.20 -18.63
Table S1. Free Energies of Solvatioon for glyoxal and secondary organic aerosol in kcal/mol.
Methods for calculating relative free energies (ΔF) or energies of solvation using free energy
perturbation (FEP) 8 involve “annihilation”, in which a selected molecule is removed from the system 9.
FEP calculations were performed using Desmond 2013.1 software. For the free energies of solvation of
the organics in water, the protocol included solvation in a box of SPC 10 water molecules with a buffer
distance of at least 12Å. The system went through a relaxation process that included two minimizations
followed by 4 short NVT/ NpT molecular dynamics simulations. The production simulation (NpT, T=298K,
P=1 atm) was run for 2 ns for each lambda window, and 12 windows were used for each perturbation,
S3

involving “annihilation” of the organic molecule. Results were collected and analyzed based on the
Bennett acceptance ratio method 11. The absolute solvation energy per molecule is derived for the
different organics at 298K. The results are shown on Table S1. Custom NBO charges from the DFT
geometry optimization results were used for the organics. The free energies of solvation are consistent
with the DFT derived energies at the x3lyp level of theory, as well as experimental observations 12 even
with the SPC potential for water. For the oxalic acid, in MD simulations we do not consider the
dissociation of the acid, hence the absolute free energy of solvation from FEP calculations cannot be
directly associated with the x3lyp or experimental values in the literature 12.
Figure S2. Superheating at 296K for the I4-M1,
I4-M2 and I4-M3 multi-compound aerosols.
Diverse charges have been used for the
organics (NBO, Mulliken and native OPLS-
2005). A cut-off distance at 1.1 nm is used for
all except the solid lines for which the cut-off
distance is set to 0.65nm.
Additional superheating dynamics were performed for the I4-47.0 nm3 ice 1h crystal in contact with
OM phases of organic mixtures (glyoxal, monohydrate, hydrate dimer, dihydrate and oxalic acid) in the
different -M1 (2.3%), -M2 (3.0%) and -M3 (3.2%) enrichments. Organic charges were customized
according to Mulliken and NBO based values at the b3lyp/6-311g(d,p) level (this study), NBO charges at
the same level of theory with the Polarizable Continuum Model (PCM) implicit solvation, as well as the
native OPLS-2005 charges. The cut-off distance for the non-bonded interactions was set at 1.1 nm. The
results for the superheating dynamics at the target temperature of 296K converge (Figure S2), as all
these sets of charges, even with different absolute values, reflect qualitatively the correct polarization of
S4

each organic molecule (total dipole moment of the OM respective phase), as well as the hydrogen
bonding interactions, both being important for solvent-solute interactions.
3. Superheating at the target temperature of 320K
Figure S3. Density change profiles of the I1-
41.0, I2-51.2 nm3 and I3-61.6 nm3 ice 1h crystals
at 7.6-10.8% w/w average enrichments in
glyoxal and its secondary organic aerosol
(SOA). The density profiles are averaged over
all enrichments for each binary sample.
On Figure S3 we depict the superheating dynamics of all the binary systems treated at this study,
at the target temperature of 320K, in terms of density changes. These density time series evidence the
collapse (melting) of the ice 1h crystals for every binary system. We can observe that all the trajectories
of the enriched crystals led to melting, exerting a density increase trend. For each binary mixture or pure
ice 1h crystals we have averaged 60 trajectories of the different ice 1h crystal volumes (I1-41.0, I2-51.2
and I3-61.6 nm3) and subsequently smoothed the curves. This is done as the density versus time plots
for these 60 trajectories per binary system do not differ much, exhibiting almost the same profile. The
glyoxal monohydrate enrichments start melting earlier than any other probed at the target temperature
of 320K, as it is the case also for 296K (see main manuscript for discussion). Both pure ice 1h density
change profiles (solid and dashed blue lines) converge to a final density of 0.95 gr/ml, even if the solid
line is associated with the 80% of the trajectories leading to crystal collapse. Although the same final
S5

density, visual observation of the phase transition trajectories, showed many ice nuclei still present in
these trajectories, while their spatial distribution evidences a highly amorphous instead of crystalline ice
phase. It is due to this behavior that a less pronounced density change profile is observed for the latter
pure ice melting trajectories. We have to note that this is a unique behavior only for the pure ice
samples and it is not observed for the OM enriched samples at this extend, where the density transition
from solid to liquid is more pronounced, as it was also found by visual probing.
4. Selection process for the supercooling initial conformations
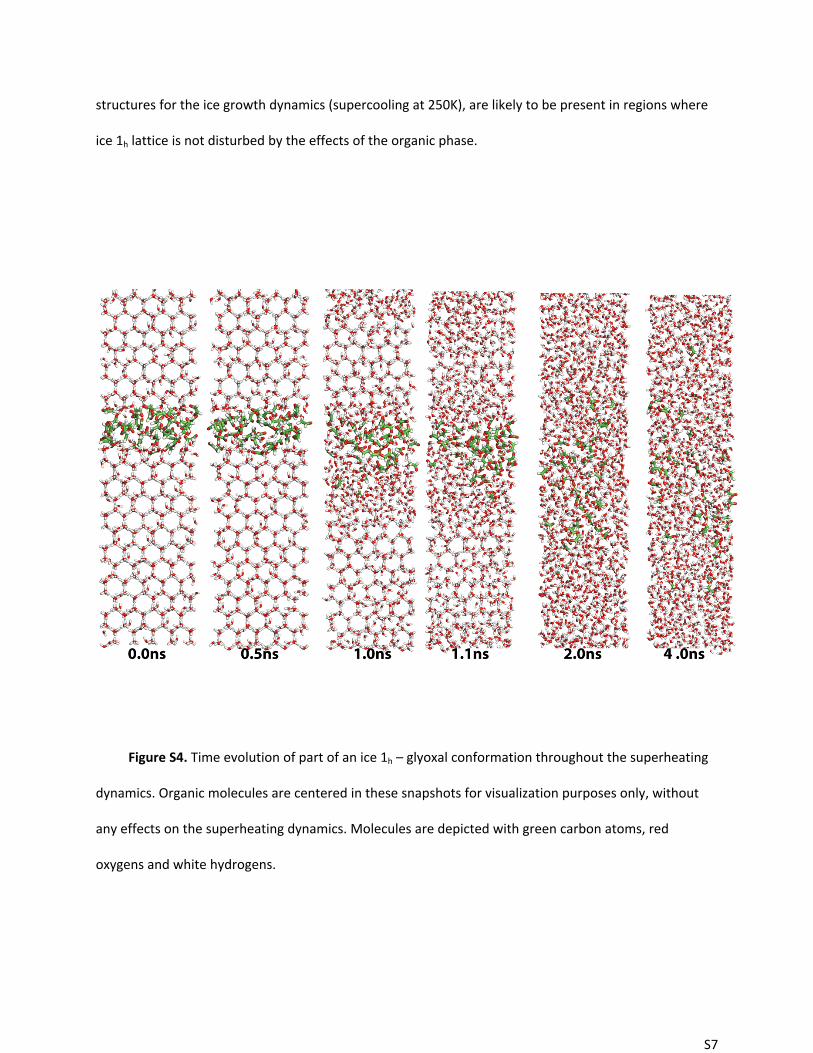
Several snapshots from a superheating run of the ice-glyoxal binary sample are shown on Figure
S4. We should note though, that this figure is rather a rough illustration of the dynamics of one
trajectory and no important conclusions should be drawn. We select two conformations around the
temperature where the phase transition fully occurs in each superheating trajectory (320K). This yields
2x20=40 input conformations for the supercooling simulations per each system, similar to those of
Figure S4 at 1.1 and 2.0 ns. There is evidence that certain organic species (glyoxal monohydrate and
oxalic acid) disturb the electrostatic potential of the ice 1h even in regions further away from their
organic phase (see results on the main manuscript based on electrostatic potential maps 13 averaged
over time for each ice-OM sample). The ice 1h structure in these regions, even further away from the
organic phase, would become vulnerable to the temperature increase and start collapsing in addition to
the OM/ ice contact region. This is visible in several trajectories of the monohydrate and the oxalic acid
adsorbate phases in contact with ice crystals under the superheating dynamics (296K, 320K). It is
unlikely for those regions to contain any nucleation seeds upon superheating. On the other hand, such a
behavior is not observed for the rest of the organic species. Thus, nucleation seeds present in the initial
S6
structures for the ice growth dynamics (supercooling at 250K), are likely to be present in regions where
ice 1h lattice is not disturbed by the effects of the organic phase.
Figure S4. Time evolution of part of an ice 1h – glyoxal conformation throughout the superheating
dynamics. Organic molecules are centered in these snapshots for visualization purposes only, without
any effects on the superheating dynamics. Molecules are depicted with green carbon atoms, red
oxygens and white hydrogens.
S7

5. Partial growth of ice crystals in the multi-compound systems in the presence of CO2
Figure S5. (1) Equilibrated Ice crystal in the presence of CO2 under superheating dynamics, (2-7)
Time evolution of the multi-compound samples throughout the supercooling dynamics at 250K from a
seeded aerosol (frame 2) to 120ns (frame 7). CO2 is depicted in red, organic molecules are depicted with
green carbon atoms, red oxygens and white hydrogens, water with red oxygens and white hydrogens as
well.
S8

Figure S5 shows snapshots – configuration structures from the superheating (frame 1) and
supercooling (frames 2-7) dynamics for a multi-compound system in the presence of CO2. In the first
snapshot the structure is typical of the orientation of both OM and CO2 phases in multi-compound
systems throughout equilibration/ relaxation and the superheating dynamics; an orientation that leads
to decreased interactions between OM and water by mixing with CO2. The ice 1h structure in the upper
part of frame 1 is less ordered with the ice phase to start mixing with the OM, while on the lower part a
CO2 layer prohibits such a mixing. A CO2 nucleation (bubble) is more evident for the rest of the frames,
while the organic species are concentrated in the interface between water (ice/ liquid) and the bubble
(gas). Although this figure is rather a rough illustration of the dynamics of one trajectory and no
important conclusions should be drawn, we have to note that we clearly identify the occurrence of a CO2
gas phase in red coloring.
Bibliographic References
1. W.L. Jorgensen, D.S. Maxwell and J. Tirado-Rives. J. Am. Chem. Soc. 1996, 118, 11225-11236.2. R.D. Nutt and J.A. Stone. J. Chem. Phys., 2003, 119, 5670-5679.3. F. Bulat and A. Toro-Labbé. Chem. Phys. Lett., 2002, 354, 508-517.4. H. Nada, P.J.M. van der Eerden, Jan. J. Chem. Phys. 2003, 118, 7401-7413.5. H. Nada and Y. Furukawa. J. Cryst. Growth, 2005, 283, 242-256.6. I. Gladich, W. Pfalzgraff, O. Maršálek, P. Jungwirth, M. Roeselová and S. Neshyba. Phys. Chem.
Chem. Phys. 2011, 13, 19960-19969.7. J.L.F. Abascal, R.G. Fernández, C. Vega and M.A. Carignano. J. Chem. Phys. 2006, 125, 166101.8. R.W. Zwanzig. J. Chem. Phys., 1954, 22, 1420-1426.9. D. Shivakumar, J. Williams, Y. Wu, W. Damm, J. Shelley and W.J. Sherman. Chem. Theory
Comput., 2010, 6 (5), 1509–1519.10. C.D. Berweger, W.F. van Gunsteren and F. Müller-Plathe. Chem. Phys. Lett., 1995, 232, 429-436.11. C.H. Bennett. J. Comp. Phys. 1976, 22, 245–268.12. C. Tong, M. Blanco, W.A. Goddard III and J.H. Seinfeld. Environ. Sci. Technol., 2006, 40 (7), 2333–
2338.13. A. Aksimentiev and K. Schulten. Biophys. J., 2005, 88, 3745-3761.
S9


![Y. Danon, E. Liu, A. Daskalakis, B. McDermott C. … Blain . Dave Williams . Adam Daskalakis . Brian McDermott . Adam Weltz . ... 100 1000 10000. Counts Energy [eV] Fe B. 4. C Open](https://img.pdfslide.us/doc/110x75/5b2b4add7f8b9afe1c8b6405/y-danon-e-liu-a-daskalakis-b-mcdermott-c-blain-dave-williams-adam-daskalakis.jpg)