Embed Size (px)
Citation preview
1
Optical properties of irradiated imidazolium based room temperature ionic liquids: New
microscopic insights of the radiation induced mutations
Apurav Guleria, Ajay K Singh and Soumyakanti Adhikari
Radiation & Photochemistry Division, Bhabha Atomic Research Centre, Mumbai 400 085, India
Correspondence E-mail: [email protected]
Supporting Information
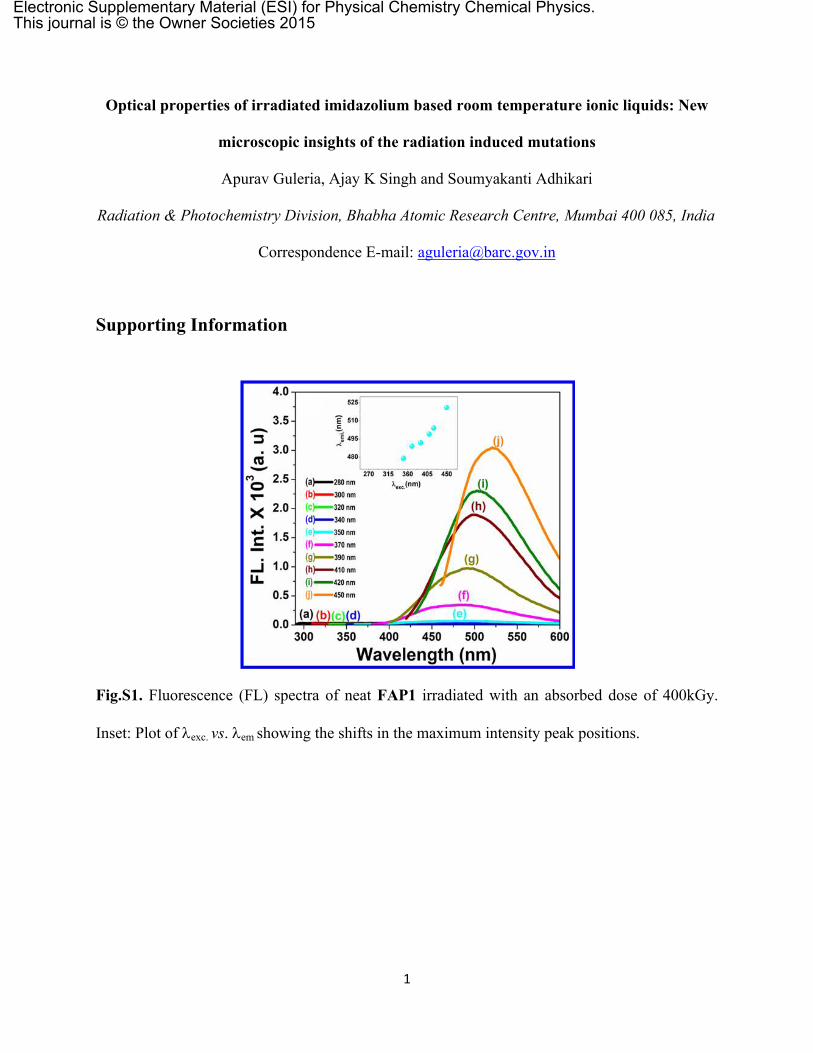
Fig.S1. Fluorescence (FL) spectra of neat FAP1 irradiated with an absorbed dose of 400kGy.
Inset: Plot of exc. vs. em showing the shifts in the maximum intensity peak positions.
Electronic Supplementary Material (ESI) for Physical Chemistry Chemical Physics.This journal is © the Owner Societies 2015
2
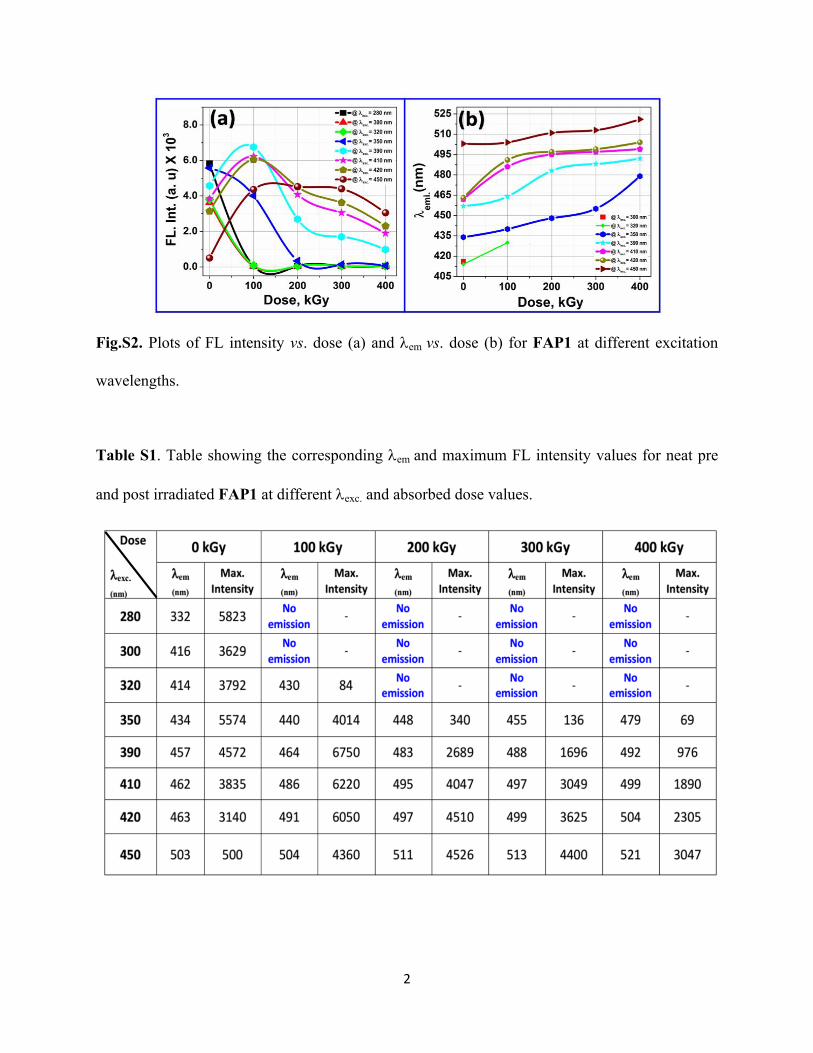
Fig.S2. Plots of FL intensity vs. dose (a) and em vs. dose (b) for FAP1 at different excitation
wavelengths.
Table S1. Table showing the corresponding em and maximum FL intensity values for neat pre
and post irradiated FAP1 at different exc. and absorbed dose values.
3
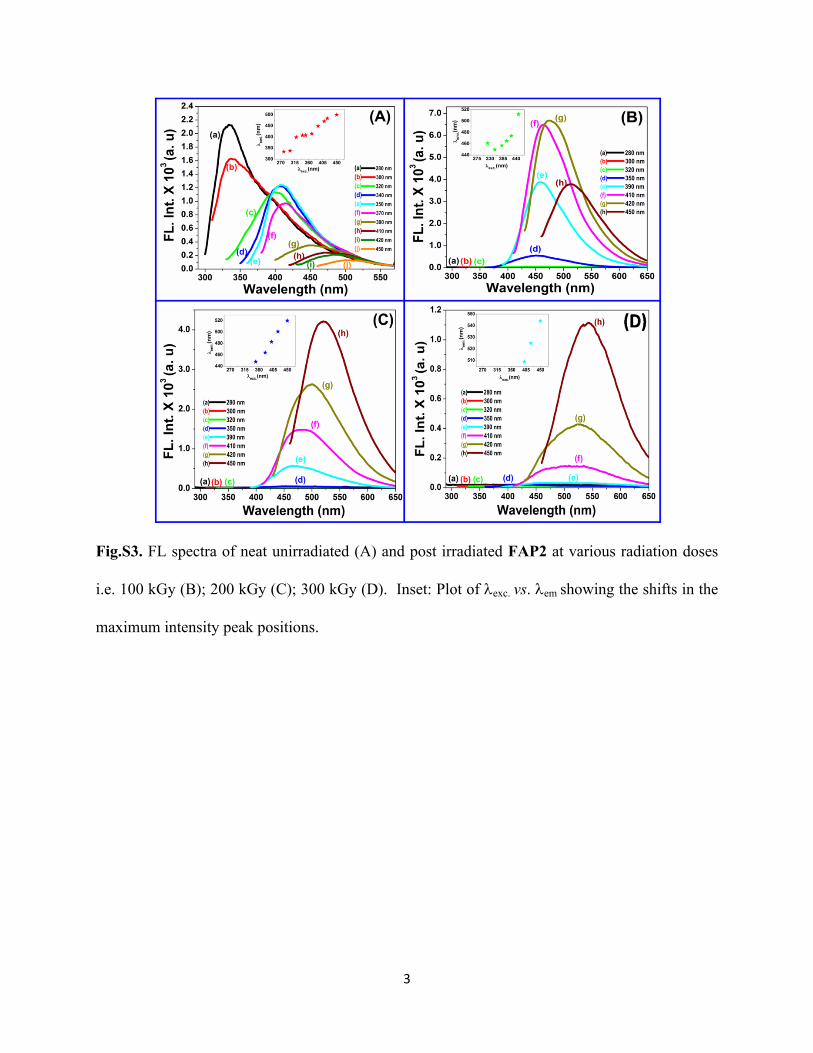
Fig.S3. FL spectra of neat unirradiated (A) and post irradiated FAP2 at various radiation doses
i.e. 100 kGy (B); 200 kGy (C); 300 kGy (D). Inset: Plot of exc. vs. em showing the shifts in the
maximum intensity peak positions.
4
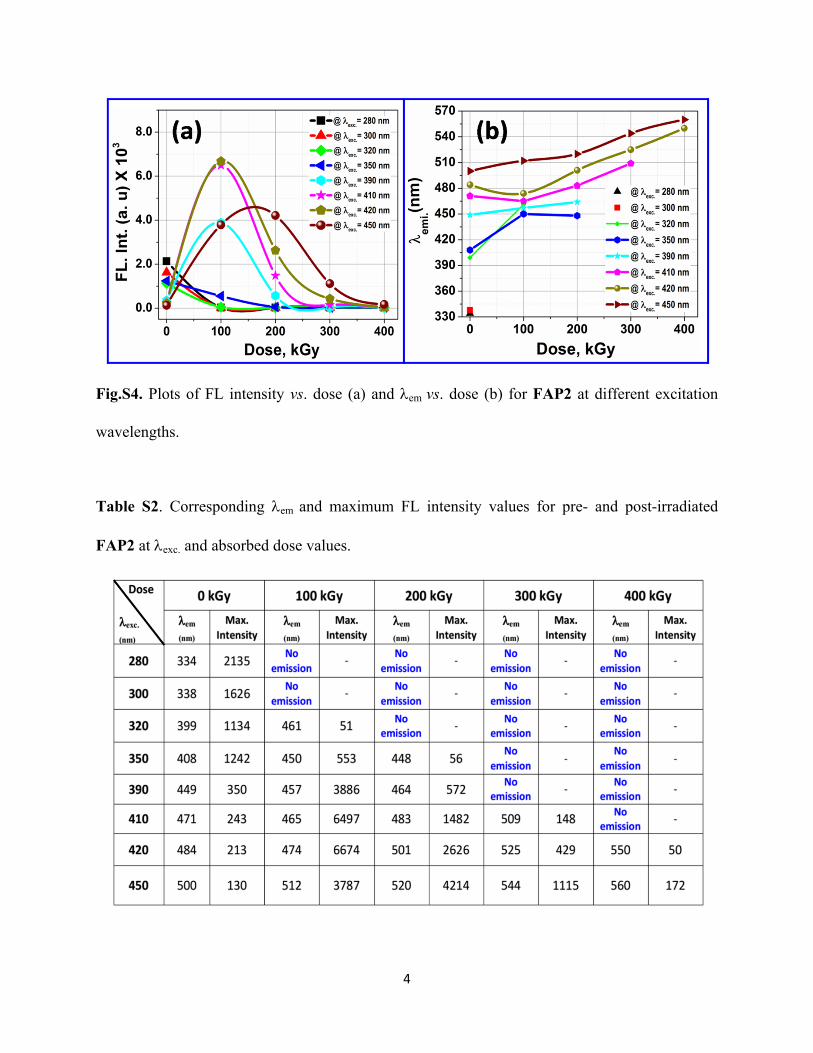
Fig.S4. Plots of FL intensity vs. dose (a) and em vs. dose (b) for FAP2 at different excitation
wavelengths.
Table S2. Corresponding em and maximum FL intensity values for pre- and post-irradiated
FAP2 at exc. and absorbed dose values.
5
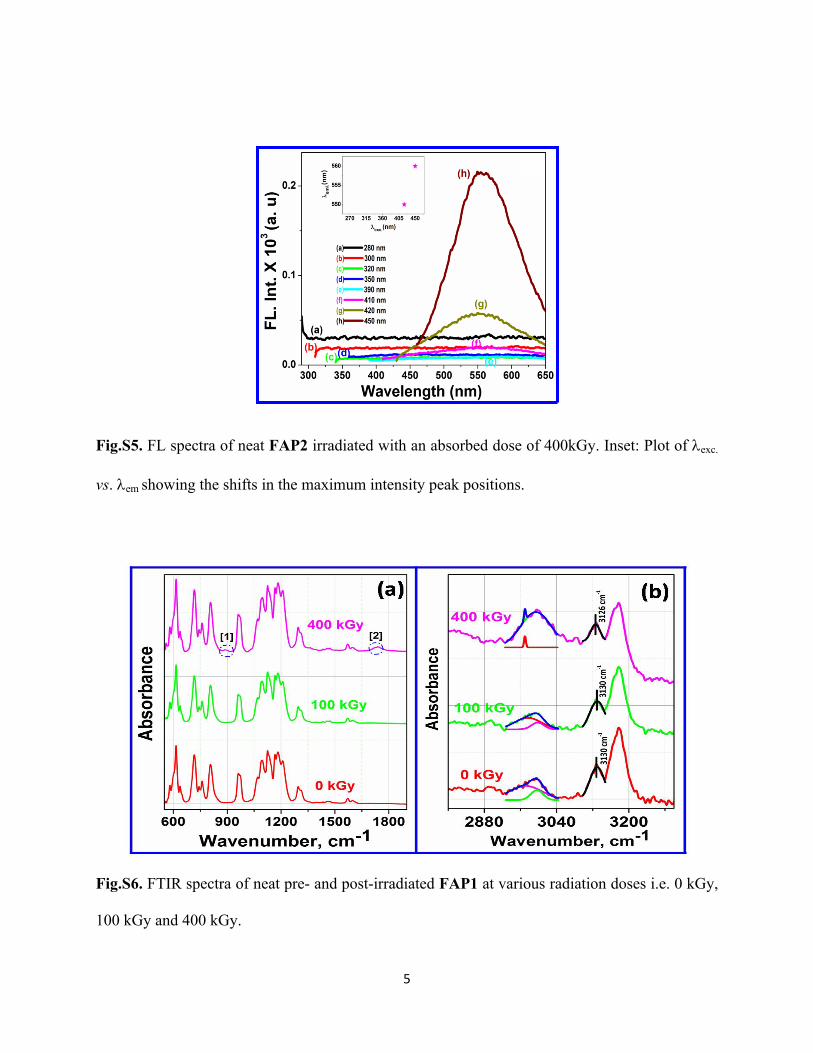
Fig.S5. FL spectra of neat FAP2 irradiated with an absorbed dose of 400kGy. Inset: Plot of exc.
vs. em showing the shifts in the maximum intensity peak positions.
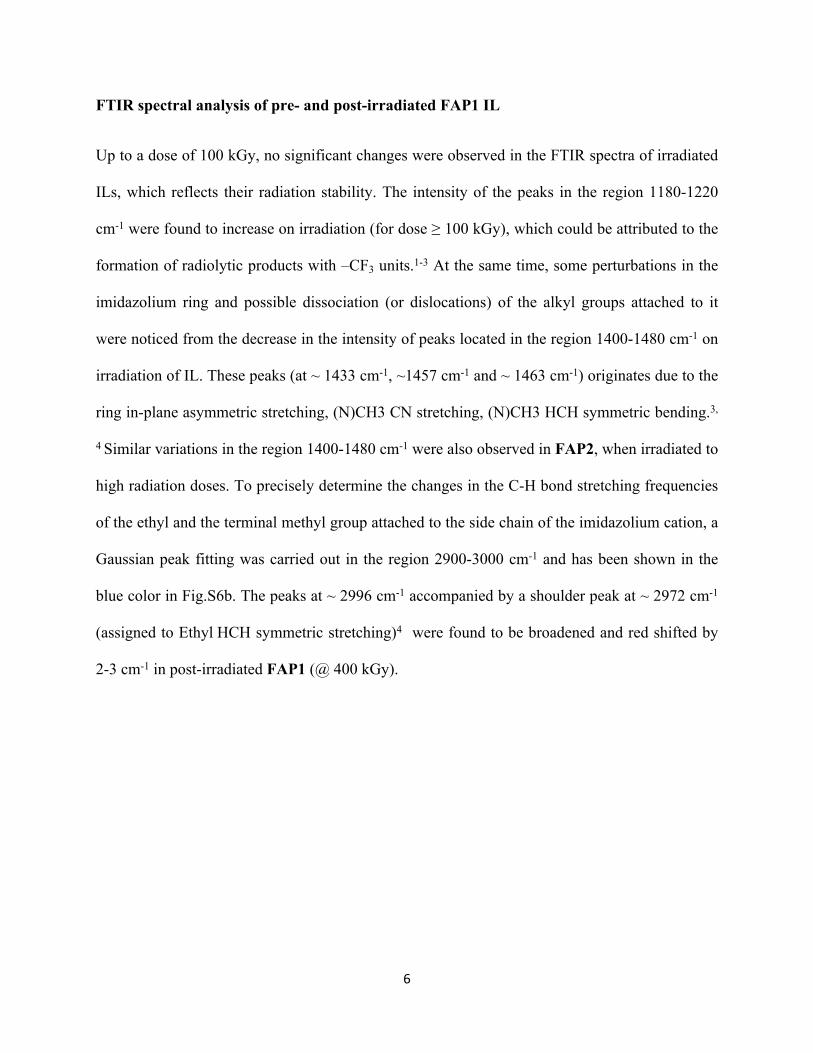
Fig.S6. FTIR spectra of neat pre- and post-irradiated FAP1 at various radiation doses i.e. 0 kGy,
100 kGy and 400 kGy.
6
FTIR spectral analysis of pre- and post-irradiated FAP1 IL
Up to a dose of 100 kGy, no significant changes were observed in the FTIR spectra of irradiated
ILs, which reflects their radiation stability. The intensity of the peaks in the region 1180-1220
cm-1 were found to increase on irradiation (for dose ≥ 100 kGy), which could be attributed to the
formation of radiolytic products with –CF3 units.1-3 At the same time, some perturbations in the
imidazolium ring and possible dissociation (or dislocations) of the alkyl groups attached to it
were noticed from the decrease in the intensity of peaks located in the region 1400-1480 cm-1 on
irradiation of IL. These peaks (at ~ 1433 cm-1, ~1457 cm-1 and ~ 1463 cm-1) originates due to the
ring in-plane asymmetric stretching, (N)CH3 CN stretching, (N)CH3 HCH symmetric bending.3,
4 Similar variations in the region 1400-1480 cm-1 were also observed in FAP2, when irradiated to
high radiation doses. To precisely determine the changes in the C-H bond stretching frequencies
of the ethyl and the terminal methyl group attached to the side chain of the imidazolium cation, a
Gaussian peak fitting was carried out in the region 2900-3000 cm-1 and has been shown in the
blue color in Fig.S6b. The peaks at ~ 2996 cm-1 accompanied by a shoulder peak at ~ 2972 cm-1
(assigned to Ethyl HCH symmetric stretching)4 were found to be broadened and red shifted by
2-3 cm-1 in post-irradiated FAP1 (@ 400 kGy).
7
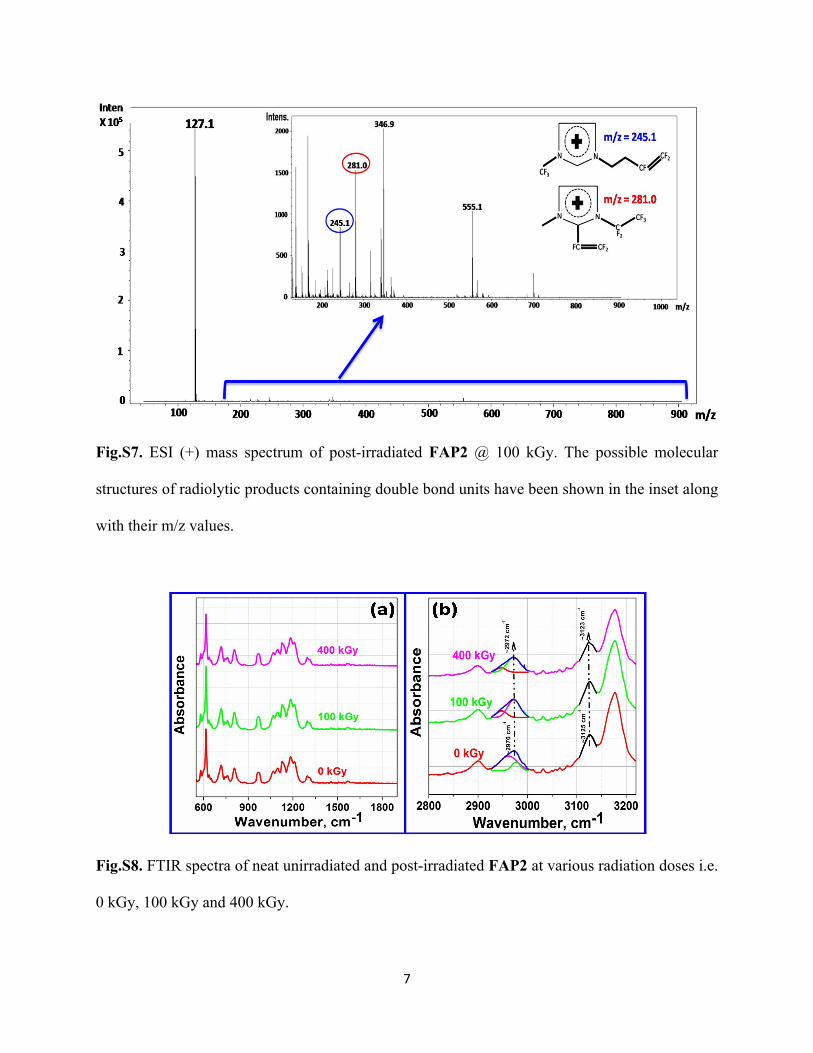
Fig.S7. ESI (+) mass spectrum of post-irradiated FAP2 @ 100 kGy. The possible molecular
structures of radiolytic products containing double bond units have been shown in the inset along
with their m/z values.
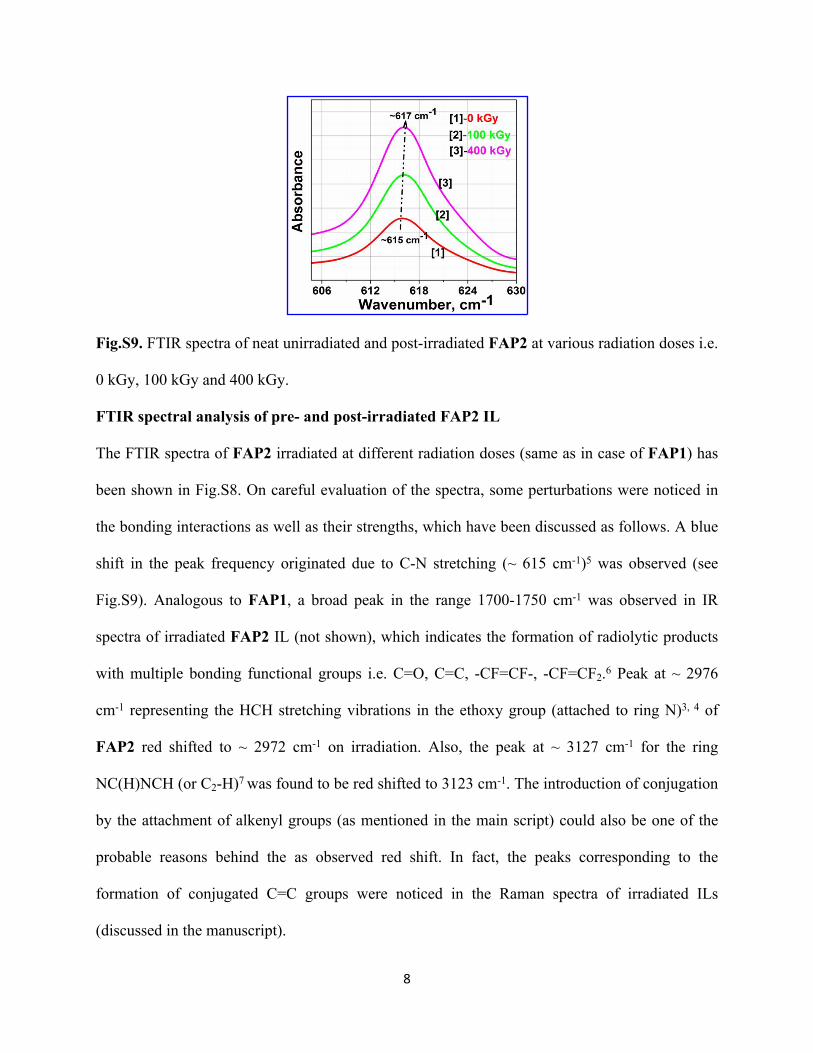
Fig.S8. FTIR spectra of neat unirradiated and post-irradiated FAP2 at various radiation doses i.e.
0 kGy, 100 kGy and 400 kGy.
8
Fig.S9. FTIR spectra of neat unirradiated and post-irradiated FAP2 at various radiation doses i.e.
0 kGy, 100 kGy and 400 kGy.
FTIR spectral analysis of pre- and post-irradiated FAP2 IL
The FTIR spectra of FAP2 irradiated at different radiation doses (same as in case of FAP1) has
been shown in Fig.S8. On careful evaluation of the spectra, some perturbations were noticed in
the bonding interactions as well as their strengths, which have been discussed as follows. A blue
shift in the peak frequency originated due to C-N stretching (~ 615 cm-1)5 was observed (see
Fig.S9). Analogous to FAP1, a broad peak in the range 1700-1750 cm-1 was observed in IR
spectra of irradiated FAP2 IL (not shown), which indicates the formation of radiolytic products
with multiple bonding functional groups i.e. C=O, C=C, -CF=CF-, -CF=CF2.6 Peak at ~ 2976
cm-1 representing the HCH stretching vibrations in the ethoxy group (attached to ring N)3, 4 of
FAP2 red shifted to ~ 2972 cm-1 on irradiation. Also, the peak at ~ 3127 cm-1 for the ring
NC(H)NCH (or C2-H)7 was found to be red shifted to 3123 cm-1. The introduction of conjugation
by the attachment of alkenyl groups (as mentioned in the main script) could also be one of the
probable reasons behind the as observed red shift. In fact, the peaks corresponding to the
formation of conjugated C=C groups were noticed in the Raman spectra of irradiated ILs
(discussed in the manuscript).
9
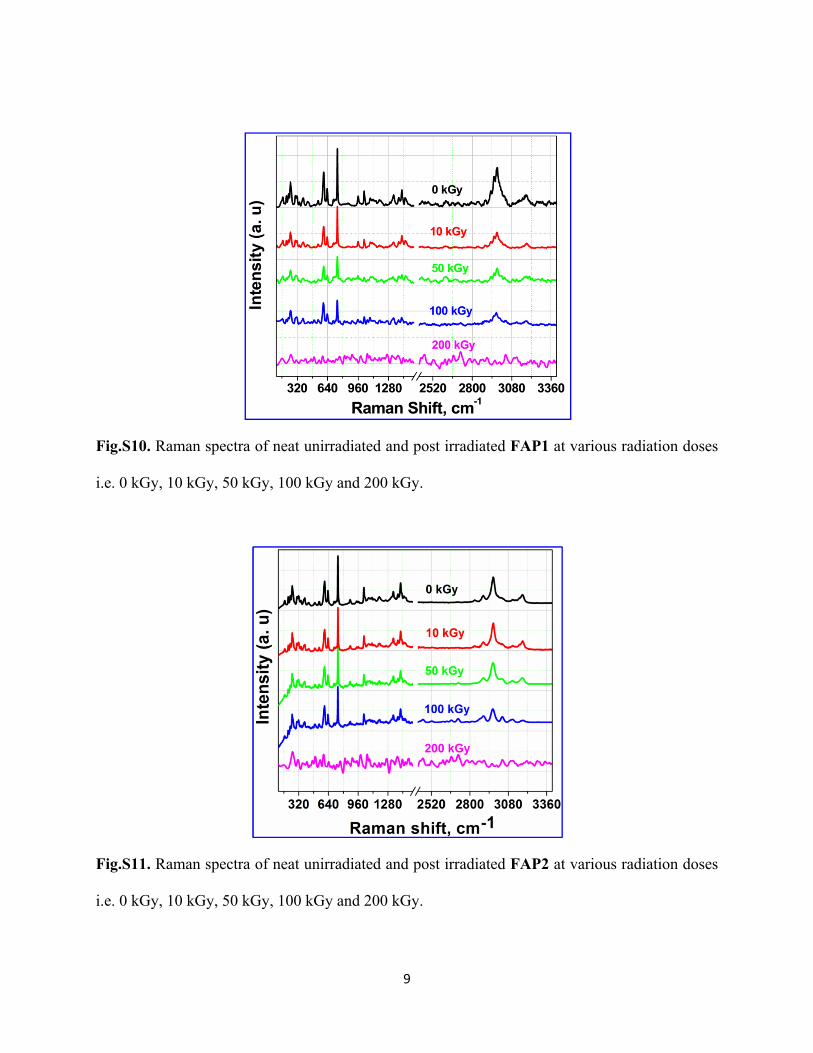
Fig.S10. Raman spectra of neat unirradiated and post irradiated FAP1 at various radiation doses
i.e. 0 kGy, 10 kGy, 50 kGy, 100 kGy and 200 kGy.
Fig.S11. Raman spectra of neat unirradiated and post irradiated FAP2 at various radiation doses
i.e. 0 kGy, 10 kGy, 50 kGy, 100 kGy and 200 kGy.
10
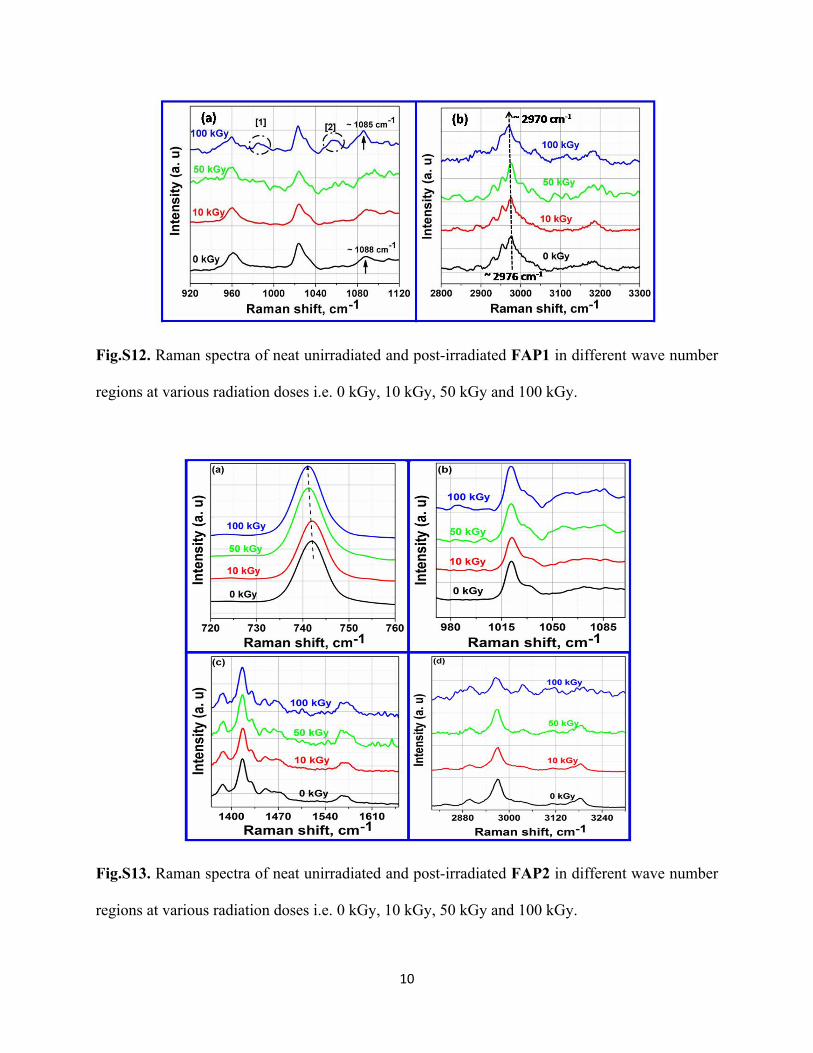
Fig.S12. Raman spectra of neat unirradiated and post-irradiated FAP1 in different wave number
regions at various radiation doses i.e. 0 kGy, 10 kGy, 50 kGy and 100 kGy.
Fig.S13. Raman spectra of neat unirradiated and post-irradiated FAP2 in different wave number
regions at various radiation doses i.e. 0 kGy, 10 kGy, 50 kGy and 100 kGy.
11
Raman spectral analysis of pre- and post-irradiated FAP ILs
As can be seen, the Raman spectra of the ILs did not exhibit significant changes on irradiation up
to a radiation dose of 100 kGy (see Fig.S10 & S11). However, at a radiation dose ≥ 200 kGy, the
spectra appeared to vary considerably which in actual case is due to fluorescence (from the
radiolytic products). The perturbations observed in the networking structure of FAP1 and FAP2
on irradiation has been explained as follows. A red shift was observed in the symmetric bending
modes of –CF3 (at ~ 742 cm-1) for FAP2 on irradiation (see Fig.S13a). A broad peak centered at
~ 985 cm-1 emerges at a radiation dose ≥ 50 kGy (for both FAP1 (Fig.S12a) and FAP2
(Fig.S13b)), which indicates the formation of radiolytic products with vinyl C-H groups.8 While,
broad peak marked as [2] (1050-1070 cm-1) in Fig.S12a is most plausibly attributed to the
formation of fluoroalkanes.8 Besides, in-plane bending C-H vibrational frequency (in FAP1) at ~
1088 cm-1 red shifted to 1085 cm-1 on irradiation at a radiation dose of 100 kGy.2 Furthermore,
red shifts in the frequencies representing ring in-plane asymmetric stretching, CC stretching, CH3
(N) CN stretching (from 1421 cm-1 to 1419 cm-1) and broadening in the CH2 (N) CN stretching
vibrations (~ 1570 cm-1)3 was observed in Raman spectra of FAP1 on irradiation. Similar
distortions in the corresponding wavenumber regions were observed for post-irradiated FAP2
(see Fig.S13). There have been additional strong evidences which indicate perturbations in the
bonding interactions amongst the cationic and the anionic moieties and their surrounding
environments. This could be observed primarily from the variations in the C-H stretching
frequencies of the alkyl side chains in the region 2800-3200 cm-1. For instance, in case of FAP1,
peak most probably representing the ring CH3 HCH symmetric stretching at ~ 2932 cm-1 red
shifted to ~ 2929 cm-1 at high radiation dose of 100 kGy.4 Peak at ~2953 cm-1 could be assigned
to CH2 HCH stretching frequency4 was found to broaden at high radiation dose (see Fig.S12b),
12
and most possibly be attributed to the presence of radiolytic products with variations in the C-H
bond strengths. Further, a red shift (from 2976 cm-1 to 2970 cm-1 @ 100 kGy) in the asymmetric
stretching vibrational frequency of ethyl HCH was observed (in FAP1), which signifies the
weakening of the respective bond strength.4 Similar red shift was observed (asymmetric
stretching vibrational frequency of ethyl HCH) for irradiated FAP2 (@ 100 kGy). Peak at ~
3180 cm-1 representing the ring HCCH symmetric stretching4 broadened at higher radiation
doses in both the FAP ILs, which is a clear indication of the presence of radiolytic products
derived from the imidazolium cation with varying bonding strengths.
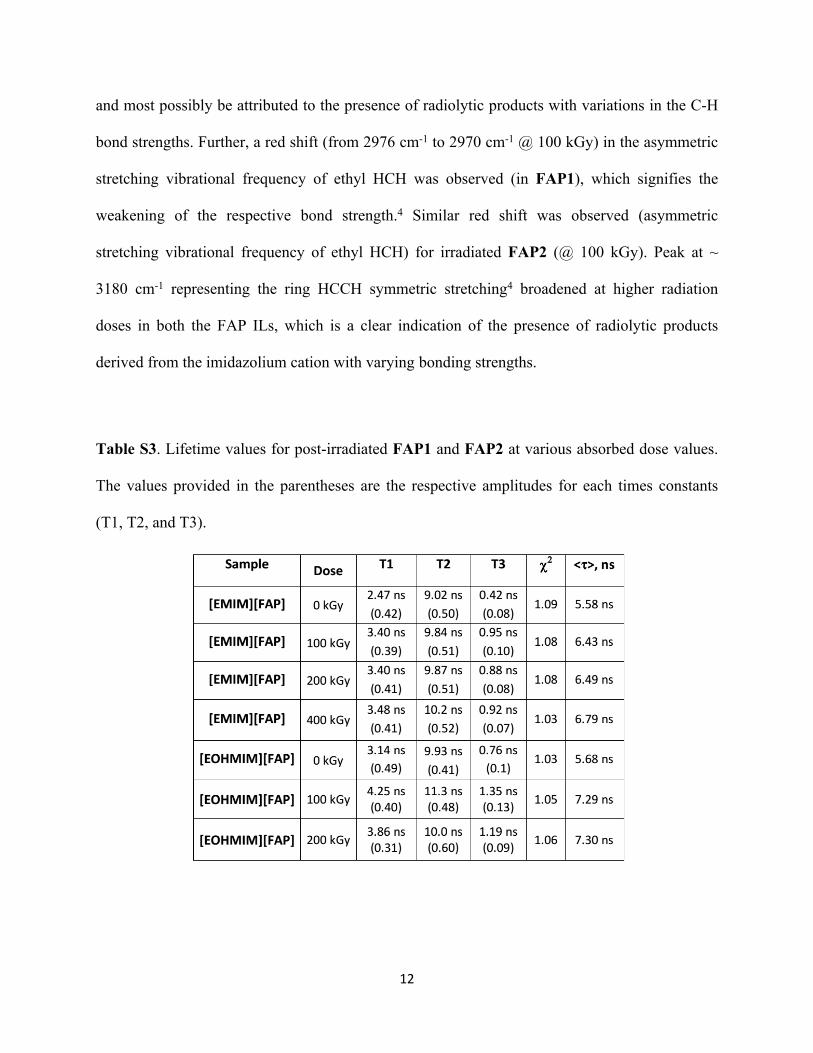
Table S3. Lifetime values for post-irradiated FAP1 and FAP2 at various absorbed dose values.
The values provided in the parentheses are the respective amplitudes for each times constants
(T1, T2, and T3).
13
References
1. K. P. Huang, P. Lin and H. C. Shih, J. Applied Phys., 2004, 96, 354-360.
2. A. M. Moschovia, S. Ntaisb, V. Dracopoulosb and V. Nikolakis, Vibrational Spectroscopy,
2012, 63, 350–359.
3. J. Kiefer, J. Fries and A. Leipertz, Appl Spectrosc., 2007, 61, 1306-1311.
4. N. E. Heimer, R. E. D. Sesto, Z. Meng, J. S. Wilkes and W. R. Carper, Journal of Molecular
Liquids, 2006, 124, 84 – 95.
5. N. R. Dhumal, H. J. Kim and J. Kiefer, J. Phys. Chem. A, 2011, 115, 3551–3558.
6. (a) Q. T. Le, S. Naumov, T. Conard, A. Franquet, M. Müller, B. Beckhoff, C. Adelmann, H.
Struyf, S. D. Gendt, and M. R. Baklanov, ECS J. Solid State Sci. Tech., 2013, 2, N93-N98; (b) X.
Gu, T. Nemoto, A. Teramoto, T. Ito and T. Ohmi, J. Electrochemical Society, 2009, 156, H409-
H415.
7. S. B. Dhiman, G. S. Goff, W. Runde and J. A. LaVerne, J. Phys. Chem. B, 2013,117, 6782–
6788.
8. J. Coates, in Encyclopedia of Analytical Chemistry, ed. R. A. Meyers, John Wiley & Sons Ltd,
Chichester, 2000, pp. 10815–10837; G. Socrates, Infrared and Raman characteristic group
frequencies: Tables and Charts, John Wiley & Sons, 2004; L. J. Bellamy, Infrared Spectra of
Complex Molecules, Chapman & Hall, New York, USA, Vol. 1, 1975.