Embed Size (px)
Citation preview
1
Supporting Information
Multifunctional and robust composite materials comprising gold
nanoparticles at a spherical polystyrene particle surface
Samir A. Belhout,a Ji Yoon Kim,a David T. Hinds,a Natalie Owen,b
Jonathan A. Coulterb and
Susan J. Quinna*
E-mail: [email protected]
aSchool of Chemistry, University College Dublin, Belfield, Dublin 4, Ireland
bSchool of Pharmacy, Queen’s University Belfast, BT9 7BL, UK
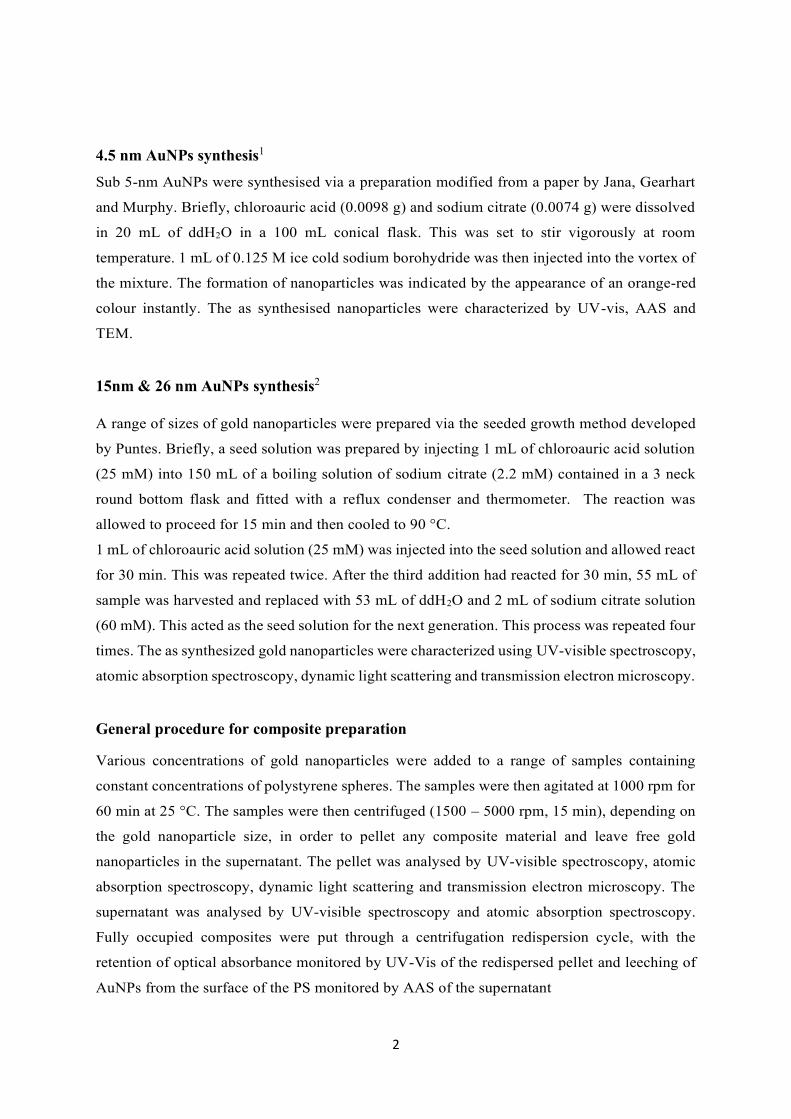
Experimental
Materials
Chloroauric acid, sodium citrate, hydrochloric acid, sodium chloride (NaCl), ethanol (EtOH),
phosphate buffered saline tablets (PBS) and sodium borohydride were all supplied from Sigma
Aldrich. Nitric acid was supplied by Riedel-de Haen. Amine-modified polystyrene beads were
supplied by Life technology. Dulbecco’s Modified Eagle Medium (DMEM) and Foetal Bovine
Serum (FBS) were supplied by Gibco BRL. All materials were analytical grade and were used
without any further purification. All water was obtained from an ultra-pure Millipore 0.22 μm
filtration system (18.2 mΩ conductivity)
Characterisation
UV-visible (UV-vis) spectroscopy (Varian Cary-50 Eclipse spectrophotometer) was used to
characterize the synthesised AuNPs as well as the composite materials. Atomic absorption
spectroscopy (AAS) (Varian SpectrAA 55B atomic absorption spectrometer) was used to
determine the quantity of AuNPs on the surface of the composite materials. Dynamic light
scattering (DLS) and zeta potential measurements were carried out on a Malvern Zetasizer
Nano-ZS. Agitation was performed using a Grant-bio PCMT Thermo shaker. Centrifugation
was carried out using a Thermo Scientific Heraeus pico 17 centrifuge. All transmission electron
microscopy (TEM) images were captured using a Jeol 2100 at 100 kV accelerating voltage in
the Centre for Microscopy and Analysis in Trinity College, Dublin. Scanning electron
microscopy (SEM) images were capture in the Advanced Microscopy Laboratory in Trinity
College Dublin.
Electronic Supplementary Material (ESI) for Chemical Communications.This journal is © The Royal Society of Chemistry 2016
2
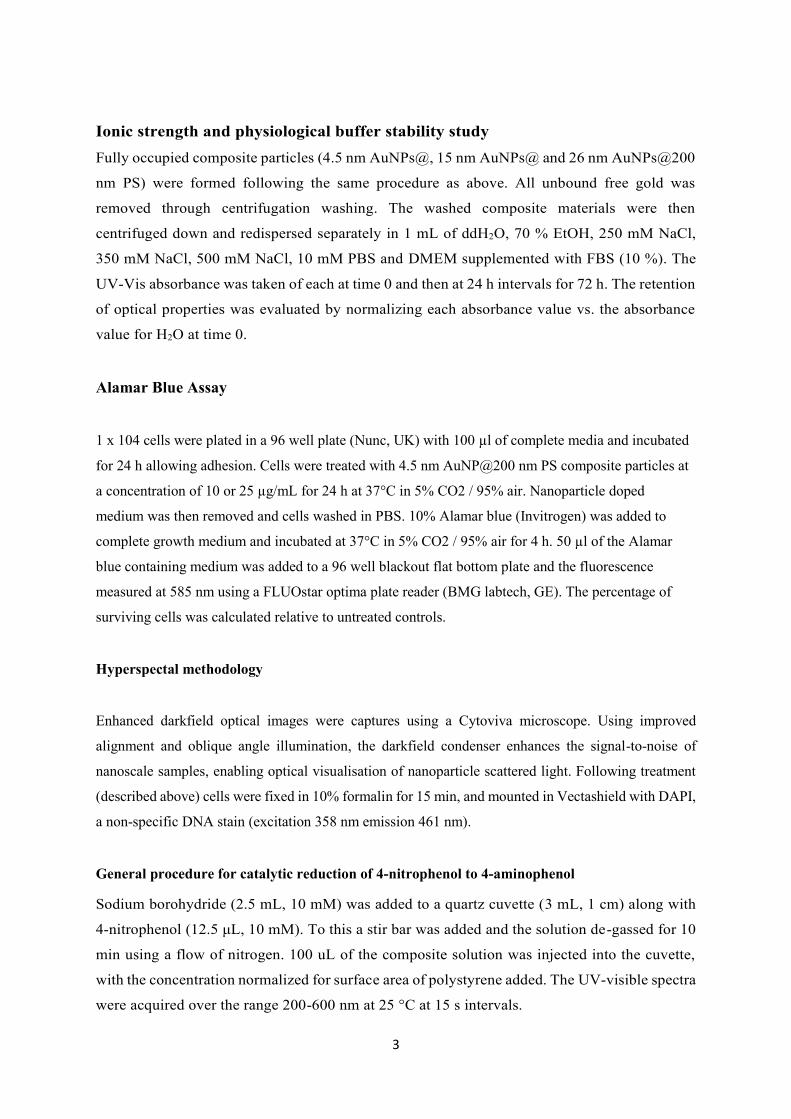
4.5 nm AuNPs synthesis1
Sub 5-nm AuNPs were synthesised via a preparation modified from a paper by Jana, Gearhart
and Murphy. Briefly, chloroauric acid (0.0098 g) and sodium citrate (0.0074 g) were dissolved
in 20 mL of ddH2O in a 100 mL conical flask. This was set to stir vigorously at room
temperature. 1 mL of 0.125 M ice cold sodium borohydride was then injected into the vortex of
the mixture. The formation of nanoparticles was indicated by the appearance of an orange-red
colour instantly. The as synthesised nanoparticles were characterized by UV-vis, AAS and
TEM.
15nm & 26 nm AuNPs synthesis2
A range of sizes of gold nanoparticles were prepared via the seeded growth method developed
by Puntes. Briefly, a seed solution was prepared by injecting 1 mL of chloroauric acid solution
(25 mM) into 150 mL of a boiling solution of sodium citrate (2.2 mM) contained in a 3 neck
round bottom flask and fitted with a reflux condenser and thermometer. The reaction was
allowed to proceed for 15 min and then cooled to 90 °C.
1 mL of chloroauric acid solution (25 mM) was injected into the seed solution and allowed react
for 30 min. This was repeated twice. After the third addition had reacted for 30 min, 55 mL of
sample was harvested and replaced with 53 mL of ddH2O and 2 mL of sodium citrate solution
(60 mM). This acted as the seed solution for the next generation. This process was repeated four
times. The as synthesized gold nanoparticles were characterized using UV-visible spectroscopy,
atomic absorption spectroscopy, dynamic light scattering and transmission electron microscopy.
General procedure for composite preparation
Various concentrations of gold nanoparticles were added to a range of samples containing
constant concentrations of polystyrene spheres. The samples were then agitated at 1000 rpm for
60 min at 25 °C. The samples were then centrifuged (1500 – 5000 rpm, 15 min), depending on
the gold nanoparticle size, in order to pellet any composite material and leave free gold
nanoparticles in the supernatant. The pellet was analysed by UV-visible spectroscopy, atomic
absorption spectroscopy, dynamic light scattering and transmission electron microscopy. The
supernatant was analysed by UV-visible spectroscopy and atomic absorption spectroscopy.
Fully occupied composites were put through a centrifugation redispersion cycle, with the
retention of optical absorbance monitored by UV-Vis of the redispersed pellet and leeching of
AuNPs from the surface of the PS monitored by AAS of the supernatant
3
Ionic strength and physiological buffer stability study
Fully occupied composite particles (4.5 nm AuNPs@, 15 nm AuNPs@ and 26 nm AuNPs@200
nm PS) were formed following the same procedure as above. All unbound free gold was
removed through centrifugation washing. The washed composite materials were then
centrifuged down and redispersed separately in 1 mL of ddH2O, 70 % EtOH, 250 mM NaCl,
350 mM NaCl, 500 mM NaCl, 10 mM PBS and DMEM supplemented with FBS (10 %). The
UV-Vis absorbance was taken of each at time 0 and then at 24 h intervals for 72 h. The retention
of optical properties was evaluated by normalizing each absorbance value vs. the absorbance
value for H2O at time 0.
Alamar Blue Assay
1 x 10⁴ cells were plated in a 96 well plate (Nunc, UK) with 100 µl of complete media and incubated
for 24 h allowing adhesion. Cells were treated with 4.5 nm AuNP@200 nm PS composite particles at
a concentration of 10 or 25 µg/mL for 24 h at 37°C in 5% CO2 / 95% air. Nanoparticle doped
medium was then removed and cells washed in PBS. 10% Alamar blue (Invitrogen) was added to
complete growth medium and incubated at 37°C in 5% CO2 / 95% air for 4 h. 50 µl of the Alamar
blue containing medium was added to a 96 well blackout flat bottom plate and the fluorescence
measured at 585 nm using a FLUOstar optima plate reader (BMG labtech, GE). The percentage of
surviving cells was calculated relative to untreated controls.
Hyperspectal methodology
Enhanced darkfield optical images were captures using a Cytoviva microscope. Using improved
alignment and oblique angle illumination, the darkfield condenser enhances the signal-to-noise of
nanoscale samples, enabling optical visualisation of nanoparticle scattered light. Following treatment
(described above) cells were fixed in 10% formalin for 15 min, and mounted in Vectashield with DAPI,
a non-specific DNA stain (excitation 358 nm emission 461 nm).
General procedure for catalytic reduction of 4-nitrophenol to 4-aminophenol
Sodium borohydride (2.5 mL, 10 mM) was added to a quartz cuvette (3 mL, 1 cm) along with
4-nitrophenol (12.5 μL, 10 mM). To this a stir bar was added and the solution de-gassed for 10
min using a flow of nitrogen. 100 uL of the composite solution was injected into the cuvette,
with the concentration normalized for surface area of polystyrene added. The UV-visible spectra
were acquired over the range 200-600 nm at 25 °C at 15 s intervals.
4
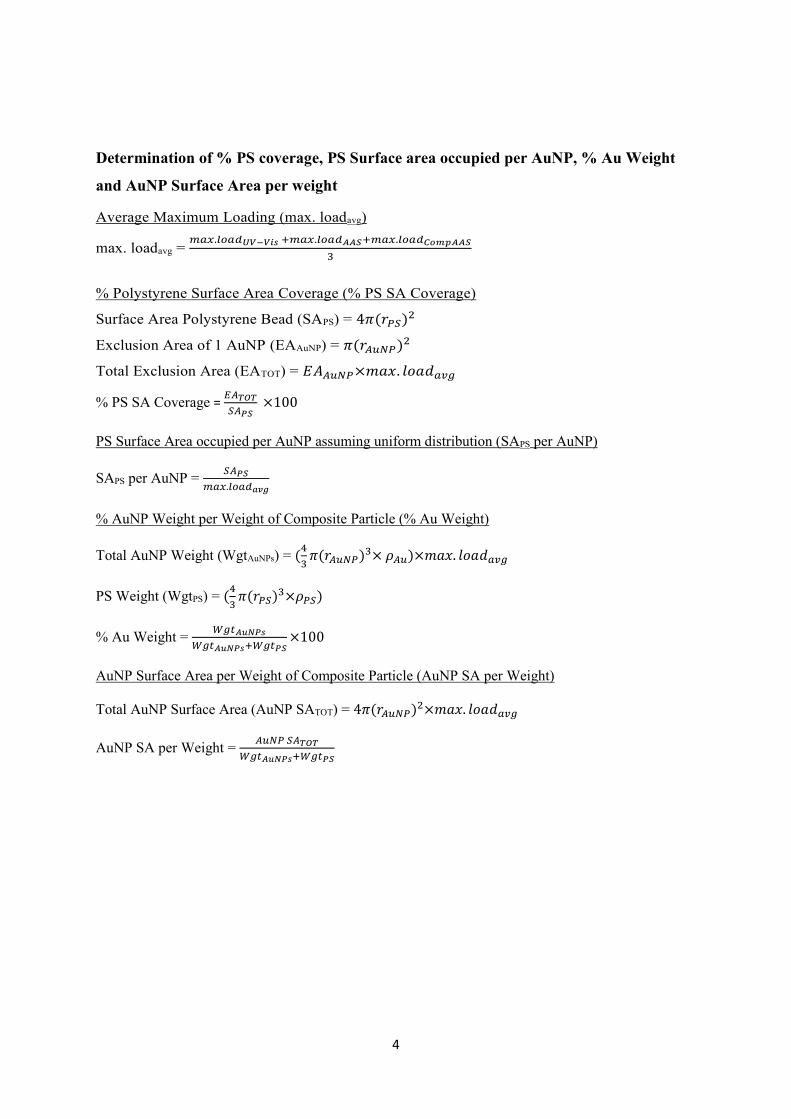
Determination of % PS coverage, PS Surface area occupied per AuNP, % Au Weight
and AuNP Surface Area per weight
Average Maximum Loading (max. loadavg)
max. loadavg = 𝑚𝑎𝑥.𝑙𝑜𝑎𝑑𝑈𝑉−𝑉𝑖𝑠 +𝑚𝑎𝑥.𝑙𝑜𝑎𝑑𝐴𝐴𝑆+𝑚𝑎𝑥.𝑙𝑜𝑎𝑑𝐶𝑜𝑚𝑝𝐴𝐴𝑆
3
% Polystyrene Surface Area Coverage (% PS SA Coverage)
Surface Area Polystyrene Bead (SAPS) = 4𝜋(𝑟𝑃𝑆)2
Exclusion Area of 1 AuNP (EAAuNP) = 𝜋(𝑟𝐴𝑢𝑁𝑃)2
Total Exclusion Area (EATOT) = 𝐸𝐴𝐴𝑢𝑁𝑃×𝑚𝑎𝑥. 𝑙𝑜𝑎𝑑𝑎𝑣𝑔
% PS SA Coverage = 𝐸𝐴𝑇𝑂𝑇
𝑆𝐴𝑃𝑆 ×100
PS Surface Area occupied per AuNP assuming uniform distribution (SAPS per AuNP)
SAPS per AuNP = 𝑆𝐴𝑃𝑆
𝑚𝑎𝑥.𝑙𝑜𝑎𝑑𝑎𝑣𝑔
% AuNP Weight per Weight of Composite Particle (% Au Weight)
Total AuNP Weight (WgtAuNPs) = (4
3𝜋(𝑟𝐴𝑢𝑁𝑃)3× 𝜌𝐴𝑢)×𝑚𝑎𝑥. 𝑙𝑜𝑎𝑑𝑎𝑣𝑔
PS Weight (WgtPS) = (4
3𝜋(𝑟𝑃𝑆)3×𝜌𝑃𝑆)
% Au Weight = 𝑊𝑔𝑡𝐴𝑢𝑁𝑃𝑠
𝑊𝑔𝑡𝐴𝑢𝑁𝑃𝑠+𝑊𝑔𝑡𝑃𝑆×100
AuNP Surface Area per Weight of Composite Particle (AuNP SA per Weight)
Total AuNP Surface Area (AuNP SATOT) = 4𝜋(𝑟𝐴𝑢𝑁𝑃)2×𝑚𝑎𝑥. 𝑙𝑜𝑎𝑑𝑎𝑣𝑔
AuNP SA per Weight = 𝐴𝑢𝑁𝑃 𝑆𝐴𝑇𝑂𝑇
𝑊𝑔𝑡𝐴𝑢𝑁𝑃𝑠+𝑊𝑔𝑡𝑃𝑆
5
.
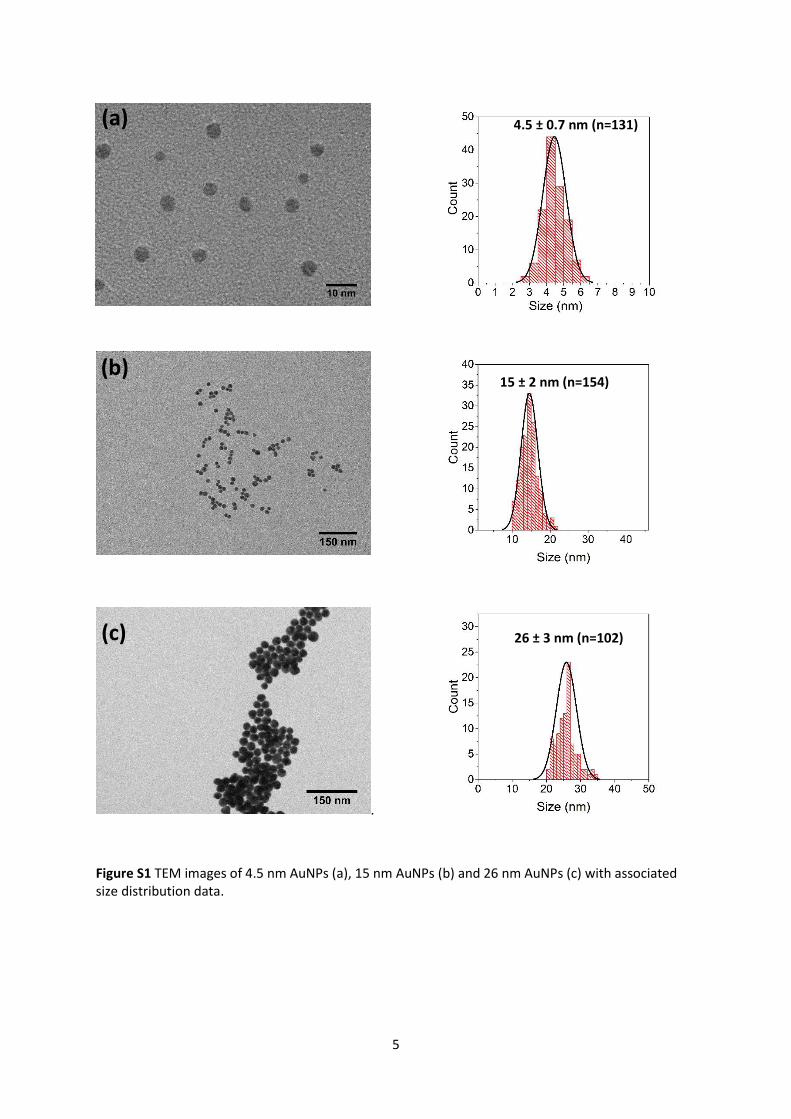
4.5 ± 0.7 nm (n=131)
15 ± 2 nm (n=154)
26 ± 3 nm (n=102)
A
(b)
C
Figure S1 TEM images of 4.5 nm AuNPs (a), 15 nm AuNPs (b) and 26 nm AuNPs (c) with associated size distribution data.
(c)
(a)
6
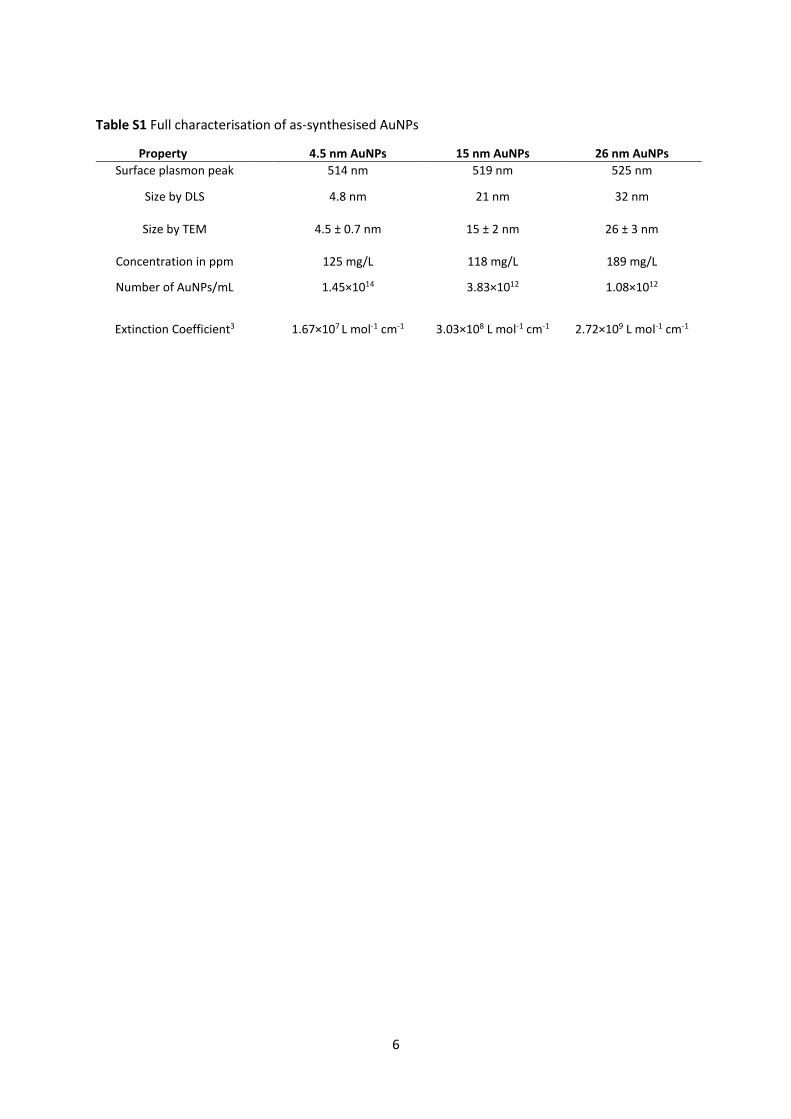
Property 4.5 nm AuNPs 15 nm AuNPs 26 nm AuNPs
Surface plasmon peak 514 nm 519 nm 525 nm
Size by DLS 4.8 nm 21 nm 32 nm
Size by TEM 4.5 ± 0.7 nm 15 ± 2 nm 26 ± 3 nm
Concentration in ppm 125 mg/L 118 mg/L 189 mg/L
Number of AuNPs/mL 1.45×10¹⁴ 3.83×10¹² 1.08×10¹²
Extinction Coefficient3 1.67×10⁷ L mol-1 cm-1 3.03×10⁸ L mol-1 cm-1 2.72×10⁹ L mol-1 cm-1
Table S1 Full characterisation of as-synthesised AuNPs
7
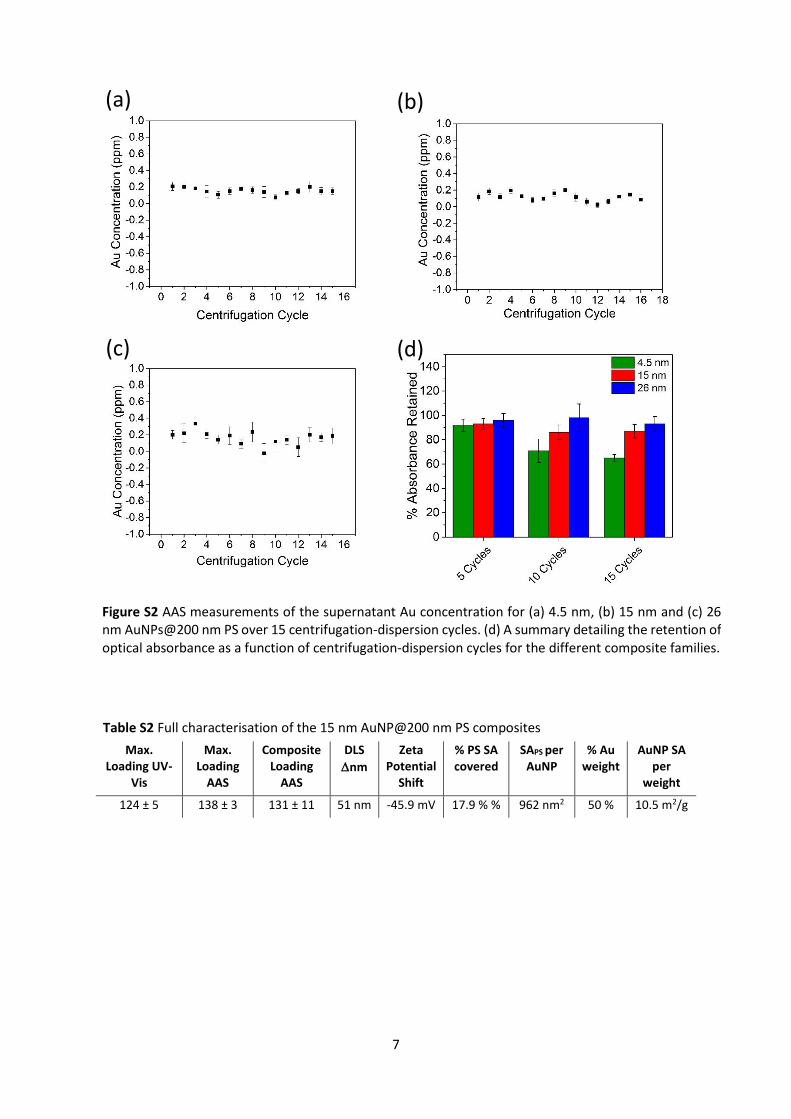
Table S2 Full characterisation of the 15 nm AuNP@200 nm PS composites
Max. Loading UV-
Vis
Max. Loading
AAS
Composite Loading
AAS
DLS
nm
Zeta Potential
Shift
% PS SA covered
SAPS per AuNP
% Au weight
AuNP SA per
weight
124 ± 5 138 ± 3 131 ± 11 51 nm -45.9 mV 17.9 % % 962 nm2 50 % 10.5 m2/g
(a) (b)
(c) (d)
Figure S2 AAS measurements of the supernatant Au concentration for (a) 4.5 nm, (b) 15 nm and (c) 26 nm AuNPs@200 nm PS over 15 centrifugation-dispersion cycles. (d) A summary detailing the retention of optical absorbance as a function of centrifugation-dispersion cycles for the different composite families.
8
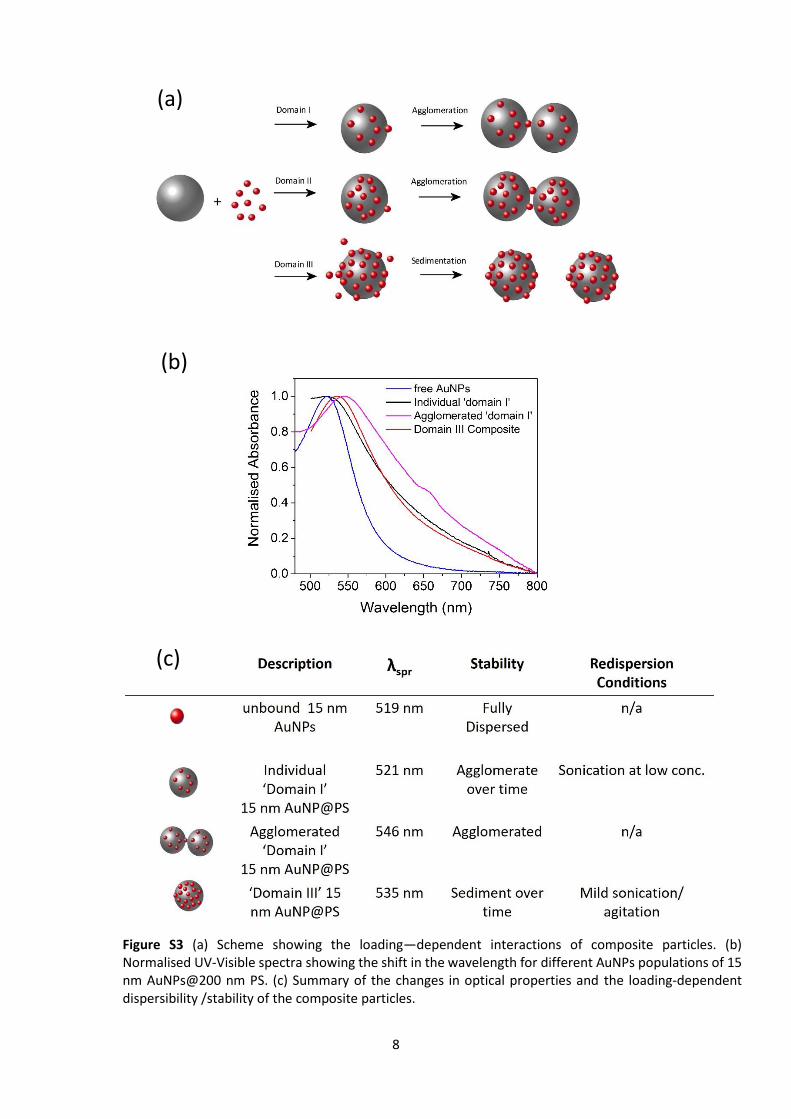
Figure S3 (a) Scheme showing the loading—dependent interactions of composite particles. (b) Normalised UV-Visible spectra showing the shift in the wavelength for different AuNPs populations of 15 nm AuNPs@200 nm PS. (c) Summary of the changes in optical properties and the loading-dependent dispersibility /stability of the composite particles.
(b)
(c)
(a)
9
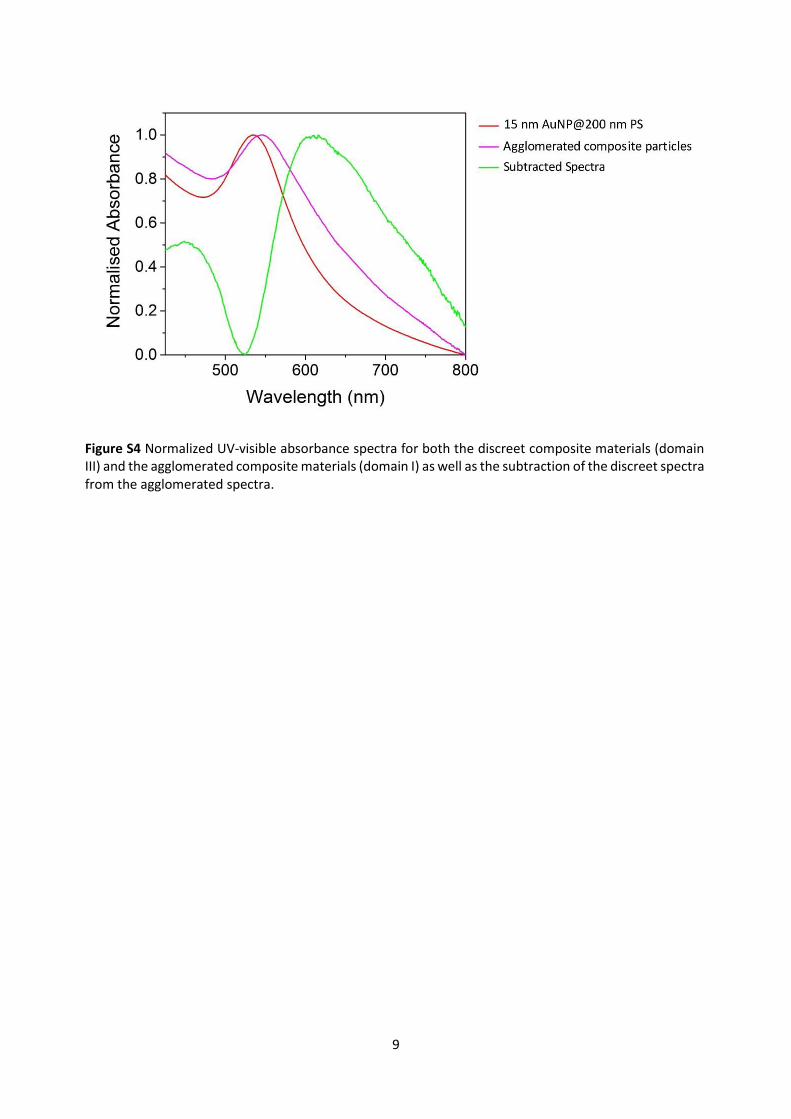
Figure S4 Normalized UV-visible absorbance spectra for both the discreet composite materials (domain III) and the agglomerated composite materials (domain I) as well as the subtraction of the discreet spectra from the agglomerated spectra.
10
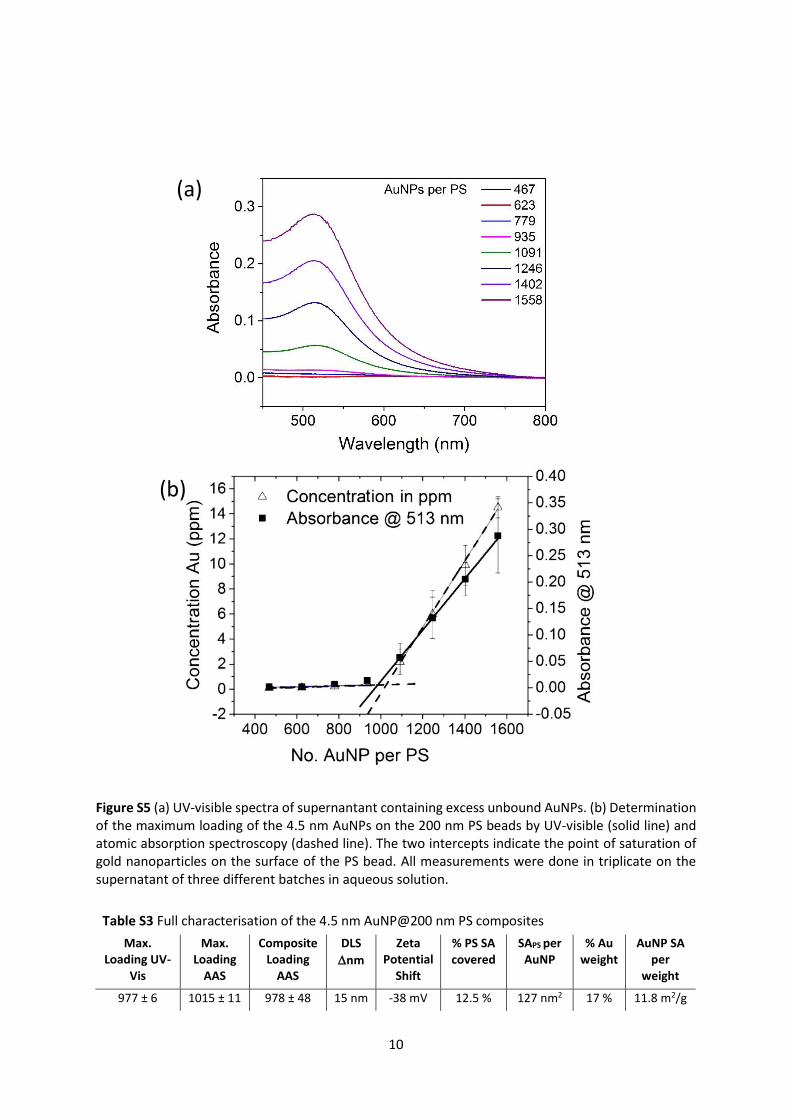
Figure S5 (a) UV-visible spectra of supernantant containing excess unbound AuNPs. (b) Determination of the maximum loading of the 4.5 nm AuNPs on the 200 nm PS beads by UV-visible (solid line) and atomic absorption spectroscopy (dashed line). The two intercepts indicate the point of saturation of gold nanoparticles on the surface of the PS bead. All measurements were done in triplicate on the supernatant of three different batches in aqueous solution.
Table S3 Full characterisation of the 4.5 nm AuNP@200 nm PS composites
Max. Loading UV-
Vis
Max. Loading
AAS
Composite Loading
AAS
DLS
nm
Zeta Potential
Shift
% PS SA covered
SAPS per AuNP
% Au weight
AuNP SA per
weight
977 ± 6 1015 ± 11 978 ± 48 15 nm -38 mV 12.5 % 127 nm2 17 % 11.8 m2/g
(a)
(b)
11
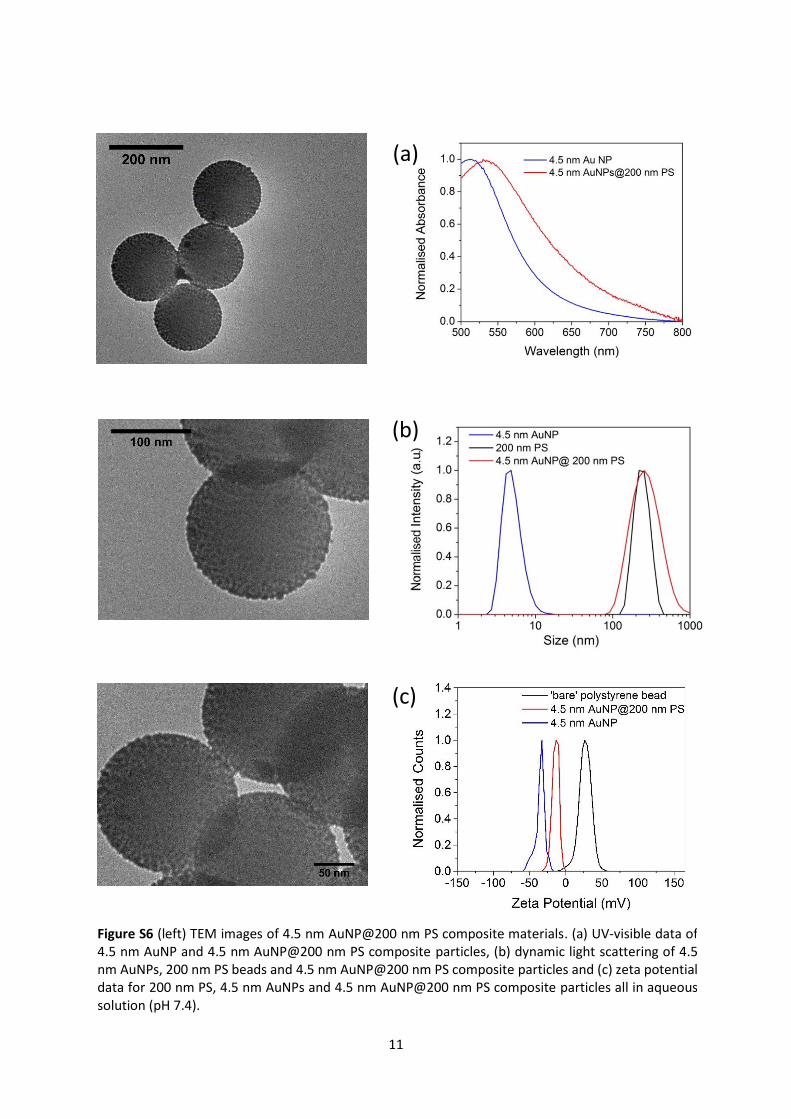
Figure S6 (left) TEM images of 4.5 nm AuNP@200 nm PS composite materials. (a) UV-visible data of 4.5 nm AuNP and 4.5 nm AuNP@200 nm PS composite particles, (b) dynamic light scattering of 4.5 nm AuNPs, 200 nm PS beads and 4.5 nm AuNP@200 nm PS composite particles and (c) zeta potential data for 200 nm PS, 4.5 nm AuNPs and 4.5 nm AuNP@200 nm PS composite particles all in aqueous solution (pH 7.4).
(a)
(c)
(b)
12
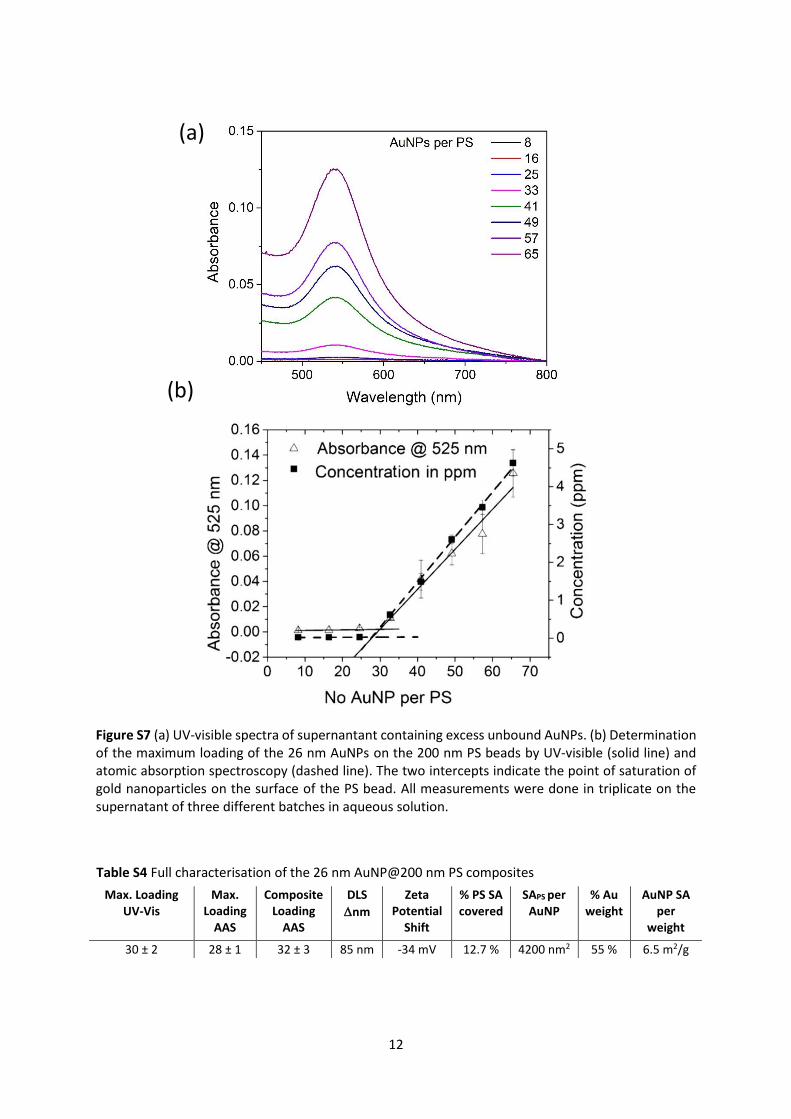
Figure S7 (a) UV-visible spectra of supernantant containing excess unbound AuNPs. (b) Determination of the maximum loading of the 26 nm AuNPs on the 200 nm PS beads by UV-visible (solid line) and atomic absorption spectroscopy (dashed line). The two intercepts indicate the point of saturation of gold nanoparticles on the surface of the PS bead. All measurements were done in triplicate on the supernatant of three different batches in aqueous solution.
Table S4 Full characterisation of the 26 nm AuNP@200 nm PS composites
Max. Loading UV-Vis
Max. Loading
AAS
Composite Loading
AAS
DLS
nm
Zeta Potential
Shift
% PS SA covered
SAPS per AuNP
% Au weight
AuNP SA per
weight
30 ± 2 28 ± 1 32 ± 3 85 nm -34 mV 12.7 % 4200 nm2 55 % 6.5 m2/g
(a)
(b)
13
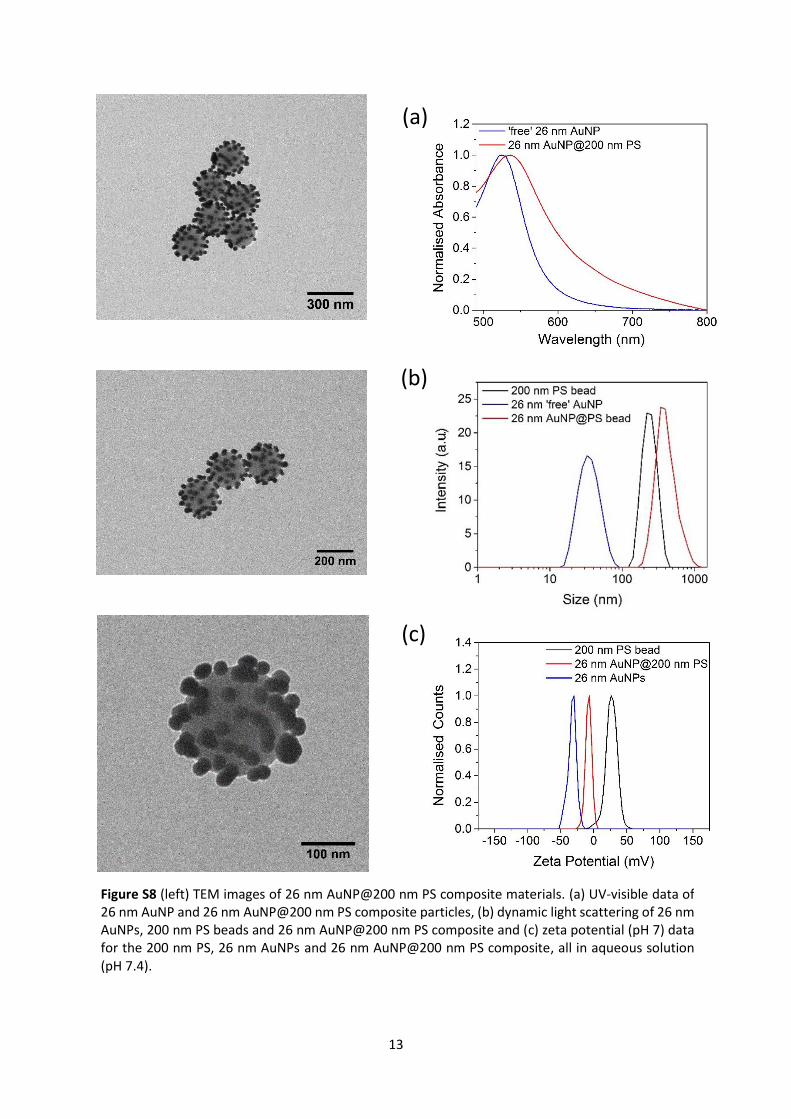
Figure S8 (left) TEM images of 26 nm AuNP@200 nm PS composite materials. (a) UV-visible data of 26 nm AuNP and 26 nm AuNP@200 nm PS composite particles, (b) dynamic light scattering of 26 nm AuNPs, 200 nm PS beads and 26 nm AuNP@200 nm PS composite and (c) zeta potential (pH 7) data for the 200 nm PS, 26 nm AuNPs and 26 nm AuNP@200 nm PS composite, all in aqueous solution (pH 7.4).
(a)
(b)
(c)
14
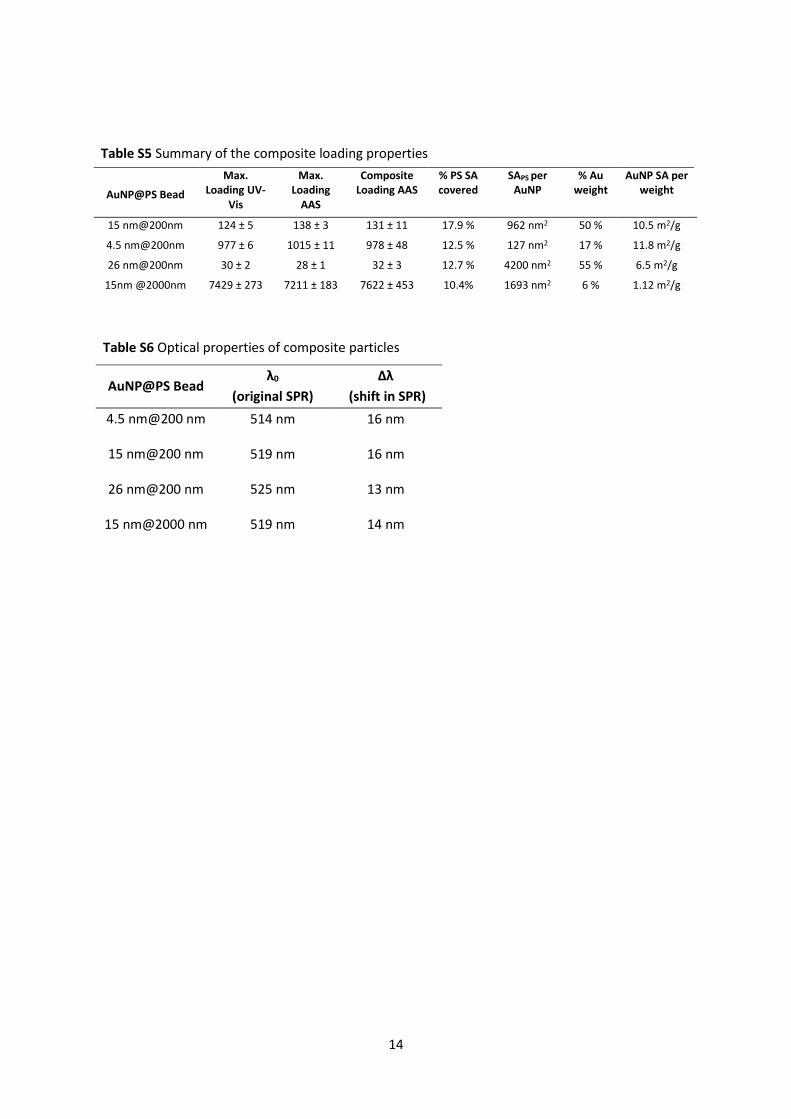
Table S5 Summary of the composite loading properties
AuNP@PS Bead
Max. Loading UV-
Vis
Max. Loading
AAS
Composite Loading AAS
% PS SA covered
SAPS per AuNP
% Au weight
AuNP SA per weight
15 nm@200nm 124 ± 5 138 ± 3 131 ± 11 17.9 % 962 nm2 50 % 10.5 m2/g
4.5 nm@200nm 977 ± 6 1015 ± 11 978 ± 48 12.5 % 127 nm2 17 % 11.8 m2/g
26 nm@200nm 30 ± 2 28 ± 1 32 ± 3 12.7 % 4200 nm2 55 % 6.5 m2/g
15nm @2000nm 7429 ± 273 7211 ± 183 7622 ± 453 10.4% 1693 nm2 6 % 1.12 m2/g
Table S6 Optical properties of composite particles
AuNP@PS Bead λ0
(original SPR)
Δλ
(shift in SPR)
4.5 nm@200 nm 514 nm 16 nm
15 nm@200 nm 519 nm 16 nm
26 nm@200 nm 525 nm 13 nm
15 nm@2000 nm 519 nm 14 nm
15
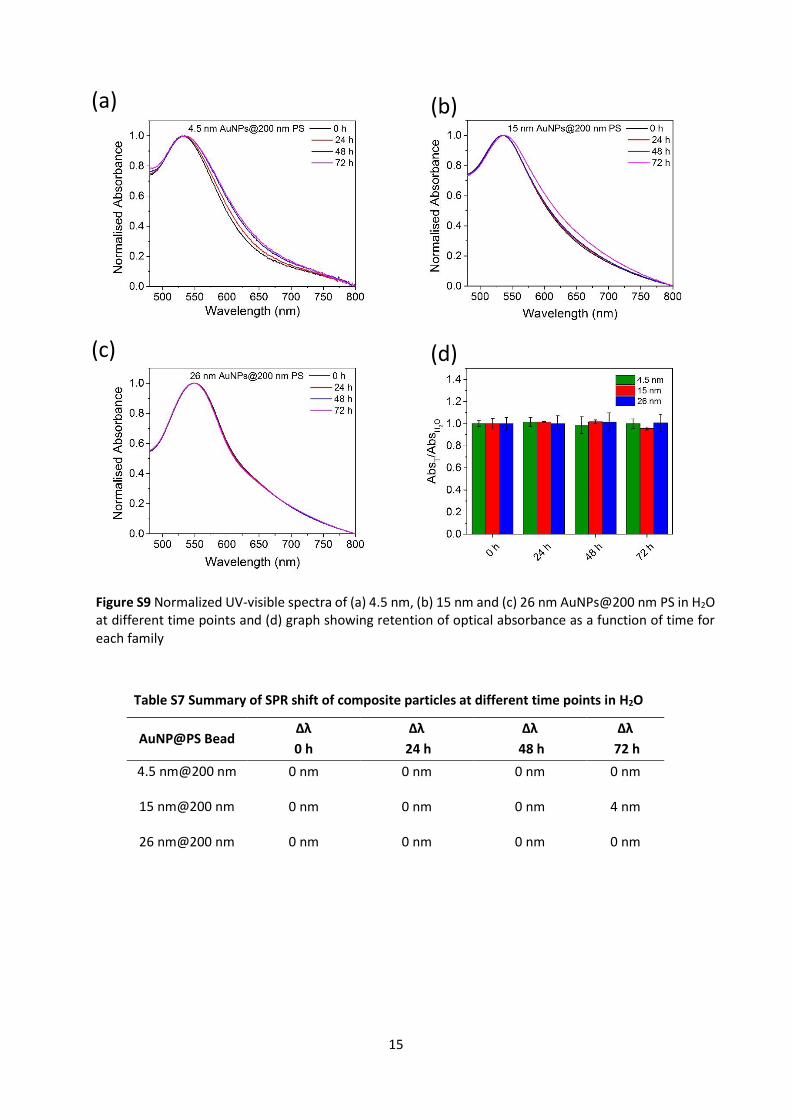
Table S7 Summary of SPR shift of composite particles at different time points in H2O
AuNP@PS Bead Δλ
0 h
Δλ
24 h
Δλ
48 h
Δλ
72 h
4.5 nm@200 nm 0 nm 0 nm 0 nm 0 nm
15 nm@200 nm 0 nm 0 nm 0 nm 4 nm
26 nm@200 nm 0 nm 0 nm 0 nm 0 nm
Figure S9 Normalized UV-visible spectra of (a) 4.5 nm, (b) 15 nm and (c) 26 nm AuNPs@200 nm PS in H2O at different time points and (d) graph showing retention of optical absorbance as a function of time for each family
(a)
(c) (d)
(b)
16
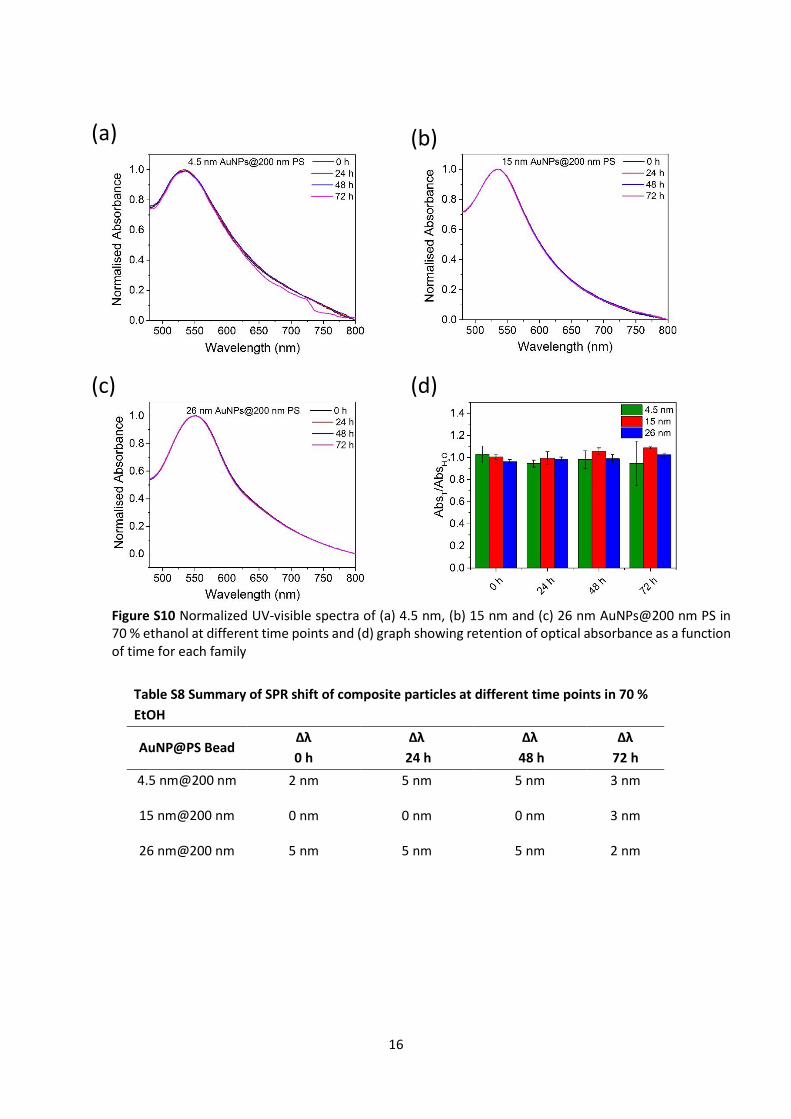
Table S8 Summary of SPR shift of composite particles at different time points in 70 %
EtOH
AuNP@PS Bead Δλ
0 h
Δλ
24 h
Δλ
48 h
Δλ
72 h
4.5 nm@200 nm 2 nm 5 nm 5 nm 3 nm
15 nm@200 nm 0 nm 0 nm 0 nm 3 nm
26 nm@200 nm 5 nm 5 nm 5 nm 2 nm
(a)
(c) (d)
(b)
Figure S10 Normalized UV-visible spectra of (a) 4.5 nm, (b) 15 nm and (c) 26 nm AuNPs@200 nm PS in 70 % ethanol at different time points and (d) graph showing retention of optical absorbance as a function of time for each family
17
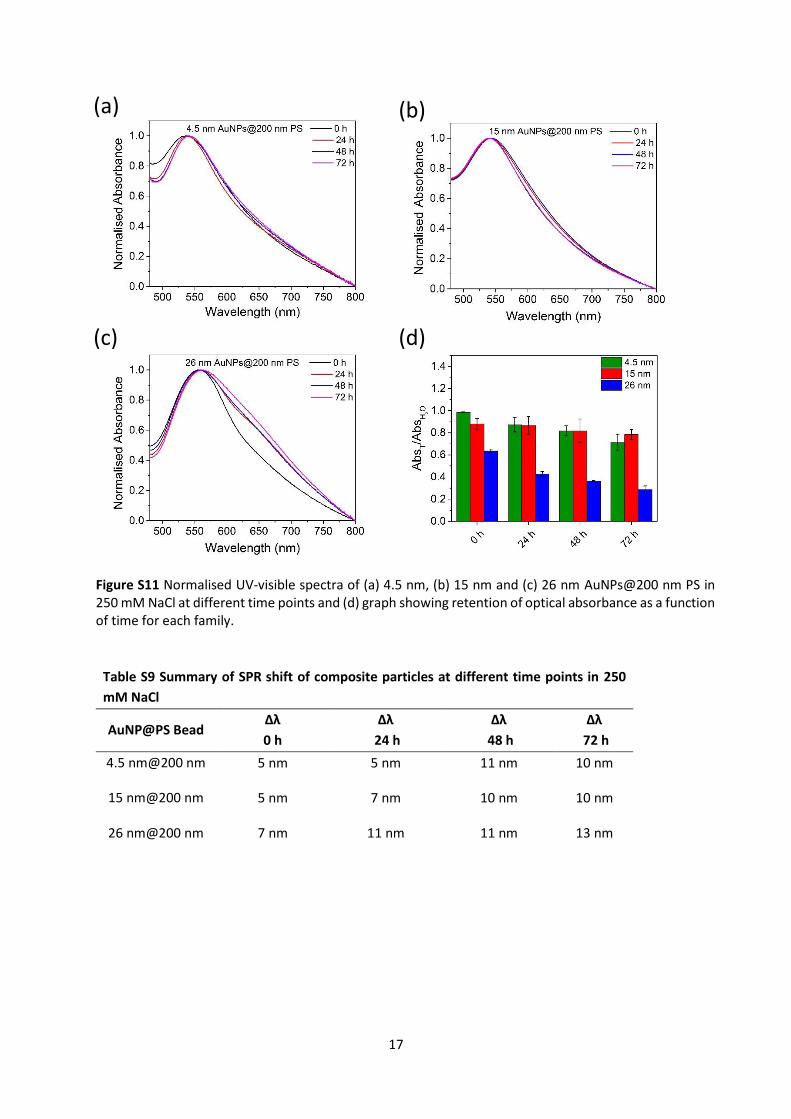
Table S9 Summary of SPR shift of composite particles at different time points in 250
mM NaCl
AuNP@PS Bead Δλ
0 h
Δλ
24 h
Δλ
48 h
Δλ
72 h
4.5 nm@200 nm 5 nm 5 nm 11 nm 10 nm
15 nm@200 nm 5 nm 7 nm 10 nm 10 nm
26 nm@200 nm 7 nm 11 nm 11 nm 13 nm
(a)
(c) (d)
(b)
Figure S11 Normalised UV-visible spectra of (a) 4.5 nm, (b) 15 nm and (c) 26 nm AuNPs@200 nm PS in 250 mM NaCl at different time points and (d) graph showing retention of optical absorbance as a function of time for each family.

18
Table S10 Summary of SPR shift of composite particles at different time points in
350 mM NaCl
AuNP@PS Bead Δλ
0 h
Δλ
24 h
Δλ
48 h
4.5 nm@200 nm 0 nm 6 nm 11 nm
15 nm@200 nm 5 nm 11 nm 11 nm
26 nm@200 nm 8 nm 9 nm 10 nm
(a) (b)
(c) (d)
Figure S12 Normalised UV-visible spectra of (a) 4.5 nm, (b) 15 nm and (c) 26 nm AuNPs@200 nm PS in 350 mM NaCl at different time points and (d) graph showing retention of optical absorbance as a function of time for each family.
19
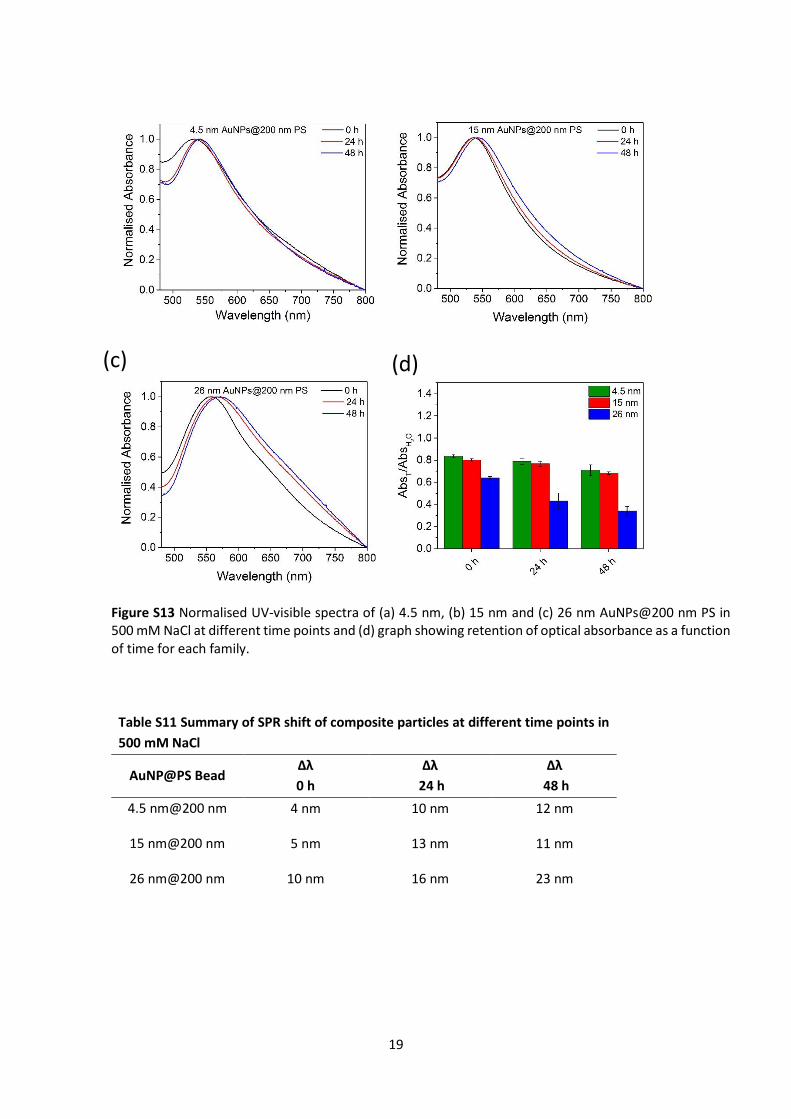
Table S11 Summary of SPR shift of composite particles at different time points in
500 mM NaCl
AuNP@PS Bead Δλ
0 h
Δλ
24 h
Δλ
48 h
4.5 nm@200 nm 4 nm 10 nm 12 nm
15 nm@200 nm 5 nm 13 nm 11 nm
26 nm@200 nm 10 nm 16 nm 23 nm
(c) (d)
Figure S13 Normalised UV-visible spectra of (a) 4.5 nm, (b) 15 nm and (c) 26 nm AuNPs@200 nm PS in 500 mM NaCl at different time points and (d) graph showing retention of optical absorbance as a function of time for each family.
20
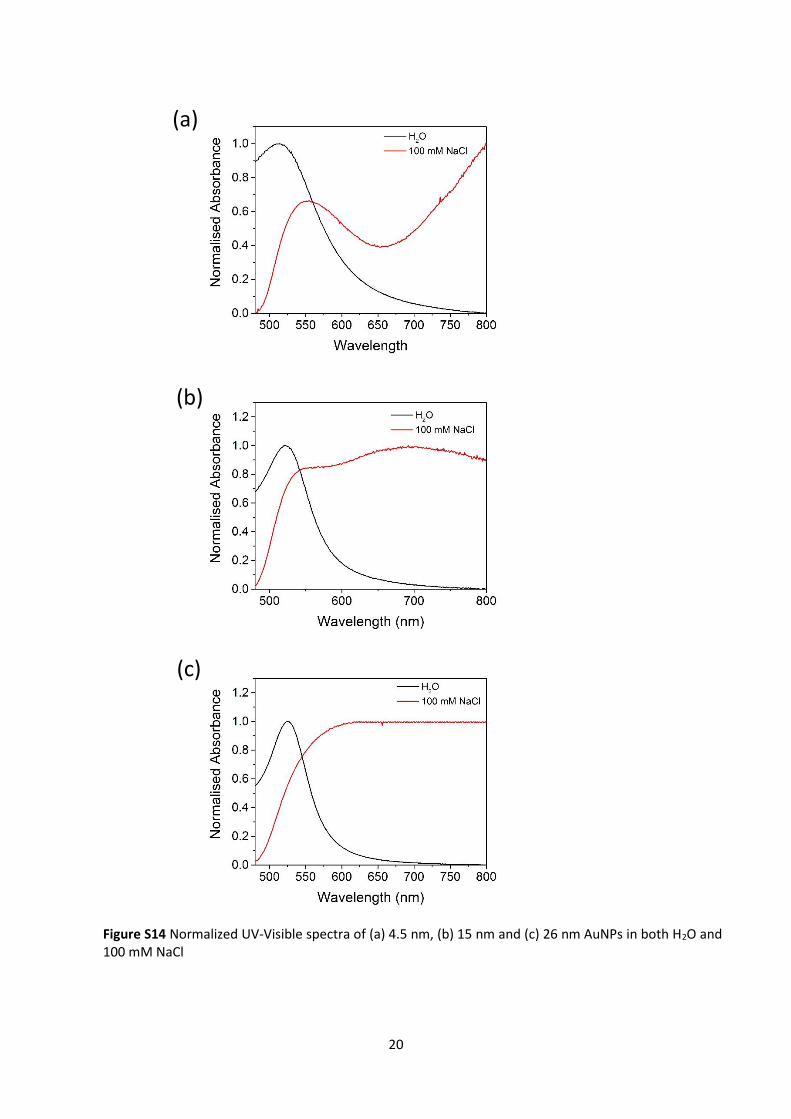
Figure S14 Normalized UV-Visible spectra of (a) 4.5 nm, (b) 15 nm and (c) 26 nm AuNPs in both H2O and 100 mM NaCl
(a)
(b)
(c)
21
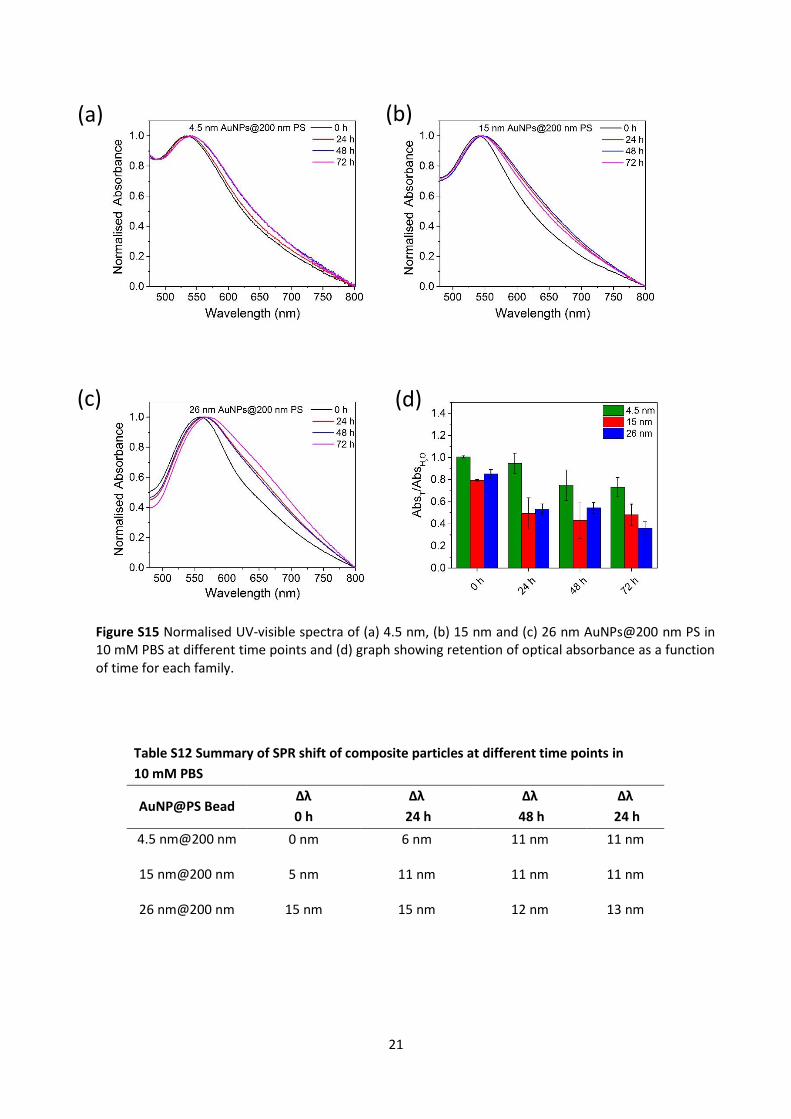
Table S12 Summary of SPR shift of composite particles at different time points in
10 mM PBS
AuNP@PS Bead Δλ
0 h
Δλ
24 h
Δλ
48 h
Δλ
24 h
4.5 nm@200 nm 0 nm 6 nm 11 nm 11 nm
15 nm@200 nm 5 nm 11 nm 11 nm 11 nm
26 nm@200 nm 15 nm 15 nm 12 nm 13 nm
(a) (b)
(c) (d)
Figure S15 Normalised UV-visible spectra of (a) 4.5 nm, (b) 15 nm and (c) 26 nm AuNPs@200 nm PS in 10 mM PBS at different time points and (d) graph showing retention of optical absorbance as a function of time for each family.
22
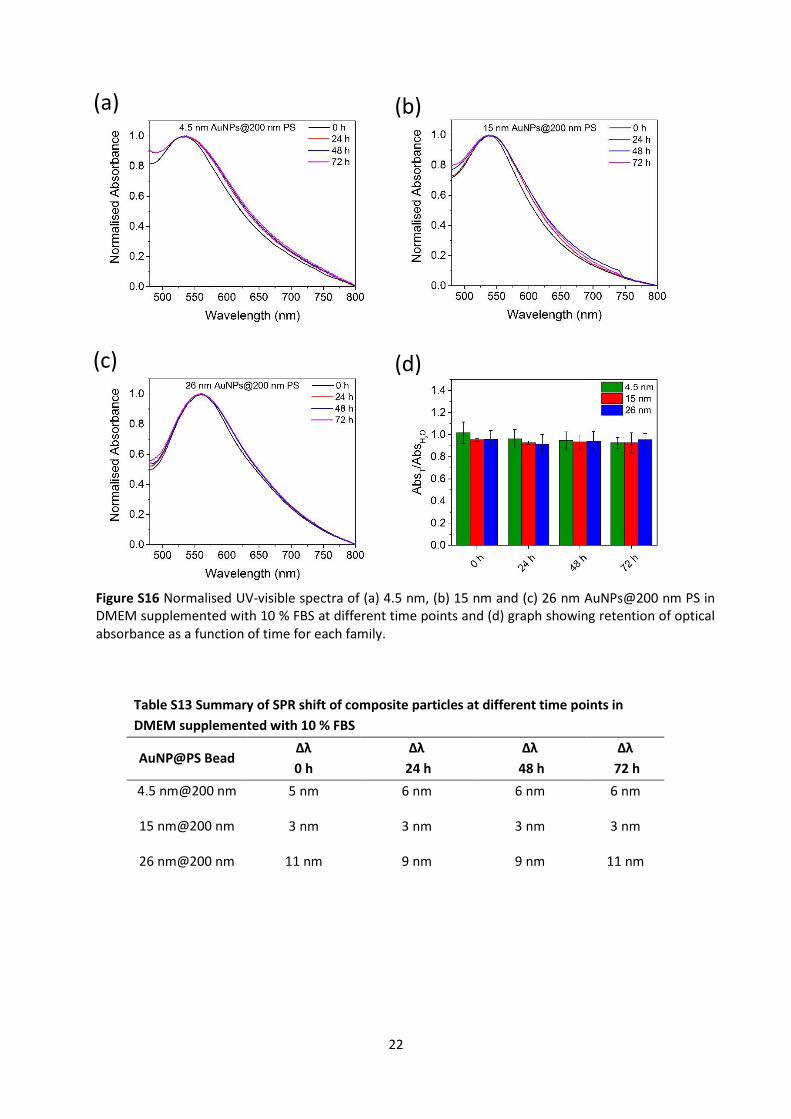
Table S13 Summary of SPR shift of composite particles at different time points in
DMEM supplemented with 10 % FBS
AuNP@PS Bead Δλ
0 h
Δλ
24 h
Δλ
48 h
Δλ
72 h
4.5 nm@200 nm 5 nm 6 nm 6 nm 6 nm
15 nm@200 nm 3 nm 3 nm 3 nm 3 nm
26 nm@200 nm 11 nm 9 nm 9 nm 11 nm
(a) (b)
(c) (d)
Figure S16 Normalised UV-visible spectra of (a) 4.5 nm, (b) 15 nm and (c) 26 nm AuNPs@200 nm PS in DMEM supplemented with 10 % FBS at different time points and (d) graph showing retention of optical absorbance as a function of time for each family.
23
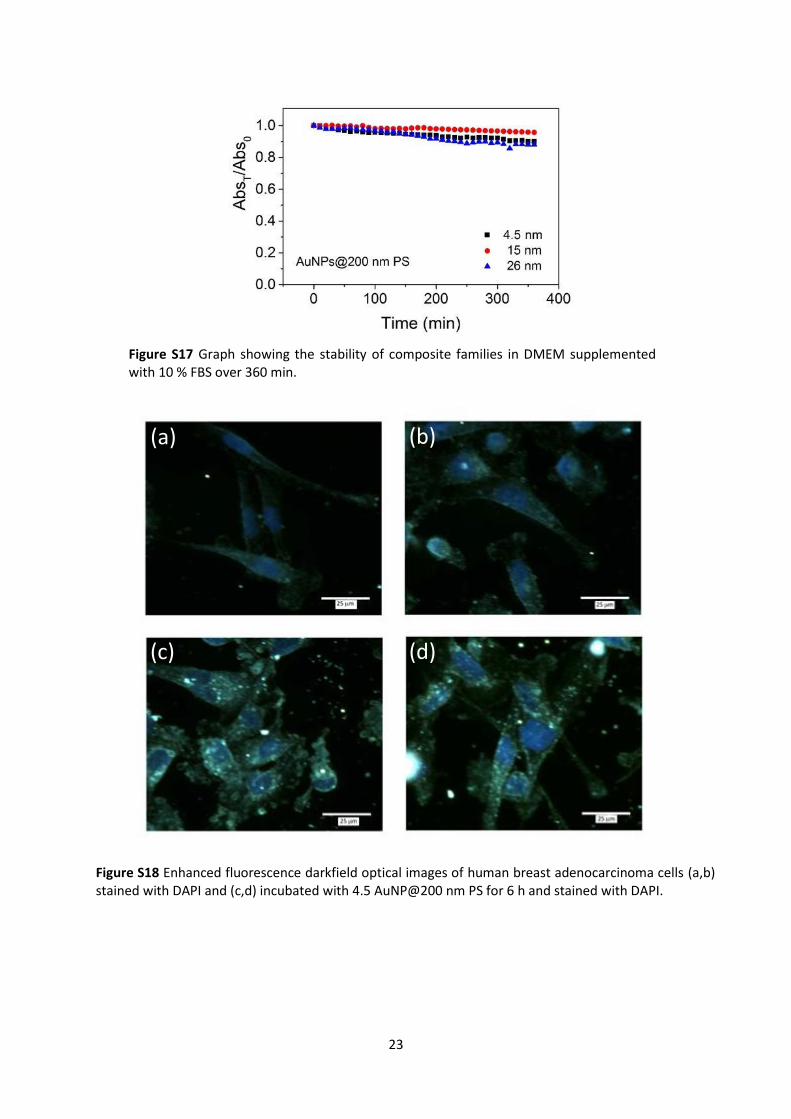
Figure S17 Graph showing the stability of composite families in DMEM supplemented with 10 % FBS over 360 min.
Figure S18 Enhanced fluorescence darkfield optical images of human breast adenocarcinoma cells (a,b) stained with DAPI and (c,d) incubated with 4.5 AuNP@200 nm PS for 6 h and stained with DAPI.
(a) (b)
(c) (d)
24
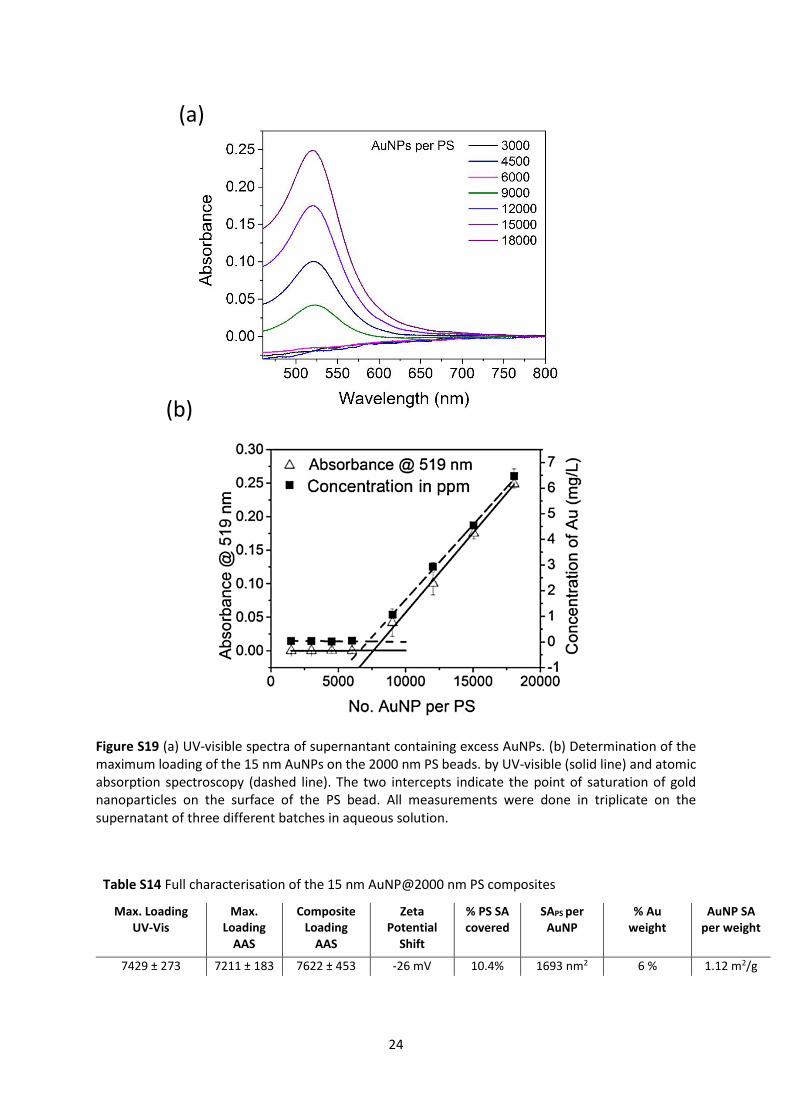
Figure S19 (a) UV-visible spectra of supernantant containing excess AuNPs. (b) Determination of the maximum loading of the 15 nm AuNPs on the 2000 nm PS beads. by UV-visible (solid line) and atomic absorption spectroscopy (dashed line). The two intercepts indicate the point of saturation of gold nanoparticles on the surface of the PS bead. All measurements were done in triplicate on the supernatant of three different batches in aqueous solution.
Table S14 Full characterisation of the 15 nm AuNP@2000 nm PS composites
Max. Loading UV-Vis
Max. Loading
AAS
Composite Loading
AAS
Zeta Potential
Shift
% PS SA covered
SAPS per AuNP
% Au weight
AuNP SA per weight
7429 ± 273 7211 ± 183 7622 ± 453 -26 mV 10.4% 1693 nm2 6 % 1.12 m2/g
(a)
(b)
25
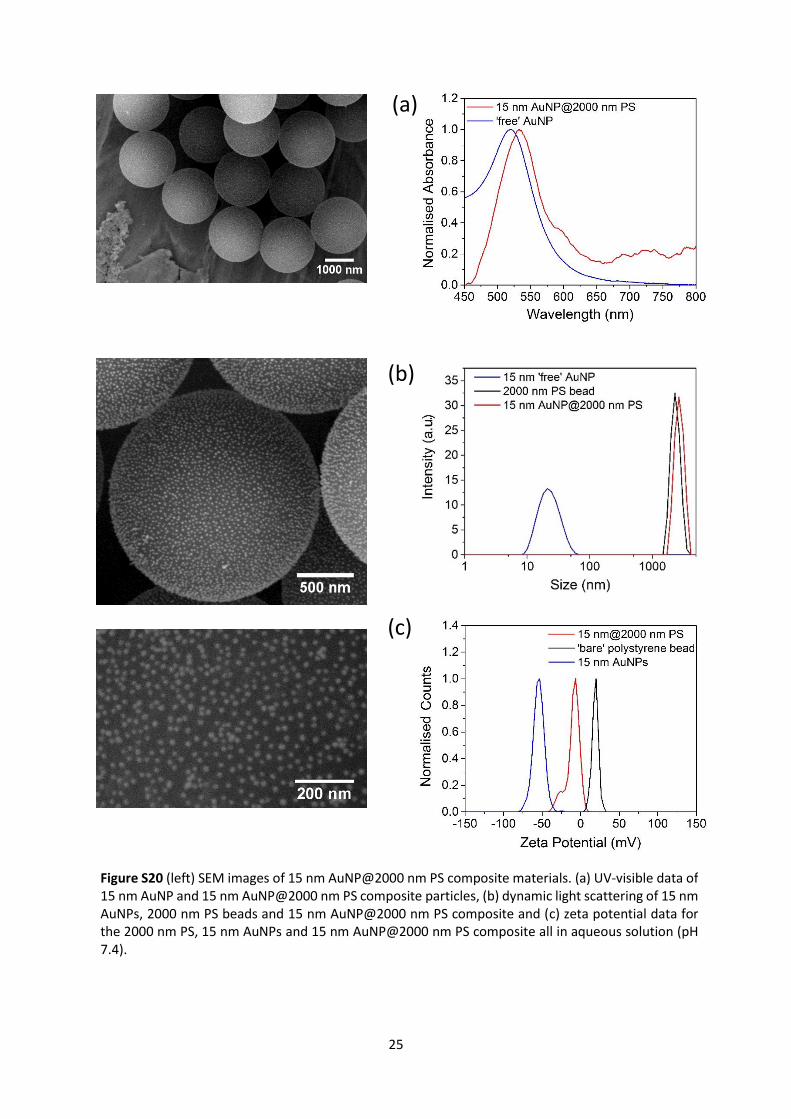
Figure S20 (left) SEM images of 15 nm AuNP@2000 nm PS composite materials. (a) UV-visible data of 15 nm AuNP and 15 nm AuNP@2000 nm PS composite particles, (b) dynamic light scattering of 15 nm AuNPs, 2000 nm PS beads and 15 nm AuNP@2000 nm PS composite and (c) zeta potential data for the 2000 nm PS, 15 nm AuNPs and 15 nm AuNP@2000 nm PS composite all in aqueous solution (pH 7.4).
(a)
(b)
(c)
26
References
1 N. Jana, L. Gearheart and C. Murphy, Langmuir, 2001, 17, 6782–6786.
2 N. G. Bastús, J. Comenge and V. Puntes, Langmuir, 2011, 27, 11098–11105.
3 X. Liu, M. Atwater, J. Wang and Q. Huo, Colloids Surfaces B Biointerfaces, 2007, 58, 3–7.
4 S. Panigrahi, S. Basu, S. Praharaj, S. Pande, S. Jana, A. Pal, S. K. Ghosh and T. Pal, J. Phys. Chem. C, 2007, 111, 4596–4605.
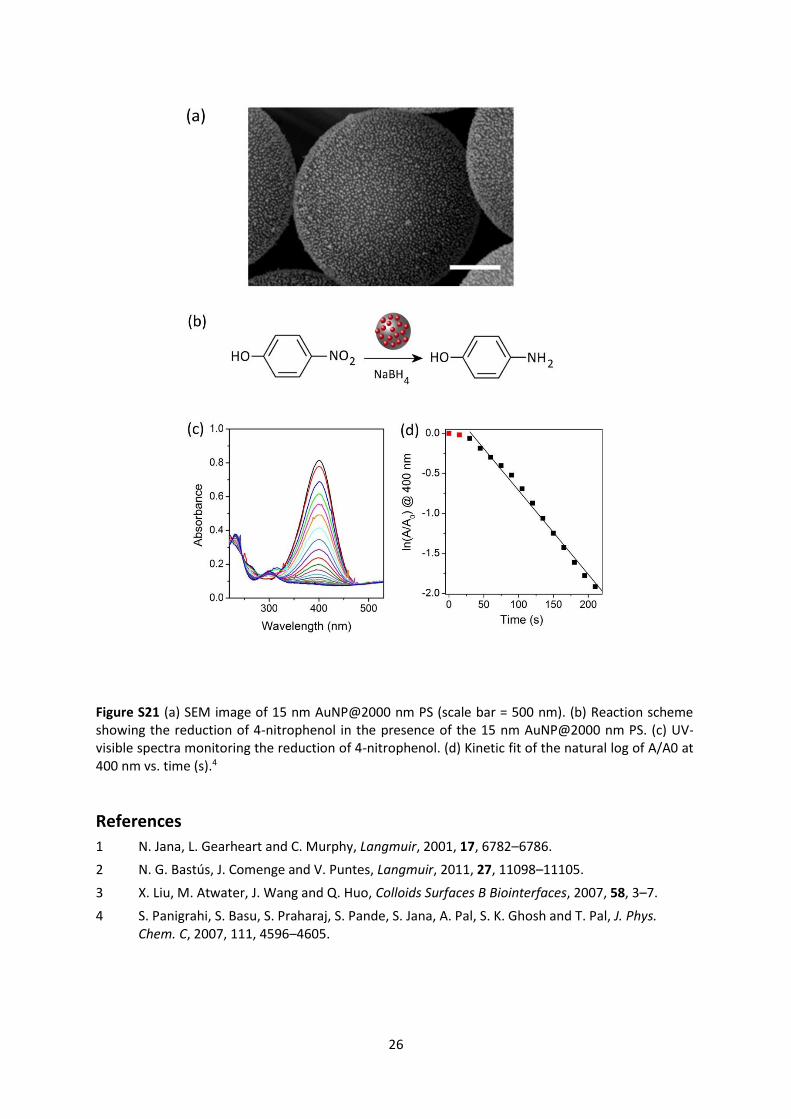
Figure S21 (a) SEM image of 15 nm AuNP@2000 nm PS (scale bar = 500 nm). (b) Reaction scheme showing the reduction of 4-nitrophenol in the presence of the 15 nm AuNP@2000 nm PS. (c) UV-visible spectra monitoring the reduction of 4-nitrophenol. (d) Kinetic fit of the natural log of A/A0 at 400 nm vs. time (s).4