Embed Size (px)
Citation preview
2010 Resource Entitlement Statement and
Supporting Information
Produced by: Site Finance and Resource Services
Version: 1.1 P
Issue Date: June 2011
`
2010 Resource Entitlement Statement Notes and Supporting Information – 9 November 2010 i
Table of Contents
INTRODUCTION ............................................................................................................................ 1
ANNUAL BUDGET CYCLE ........................................................................................................... 2
Service Standards for School Funding 2
RESOURCE ENTITLEMENT STATEMENT .................................................................................. 3
Industrial Entitlements 3
Commonwealth and State Government Initiatives 3
Discretionary Allocations 4
EQUITY FUNDING ......................................................................................................................... 5
Aboriginal Education funding 5
Aboriginal Education Teachers (AETs) .............................................................................. 5
Aboriginal Community Education Officers (ACEO) ........................................................... 5
Accountability Statement for Aboriginal Students ............................................................... 5
Students with Disabilities 6
Per-Capita Disability Categories ........................................................................................ 7
Staffing Formula Categories ............................................................................................... 8
Regional Disabilities Supplementary Funding .................................................................... 9
English as a Second Language (ESL) 9
Assessment of a Student’s Language Skills using the ESL Scales ..................................... 10
Recording and Checking ................................................................................................... 11
Support Available from Regional ESL Consultants........................................................... 11
ESL Support Categories .................................................................................................... 11
NAP eligible students ........................................................................................................ 12
Low Socio-Economic Background Funding 13
Index of Educational Disadvantage .................................................................................. 13
Other Low Socio-Economic Funding ................................................................................ 14
Rural and Isolated Students 14
RESOURCE ALLOCATION ADJUSTMENT PANEL .................................................................. 16
RESOURCE ENTITLEMENT STATEMENT STRUCTURE ......................................................... 17
Part 1: Teaching Staff 17
Industrial Entitlement (Tier 1 Teacher Staffing Allocation) .............................................. 17

2010 Resource Entitlement Statement Notes and Supporting Information – 9 November 2010 ii
Commonwealth and State Government Initiatives ............................................................ 18
Part 2: Ancillary Staffing 20
Industrial Entitlement ........................................................................................................ 20
Commonwealth and State Government Initiatives ............................................................ 21
Part 3: Child Parent Centres (CPCs) 22
Part 4: Grants 22
Part 5: Utilities & Maintenance 26
Part 6: Supplementations 28
2010 STANDARD SALARY RATES ............................................................................................ 29

2010 Resource Entitlement Statement Notes and Supporting Information – 9 November, 2009 1
Introduction This is version 1.1 of a comprehensive package of information related to the 2010 Resource Entitlement Statement for Department of Education and Children’s Services (DECS) schools. Schools will be advised by email if new versions of this document become available. The 2010 Resource Entitlement Statement notes are one part of a total package of information available to all schools. Additional information including enrolment collection details and ‘questions and answers’ is available from the local school management web site.

2010 Resource Entitlement Statement Notes and Supporting Information – 9 November, 2009 2
Annual Budget Cycle Schools receive their Resource Entitlement Statement in the first week of Term 1 and relevant updates each year according to the following cycle:
Indicative Resource Entitlement Statement – Issued in February using enrolment projections in the SEA system as advised by schools.
Initial Unreconciled Resource Entitlement Statement – Issued in Week 1 Term 2 using phase 3 staffing enrolments in SEAS and Term 1 Disability Enrolment Census data.
Revised Unreconciled Resource Entitlement Statement – Updated Resource Entitlement Statements each term for items such as Students with Disabilities, Breakdown Maintenance, Supplementations, Terms 3 and 4 student intake for primary schools, etc.
Reconciled Resource Entitlement Statement – Updated Resource Entitlement Statement issued in December. Schools are required to sign off their RES each year by Week 8 of Term 4, thus agreeing to the accuracy of the RES.
Online versions of the Resource Entitlement Statement will be updated on a monthly basis for supplementations or approved adjustments. A net transfer to each school’s SASIF account will occur once a month, backdated to the first of the month. Cashflow Reports, Site Monthly Reports and Site Electronic Journals following the closure of the ledger are updated monthly and distributed electronically on the seventh working day of each month through FABSNet. Service Standards for School Funding As an interdependent system, the Budget Cycle is dependent on a number of inter-related processes between schools, regions and state office workgroups. In particular, it relies on the timely processing of accurate information between schools and state office. The following diagram represents the Mutual obligations in the development and update of the RES throughout the year.
To meet its commitment in achieving and sustaining high performance in service provision, DECS has developed Service Standards for School Funding. These service standards have been developed through a comprehensive process undertaken by leaders and key personnel from all three sections of the organisation, including the mapping of the optimum process for the delivery of a school funding service.

2010 Resource Entitlement Statement Notes and Supporting Information – 9 November, 2009 3
Resource Entitlement Statement The School Resource Entitlement Statement indicates the resources schools will receive for:
Industrial Entitlements (Authority of Certified Agreement) - the resources that are mandated as part of the Certified Agreement (from the enterprise bargaining process).
Commonwealth and State Government Initiatives (Authority of State & Commonwealth Ministers) - the resources required to support students with special needs and resources specific projects from both State and Commonwealth Governments.
Discretionary Allocations (Authority delegated to the Chief Executive of DECS) and Additional Approved Funding - discretionary allocations made to schools as part of the staffing process or in recognition of special circumstances such as power charges for those schools not on the electricity grid or those schools hosting other DECS offices.
Industrial Entitlements The Industrial Entitlements represent the main funding source for all schools and comprise approximately 85% of the total Resource Entitlement Statement. This funding is designed to cover the core teaching, and learning, leadership, teaching support, professional development, relief teaching, and the utility and breakdown maintenance costs for the school. The most significant cost incurred by schools is the staffing cost. Schools are provided with a total staffing allocation using a two-tiered staffing process. Tier 1 are industrial entitlements that provide teachers on the basis of the notional class units needed together with the support structures that enable every school to operate effectively. Tier 1 staffing includes:
basic teacher instruction time allocation
additional time for specific non-instructional duties (NIT)
leadership positions
administration time
library time
counselling time (Aboriginal, area, high schools and R-12 schools only)
4.25 hours of school support staff for each allocated teacher
Tier 1 allocations are all formula driven by student enrolment numbers. The formula provides an allocation of teachers so that:
No R-2 class need be, on average, greater than 26
No 3-7 class need be, on average, greater than 30
No 8-10 general class need be, on average, greater than 29
No 11-12 general class need be, on average, greater than 26
No 8-12 practical class need be, on average, greater than 18
In calculating the staffing entitlement of a secondary school and the secondary component of an area school, it is assumed that 50% of all classes are practical classes. Commonwealth and State Government Initiatives Commonwealth and State Government Initiatives are instigated to address the special needs of students. They are usually allocated to address social justice or equity issues. Some of the additional support is for:
Aboriginal Students
Students with Disabilities
English as a Second Language Students and New Arrivals Program Students
Students from a Low Socio-Economic Background

2010 Resource Entitlement Statement Notes and Supporting Information – 9 November, 2009 4
Rural and Isolated Students
Reducing Junior Primary Class Sizes
Additional Leadership Administration Time in Primary Schools
Secondary Mentoring Program
The Behavioural Management Program
Engineering Pathways Program
Schools hosting Ethnic Schools
Primary Counsellors
Students from Small Schools
Resources are allocated in the form of grants or staffing (usually Tier 2 staffing). Some types of Tier 2 salaries are formula generated (e.g. Open Access) whilst others are allocated on a needs basis according to the criteria relevant to the project. All Tier 2 salaries include non-instruction time (NIT) allowances and some contribute towards the allocation of:
leadership time
administration time
temporary relieving teachers (TRTs)
school support staff for identified salaries
Discretionary Allocations Additional discretionary allocations may be made to schools as part of the staffing process or in recognition of special circumstances. The following groups make these discretionary allocations, under the authority delegated to the Chief Executive of DECS:
Resource Allocation Adjustment Panel allocates above staffing formula entitlements that reflect policy determinations, industrial requirements or agreed positions.
Site Human Resources adjusts school staffing allocations for a number of items that are outside the normal staffing formula. These are paid as supplementations.
Site Finance and Resource Services reimburses sites whenever Double Debiting has occurred or when sites receive incorrect charges.

2010 Resource Entitlement Statement Notes and Supporting Information – 9 November, 2009 5
Equity Funding Equity funding is an initiative by Government to provide additional support to reduce educational disparities between different groups and to address barriers to successfully participate in quality educational programmes. The main recipients of equity funding are:
Aboriginal Students
Students with Disabilities
English as a Second Language Students
Students from a Low Socio Economic Background and
Rural and Isolated Students.
Aboriginal Education funding Accountability requirements necessitate that Aboriginal funding provided by the Commonwealth Government identifies salaries for Aboriginal Education Teacher (AETs) and Aboriginal Education Workers (ACEOs). In 2005, the Resource Entitlement Statement reduced the impact of the previous step staffing formula whilst maintaining Commonwealth staffing accountability requirements. The Government’s expectations of how school principals will utilise funds provided for Aboriginal students are set out in the Accountability Statement for Aboriginal Students below. Aboriginal Education Teachers (AETs)
Aboriginal Education Teachers will be funded as part of the Whole school Literacy and Numeracy Improvement Funding allocation in 2010. Non-Aboriginal schools receive 0.2 FTE AET after 10 Aboriginal students, followed by another 0.2 FTE AET after the next 10 Aboriginal students and 0.008 FTE for every Aboriginal student thereafter (Aboriginal schools receive an equivalent entitlement through their staffing formula).
Aboriginal Community Education Officers (ACEO)
Schools will receive 0.7 hours per week of ACEO time for every Aboriginal student. Accountability Statement for Aboriginal Students
This section sets out the Government’s expectations on how school principals will utilise funds provided for Aboriginal students. The funding provided to schools in the Resource Entitlement Statement is conditional on the requirements of this statement being met by schools. OUTCOMES Schools strive for the highest possible learning outcomes for Aboriginal students. The specific aim is that the learning outcome measures for Aboriginal students will not be significantly different from that for other students. The plan for Aboriginal Education and the SACSA forms the basis for its achievement. Schools will meet the four dimensions of curriculum accountability as outlined in the “Curriculum Accountability Statement” under the SACSA Framework: 1. Constructing a curriculum based on the SACSA Framework, which is responsive to a diversity
of students. 2. Providing ongoing feedback to students based on a range of assessment strategies. 3. Implementing appropriate intervention and support programs based on an ongoing analysis of
learner achievement data. 4. Reporting the outcomes and the curriculum standards achieved to students, families and the
community. PROCESSES Schools will use resources allocated for Aboriginal students to put in place educational initiatives aimed at improving learning outcomes for these students.

2010 Resource Entitlement Statement Notes and Supporting Information – 9 November, 2009 6
Schools with 20 or more Aboriginal student enrolments must employ ACEOs and AETS to the allocation as indicated on the Resource Entitlement Statement.
Schools with less than 20 Aboriginal student enrolments will negotiate employment and programs to support Aboriginal learners with the regional Aboriginal Community Education Manager and the Manager State-wide Community Education. Where there is no regional Aboriginal Community Education Manager, the Principal should consult with the Manager State-wide Community Education who is an officer of Aboriginal Education and Employment Services.
INPUTS Funds provided for the education of Aboriginal students from both State and Commonwealth sources are required to be used for the education and support of Aboriginal students. The employment of Aboriginal people in schools is crucial to raising achievement and meeting Aboriginal employment targets. Schools with Aboriginal students are required to employ Aboriginal people at least to the level specified on their resource entitlement statement. Where possible, schools are strongly encouraged to exceed this requirement. Any variation to the minimum employment requirement must be negotiated with the Aboriginal Community Education Manager and the Manager State-wide Community Education. The Executive Director of Aboriginal Education and Employment Services must ratify the variation. It will be a mandatory reporting requirement for schools to acquit funds allocated for the employment of Aboriginal people. REPORTING The Department’s Framework for Quality, Improvement and Accountability requires that schools report student achievement data, including the achievement, retention and post school pathways of Aboriginal students. This report must be published in the school’s annual report, circulated to the school community and provided to the Personnel Advisory Committee in each school, the Executive Director, Aboriginal Education and Employment Services, the Regional Director and Data Management and Accountability. Schools may also be required to report against specific program resource allocation provided by both State and Commonwealth Governments.
Students with Disabilities There is a range of programs that provide support for students with disabilities. The Disability Support Program provides funding to support students who have one or more of the following seven specific disabilities.
Speech and/or Language Autistic Disorder/Asperger’s Disorder Global Developmental Delay Hearing Vision Physical Intellectual
The following Levels of Support are funded on a per-capita basis:
Mainstream A, ‘Additional’ level of support, $ 1,660 per full-time student
Mainstream D, ‘Direct’ level of support, $ 4,677 per full-time student
Mainstream I, ‘Intensive’ level of support, $ 10,410 per full-time student
High Sustained level of support, $ 23,100 per full-time student
Very High Sustained level of support, $ 36,757 per full-time student
Challenging Behaviours Category 1, students with disabilities with severe challenging behaviours requiring Category 1 support, $ 15,862 per FTE
Challenging Behaviours Category 2, students with disabilities with severe challenging behaviours requiring Category 2 support, $ 9,252 per FTE
Challenging Behaviours Category 3, students with disabilities with severe challenging behaviours requiring Category 3 support, $2,644 per FTE
2010 Resource Entitlement Statement Notes and Supporting Information – 9 November, 2009 7
The High Sustained level of support is costed at the staffing entitlement of 0.25 Teacher FTE plus 1.25 SSO hours per week per student. The Very High Sustained level of support is costed at the staffing entitlement of 0.125 Teacher FTE plus 20 SSO hours per week per student. The High Sustained and Very High Sustained levels of support per capita funding amounts are regardless of the enrolment setting. For Special Schools, schools with Special Units or Centres for Hearing Impaired Children, the resource entitlement for students eligible for ‘High Sustained’ level of support is included in the RES Teacher and SSO Industrial Entitlement. For Special Schools or schools with Special Units, the resource entitlement for students eligible for ‘Very High Sustained’ level of support is included in the RES Teacher and SSO Industrial Entitlement. The remaining disability categories are staffed on staffing formulas. Schools also receive funding in the Students with Learning Difficulties Grant line of their RES to support students who have significant learning difficulties. Per-Capita Disability Categories
MAINSTREAM A These are students with disabilities enrolled in a mainstream setting who have been identified as eligible to receive the ‘Additional’ level of support. The school, in consultation with the Manager, Regional Support Services has identified students receiving this level of support as part of the Negotiated Education Plan. Source of data: EDSAS codes: Disability flag = Y, and Census Year Level = RE, 01, 02, 03, 04, 05, 06, 07, 08, 09, 10, 11, 12, PU, SU, PL, SL, SP, or SR, and Current Level of Support = A. MAINSTREAM D These are students with disabilities enrolled in a mainstream setting who have been identified as eligible to receive the ‘Direct’ Level of Support. The school, in consultation with the Manager, Regional Support Services has identified students receiving this level of support as part of the Negotiated Education Plan. Source of data: EDSAS codes: Disability flag = Y, and Census Year Level = RE, 01, 02, 03, 04, 05, 06, 07, 08, 09, 10, 11, 12, PU, SU, PL, SL, SP, or SR, and Current Level of Support = D. MAINSTREAM I These are students with disabilities enrolled in a mainstream setting who have been identified as eligible to receive the ‘Intensive’ Level of Support. The school, in consultation with the Manager, Regional Support Services has identified students receiving this level of support as part of the Negotiated Education Plan. Source of data: EDSAS codes: Disability flag = Y, and Census Year Level = RE, 01, 02, 03, 04, 05, 06, 07, 08, 09, 10, 11, 12, PU, SU, PL, SL, SP, or SR, and Current Level of Support = I. HIGH SUSTAINED These students have been endorsed or identified in writing by one of the two consultant guidance officers – Vision Impairment or Hearing Impairment, from the Statewide Verification and Professional Support Team as being eligible for the ‘High Sustained’ level of support. Note: This level of support is only for those students endorsed as described above and thus does not apply to all students with sensory impairments.
2010 Resource Entitlement Statement Notes and Supporting Information – 9 November, 2009 8
Source of data: EDSAS codes: Disability flag = Y, and Current Level of Support = H. VERY HIGH SUSTAINED These students have been identified as having severe multiple disabilities. The students have been endorsed/reviewed in writing by an officer from the Statewide Verification and Professional Support Team as being eligible for the ‘Very High Sustained’ Level of Support. Source of data: EDSAS codes: Disability flag = Y, and Current Level of Support = V. CHALLENGING BEHAVIOURS FUNDING (DISABILITY ONLY) The process for deciding on eligibility for Challenging Behaviours funding remained unchanged. That is, the Statewide Management Group – Students with Disabilities with Severe Challenging Behaviours identifies students with disabilities with severe challenging behaviours who are eligible for support from the program through a statewide process. Schools are informed of students eligible for funding in January. Note: The three categories ranging from category 1 high level support to category 3 are mutually exclusive – an individual student can appear in only one category in any single census collection. Source of data: It has been determined that students eligible for this level of funding will not be identified in EDSAS data due to the short term nature of the funding allocation. The data will instead be reported from a central data source held by Disability & Statewide Programs. CHALLENGING BEHAVIOURS FUNDING CATEGORY 1 Students have been identified and recommended by Regional Support Group –Students with Disabilities with Severe Challenging Behaviours as requiring Category 1 support. CHALLENGING BEHAVIOURS FUNDING CATEGORY 2 Students have been identified and recommended by Regional Support Group –Students with Disabilities with Severe Challenging Behaviours as requiring Category 2 support. CHALLENGING BEHAVIOURS FUNDING CATEGORY 3 Students have been identified and recommended by Regional Support Group –Students with Disabilities with Severe Challenging Behaviours as requiring Category 3 support. Staffing Formula Categories
SPECIAL SCHOOLS/UNITS – METRO These are students with disabilities enrolled in a special school or in a special unit. The staffing entitlement for each student is 0.125 Teacher FTE and 1.5 SSO hours/week. This category has been maintained as a staffing entitlement to ensure correct leadership allocation. Source of data: EDSAS codes: Disability flag = Y, and Census Year Level = PD, PS, PM, SD, SS, or SM and Current Level of Support = N and is NOT EQUAL to H or V. SPECIAL SCHOOLS/UNITS – COUNTRY These are students with disabilities enrolled in a Special School or in a Special Unit in a country location. The staffing entitlement for each student is 0.125 Teacher FTE and 2.5 SSO hours/week. This category has been maintained as a staffing entitlement to ensure correct leadership allocation. Source of data: EDSAS codes: Disability flag = Y, and Census Year Level = PD, PS, PM, SD, SS, or SM and Current Level of Support = N and is NOT EQUAL to H or V. SPECIAL SCHOOLS/UNITS – HIGH SUSTAINED These are students with disabilities enrolled in a Special School or in a Special Unit with an approved “High Sustained” level of support. The staffing entitlement for each student is 0.25 Teacher FTE and 1.25 SSO hours/week. Source of data: EDSAS codes: Disability flag = Y, and Census Year Level = PH, PV, SH, or SV, and Current Level of Support = H.
2010 Resource Entitlement Statement Notes and Supporting Information – 9 November, 2009 9
SPECIAL SCHOOLS/UNITS – VERY HIGH SUSTAINED These are students with disabilities enrolled in a Special School or in a Special Unit with an approved “Very High Sustained” level of support. The staffing entitlement for each student is 0.125 Teacher FTE and 20 SSO hours/week. Source of data: EDSAS codes: Disability flag = Y, and Census Year Level = PZ or SZ, and Current Level of Support = V. SPECIAL CLASS These are students with disabilities enrolled in a designated Special Class placement (includes students in language and communication classes). The school, in consultation with the Manager, Regional Support Services has negotiated Special Class placements for these students as part of the Negotiated Education Plan. The staffing entitlements for a full time Special Class is as follows:
Junior Primary Special Class = 1.1 Teacher FTE and 12 SSO hours/week for 8 students
Primary Special Class = 1.1 Teacher FTE and 10 SSO hours/week for 12 students
Secondary Special Class = 1.2 Teacher FTE and 10 SSO hours/week for 12 students
Language & Communication Class = 1.1 Teacher FTE and 15 SSO hours/week for 8 students
Disabilities and Statewide Programs maintain a central database of students in Special Classes to enable validation of Special Class enrolments. Source of data: EDSAS codes: Disability flag = Y, and Census Year Level = PC or SC, and Current Level of Support NOT EQUAL to H or V. Regional Disabilities Supplementary Funding
Regions have a targeted pool of funding for specific program support for students with disabilities. This funding is allocated through the Regional Disability Coordinators to enable short and medium term program development and delivery for individual students with complex and high level needs. Principals may contact their school’s Regional Disability Coordinator about this resource. English as a Second Language (ESL) ESL is funded as part of the Whole School Literacy and Numeracy Improvement Funding allocation in 2010. ESL funding is based on a “gap” model, where ESL support category, and hence ESL allocations are determined by the gap between the language level required for curriculum success at each year level of schooling and a student’s language level. The ESL Scales continue to be used as the tool for assessing students’ language levels. ESL allocations are provided to support ESL students learning Standard Australian English to a level required at their respective year level of schooling. ESL students are defined within EDSAS as having a non-English speaking background. They include Aboriginal or Torres Strait Islander (ATSI) students who speak an ATSI language, including Aboriginal English. Aboriginal ESL students in Anangu schools are not eligible for this ESL funding. All students identified on EDSAS as Aboriginal or Torres Strait Islander currently receive targeted funds to support improved learning outcomes and the development of appropriate intervention strategies. ESL allocations are provided only to those Aboriginal students who are clearly learning English as a second language or dialect. Refer ESL website www.decs.sa.gov.au/curric/pages/ESL under ESL funding/Aboriginal ESL or please contact the Aboriginal Education Coordinator in the relevant Regional Office for advice on identifying Aboriginal students as ESL students. ESL allocations apply to students who are permanent residents and most categories of temporary residents. Exchange students, full-fee paying international students and some other categories of short-term temporary visa holders are not included. A current ESL Scale must be entered for each ESL learner.
2010 Resource Entitlement Statement Notes and Supporting Information – 9 November, 2009 10
Assessment of a Student’s Language Skills using the ESL Scales
To determine students’ ESL support category, assessment of students’ language skills using the ESL Scales is required (refer Table 2 below). ESL Scales information for all students should be updated at least annually or when a student’s language level progresses to ensure allocations are based on current need. EDSAS records ESL Scales history in order to support schools to track ESL learner progress. All teachers should be monitoring their ESL students’ achievement against the ESL Scales continuously as part of their teaching and learning program throughout the year, rather than basing a judgement on a small sample of student work. ASSESSMENT PROCESS FOR THE MID-YEAR CENSUS Schools are required to ensure assessment and moderation processes are in place, and the ESL Scope and Scales and Moderated Evidence (refer www.sacsa.sa.edu.au/eslevidence/) support this. Where possible, it is recommended that the ESL teacher supports a group of teachers to work together to assess student work and use the ESL Scales to develop appropriate curriculum and intervention strategies. In schools with Aboriginal ESL students, the Aboriginal Education Teacher (AET) may also provide leadership in working with a group of teachers. The process described below will assist in accurate and consistent assessment of ESL students’ need. The evidence gathered will give an indication only of the students’ language levels.
Collect evidence of student achievement. Evidence may include spoken, written or multimedia texts and/or teacher observation notes on students’ texts.
For students in the early years it is important that the ESL Scale is primarily based on evidence of oral language performance. An oral language assessment rubric is available at www.decs.sa.gov.au/curric/pages/ESL (ESL Scope and Scales/Resources & PD)
Select a minimum of two examples of evidence, preferably from different learning areas or ESL as a subject. Ensure that samples of the student’s work represent the student’s best independent effort and are from a scaffolded teaching and learning program that supports the student’s understanding of the required genre and its language features. Task requirements and assessment criteria should be explicit.
As a guide choose one text from the genres in Column A and the other from Column B.
Column A Column B Narrative Recount Procedure
Argument Discussion Report Explanation Review/Critical response
Note: Two examples of evidence will not be sufficient to demonstrate achievement of a Scale. They will show evidence contributing to achievement of a Scale.
Assess each sample of evidence according to criteria in the ESL Scales and determine the ESL Scales for each set of evidence.
Ensure the assessment of need is consistent, particularly in relation to other data sources, by:
- comparing with students’ SACSA outcomes and Standards achievement data using SAS
- comparing with NAPLaN data (refer ESL website, under ESL Scope and Scales/ESL Scales and NAPLaN for a table comparing the ESL Scales with the NAPLaN bands)
- referring to the ESL Scope and Scales Moderated Evidence material: www.sacsa.sa.edu.au/eslevidence/
2010 Resource Entitlement Statement Notes and Supporting Information – 9 November, 2009 11
- participating in moderation processes, intra or inter school, with a group of teachers, supported by regional ESL Consultants.
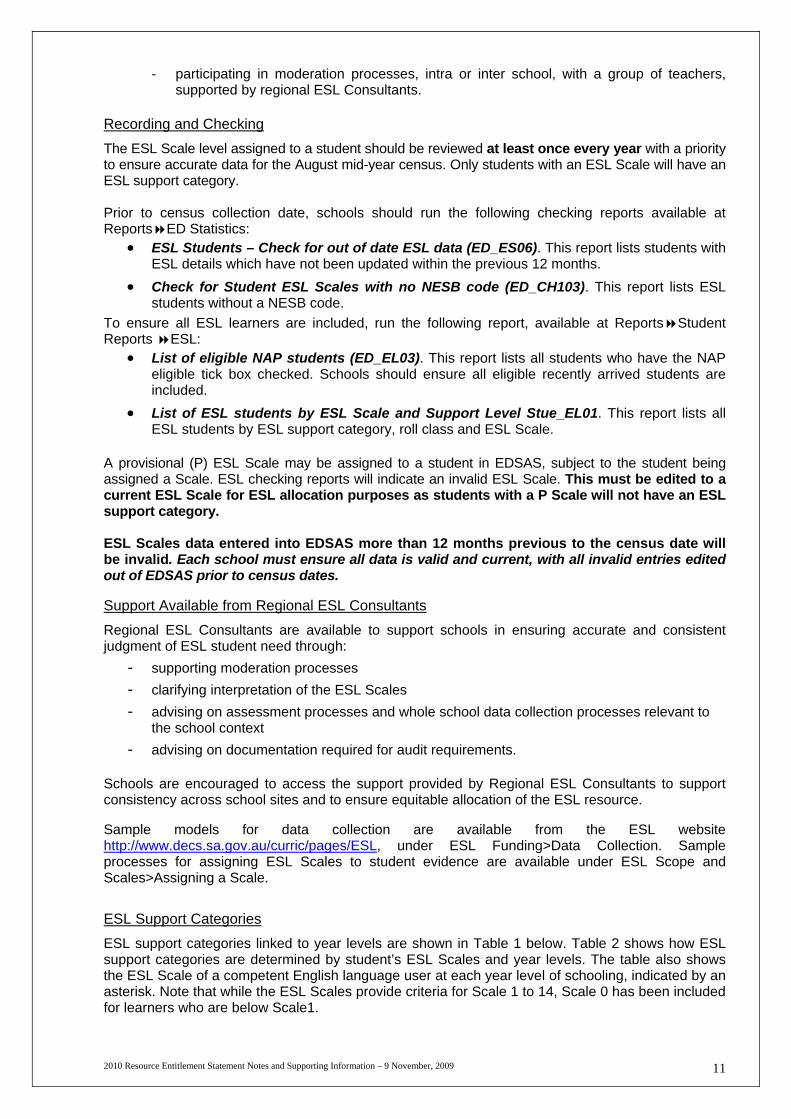
Recording and Checking
The ESL Scale level assigned to a student should be reviewed at least once every year with a priority to ensure accurate data for the August mid-year census. Only students with an ESL Scale will have an ESL support category. Prior to census collection date, schools should run the following checking reports available at ReportsED Statistics:
ESL Students – Check for out of date ESL data (ED_ES06). This report lists students with ESL details which have not been updated within the previous 12 months.
Check for Student ESL Scales with no NESB code (ED_CH103). This report lists ESL students without a NESB code.
To ensure all ESL learners are included, run the following report, available at ReportsStudent Reports ESL:
List of eligible NAP students (ED_EL03). This report lists all students who have the NAP eligible tick box checked. Schools should ensure all eligible recently arrived students are included.
List of ESL students by ESL Scale and Support Level Stue_EL01. This report lists all ESL students by ESL support category, roll class and ESL Scale.
A provisional (P) ESL Scale may be assigned to a student in EDSAS, subject to the student being assigned a Scale. ESL checking reports will indicate an invalid ESL Scale. This must be edited to a current ESL Scale for ESL allocation purposes as students with a P Scale will not have an ESL support category. ESL Scales data entered into EDSAS more than 12 months previous to the census date will be invalid. Each school must ensure all data is valid and current, with all invalid entries edited out of EDSAS prior to census dates. Support Available from Regional ESL Consultants
Regional ESL Consultants are available to support schools in ensuring accurate and consistent judgment of ESL student need through:
- supporting moderation processes
- clarifying interpretation of the ESL Scales
- advising on assessment processes and whole school data collection processes relevant to the school context
- advising on documentation required for audit requirements. Schools are encouraged to access the support provided by Regional ESL Consultants to support consistency across school sites and to ensure equitable allocation of the ESL resource. Sample models for data collection are available from the ESL website http://www.decs.sa.gov.au/curric/pages/ESL, under ESL Funding>Data Collection. Sample processes for assigning ESL Scales to student evidence are available under ESL Scope and Scales>Assigning a Scale.
ESL Support Categories
ESL support categories linked to year levels are shown in Table 1 below. Table 2 shows how ESL support categories are determined by student’s ESL Scales and year levels. The table also shows the ESL Scale of a competent English language user at each year level of schooling, indicated by an asterisk. Note that while the ESL Scales provide criteria for Scale 1 to 14, Scale 0 has been included for learners who are below Scale1.

2010 Resource Entitlement Statement Notes and Supporting Information – 9 November, 2009 12
Table 1: ESL support categories
Band Year level Support category
Early Years R - 2 E1 to E4
Primary Years 3 - 5 P1 to P5
Middle Years 6 - 9 M1 to M7
Senior Years 10 - 12 S1 to S7
Table 2: ESL support categories based on ESL Scales and Year level
ESL Scale
Year Level
0 1 2 3 4 5 6 7 8 9 10 11 12 13 14 Expected ESL
Scale *
R E1 E1 E2 E3 * 1 to 4
1 E1 E1 E2 E3 * 5
2 E1 E1 E2 E3 E4 * 6
3 P1 P1 P2 P3 P4 P5 * 7
4 P1 P1 P1 P2 P3 P4 P5 * 8
5 P1 P1 P1 P2 P3 P3 P4 P5 * 9
6 M1 M1 M1 M2 M3 M4 M5 M6 M7 * 10
7 M1 M1 M1 M2 M2 M3 M4 M5 M6 M7 * 11
8 M1 M1 M1 M2 M2 M3 M4 M5 M6 M7 * 12
9 M1 M1 M1 M1 M2 M2 M3 M4 M5 M6 M7 * 13
10 S1 S1 S1 S1 S2 S2 S3 S3 S4 S5 S6 S7 * 14
11 S1 S1 S1 S1 S2 S2 S3 S3 S4 S5 S6 S7 * 14
12 S1 S1 S1 S1 S2 S2 S3 S3 S4 S5 S6 S7 S7 * 14
Each student’s ESL support category is indicated in EDSAS in Student personal Part 2 under ESL support details. Allocations to schools will be based on numbers of students in each ESL support category, with students with greater need attracting greater relative allocations as shown in Table 3 below. Table 3: Support Categories showing Allocation Units
Early Years E1 E2 E3 E4
Allocation Units 15 10 5 1
Primary Years P1 P2 P3 P4 P5
Allocation Units 15 11.25 7.5 3.75 1
Middle years M1 M2 M3 M4 M5 M6 M7
Allocation Units 15 12.5 10 7.5 5 2.5 1
Senior Years S1 S2 S3 S4 S5 S6 S7
Allocation Units 15 12.5 10 7.5 5 2.5 1
NAP eligible students
All NAP eligible students should be identified, as schools are required to report twice a year to gain funding for DECS for eligible students in this support category under the Commonwealth New Arrivals Programme using DEEWR eligibility criteria. NAP eligible students are newly arrived residents with minimal or no English and no previous schooling in Australia. To be eligible, students must be enrolled in a school or New Arrivals Program (NAP) centre within 12 months of arrival in Australia, except in the case of students entering schooling in Reception or Year 1, where the period is within 18 months of arrival.

2010 Resource Entitlement Statement Notes and Supporting Information – 9 November, 2009 13
Schools should tick the NAP eligible tick box under ESL Support Details to indicate students who are eligible for (but may not be attending) an ESL New Arrivals Program centre. Students are no longer NAP eligible when they have achieved sufficient language skills to successfully exit from a NAP centre or after a period of 12 months from their first enrolment in a school. Note: The Manager, ESL Programs may approve NAP eligibility or extension of NAP eligibility to individual students. For example, eligibility may be extended to students who have had limited or no schooling in their country of origin or for those who have been severely traumatised. Eligibility may also be granted for some students born in Australia, such as Aboriginal students with minimal English. Low Socio-Economic Background Funding Students from a low socio-economic background can be disadvantaged at school through limited access to economic and educational resources in their homes and communities. This can be exacerbated if students do not have a clear understanding of the behaviours and skills valued in schools and if their families are transient. They may also need additional support to recognise how successful school learning can expand their aspirations and lead to quality further education, training and employment pathways. Although the majority of low socio-economic background funding is allocated using the Index of Educational Disadvantage, some funding such as School Card and the Social Inclusion Supplement is allocated on the number of School Card Holders in a school. Index of Educational Disadvantage PURPOSE The Index of Educational Disadvantage has been used since 2001 to allocate resources to address the educational needs of students from low socio-economic backgrounds. COMPONENTS The Index of Educational Disadvantage is made up of these measures: parental economic resources parental education and occupation Aboriginality student mobility. Each of the components contributes approximately equally to the overall disadvantage score. These weightings are determined using principle component analysis – a statistical technique that best summarises related variables. DATA The Index uses a combination of school-based data collected by DECS and Australian Bureau of Statistics (ABS) data. ABS data is used to calculate the parental economic resources and parental education and occupation components of the Index. ABS data is used by mapping the addresses of students attending a school to ABS Collection Districts. A Collection District, the base unit of ABS data, is approximately equivalent to 250 households in urban areas. The weighted average of the data for the collection districts from which a school draws its students is the data used. A measure of the percentage of Aboriginal students enrolled in a school is calculated, using school mid-year DECS census data. Student mobility is measured using DECS school based data. It is measured by taking the total students enrolling or leaving in a school between March 1st and October 31st compared with the school’s average enrolment for that year. Both the Aboriginal and student mobility measures are calculated using a weighted average of data over three years.
2010 Resource Entitlement Statement Notes and Supporting Information – 9 November, 2009 14
Cycle of Update The Index was due to be recalculated for 2009 using updated data, however, this has been put on hold in the light of emerging Council of Australian Governments (COAG) initiatives to support schools serving low socio-economic communities, in particular the federal intention to develop a national socio-economic status (SES) indicator. APPLICATION OF THE INDEX Scores on the Index are used to group schools into seven distinct categories of relative disadvantage, with all schools within a particular category being given the same rate of allocation. Category 1 schools serve the most disadvantaged families and Category 7 the least. AN APPEAL PROCESS A principal may appeal against their school’s Index category if they believe that exceptional circumstances place the school outside the method of calculating the Index. The appeal must be in writing, concisely stating the reason for the appeal, have included principal consultation with the PAC, be signed by the principal and endorsed by the Regional Director. Appeals should be forwarded to the Chair of the department’s Resource Allocation Adjustment Panel, 2nd Floor, Education Building, 31 Flinders Street, Adelaide, 5001, Courier: R11/10. Other Low Socio-Economic Funding
Additional funding for students from low socio-economic backgrounds is allocated through the following programs:
School Card Grant - a means tested scheme that assists low income families to meet the costs of their children’s educational expenses.
Social Inclusion Supplement – a grant to improve targeted learning outcomes for individual students from low socio-economic backgrounds.
Rural and Isolated Students Students from rural and isolated areas are disadvantaged in comparison to metropolitan students due to their access to services, the higher costs of running services and the size of the school population. Initiatives that have been adopted to address these inequities include:
Rural and Isolated Index – funding to address country schools’ access services (includes Commonwealth Country Areas Program and State funds).
Administration Supplement Allocation – Additional administration allocation to supplement small country schools with a primary component.
Country Weightings in Grants – a number of grants contain a loading for country schools eg the Training and Development Grant has a country loading.
Small School Grant – allocated to rural and isolated schools, special schools or disadvantaged metropolitan schools (with an index of Educational Disadvantage of 1 or 2) with less than 85 students.
Staff Formula - differentiations in the staff allocation formula for smaller student populations, which exists predominately in the country schools.
Utilities – higher per student utilities allocated to country schools in comparison to metropolitan schools (allocations based on actual costs).
2010 Resource Entitlement Statement Notes and Supporting Information – 9 November, 2009 15
Staffing Allocation for Open Access Students Students at Open Access College (OAC) are counted as a 1.0 FTE enrolment at their home school for staffing purposes. This calculated entitlement is reflected in the school’s resource entitlement statement. Schools reimburse TRT days to DECS per subject per student enrolled at OAC as follows:
R-7 – 0.3 TRT days per subject per semester.
8-12 – 1.25 TRT days per subject per semester.
Schools are charged the annual standard TRT rate from their resource entitlement statement in section 6 supplementation.
Schools outside the metropolitan area which have a small number of students in the secondary component are likely to have received a Tier 2 OAC allocation that was intended for conversion to TRT days to cover these costs. This allocation is included in the statement of resource entitlement of these schools.
Youth Compact Enrolments From January 2010 eligible students will be able to enrol in approved Vocational Education and Training (VET) courses through their local school as part of the federal government’s Youth Compact. Students enrolling as part of the Youth Compact will attract a per-capita funding allocation which will be identified separately in the RES, and the students will not be counted in the school’s staffing allocation. The Youth Compact per-capita funding will be based on current arrangements for Flexible Learning Options (FLO) students. Schools will be provided with advice outlining the procedures and per-capita rates for enrolling schools under the Youth Compact.

2010 Resource Entitlement Statement Notes and Supporting Information – 9 November, 2009 16
Resource Allocation Adjustment Panel The Resource Allocation Adjustment Panel was formed to consider above staffing formula entitlements that reflect policy determinations, industrial requirements or agreed positions. The Minister approved the formation of the Resource Allocation Adjustment Panel in 2003 based on a working party recommendation that reviewed processes of approving negotiated adjustments for the current staffing process.
The panel members consist of: Assistant Director, Site Finance and Resource Services
Director, School & Regional Operations
Director, Human Resources and Industrial Relations
Superintendent, Site Human Resources
When making a decision the Resource Allocation Adjustment Panel members will have regard for: Consistency - allocations are consistent and fair across schools
Transparency - processes are open and available to all
- equal accessibility to negotiated adjustment funding
Alignment - programs to be funded, match resources with needs
- funding purpose must agree with government priorities for education
The Resource Allocation Adjustment Panel considers above staffing formula entitlements in the following categories
State Wide Services Specialist Schools Shared Facilities Large Primary Schools Disabilities Behaviour Management Adult Re-Entry School Support School Closure Support Amalgamations Multi & Dual Campus R-12 Leadership Structure Emergency Support Special Interest Music Program (Provides additional staff at Brighton, Woodville, Fremont
Elizabeth and Marryatville high schools. Includes teacher and ancillary staffing and a grant based on $360 per special interest music student and a music focus grant).
In considering applications, the Panel investigates current levels of support provided through funding entitlements and any other additional support provided by State or Regional Offices.
A Staffing Allocation Funding Request is available from your HR Consultant and should be forwarded to the Chairperson, Resource Allocation Adjustment Panel. Requests should include the justification for additional resources, which may be the proposed duration of funding, performance criteria, review process, risk management plans, business plans and a cost/benefit analysis. The school’s Regional Director must endorse the principal’s funding request. The Superintendent Site HR will then ensure that the request is taken to the panel for consideration. A letter of the decision will be sent to the principal by Site Finance and Resource Services and a copy forwarded to the appropriate Regional Director for information. The Panel normally meets on a fortnightly basis. Requests seeking urgent approval need to consider these timelines.
An appeal process has also been established for schools that are dissatisfied with the Panel’s decision. In these cases, schools have the opportunity of submitting written justification for the approval of funding. The Budget Review Committee, which includes the Chief Executive, will consider the appeal.
The Panel is also responsible for considering Index of Educational Disadvantage appeals.
2010 Resource Entitlement Statement Notes and Supporting Information – 9 November, 2009 17
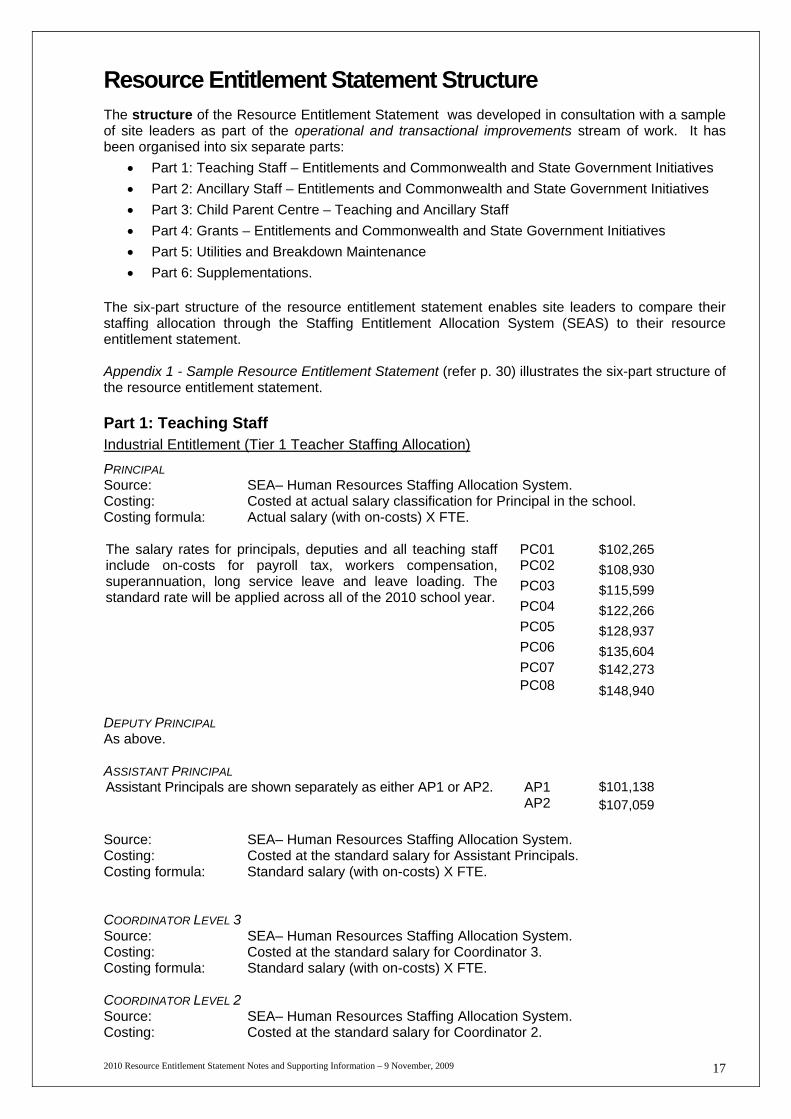
Resource Entitlement Statement Structure The structure of the Resource Entitlement Statement was developed in consultation with a sample of site leaders as part of the operational and transactional improvements stream of work. It has been organised into six separate parts:
Part 1: Teaching Staff – Entitlements and Commonwealth and State Government Initiatives
Part 2: Ancillary Staff – Entitlements and Commonwealth and State Government Initiatives
Part 3: Child Parent Centre – Teaching and Ancillary Staff
Part 4: Grants – Entitlements and Commonwealth and State Government Initiatives
Part 5: Utilities and Breakdown Maintenance
Part 6: Supplementations.
The six-part structure of the resource entitlement statement enables site leaders to compare their staffing allocation through the Staffing Entitlement Allocation System (SEAS) to their resource entitlement statement. Appendix 1 - Sample Resource Entitlement Statement (refer p. 30) illustrates the six-part structure of the resource entitlement statement. Part 1: Teaching Staff Industrial Entitlement (Tier 1 Teacher Staffing Allocation)
PRINCIPAL Source: SEA– Human Resources Staffing Allocation System. Costing: Costed at actual salary classification for Principal in the school. Costing formula: Actual salary (with on-costs) X FTE. The salary rates for principals, deputies and all teaching staff include on-costs for payroll tax, workers compensation, superannuation, long service leave and leave loading. The standard rate will be applied across all of the 2010 school year.
PC01 $102,265 PC02 $108,930 PC03 $115,599 PC04 $122,266 PC05 $128,937 PC06 $135,604 PC07 $142,273 PC08 $148,940
DEPUTY PRINCIPAL As above. ASSISTANT PRINCIPAL Assistant Principals are shown separately as either AP1 or AP2. AP1 $101,138
AP2 $107,059
Source: SEA– Human Resources Staffing Allocation System. Costing: Costed at the standard salary for Assistant Principals. Costing formula: Standard salary (with on-costs) X FTE. COORDINATOR LEVEL 3 Source: SEA– Human Resources Staffing Allocation System. Costing: Costed at the standard salary for Coordinator 3. Costing formula: Standard salary (with on-costs) X FTE. COORDINATOR LEVEL 2 Source: SEA– Human Resources Staffing Allocation System. Costing: Costed at the standard salary for Coordinator 2.

2010 Resource Entitlement Statement Notes and Supporting Information – 9 November, 2009 18
Costing formula: Standard salary (with on-costs) X FTE. COORDINATOR LEVEL 1 Source: SEA– Human Resources Staffing Allocation System. Costing: Costed at the standard salary for Coordinator 1. Costing formula: Standard salary (with on-costs) X FTE. TEACHER Source: SEA– Human Resources Staffing Allocation System. Costing: Costed at the standard salary for Teachers. Costing formula: Standard salary (with on-costs) X FTE. TERM 3 INTAKE (Estimates of primary intake as at March 2007) Source: SEA– Human Resources Staffing Allocation System. Costing: Costed at the standard salary for Teachers. Costing formula: Standard salary (with on-costs) X FTE. TERM 4 INTAKE (Estimates of primary intake as at March 2007) Source: SEA– Human Resources Staffing Allocation System. Costing: Costed at the standard salary for Teachers. Costing formula: Standard salary (with on-costs) X FTE. TEMPORARY RELIEVING TEACHER (TRT DAYS) Source: SEA– Human Resources Staffing Allocation System. The formula allocation
of 2001 provides for the replacement of teachers absent through illness. Costing: Costed at the standard daily TRT rate of $352 including on-costs. Costing formula: standard DAILY RATE X Number of days allocated. Commonwealth and State Government Initiatives
ADDITIONAL LEADERSHIP ADMINISTRATION TIME This is the additional leadership administration time for primary schools, or schools with a primary component introduced in 2004. Source: SEA– Human Resources Staffing Allocation System. Costing: Costed at the standard salary for Teachers. Costing formula: Standard salary (with on-costs) X FTE. ADDITIONAL JUNIOR PRIMARY TEACHERS Class sizes in the critical early years of schooling were reduced by up to 30% in schools across South Australia through the State Government’s initiative to provide additional junior primary teachers in the State’s most disadvantaged schools in 2003. The allocation ensures that no junior primary class at the beginning of the year need be greater than 18 in Category 1 and 2 and 21 in Category 3 schools based on the Week 2 enrolment survey. Costing details are the same as for Tier 1 teachers and included in Part 1: Teaching Staffing of the Resource Entitlement Statement. EARLY YEARS SCHEME This 2006 initiative reduces the class sizes in the critical early years of schooling for Index of Educational Disadvantage schools Categories 4 to 7. The allocation ensures that no junior primary class need at the beginning of the year be greater than 21 in Category 4 and 24 in Category 5, 6 and 7 schools based on the Week 2 enrolment survey. Costing details are the same as for Tier 1 teachers and included in Part 1: Teaching Staffing of the Resource Entitlement Statement. ADDITIONAL YEAR 3 TEACHERS The Government made an election commitment to employ an extra 100 teachers to reduce Year 3 class sizes in schools. At the beginning of the year classes will be reduced by up to 8 students in the most disadvantaged schools and by a minimum of 4 students in all schools based on the Week 2 enrolment survey.

2010 Resource Entitlement Statement Notes and Supporting Information – 9 November, 2009 19
PRIMARY COUNSELLOR Funding is allocated on weighted primary enrolment, based on IoED category. School type parameters also apply. Source: SEA– Human Resources Staffing Allocation System. Costing: Costed at the standard salary for Teachers. Costing formula: Standard salary (with on-costs) X FTE. Costing details are the same as for Coordinator Level 2 and included in Part 1 of the Resource Entitlement Statement. For further information on Primary Counsellor Allocations contact: Greg Cox 82261029 FLEXIBLE INITIATIVE RESOURCING This FTE is based on the average student enrolments in schools and are used flexibly to support the needs of individual schools and their cohort of students. Source: SEA– Human Resources Staffing Allocation System. Costing: Costed at the standard salary for Teachers. Costing formula: Standard salary (with on-costs) X FTE. This excludes the CPC Flexible Initiatives Resourcing (FIR) allocation which is shown as a separate item in this section. ABORIGINAL SCHOOLS Allocations are identified on the resource entitlement for English as a Second Language (ESL) positions and the induction and training of new teachers in Aboriginal schools. They are distributed on the basis of need within existing resources. Source: SEA– Human Resources Staffing Allocation System. Costing: Costed at the standard salary for Teachers. Costing formula: Standard salary (with on-costs) X FTE. OPEN ACCESS TIER 2 SALARIES Schools which have a small number of students in the secondary sector may receive an Open Access allocation including NIT time. Source: SEA– Human Resources Staffing Allocation System. Costing: Costed at the standard salary for Teachers. Costing formula: Standard salary (with on-costs) X FTE. SOCIO-ECONOMIC RESOURCE (TIER 2 SCHOOL CARD) Funding is allocated according to the differentials between Categories 1 to 3 of the Index of Educational Disadvantage. An enrolment parameter of greater than 70 also applies. Source: SEA– Human Resources Staffing Allocation System. Costing: Costed at the standard salary for Teachers. Costing formula: Standard salary (with on-costs) X FTE. For further information on Socio-Economic Resource Allocations contact: Phil Kimber 8226 0028. EXTRA ADMINISTRATION TIME This is additional administration time for small country schools introduced in 1999. Source: SEA– Human Resources Staffing Allocation System. Costing: Costed at the standard salary for Teachers. Costing formula: Standard salary (with on-costs) X FTE. HIGH SUSTAINED - TEACHER RESOURCE These teachers are allocated to support verified students with High Sustained (H) Level of Support.
2010 Resource Entitlement Statement Notes and Supporting Information – 9 November, 2009 20
Source: SEA– Human Resources Staffing Allocation System. Costing: Costed at the standard salary including on-costs. Costing formula: Standard salary (with on-costs) X FTE. VERY HIGH SUSTAINED - TEACHER RESOURCE These teachers are allocated to support verified students with Very High Sustained (V) Level of Support. Source: SEA– Human Resources Staffing Allocation System. Costing: Costed at the standard salary for Teachers. Costing formula: Standard salary (with on-costs) X FTE. SPECIAL CLASS TEACHERS These teachers are allocated to support students in special classes. Source: SEA– Human Resources Staffing Allocation System. Costing: Costed at the standard salary for Teachers. Costing formula: Standard salary (with on-costs) X FTE. SPECIAL EDUCATION TEACHER RESOURCE These FTEs are to support students with disabilities enrolled in mainstream school settings (Level of Support A, D or I). Source: SEA– Human Resources Staffing Allocation System. Costing: Costed at the standard salary for Teachers. Costing formula: Standard salary (with on-costs) X FTE. Note: SSO Hours allocated on the basis of the number of Special Class Teachers are currently included in Part 1 of the Resource Entitlement Statement – Industrial Entitlement – Ancillary Staff Hours. ENGINEERING PATHWAYS Engineering Pathways has been identified as a targeted special program and is allocated in the Tier 2, Tier 3 and other sections of the Resource Entitlement Statement. Part 2: Ancillary Staffing Industrial Entitlement
All Ancillary Staff Industrial Entitlements are described in the Staffing Allocation Document. Ancillary Staff (Hours) by Major Category includes:
Government Services Employee
School Services Officer Level 1
School Services Officer Level 2
School Services Officer Level 3
School Services Officer Level 4
School Services Officer Level 5
Operational Services Officer (2 to 5)
Storeperson
Administration Service Officers (1 to 6)
Other.
The 2010 Resource Entitlement Statement shows actual permanent entitlement hours for each of the above categories of ancillary staff. The standard salary is based on 52 weeks for all staff. Permanent positions and their substantive classifications only are included. Temporary position and their classifications will not be included in the Resource Entitlement Statement.
2010 Resource Entitlement Statement Notes and Supporting Information – 9 November, 2009 21
Source: SEA– Human Resources Staffing Allocation System. Costing: Costed at the standard salary including on-costs. Costing formula: Standard salary (with on-costs) X FTE.
Commonwealth and State Government Initiatives
ADDITIONAL ADMINISTRATIVE SCHOOL SERVICES OFFICER TIME Every primary school will have an extra four hours of School Services Officer time to assist with administrative requirements. These salaries were negotiated as part of the enterprise bargaining process for the 2002 Certified Agreement. Costing details are included in Part 2: Ancillary Staffing of the Resource Entitlement Statement. ADDITIONAL CLASSROOM SCHOOL SERVICES OFFICER TIME The State Government is providing more support for students with learning difficulties in the critical early years of schooling. The initiative will provide extra School Services Officers to support junior primary teachers. An extra 4.25 HPW of SSOs per Extra Junior Primary Teaching FTE (JP 160 Teachers, Early Years Scheme or Year 3 Scheme) will be allocated. Costing details are included in the Industrial entitlement section of the Resource Entitlement Statement ABORIGINAL COMMUNITY EDUCATION OFFICERS These FTEs support educational programs for students with a particular focus on community engagement. They are distributed across Aboriginal and Anangu schools based on Aboriginal student enrolments from the previous mid-year census. Schools receive 0.7 hour per week of an Aboriginal Community Education Officers time for every Aboriginal student. Source: Aboriginal Education and Employment Services Costing: Costed at the standard salary for Aboriginal Community Education Officers
for each type including on-costs. Costing formula: Hourly rate x hours allocated per week (with on-costs) x no of weeks worked. The Government’s expectations on how school principals will utilise funds provided for Aboriginal students are set out in the Accountability Statement for Aboriginal Students on page 5.
SPECIAL CLASSES SSO HOURS SSO Hours allocated on the basis of the number of Special Class Teachers are currently included in Part 1 of the Resource Entitlement Statement – Industrial Entitlement – Ancillary Staff Hours. A separate component was added to the previous Resource Entitlement Statement in 2002 and represents a resource that was previously provided from staffing allocations to Regional Offices. These resources are now allocated once per year and are formula driven. Junior primary special classes received 12 hours of base allocation per week and primary and secondary classes received 10 hours of base allocation per week. Source: SEA– Human Resources Staffing Allocation System. Costing: Costed at the standard salary including on-costs. Costing formula: Standard salary (with on-costs) X FTE.
VERY HIGH SUSTAINED - SSO HOURS These SSO Hours are allocated in line with teacher allocations for students with Very High Sustained (V) Level of Support. Source: SEA– Human Resources Staffing Allocation System. Costing: Costed at the standard salary including on-costs. Costing formula: Standard salary (with on-costs) X FTE.
HIGH SUSTAINED - SSO HOURS These SSO Hours are allocated in line with teacher allocations for students with High Sustained (H) Level of Support in mainstream schools. Source: SEA– Human Resources Staffing Allocation System.
2010 Resource Entitlement Statement Notes and Supporting Information – 9 November, 2009 22
Costing: Costed at the standard salary including on-costs. Costing formula: Standard salary (with on-costs) X FTE. Part 3: Child Parent Centres (CPCs) TEACHERS (CPC) CPC salary FTEs are based on actual Term 3, 2009 attendance figures and the CPC staffing allocation formula. Source: SEA– Human Resources Staffing Allocation System. Costing: Costed at the standard salary including on-costs. Costing formula: Standard salary (with on-costs) X FTE. RELIEF (CPC) TRT relief is based on 4 days/FTE for CPC teachers only at standard salary rates. ADDITIONAL LEADERSHIP ADMINISTRATION TIME This is the additional leadership administration time for CPCs introduced in 2004. Source: SEA– Human Resources Staffing Allocation System. Costing: Costed at the standard salary for Teachers. Costing formula: Standard salary (with on-costs) X FTE. FLEXIBLE INITIATIVES RESOURCING (CPC) This FTE is used flexibly to support the needs of individual CPCs and their cohort of children. SCHOOL SERVICES OFFICERS (CPC) CPC FTEs are based on projected 2010 staffing figures. For costing details refer to ancillary staffing above. CPC OPERATING GRANTS The 2010 CPC Operating grants rates are:
Base $562.34 per site
Per capita $26.92 based on actual enrolments
Needs component based on social justice rating and actual enrolments
o Rating 1 $18.24 x number of actual enrolled children
o Rating 2 $12.14 x number of actual enrolled children
o Rating 3 $6.07 x number of actual enrolled children
Part 4: Grants SCHOOL SUPPORT The School Support Grant is paid on both a base and per student capita basis, with the per capita for each school calculated on the current February full-time equivalent enrolment. The base components for all schools are materials, equipment, grounds maintenance, postage, freight, cleaning materials, repairs, general curriculum and administration, while other specific base components are paid depending on school type (e.g. primary, secondary, special or country). Additional per capita amounts are paid freight and postage loading (country schools), where applicable. SMALL SCHOOL GRANT The Small Schools Grant will be provided to those schools with up to 85 students, which meet the following criteria:
Aboriginal Schools
All Schools outside a radius of 80 km from Adelaide (these schools are considered rural or isolated for funding purposes)

2010 Resource Entitlement Statement Notes and Supporting Information – 9 November, 2009 23
All special schools
Disadvantaged schools in the metropolitan area (Index of Educational Disadvantage Categories 1 or 2).
$30,000 is allocated to schools with up to 70 students. The grant reduces by $2,000 per student for every student above 70 enrolments and cuts out altogether for schools with an enrolment of 85 or more students. Average enrolments of the previous year are used to ensure funding certainty throughout the year. WHOLE SCHOOL LITERACY AND NUMERACY IMPROVEMENT FUNDING In 2010 Literacy and Numeracy funding will be displayed on the Resource Entitlement Statement as a single line with the heading “Whole School Literacy and Numeracy Improvement Funding”. The grant incorporates the components which were previously listed separately in the RES. It will continue to provide resources for sites to focus on improvement of students’ literacy and numeracy outcomes and staff professional development within a whole school approach to literacy and numeracy improvement. The methods for allocating the individual components of the allocation are unchanged and will still be identifiable on the RES underneath the main heading. The following components make up the Whole School Literacy and Numeracy Improvement Funding allocation:
EARLY YEARS LITERACY AND NUMERACY This funding is allocated to support improvement in early years literacy and numeracy. Sites will be advised of their specific allocation in Term 4. EARLY ASSISTANCE Early Assistance Grants are paid direct to schools on a per capita basis based on the number of students enrolled in R-2 enrolments. DISADVANTAGED SCHOOLS PROGRAM (LITERACY, NUMERACY AND SPECIAL LEARNING NEEDS) This is a combination of Commonwealth and State funding, directed to the improvement of the learning outcomes of students from low socio-economic backgrounds. The effect of this funding on student outcomes is monitored at school, regional and central office level through the analysis of a range of student achievement data. Schools in Categories 1 to 4 of the DECS Index of Educational Disadvantage are eligible for funding. The 2010 per-capita rates will be at least:
Category 1 - $190.00 per student
Category 2 - $130.00 per student
Category 3 - $105.00 per student
Category 4 - $75.00 per student.
Final rates will not be known until final DECS 2010 funding details are available.
In addition, schools with an enrolment of less than 100 will be allocated a base payment of $1,200 EARLY YEARS COMPONENT (DSP) Schools with R-3 enrolments declared eligible under the Disadvantaged Schools Program receive this funding contributing to school based early years literacy and numeracy initiatives. The Index of Educational Disadvantage is used to allocate this funding to Category 1 to 4 Schools. ABORIGINAL EDUCATION TEACHERS These FTEs are provided on a formula basis to enhance literacy and numeracy in schools with greater than 10 Aboriginal student enrolments. Non-Aboriginal schools receive 0.2 FTE AET for first 10 Aboriginal students, followed by another 0.2 FTE AET for the next 10 Aboriginal students and 0.008 FTE for every student thereafter. (Aboriginal schools receive an equivalent entitlement through their staffing formula).
2010 Resource Entitlement Statement Notes and Supporting Information – 9 November, 2009 24
Source: SEA– Human Resources Staffing Allocation System. Costing: Costed at the standard salary for Teachers. Costing formula: Standard salary (with on-costs) X FTE. The Government’s expectations on how school principals will utilise funds provided for Aboriginal students are set out in the Accountability Statement for Aboriginal Students. STUDENTS WITH LEARNING DIFFICULTIES The Students with Learning Difficulties Grant is allocated to assist schools in providing program support for students with learning difficulties who are not required to have a Negotiated Education Plan (NEP). The funding is intended to assist schools to provide programs to improve the learning outcomes of students who have very poor reading skills, limited vocabulary for their age, significant difficulty in the development of verbal concepts and significant difficulty reasoning or problem solving using words. The allocation formulas use a combination of factors, including measures of low socio-economic status, to distribute a proportion of total funds to all schools for students with learning difficulties who are not required to have a NEP.
ENGLISH AS A SECOND LANGUAGE GENERAL SUPPORT (ESL) TEACHERS These FTEs are for the provision of ESL support to students who are identified as ESL students. They are distributed on the basis of ESL data collected through the August mid-year census and focus on the differentiated English language needs of ESL students within available resources. Source: Director, Literacy Secretariat Costing: Costed at the standard salary for Teachers. Costing formula: Standard salary (with on-costs) X FTE (for Teacher FTEs). NEW ARRIVALS PROGRAM (NAP) FUNDING For 2010, ESL New Arrivals Program schools will continue to be funded as a special program in the Resource Entitlement Statement. ESL new arrivals students in country schools are eligible for an allocation of 0.1 FTE teacher time – refer to the ESL website http://www.decs.sa.gov.au/curric/pages/ESL. ENGLISH AS A SECOND LANGUAGE (ESL) GENERAL SUPPORT BILINGUAL SCHOOL SERVICES
OFFICERS These BSSO Hours are allocated in line with the ESL Teacher Allocation where there is a minimum of a 1.0 FTE ESL teacher or as occasional hours allocated for each term on request from schools. Source: Director, Literacy Secretariat Costing: Costed at the standard salary for Ancillary (for BSSOs) based on the
respective standard including on-costs. Costing formula: Standard salary (with on-costs) X Hours (for BSSO Hours).
FURNITURE REPLACEMENT The grants are calculated using a model which takes into account:
the number of students (plus 20% loading for School Card holders) and number of teachers
unit costs of student chair and table and teacher chair and table
estimated economic life of student chairs (7 years), student tables (10 years), teacher chairs (7 years), teacher desks (15 years), new schools under 5 years old omitted
percentage reduction for schools redeveloped/upgraded in the last 5 years
a minimum payment to schools of $100.
2010 Resource Entitlement Statement Notes and Supporting Information – 9 November, 2009 25
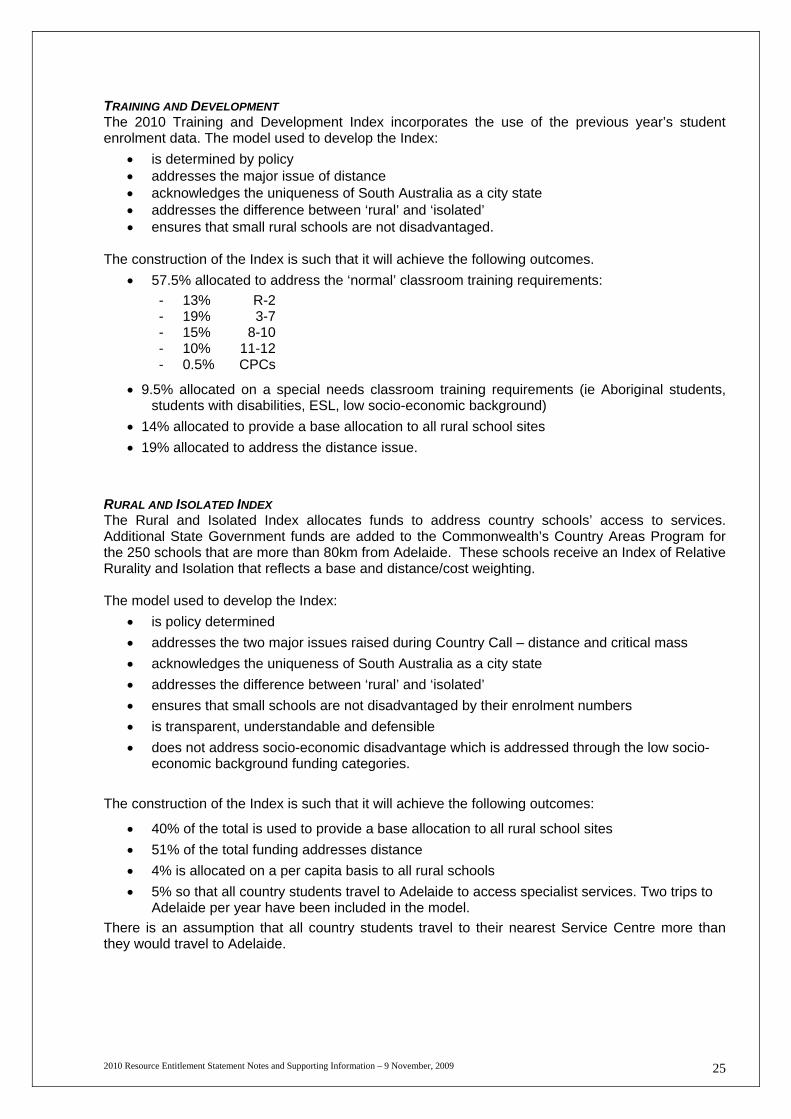
TRAINING AND DEVELOPMENT The 2010 Training and Development Index incorporates the use of the previous year’s student enrolment data. The model used to develop the Index:
is determined by policy addresses the major issue of distance acknowledges the uniqueness of South Australia as a city state addresses the difference between ‘rural’ and ‘isolated’ ensures that small rural schools are not disadvantaged.
The construction of the Index is such that it will achieve the following outcomes.
57.5% allocated to address the ‘normal’ classroom training requirements:
- 13% R-2 - 19% 3-7 - 15% 8-10 - 10% 11-12 - 0.5% CPCs
9.5% allocated on a special needs classroom training requirements (ie Aboriginal students, students with disabilities, ESL, low socio-economic background)
14% allocated to provide a base allocation to all rural school sites
19% allocated to address the distance issue.
RURAL AND ISOLATED INDEX The Rural and Isolated Index allocates funds to address country schools’ access to services. Additional State Government funds are added to the Commonwealth’s Country Areas Program for the 250 schools that are more than 80km from Adelaide. These schools receive an Index of Relative Rurality and Isolation that reflects a base and distance/cost weighting. The model used to develop the Index:
is policy determined
addresses the two major issues raised during Country Call – distance and critical mass
acknowledges the uniqueness of South Australia as a city state
addresses the difference between ‘rural’ and ‘isolated’
ensures that small schools are not disadvantaged by their enrolment numbers
is transparent, understandable and defensible
does not address socio-economic disadvantage which is addressed through the low socio-economic background funding categories.
The construction of the Index is such that it will achieve the following outcomes:
40% of the total is used to provide a base allocation to all rural school sites
51% of the total funding addresses distance
4% is allocated on a per capita basis to all rural schools
5% so that all country students travel to Adelaide to access specialist services. Two trips to Adelaide per year have been included in the model.
There is an assumption that all country students travel to their nearest Service Centre more than they would travel to Adelaide.

2010 Resource Entitlement Statement Notes and Supporting Information – 9 November, 2009 26
The following locations have been designated as Service Centres: Barmera Loxton Naracoorte Strathalbyn Berri Millicent Port Augusta Victor Harbour Clare Mt Gambier Port Lincoln Waikerie Gawler Murray Bridge Port Pirie Whyalla Kadina Nuriootpa Renmark
The construction of the Index essentially uses the theoretical costs of providing schools with the capacity to achieve these policy objectives as weights to apportion the total funding available. Every school will have a different Index number representing its relative difficulty (and cost) in achieving these policy objectives for each student. IGNITE (SHIP) Continued funding for the IGNITE program will be provided to Glenunga International High School, The Heights School and Aberfoyle Park High School in 2010. ETHNIC SCHOOL FUNDING Schools hosting ethnic schools meet the normal costs of cleaning and utilities and recharge to ethnic schools only extraordinary costs that may arise. To facilitate this arrangement the Resource Entitlement Statement includes $26 per ethnic school enrolment. For further information, contact the Ethnic Schools Board, telephone 8226 1008. SECONDARY MENTORING PROGRAM The Secondary Mentoring Program supports students returning or remaining at school as result of legislative changes raising the school leaving age from 15 to 16 years. 45 schools with secondary enrolments are involved in the program, with 80 teacher mentors supporting up to 800 students across the state. Schools are allocated funds to release teacher mentors equivalent to 1 day per week. Source: Project Officer Student Mentoring Program Costing: Costed at the standard salary including on-costs Costing formula: Standard salary (with on-costs) X FTE.
SWIMMING POOL GRANTS From the 2008/09 financial year onwards, swimming pool grants and chemical expenses became part of the respective sites RES. This was a change from previous practice where swimming pool grants and swimming pool chemical expenses were processed and paid corporately when accounts were received from sites. The 2010 Swimming Pool Grants have been indexed by the approved 2010 index of 1.6%. Part 5: Utilities & Maintenance Amounts paid by State Office for energy (electricity, fuel, gas and oil), cleaning, water, telephones and waste have been included as follows. CLEANING This entry shows the 2010 actual contract GST exclusive cost for cleaning. Cleaning Contract changes will be updated at the end of each term. The rate will be calculated at number of months @ the original rate and x number of months @ new rate. ENERGY The 2009 allocation has been increased by the approved 2010 index of 1.6%. Bottled gas, oil and fuel are included as part of the Energy allocation.

2010 Resource Entitlement Statement Notes and Supporting Information – 9 November, 2009 27
ENERGY ALLOCATION REVIEW PROCESS Schools will be supported to meet their energy targets through the budget development process with the assistance of Site Finance and Resource Services and through energy audits facilitated by Asset Services. The energy audits have identified numerous ways that all schools can reduce their energy consumption. The Asset Services ‘Energy Smart’ fact sheets provide information and advice to help schools with managing and reducing their energy consumption. An adjustment of a site’s energy resource allocation may be available for special circumstances such as an increase in enrolments or metering issues. For more details and an adjustment request form, access the Energy and Water Resource allocation fact sheet and adjustment request form on the Asset Services website at www.decs.sa.gov.au/assetservices/pages/topiclisting/topiclistingr Schools will not be reimbursed for any over expenditure associated with their electricity allocations in the RES. TELEPHONES The 2010 amount is an average of the indexed actual amounts paid 2006-2008 on behalf of each school and has been increased by the approved 2010 index of 1.6%. WATER The 2009 allocation has been increased by the approved 2010 index of 1.6%
WATER ALLOCATION REVIEW PROCESS Schools will be supported to meet their water targets through the budget development process with the assistance of Site Finance and Resource Services and through water audits facilitated by Asset Services. The water audits have identified numerous ways that all schools can reduce their water consumption. The Asset Services ‘Water Smart’ fact sheets provide information and advice to help schools with managing and reducing their water consumption. An adjustment of a site’s water resource allocation may be available for special circumstances such as an increase in enrolments or metering issues. For more details and an adjustment request form, access the Energy and Water Resource allocation fact sheet and adjustment request form on the Asset Services website at www.decs.sa.gov.au/assetservices/pages/topiclisting/topiclistingr Schools will not be reimbursed for any over expenditure associated with their water allocations in the RES. WASTE This amount is the higher of the 2009 allocation and the 2008 actual amounts paid on behalf of each school and has been increased by the approved 2010 index of 1.6% BREAKDOWN MAINTENANCE Since 1999 a benchmark allocation for breakdown maintenance has been used based on the following formulae.
Enrolment x Space Entitlement x Rate
Where:
Enrolment = total enrolment Space Entitlement = 7.5m2 per primary student 11m2 per secondary student 11m2 per area/Aboriginal school student 19m2 per student in a Special School Rate = $8.58/m2 based on an analysis of costs Base Allowance = $5,273 primary school $7,909 area school $13,181 special/secondary/R-12 school Funds for CPC attendances have been included in the benchmark figure for breakdown maintenance. This calculation is included in the total breakdown maintenance figure for the school. The following formula has been used: CPC Attendances / 2.5 X 7.5m2 X $8.58/m2
2010 Resource Entitlement Statement Notes and Supporting Information – 9 November, 2009 28
Attendances have been divided by 2.5 to work out the FTE figure. The rationale is that CPC children attend four half-day sessions per week on average compared to school students who attend five full days per week. To allow for price increases due to inflation the benchmark allocations include cumulative increases of 1.6% in 2010. Breakdown Maintenance Definitions Preventative Maintenance – Those actions performed to retain an item or asset in its original condition, as far as practicable by providing systematic inspection, detection, and prevention of incipient failure. Preventative maintenance is normally programmed, for example as “predetermined preventative maintenance” (Source National Committee on Rationalised Building (NCRB)) Routine Maintenance – Day to day operational activities to keep the plant operating (eg. - replacement of light bulbs, cleaning of drains, gutters and downpipes, repairing leaks etc) and which form part of the annual operating budget, including preventative maintenance. (Source NCRB) Breakdown Maintenance – Those activities which are associated with the repair or servicing of site features, buildings and plant or equipment which have become inoperable or unusable because of the failure of component parts. (Source DTEI) Logged Maintenance – Non-emergency maintenance required to repair failed equipment, plant or facilities where failure and/or the type of equipment, plant or facilities does not have an immediate impact on the health, safety or welfare of the occupants or users of the equipment, plant or facilities and does not have an impact on the structural integrity of the associated asset. (Source DTEI) Part 6: Supplementations School staffing allocations are adjusted for a number of items that are paid as supplementations to schools outside resource entitlement statement. These items include:
Permanent Relieving Teachers (PRT) – Regional Management
SSO Over Entitlement
TRT Over Entitlement
Ancillary Salary Adjustment
Teacher Salary Adjustment
SSO Special Education
Graduate Support
ESL Occasional Hours BSSO
ESL Geographical Isolation Allowance
Supplementary ESL Allocation for NAP Exit Students
Double Debiting – Teacher
Surplus Teachers
SSO Reclassification
Open Access TRT Recovery
Leadership Reconfigurations
Flexible Learning Options (FLO). The 2010 Per Capita Rate for FLO students is $6,810. The FLO program is managed by ICAN Policy and Programs (ph 8226 1726). See the website www.ican.sa.edu.au for FLO Guidelines and details.
Commonwealth National Partnership Payments

2010 Resource Entitlement Statement Notes and Supporting Information – 9 November, 2009 29
2010 Standard Salary Rates The 2010 Standard Salary Rates reflect current Enterprise Agreement salaries and variations to the average salary for each category. The 2010 Standard Salary rates include Leave Loading, Superannuation, Payroll Tax, Workers Compensation and Long Service Leave on-costs.
Category of Staff 2010 Standard Salary
Rate ($) Principal / Deputy PCO 1 102,265 (Annually)
Principal / Deputy PCO 2 108,930 (Annually)
Principal / Deputy PCO 3 115,599 (Annually)
Principal / Deputy PCO 4 122,266 (Annually)
Principal / Deputy PCO 5 128,937 (Annually)
Principal / Deputy PCO 6 135,604 (Annually)
Principal / Deputy PCO 7 142,273 (Annually)
Principal / Deputy PCO 8 148,940 (Annually)
Teachers 85,893 (Annually)
Assistant Principals Level 1 101,138 (Annually)
Assistant Principals Level 2 107,059 (Annually)
Coordinator Level 1 91,830 (Annually)
Coordinator Level 2 95,723 (Annually)
Coordinator Level 3 100,009 (Annually)
ESL Coordinator 95,723 (Annually)
Temporary Relieving Teacher 352 (Daily)
Government Service Employees (GSE's) 24.43 (Hourly)
SSO Level 1 25.02 (Hourly)
SSO Level 1 - Casual 30.98 (Hourly)
SSO Level 2 29.85 (Hourly)
SSO Level 2 – Casual (& ESL/New Arrivals- Bilingual School Assistant) 36.96
(Hourly)
SSO Level 3 34.31 (Hourly)
SSO Level 3 - Casual 42.48 (Hourly)
SSO Level 4 38.52 (Hourly)
SSO Level 4 - Casual 47.70 (Hourly)
SSO Level 5 45.42 (Hourly)
SSO Level 5 - Casual 56.24 (Hourly)
Storeperson 25.02 (Hourly)
ASO1 47,442 (Annually)
ASO2 55,448 (Annually)
ASO3 64,191 (Annually)
ASO4 71,464 (Annually)
ASO5 83,216 (Annually)
ASO6 93,266 (Annually)
ACEO Level 1 25.50 (Hourly)
ACEO Level 2 29.52 (Hourly)
ACEO Level 3 33.70 (Hourly)
ACEO Level 4 36.54 (Hourly)
ACEO Level 5 40.14 (Hourly)
Operational Services Officer 33.42 (Hourly)
HPI Class 4 42.97 (Hourly)
HPI Class 3 63.90 (Hourly)
HPI Class 2 78.62 (Hourly)
PSO2 85,831 (Annually)
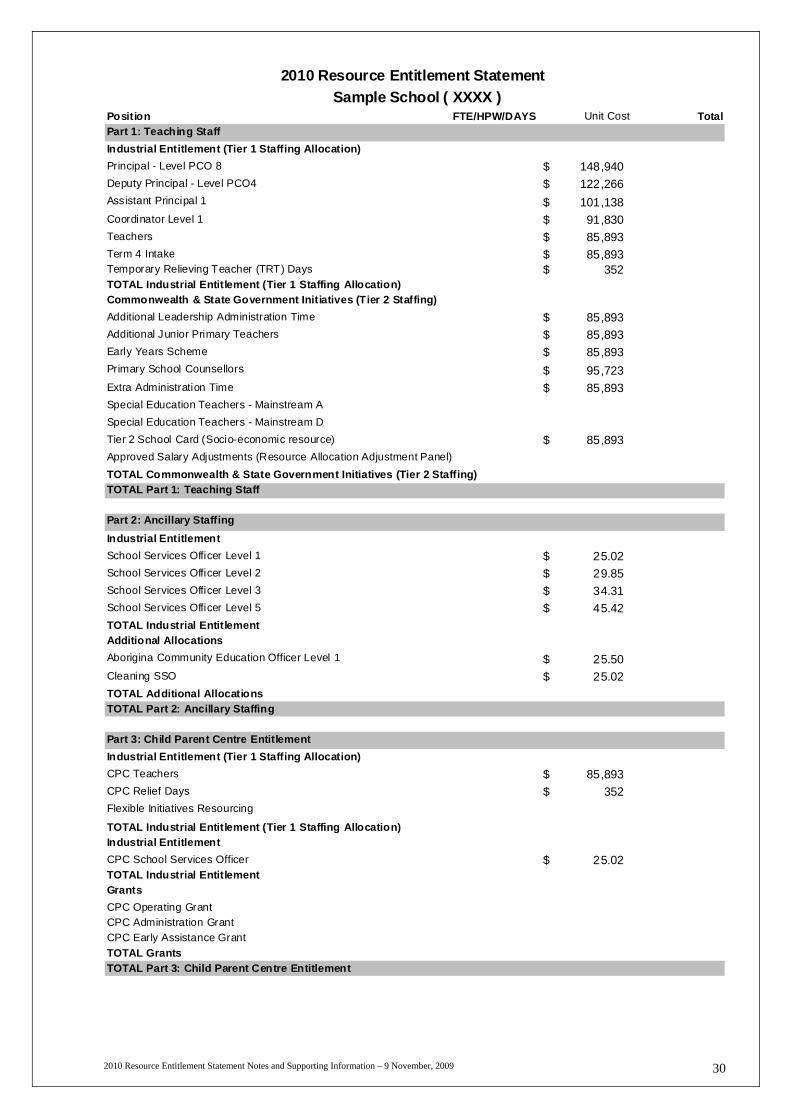
2010 Resource Entitlement Statement Notes and Supporting Information – 9 November, 2009 30
Position FTE/HPW/DAYS Unit Cost Total
Part 1: Teaching Staff
Industrial Entitlement (Tier 1 Staffing Allocation)
Principal - Level PCO 8 $ 148,940 Deputy Principal - Level PCO4 $ 122,266 Assistant Principal 1 $ 101,138 Coordinator Level 1 $ 91,830 Teachers $ 85,893 Term 4 Intake $ 85,893 Temporary Relieving Teacher (TRT) Days $ 352 TOTAL Industrial Entitlement (Tier 1 Staffing Allocation)
Commonwealth & State Government Initiatives (Tier 2 Staffing)
Additional Leadership Administration Time $ 85,893 Additional Junior Primary Teachers $ 85,893 Early Years Scheme $ 85,893 Primary School Counsellors $ 95,723 Extra Administration Time $ 85,893 Special Education Teachers - Mainstream A
Special Education Teachers - Mainstream D
Tier 2 School Card (Socio-economic resource) $ 85,893 Approved Salary Adjustments (Resource Allocation Adjustment Panel)
TOTAL Commonwealth & State Government Initiatives (Tier 2 Staffing)
TOTAL Part 1: Teaching Staff
Part 2: Ancillary Staffing
Industrial Entitlement
School Services Officer Level 1 $ 25.02 School Services Officer Level 2 $ 29.85 School Services Officer Level 3 $ 34.31 School Services Officer Level 5 $ 45.42
TOTAL Industrial Entitlement
Additional Allocations
Aborigina Community Education Officer Level 1 $ 25.50 Cleaning SSO $ 25.02
TOTAL Additional Allocations
TOTAL Part 2: Ancillary Staffing
Part 3: Child Parent Centre Entitlement
Industrial Entitlement (Tier 1 Staffing Allocation)
CPC Teachers $ 85,893 CPC Relief Days $ 352 Flexible Initiatives Resourcing
TOTAL Industrial Entitlement (Tier 1 Staffing Allocation)
Industrial Entitlement
CPC School Services Officer $ 25.02 TOTAL Industrial Entitlement
Grants
CPC Operating Grant
CPC Administration Grant
CPC Early Assistance Grant
TOTAL Grants
TOTAL Part 3: Child Parent Centre Entitlement
2010 Resource Entitlement Statement
Sample School ( XXXX )

2010 Resource Entitlement Statement Notes and Supporting Information – 9 November, 2009 31
Part 4: Grants
Grants
School Support
Furniture Replacement
Training & Development
Rural and Isolated Index
Whole School Literacy and Numeracy Improvement Funding
Incorporating Early Years Literacy and Numeracy, Early Assistance, Disadvantaged Schools Program (Literacy,
Numeracy and Special Learning Needs), Early Years Component (DSP), Aboriginal Education Teachers,
Students with Learning Difficulties, English as a Second Language (ESL) and ESL New Arrivals Program.
Ethnic Schools
Student Mentoring Program
Behaviour Management
TOTAL Grants
TOTAL Part 4: Grants
Part 5: Utilities & Maintenance
Utilities & Maintenance
Cleaning
Energy
Telephone
Waste
Water
Breakdown Maintenance
TOTAL Utilities & Maintenance
TOTAL Part 5: Utilities & Maintenance
Part 6: Supplementations
Supplementations
TRT Over-entitlement
AEW Over-Entitlement
Open Access TRT Recovery
SSO Special Education
TRT Special Education
Flexible Learning Option (FLO)
National Partnerships Funding
TOTAL Supplementations
Resource Allocation Adjustment Panel
Adjustments
TOTAL Resource Allocation Adjustment Panel
TOTAL Part 6: Supplementations
SUMMARY
Staffing
Teacher (DAYS)
Teacher (FTE)
Ancil lary (HRS)
TOTAL Staffing
Others
Part 3: Child Parent Centre Entitlement
Part 4: Grants
Part 5: Utili ties & Maintenance
Part 6: Supplementations
TOTAL Others
TOTAL RESOURCE ENTITLEMENT STATEMENT