Embed Size (px)
Citation preview

Supporting Information
An Acetate Bound Cobalt Oxide Catalyst for Water Oxidation: Role of Monovalent Anions and Cations In Lowering Overpotential
Subal Dey, Biswajit Mondal, Abhishek Dey*
Department of Inorganic Chemistry, Indian Association for the Cultivation of Science, Kolkata, India,
700032.
Corresponding Author : [email protected]
General Procedures
All the starting materials are purchased from Merck Chemicals Ltd, India through vendors and are used
without further puridications. The indium doped tin oxide (ITO) and fluorine doped tin oxide electrodes
are purchased from Sigma-Aldrich India and are used after cleaning. The slicon-carbide electrode was
directly extracted from market available batteries and washed thoroughly with concentrated HNO3 and
water and dried for overnight for further use. For all the experiments triple distilled water is used. The
electrochemical measurements have been performed with Pine CHI 720D bipotentiostate using a Pt wire
counter electrodes (CHI 115) and Ag/AgCl (sat. KCl) reference ( CHI 111) electrodes. FTIR spectra is
recorded in Perkin-Elmer Frontier model using ATR technique. Field-emission scanning electron
microscopy (FESEM) was performed with model JEOL JSM-6700F) and high-resolution transmission
electron microscopic (HRTEM) topographs are collected from a JEOL-JEM 2010 microscope using 200k
eV electron source. Energy-dispersive X-ray spectroscopy (EDS) was done using a HRTEM JEOL-JEM
2010 microscope. X-ray photoelectron spectroscopy (XPS, Omicron, model: 1712-62-11) measurement
was done using an Al-Ka radiation source under 15 kV voltage and 5 mA current condition.
S1
Electronic Supplementary Material (ESI) for Physical Chemistry Chemical Physics.This journal is © the Owner Societies 2014

Figure S1: Determination of overpotential () by extrapolating the faradic current curve. (A) Homegeneous & (B) Heterogeneous.
Figure S2 : Cyclic Voltamogram of (A) 5 mM solution of the transition metal salts with GC electrode and (B) with ITO electrode modified with the Ni-Ac-WOC, Fe-Ac-WOC, Mn-Ac-WOC and comparison with Co-Ac-WOC at 50 mVs-1 scan rate in acetate buffer (pH 7).
S2

Detection of O2 Evolved
The O2 evolved during OER is detected using electrochemical methods.
A) Homogeneous
During an anodic liner sweep of an edge-pane graphite working electrode mounted on a rotor tip of a
RRDE assembly and dipped in a solution of 5 mM Co2+ ions in acetate buffer with KCl electrolyte, the
encircling Pt ring is held at a constant potential of -0.2 V vs NHE. At this potential Pt ring
electrochemically reduces O2. As an anodic current is observed in the working electrode a reduction
current is also observed at the ring (Fig. S3A, left). Thus O2 produced at the working disc electrode (H2O
2H+ + 4e + ½ O2) it diffuses out towards the ring due to the hydrodynamic current produced by the
rotating shaft and gets reduced. To eliminate the possibility that this reduction current may also originate
from an oxidized Co species, produced at the anode at positive potentials and diffused towards the ring,
getting reduced in a manner analogous to O2, the RRDE experiment is performed by holding the Pt
electrode at several different potential. The current vs potential plot of such an experiment profiles the O2
reduction current of the ring very closely (Fig. S3B, right). These data strongly indicates that the current
produced at the ring is due to reduction of O2 produced at the working disc electrode.
S3
Pic S1: Electrochemical set up for heterogeneous O2 detection, generated by the Co-Ac-WOC on
ITO/FTO electrode.

B) Heterogeneous
In a standard two compartment cell, an auxiliary Pt electrode, in addition to the working electrode
bearing deposits of Co-Ac-WOC and the reference electrode, a Pt electrode is introduced (see picture
below). After performing CPE experiments at 0.95 V vs NHE (i.e. with ~120 mV overpotential) in a
degassed buffered solution with the working electrode for different spans of time, the auxiliary Pt
electrode, now used as a working electrode, is used to reduce any O2 present in the solution. The data
(Fig. S2D) indicate that while initially no O2 reduction currents are observed, significant O2 reduction
currents are observed as the CPE proceeds. In particular the amount of O2 reduction current increases
with increasing CPE time. This clearly indicates generation of O2 at the working electrode at these low
potentials. The generation of the O2 was confirmed by the formation of Mb-O2 complex, characterized by
UV-Vis spectroscopy under anaerobic condition and by subsequent addition of the small aliquot (10 L)
to the reduced Mb solution of known concentration after 20 minutes of intervals with the progress of
CPE.
Figure S3: A) O2 detection under homogeneous conditions using RRDE (left). 5 mM Co2+ solution in
acetate buffer with KCl electrolyte at 1500 rpm and 50 mV/s. (B) Pt ring currents obtained by applying
different potential at the ring during RRDE is plotted (red squares) against potential at which the ring is
held. Overlaying these points is an LSV scan (in blue) of the Pt ring in an aerated acetate buffer with KCl
electrolyte containing 5 mM Co2+ salt. The ring currents obtained in these different RRDE experiments
profile the ORR current of Pt clearly indicating that these RRDE currents are generated by O2 reduction
and not any side reaction at the Pt ring electrode C) Cyclic voltamogram of the FTO electrode with Co-
Ac-WOC in deoxygenated Co2+ free buffer (Acetate pH 7) at 50 mVs-1. Red arrow indicates the direction
of the initial scan. OER & ORR stand for oxygen evolution reaction and ORR for oxygen reduction
reaction. D) O2 reduction current measured by an auxiliary Pt electrode during a CPE run of a Co-Ac-
WOC deposited on an FTO electrode and held at 0.95 V in an acetate buffer with KCl electrolyte and
containing 1 mM Co2+ salt dissolved in it. (E) UV-vis spectra of the Mb-O2 complex formed by the
reaction of O2 generated by OER catalysis on CPE at 0.95 V with Co-Ac-WOC and reduced Mb.
S4

S5

Figure S4: CV with ITO electrode in 1 mM Co2+ solution in acetate buffer with KCl electrolyte at pH 7 at 50 mVs-1.
Figure S5: Cyclic Voltamogram with FTO electrode at 50 mVs-1 with Co-Ac-WOC at pH 7 acetate buffer and overlayed with the bare FTO electrode at a Co2+-free solution under same conditions.
S6

Figure S6: SEM topographic image of the Co-AC-WOC on ITO (A) 5 minutes & (B) 30 minutes.
Figure S7: Scanning Electron Microscopy (SEM) of the Co-Ac-WOC modified ITO surface. (A) Electrolysis at 0.75 V vs NHE. (B) Electrolysis at 0.85 V vs NHE. (C) Electrolysis at 1 V. (D) Electrolysis at 1.1 V. All potentials are against NHE.
Figure S8: SEM topograph of the modified ITO surface with (A) Co-Ac-WOC and (B) electrodeposited material from Co(II)-salt in potassium acetate buffer with KNO3 electrolyte (pH 7).
S7
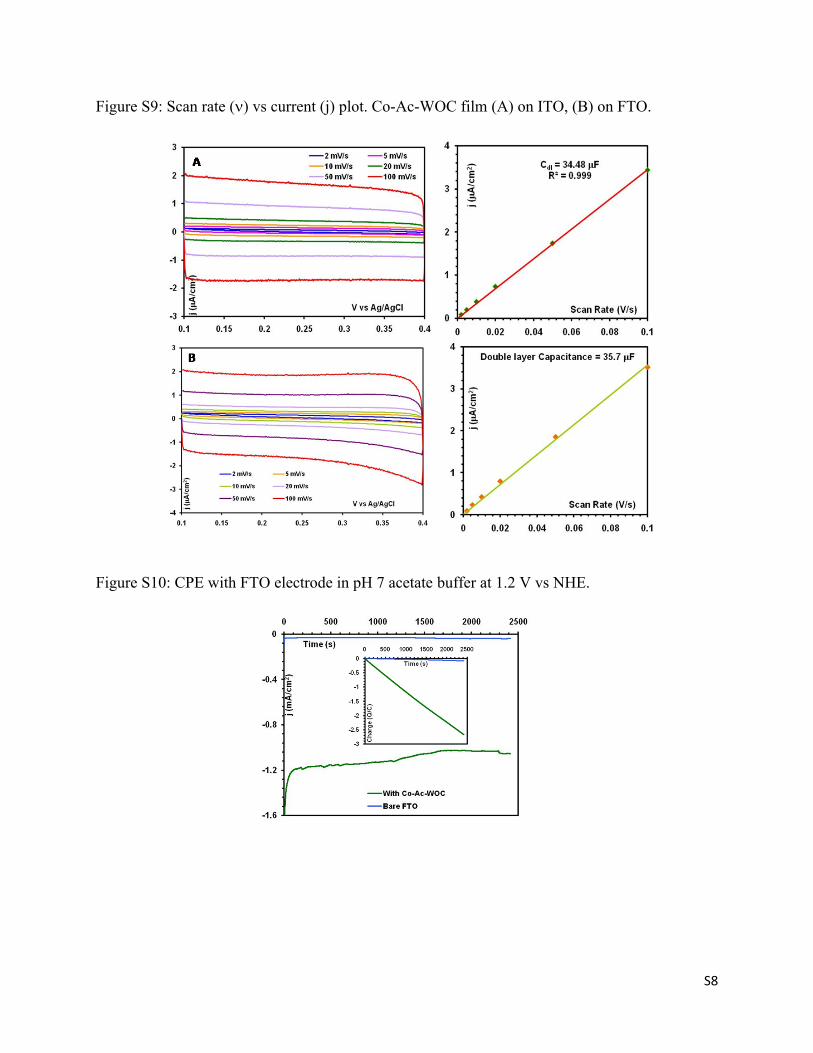
Figure S9: Scan rate () vs current (j) plot. Co-Ac-WOC film (A) on ITO, (B) on FTO.
Figure S10: CPE with FTO electrode in pH 7 acetate buffer at 1.2 V vs NHE.
S8

Figure S11: A) Linear Sweep Voltametry (LSV) with Si-C electrodes at pH 7 and 50 mVs-1. (B) CPE at 1.2 V vs NHE in acetate buffer (pH 7) with Si-C electrode.
Figure S12: Electrocatalytic water oxidation with GC electrode and 1 mM Co2+ solution at pH 7 (acetate buffer). (Inset) Limiting current vs (scan rate)1/2 plot.
S9

Figure S13: CV in acetate buffer (pH 7) of with different precursor Co2+ salts at 50 mVs-1 and ITO electrode.
Determination of TOF:
Turn over frequency is determined from the double layer capacitance (Cdl) of the Co-Ac-WOC
film modified ITO or FTO electrode. Cdl could easily be determined from the current density of the
modified electrode where no faradic current is observed. The difference between the anodic and cathodic
current at 0.25 V vs Ag/AgCl (sat. KCl) is plotted against scan rate. From the slope of this curve the
double layer capacitance of the modified electrode is easily determined to be ~ 35 F/cm2 for both ITO
and FTO electrode. The active surface area for such oxide based material modified electrodes could easily
be determined assuming the standard Cdl to be 60 F/cm2. Though, this value is very arbitrary, this
method is widely acceptable. The TOF has been determined from the double layer capacitance of the Co-
Ac-WOC surface ( Cdl = 35 F/cm2) and stredy current density (2.5 mA/cm2) which is converted to the
number of electrons passed through the electrode per second. The number of electrons could be converted
to number of oxygen per second by dividing with 4, as per molecule of oxygen generation involves 4 e-
oxidation.
Using these results, the TOF has been determined to be 17.8 s-1 at 485 mV overpotentials with
ITO electrodes and 7.9 s-1 at 385 mV (1.07 mA/cm2) overpotentials with FTO electrodes. This is the
highest limiting value as Cdl is the measure of the charge passed through the metal centre present at the
surface only. So, the actual number of metal centers participating in the catalysis may be larger.
S10

In parallel the amount of O2 gas evolved during an analogous CPE experiment at 0.95 V (i.e. with 170 mV overpotential) over 8 hrs is measured to be 0.1 ml. Correspondingly 1.86 C of charge is dissipated from the electrode (see figure below). Thus a FY of 75% is estimated for a CPE experiment performed with <200 mV overpotential. The low FY is likely due to solubility of the O2 produced in a degassed buffered solution.
Figure S14: CPE at 0.95 V vs NHE with Co-Ac-WOC on FTO.
S11
-2
-1.6
-1.2
-0.8
-0.4
00 5000 10000 15000 20000 25000 30000
Time (s)C
harg
e (Q
/C)