Embed Size (px)
Citation preview

Page 1 of 15
Supporting Information
Halogen-Bond Driven Self-Assembly of Perfluorocarbon Monolayers on Silicon
NitrideAntonio Abate,1, 2 Raphael Dehmel,1 Alessandro Sepe,1 Ngoc Linh Nguyen,3 Bart Roose,1 Nicola
Marzari,3 Jun Ki Hong,4 James M. Hook,5 Ullrich Steiner,1 Chiara Neto* 4
1 Adolphe Merkle Institute, University of Fribourg, Chemin des Verdiers 4, CH-1700 Fribourg,
Switzerland2 Helmholtz-Zentrum Berlin für Materialien und Energie, Kekuléstrasse 5, 12489 Berlin, Germany
3 Theory and Simulations of Materials (THEOS), and National Centre for Computational Design and
Discovery of Novel Materials (MARVEL), École Polytechnique Fédérale de Lausanne, 1015
Lausanne, Switzerland
4 School of Chemistry and University of Sydney Nano Institute, The University of Sydney, NSW 2006
Australia
5 Mark Wainwright Analytical Centre and School of Chemistry, University of New South Wales,
Sydney, NSW, 2052, Australia
Electronic Supplementary Material (ESI) for Journal of Materials Chemistry A.This journal is © The Royal Society of Chemistry 2019

Page 2 of 15
Contents
Modelling the monolayer on a silicon substrate ........................................................3
Halogen bond on SiO2 substrate..................................................................................5
Modelling the trans conformation of I-PFC12 on SiNx ............................................6
Atomic force microscopy..............................................................................................7
Elemental composition extracted from the XPS spectra in Figure 2 of the main text..................................................................................................................................8
Grazing-Angle FTIR ....................................................................................................919F CP-MAS NMR spectrum of trifluoroacetamide as an internal standard .......10
XPS spectra without plasma treatment ....................................................................11
XPS depth profile of silicon nitride substrates non-plasma treated ......................1219F solution-state NMR...............................................................................................13

Page 3 of 15
Modelling the monolayer on a silicon substrate
The absorption of perfluorododecyl iodide (I-PFC12) on the (001) surface of SiNx was studied by
using density functional theory (P. Hohenberg and W. Kohn; Phys. Rev. 136, B864; 1964). The
calculations were performed using the generalized gradient approximation of Perdew-Burke-
Ernzerhof (John P. Perdew, Kieron Burke, and Matthias Ernzerhof; Phys. Rev. Lett. 77, 3865, 1996)
for the exchange and correlation functional, plus van der Waals interaction corrections (R. Sabatini,
T. Gorni, and S. de Gironcoli Phys. Rev. B 87, 041108(R), 2013) in order to account for the non-
covalent interaction between the I-PFC12 molecules and the surfaces. The electron-ion interactions
were computed using ultrasoft pseudopotentials, including scalar relativistic effects. The energy cut-
off for the plane wave expansion was 30 Ry (300 Ry for the charge density cutoff). Brillouin-zone
integration was performed with the special-point technique (H. J. Monkhorst and J. D. Pack Phys.
Rev. B 13, 5188, 1976) which was done with a 6 × 6 × 1 Monkhorst-Pack grid. The (001)
semiconductor surfaces were modelled by employing a periodically repeated slab geometry using the
(1 × 1) supercell for silicon nitride, with adsorbates on one side of the slab only. The slabs were five
layers thick, and the bottom layers were kept fixed in their bulk positions during relaxations. A 12 Å
vacuum layer was used, which was found to be sufficient to ensure negligible coupling between
periodic replicas of the slab. All calculations were performed using the PWscf code contained in the
Quantum-ESPRESSO distribution (J. Phys.: Condens. Matter 21 (2009) 395502).
a) Contour plot of the charge density defined as Δn(r) = ntot – [nIPFA + nsurf] of perfluorododecyl iodide
(I-PFC12) on a Si (001) surface, linear scale from −0.005 to 0.005 e/Å3 with the increment of 0.003
e/Å3. The charge flows from the red to blue region. The analysis shows that there is significant charge
density reorganisation induced by hybridisation between the valence electrons of the iodine and silicon
atoms, which indicates the formation of a covalent interaction between IPFA and the surface. (b) Side

Page 4 of 15
view and (c) top view of a self-assembled monolayer of I-PFC 12 onto Si (001) surface as calculated
from DFT method. Elements colour code: I, black; C, brown; F, white; Si, blue.

Page 5 of 15
Halogen bond on SiO2 substrate
a) Löwdin atomic charge analysis of perfluorododecyl iodide (I-PFC12) on an alpha-SiO2(001) surface as calculated from density functional theory (see Experimental Section for more details). The terminal I atom the I-PFC12 is linked to the O atom on the substrate surface. The colour of the atoms indicates the electron density redistribution upon the interaction of I-PFC12 with the silica substrate: red (blue) corresponds to electron gain (loss). b) Side view and (c) top view of I-PFC12 on a silicon oxide substrate with the I-PFC12 molecules on the surface as calculated by density functional theory. Element colour codes in b and c: I, violet; C, brown; F, white; O, red; Si, blue.
From the Figure a, we see a significant charge transfer between of the on-surface oxygen atoms and
I-PFC12 molecule. However, different from the case of halogen-bond between I-PFC12 and SiNx
surface, where the electron transfer takes place from N to I, for the case of I-PFC12 on SiO2, the
electron density moves from I to O atoms on the surfaces. This result is consistent with the so-called
multivalent halogen-oxygen bonds, where the lower electronegativity of I compared to O allows iodine
to carry a much larger positive charge distribution and enhances the ionic nature of I–O bonding
(Bioinorg Chem Appl. 2007; 2007: 46393).

Page 6 of 15
Modelling the trans conformation of I-PFC12 on SiNx
a) Löwdin atomic charge analysis of perfluorododecyl iodide (I-PFC12) on a (001) silicon nitride surface as calculated from density functional theory (see Experimental Section for more details). The terminal I atom the I-PFC12 is linked to the N atom on the substrate surface. The colour of the atoms indicates the electron density redistribution upon the interaction of I-PFC12 with the silicon nitride substrate: red (blue) corresponds to electron gain (loss). b) Side view and (c) top view of I-PFC12 on a silicon nitride substrate with the I-PFC12 molecules on the surface as calculated by density functional theory. Element colour codes in b and c: I, black; C, brown; F, white; N, violet; Si, blue.
We calculated I-PFC12 on SiNx surface with a fully trans conformation. From the calculations, we
found that with the new conformer:
The height of the monolayer from the model of I-PFC12 on SiNx (001): 17.12 Å
Averaged C-C bond: 1.623 Å
Averaged C-F bond: 1.307 Å
C-I bond length: 2.190 Å
I-N bond length: 2.805 Å
The binding energy: I-PFC12-SiNx (001) surface: 0.92 eV (88 kJ/mol).
The charge distribution does not change very much compared to the gauche conformation reported in
the main text (see Figure 1a). However, the binding energy (88 KJ/mol) is lower, thus suggesting the
gauche conformation is more favourable.

Page 7 of 15
Atomic force microscopy
Tapping ModeTM AFM topography images of SiNx substrates. a) The plain silicon nitride substrate
was cleaned by sonication for several minutes in distilled ethanol after a thorough cleaning to remove
particulate and acetone. After drying the surface with a high purity nitrogen flow, it was further
cleaned by a CO2 snow jet, and then an air plasma treatment was applied. b) After this cleaning
procedure it was immersed in the I-PFC12 solution in tetradecafluorohexane, and then rinsed for
several hours in a large volume of fresh tetradecafluorohexane. The height scale applies to both
images. Both the samples show a mean rms surface roughness of ca. 0.5 nm. This suggests that either
no molecules have adsorbed onto the substrate, or that adsorbed molecules have formed a uniform and
compact layer, conformably attached to the substrate surface.

Page 8 of 15
Elemental composition extracted from the XPS spectra in Figure 2 of the main text
Silicon nitride immersed in I-PFC12Label Peak binding energy (eV) Atomic content (%) Total atomic content (%)O1s A 530.38 7.43O1s B 530.99 13.09O1s C 531.64 11.35
31.87
Si2p A 100.21 10.92Si2p B 101.65 15.16
26.08
C1s A 283.99 2.6C1s B 287.56 1.39C 1s C 289.92 7.32C1s D 292.25 0.71
12.02
N1s 396.01 9.3 9.3F 1s 687.27 20.73 20.73
Page 9 of 15
Grazing-Angle FTIR
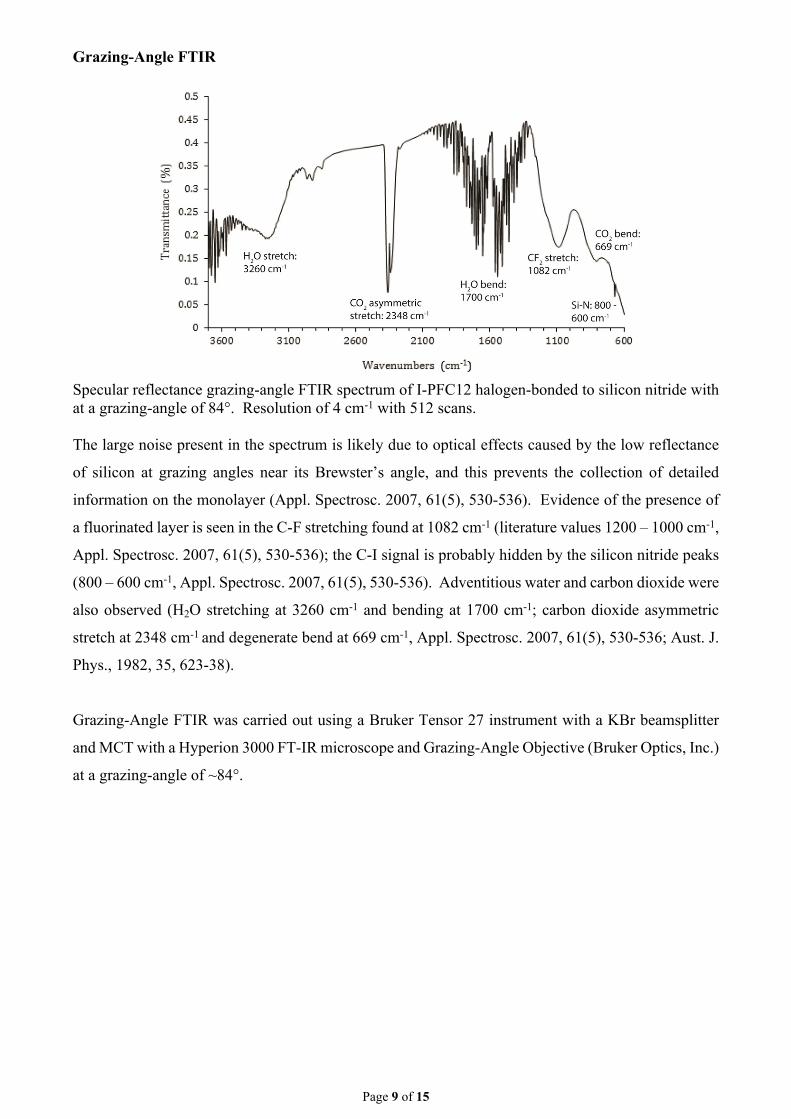
Specular reflectance grazing-angle FTIR spectrum of I-PFC12 halogen-bonded to silicon nitride with at a grazing-angle of 84°. Resolution of 4 cm-1 with 512 scans.
The large noise present in the spectrum is likely due to optical effects caused by the low reflectance
of silicon at grazing angles near its Brewster’s angle, and this prevents the collection of detailed
information on the monolayer (Appl. Spectrosc. 2007, 61(5), 530-536). Evidence of the presence of
a fluorinated layer is seen in the C-F stretching found at 1082 cm-1 (literature values 1200 – 1000 cm-1,
Appl. Spectrosc. 2007, 61(5), 530-536); the C-I signal is probably hidden by the silicon nitride peaks
(800 – 600 cm-1, Appl. Spectrosc. 2007, 61(5), 530-536). Adventitious water and carbon dioxide were
also observed (H2O stretching at 3260 cm-1 and bending at 1700 cm-1; carbon dioxide asymmetric
stretch at 2348 cm-1 and degenerate bend at 669 cm-1, Appl. Spectrosc. 2007, 61(5), 530-536; Aust. J.
Phys., 1982, 35, 623-38).
Grazing-Angle FTIR was carried out using a Bruker Tensor 27 instrument with a KBr beamsplitter
and MCT with a Hyperion 3000 FT-IR microscope and Grazing-Angle Objective (Bruker Optics, Inc.)
at a grazing-angle of ~84°.

Page 10 of 15
19F CP-MAS NMR spectrum of trifluoroacetamide as an internal standard
19F CP-MAS NMR spectrum of trifluoroacetamide as internal standard taken with the Bruker Avance
III 700 MHz spectrometer at 658.9 MHz (60 kHz MAS) Chemical shift of Trifluoroacetamide, δ = -
78.49 ppm, used as a standard for NMR probe tuning to the 19F isotope frequency in a 1.3 mm CPMAS
probe.

Page 11 of 15
XPS spectra without plasma treatment
XPS spectra of silicon nitride substrates that were immersed in a solution of tetradecafluorohexane
with and without (black) perfluorododecyl iodide (red). Different from the spectra in the main text,
the nitride substrates were not treated with the plasma cleaning before the functionalization.
Silicon nitride immersed in I-PFC12 (without plasma treatment)Label Peak binding energy (eV) Atomic content (%) Total atomic content (%)O1s 532.52 15.02 15.02
Si2p A 102.02 27.95Si2p B 103.13 5.66
33.61
C1s A 284.8 9.54C1s B 286.48 0.94C 1s C 287.8 0.15C1s D 289.46 0.3C1s E 292.04 1.8C1s F 294.39 0.21
12.94
N1s 397.8 32.6 32.6F 1s 689.33 5.85 5.85

Page 12 of 15
XPS depth profile of silicon nitride substrates non-plasma treated
The XPS depth profile for the nitride substrate, revealing around 5% oxygen content in the top layer.
Therefore, we cannot exclude that oxygen is also involved in the interaction of the silicon nitride
surface with the iodine of the I-PFC12. Nevertheless, we note that the nitrogen content in the top layer
is significantly higher (40%), suggesting that oxygen is not forming a uniform top layer that may
prevent from a direct interaction between the I-PFC12 and the nitrogen.
Analytical Technique: X-Ray Photoelectron Spectroscopy (XPS)Instrument: ESCALAB250XiManufacturer: Thermo Scientific, UKBackground vacuum: better than 2E-9 mbarX-ray source: mono-chromated Al K alpha (energy 1486.68 eV)Power: 150W (13 kV x 12 mA)Spot size: 500 micrometresPhotoelectron take-off angle: 90 degreesPass energy: 100 eV for survey scans, or 50 eV for depth profiling region scansSoftware: AvantageSpectrometre calibration: Au 4f7 = 83.96 eV, Ag 3d5 = 368.21 eV, Cu2p3 = 932.62 eV

Page 13 of 15
19F solution-state NMR
We investigated the potential covalent attachment of the I-PFC12 on silicon nitride substrates
performing the following experiments:
1. I-PFC12 molecules were adsorbed onto silicon nitride microparticles and then washed
off with deuterated acetone. The nature of the recovered molecules was unchanged, as shown from
the 19F solution-state NMR reported below:
19F solution-state NMR spectra of I-PFC-12 dissolved in acetone-d6 with baseline correction (black)
after removal from Si3N4 nanoparticles; of the pure I-PFC12 solution in (red); solution removed from
pure Si3N4 nanoparticle non-functionalised but washed with pure solvent only, perfluorohexane
(green). Measurements taken on 600 MHz spectrometer with Pre-scan delay = 18 µs and D1 = 8 µs
over 128 scans.
19F NMR chemical shift assignments of IPFC-12 in acetone-d6 as a pure solution and recovered from
silicon nitride nanoparticles; measured on 600 MHz spectrometer. Literature values for ICF2– on 1,8-
diiodoperfluorooctane, halogen bonded to acetone in solution quoted in brackets (J. Fluorine Chem.
2002, 114, 27–33).
I-CF2 (ppm) CF3 (ppm) α-CF2 (ppm) Main CF2 (ppm) ω-CF2 (ppm)
65.1 (65.5) 81.6 114.1 122.2 126.7

Page 14 of 15
2. I-PFC12 molecules were dissolved off a silicon nitride wafer after the functionalized
wafer had been stored on a laboratory bench in ambient light for three days. The molecules dissolved
off the wafers did not resemble the starting I-PFC12, but rather a similar compound without the iodide
attached. This was deduced from the presence of peaks consistent with CF3(CF2)n, but missing the
peaks at -65 and -114 ppm, indicative of the I-CF2-CF2- group (see figure a reported below).
In contrast, when the silicon nitride wafer was stored in the dark before NMR measurements, the
recovered molecule was the unchanged I-PFC12 (see figure b reported below).
a) 19F solution-state NMR spectra of I-PFC12 dissolved in acetone-d6 as upon removal from a silicon
nitride wafer stored on a lab bench, exposed to light for three days. Baseline correction artefacts
indicated with asterisks. Measurements taken on 600 MHz spectrometer with pre-scan delay = 18 µs,
D1 = 8 µs over 128 scans. b) 19F solution-state NMR spectra of I-PFC12 dissolved in acetone-d6 upon
removal from a silicon nitride wafer stored in the dark. Baseline correction artefacts indicated with
an asterisk. Measurements taken on 600 MHz spectrometer with Pre-scan delay = 18 µs, D1 = 8 µs
over 1024 scans.

Page 15 of 15
The results of the NMR analysis suggest that photo-induced dissociation of the I-PFC12 molecule
occurs on the surface of the silicon nitride wafers upon exposure to light. The differences between the
signals found for the wafers and nanoparticles is likely because the majority of the nanoparticles are
buried away from the light while the surface of the wafers is entirely exposed to ambient light. As can
be seen in the figure reported below, I-PFC12 molecules in a perfluorohexane solution are unchanged
over one month of exposure to light, suggesting substrate-mediated photolysis as described in other
studies. Other examples of the photo-dissociated detachment of iodine exist, such as the finding that
photoemission of electrons from the substrate upon exposure to UV light induces the cleavage of the
C-I bonds of iodo-perfluoromethane on surfaces of silver (Wang, Y.; Wang, J.; Li, G. X.; He, G.;
Chen, G. Halogen-Bond-Promoted Photoactivation of Perfluoroalkyl Iodides: A Photochemical
Protocol for Perfluoroalkylation Reactions. Org. Lett. 2017, 19, 1442–1445.)
19F solution-state NMR spectra of IPFC-12 dissolved in acetone-d6 with exposure to light for one
month with baseline correction. Measurements taken on 600 MHz spectrometer with Pre-scan delay
= 18 µs, D1 = 8 µs, over 128 scans.


![Kbr[1] report](https://img.pdfslide.us/doc/110x75/58ee95a31a28ab4c658b45d1/kbr1-report.jpg)
