Embed Size (px)
Citation preview

Supporting Information
For
Facile Synthesis of ECNU-20 (IWR) Hollow Sphere Zeolite
Composed of Aggregated Nanosheets
Lin Zhang,a Yunlei Chen,b,c,d Jin-Gang Jiang,a Le Xu,e Wenping Guo,c* Hao Xu,a*
Xiao-dong Wen,b,c and Peng Wua*
a Shanghai Key Laboratory of Green Chemistry and Chemical Processes, School of
Chemistry and Molecular Engineering, East China Normal University, North
Zhongshan Rd. 3663, Shanghai 200062, P. R. China.
b State Key Laboratory of Coal Conversion, Institute of Coal Chemistry, Chinese
Academy of Sciences, Taiyuan, 030001, China.
c National Energy Center for Coal to Liquids, Synfuels China., Ltd, Huairou District,
Beijing, 101400, China.
d University of Chinese Academy of Sciences, No.19A Yuquan Road, Beijing, 100049,
China.
e College of Chemistry and Molecular Engineering, Peking University, Beijing
100871, PR China.
E-mail address: [email protected] (W. P. Guo); [email protected] (H. Xu);
[email protected] (P. Wu)
Electronic Supplementary Material (ESI) for Dalton Transactions.This journal is © The Royal Society of Chemistry 2017

Synthesis of ECNU-20 zeolites
ECNU-20 was synthesized using 1,8-diazabicyclo[5.4.0]undec-7-ene (DBU) as
structure-directing agent (SDA) from the gels with the molar compositions of 1.0SiO2:
xGeO2: yDBU: 7H2O, where x = 0.2-0.5 and y = 0.5-1.5. In a typical synthesis,
appropriate water was firstly added into DBU (purchased from J&K Chemical, 98%)
followed by the dissolving of GeO2 (Sinopharm Chemical Reagent Co., Ltd, 99.9%)
in the mixture. Fumed silica (Aerosil 200) was then added into the pellucid solution
and the mixture was stirred gently to get a homogeneous gel, which was crystallized
at 443K in a PTFE-lined stainless steel under static station. The product was obtained
by filtration, washed with water and then dried at 353 K for 12 h.
ITQ-241 and ECNU-32 zeolite were synthesized with hexamethonium dihydroxide
and dimethyl-hexamethyleneimine as SDA, respectively, according to the literatures.
Characterization
The X-ray powder diffraction (XRD) patterns were measured on a Riguku
Ultima IV X-Ray diffractometer (35 kV and 25 mA) using Cu-Kα radiation
(λ=1.5405 Å). The Scanning electron microscopy (SEM) images were measured on a
Hitachi S-4800 microscope. The transmission electron microscopy (TEM) images
were collected with a FEI G2F30 with an accelerating voltage of 300 kV. Nitrogen
gas adsorption measurements were carried out at 77 K on a BEL-MAX gas/vapor
adsorption instrument. The zeolite was evacuated at 573 K for at least 6 h before
adsorption. 13C solid-state MAS NMR spectra was performed on a Varian model

VNMRS-400WB spectrometer under one pulse condition. The liquid-state 13C NMR
spectrum for the analyses of the organic amines was recorded on a Brucker Avance
500 spectrometer at ambient temperature. The thermogravimetric and derivative
thermogravity (TG-DTG) analyses were carried out on a Mettler-Toledo Model
TGA/SDTA851e apparatus from room temperature to 1063 K at a heating rater of 10
K min-1 in air.
High-resolution XRD experiment, profile fitting and structure simulation
The high-resolution powder X-ray diffraction (PXRD) data for ECNU-20 was
collected on synchrotron beam line 14B at Shanghai Synchrotron Radiation Facility
(SSRF) with the X-ray wave length of 1.2438 Å. The preferred orientation of the
samples was improved by using 0.5 mm glass capillary as sample holders. The data
was obtained in the 2θ angle range of 5-48° at an effective X-ray energy of 10 keV.
The profile fitting of ECNU-20 was performed using TOPAS 5.0. The coordinates of
the conventional IWR zeolite tetrahedral network was used as starting parameters for
DIFFFax simulation.

Table S1 List of synthesis conditions and the corresponding morphologies of ECNU-
20 zeolite.a
a Crystallization conditions: H2O/SiO2=7; temp., 443 K.
Crystal morphologySi/Ge SDA/Si Time (d)
hollow nanosheet sphere
0.5 9 √
1.0 7 √ √ √2
1.5 7 √ √ √
0.5 9 √
1.0 7 √ √ √3
1.5 7 √ √ √
0.5 14 √
1.0 9 √ √4
1.5 7 √ √
0.5 14 √
1.0 14 √ √5
1.5 9 √ √

(a) (b) (c)
Figure S1. The organic structure directing agents used in the synthesis of the ECNU-
20 zeolite (a), ECNU-3 zeolite (b) and ITQ-24 zeolite (c).
N
N N
OH NN
OH-
OH-

Figure S2. N2 adsorption/desorption isotherms of calcined ECNU-20 zeolite
(Si/Ge=3, SDA/Si=1) (a), calcined ECNU-3 zeolite (b).
Table S2. Physical properties of ECNU-20 zeolite and ECNU-3 zeolite.
SSAa Sextb Vtotal
c Vmicrob Vmeso
d
m2 g-1 m2 g-1 cm3 g-1 cm3 g-1 cm3 g-1
ECNU-3 573.4 68.2 0.27 0.16 0.11ECNU-20 625.1 146.0 0.49 0.14 0.35
a Specific surface area (SSA) determined by N2 adsorption isotherms at 77 K using Langmuir method.b Calculated by t-plot.c Given by the adsorption capacity at relative pressure of P/P0=0.99.d Vmeso=Vtotal-Vmicro
As shown in Table S2, ECNU-20 with interparticle mesopores from the aggregation
of nanosheets exhibited higher external surface area and mesoporous volume than
column-like ECNU-3 zeolite.
0.0 0.2 0.4 0.6 0.8 1.00
40
80
120
160
200
240
280
320
360
b
N2 a
dsor
bed
(STP
) (cm
3 g-1)
P/P0
a
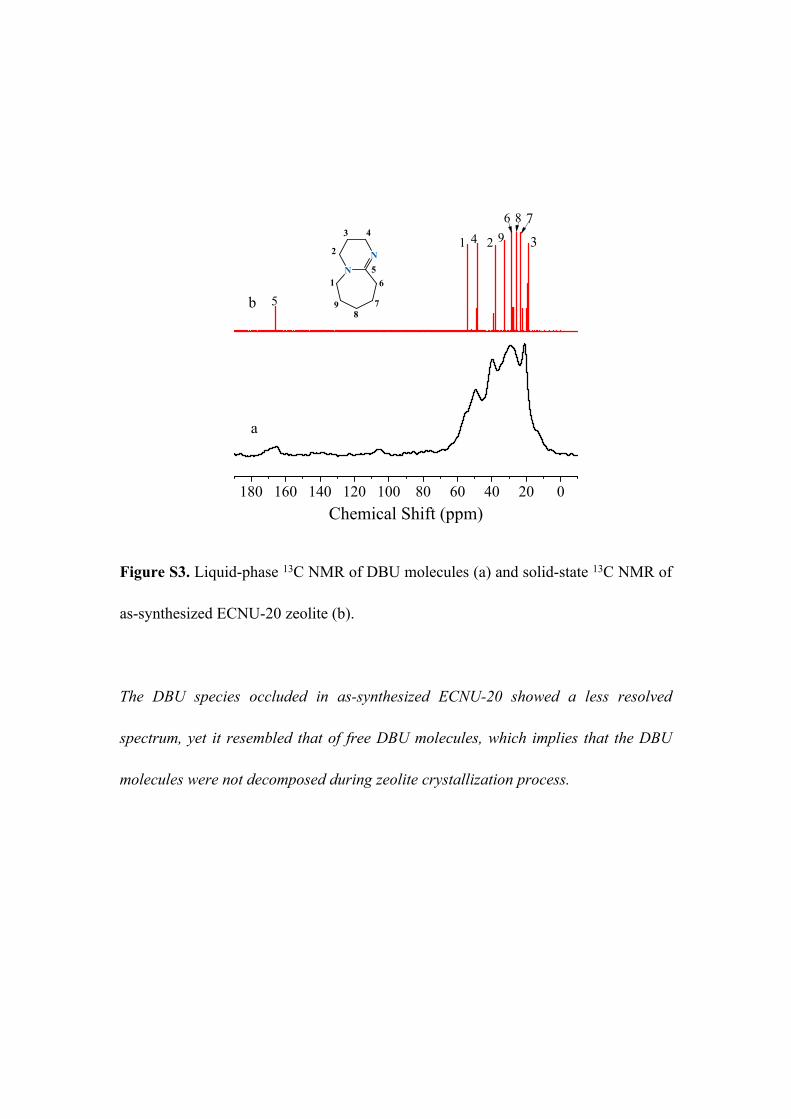
Figure S3. Liquid-phase 13C NMR of DBU molecules (a) and solid-state 13C NMR of
as-synthesized ECNU-20 zeolite (b).
The DBU species occluded in as-synthesized ECNU-20 showed a less resolved
spectrum, yet it resembled that of free DBU molecules, which implies that the DBU
molecules were not decomposed during zeolite crystallization process.
180 160 140 120 100 80 60 40 20 0
b
786924
5
1
Chemical Shift (ppm)
NN
3 4
2
51
98
7
6
3
a

Figure S4. TG-DTG curves of as-synthesized ECNU-20 zeolite.
The first step in TG curve indicated a weight loss of 4.3 wt %, attributed to adsorbed
water molecules. The weight loss between 300°C and 800°C was 15.1 wt % due to the
decomposition of OSDA molecules.
100 200 300 400 500 600 700 800
80
90
100
15.1%TG/%
Temp/℃
4.3%
-1.2
-0.9
-0.6
-0.3
0.0
0.3
DTG
/(%/m
in)

Figure S5. Observed (black), calculated (red) and difference (blue) profiles for the
profile fitting of ECNU-20. The short-tick marks (green) below the patterns indicate
the Bragg reflection positions.
10 20 30 40 50 60 70 80
observed calculated difference Bragg_position
Inten
sity
(a.u
.)
2 Theta (degree)

Table S3. Crystallographic data, experimental conditions for powder X-ray data collection and results of the Pawley fitting of as-synthesized ECNU-20.
Crystal system OrthorhombicSpace group Cmmm (No. 65)
Unit cell dimensions a = 21.3204 Åb = 13.4621 Åc = 12.6837 Å
Volume 3640.44 Å3
PXRD Instrument PANalytical X’-Pert ProTemperature 298(2) KX-ray source Cu Kα1Wavelength 1.540596Å
2θ range 3.000-80.00°No. of reflections 665No. of data points 5864
Profile fitting method Pseudo-VoigtProgram TOPAS 5.0
Rp 0.0123Rwp 0.0164Rexp 0.0099GOF 1.6479

Figure S6. XRD patterns of IWR-type zeolites simulated with a different crystal
thickness of 100 nm (a), 50 nm (b) and 10 nm (c) along c axis.
With decreasing the crystal thickness along c axis from 100 to 10 nm, the c-related
reflections were broadened and weakened in intensify greatly.
5 10 15 20 25 30 35
203022001a
b
Inte
nsity
(a.u
.)
2Theta (deg.)
c

Figure S7. SEM images of ECNU-20 zeolite (SDA/Si=1) synthesized at different
Si/Ge ratio of 2 (a), 4 (b), 5 (c); SEM images of ECNU-20 zeolite (Si/Ge=3)
synthesized at different SDA/Si ratio of 1.5 (d), 0.5 (e); SEM image of ECNU-20
zeolite (Si/Ge=3, SDA/Si=0.5) crystallized for 1 day (f).
a b
3μm
d
5μm
e
c
10μm
5μm 5μm 5μm
f

Theoretical methods and models.
For modeling the interaction between the surface of zeolites and SDA molecules,
one important question that must be addressed first, is how to get the unequivocal
surface structure for porous materials. As demonstrated in a separate study3, a jointly
use of SIESTA4 and VASP5,6 packages is an effective and efficient approach to
explore the surface structures of zeolite. Simply put, the SIESTA package is used for
structure relaxation of system with thousands of atoms, and then the electronic energy
was refined by a single-point energy calculation with the VASP package.
The geometry relaxation was performed by using the SIESTA package with the
Perdew-Burke-Ernzerhof (PBE) functional7,8, wherein a linear-scaling density-
functional methods9 was implemented for efficient calculation of large system. This
package utilizes periodic boundary conditions, norm-conserving pseudopotentials10
and a localized numerical basis set to describe the valence electrons. A double-ζ basis
set with polarization functions was used for all atoms. The Brillouin zone was
sampled at the Γ point with a mesh cutoff of 300 Ry. The split gauss basis set were
used for all atoms. In geometry optimization, the convergence criterion for the
electronic self-consistency was 10−4 eV, and that for the ionic relaxation was set to 10-
3 eV.
Once the structure obtained, the single point energy calculation was followed by
using VASP with the DFT-D3 scheme11,12 as implemented in to account for the weak
interaction between the surface of zeolite and SDA molecules. The exchange-
correlation energy was described by the PBE functional. The Brillouin-zone sampling

was restricted to the Γ point. The electron-ion interaction was solved by the projector
augmented wave (PAW)13,14 method, and the iterative solutions of Kohn-Sham
equations was done using a plane-wave basis set with a cutoff energy of 500 eV. The
convergence criterion for the electronic self-consistency cycle was set to 10-5 eV for
final single-point energy calculation.
Considering Si and Ge are both tetrahedral elements, here we use pure Si
framework as the model system for simplification in following studies. Surface slabs
were created along 7 low-index directions, and stable termination of external surface
was constructed to reduce surface hydroxyls density. The calculated surface free
energies (γ) were listed in Table S4. Each of surface terminations would expose
unsaturated Si or O atoms in the slab model that contains no more than 900 atoms.
The vacuum gap in the slab is kept large enough (~15Å) to prevent unphysical
interactions between the top and the bottom of the surface. The surface slabs were
thick enough for the convergence of surface free energy. The surface free energy was
calculated using the following expression:
(1)
2
2
surf bulk H O
hkl
0K hkl 0K H O,l
hkl
G G nμ (T) A
E (surf ) E (bulk) nμ (T)A
The smaller the surface free energy, the more stable is the corresponding surface
structure. Here, we use the 420 K as the circumstance temperature of water molecular
for getting as possible as close to the actual condition of reaction.
The cell vectors and the middle region in the slab model representing the bulk

phase were fixed during geometry relaxation of the surface structures. In order to
investigate the influence of SDAs on the morphology of zeolite, the adsorption
energies of SDAs on each surface of zeolite were calculated first. Then, the surface
free energy of a bare surface structure was corrected according to the following
expression. The corrected surface free energy γcor15 is given by:
(2)
0K hkl 0K H O,l adcor
hkl
hkl
E (surf ) E (bulk) nμ (T) E (SDAs)2A
The more negative the adsorption energy, the stronger of the interaction between
each surface and SDAs is, accordingly reducing the surface free energy to a larger
extent. To compare the effect of different SDAs on the external surface of zeolites, we
assumed that each half-open cage on the external surface accommodates only one
SDA molecule duo to the size of SDAs molecules.
For efficiently comparing the interactions of SDAs on each external surface, we
adopted slab models with less atoms (as shown in Figure S9) while retaining the half-
open cages on the surface structure as simulated above. The two layers in the bottom
of slabs were fixed in order to maintain the framework of zeolite surface and the other
atoms was fully relaxed to estimate the interaction between SDAs and external
surface of zeolites. The adsorption energy of SDAs on the external surface was
defined as the energy difference between the SDAs-surface complex (Eslab-sda) and the
isolated form of the surface slab (Eslab) and SDAs (Esda):
(3)ads,D3 slab sda sda slabE E E E

To fairly compare the interaction of each SDA with half-open cage on different
surfaces, we only considered the adsorption of the single half-open cage on different
surfaces. The interaction between SDAs and external surfaces was described by the
adsorption energy Eads as listed in Table S5. The stable configurations between
SDAs and these half-open cages were confirmed by comparing different orientations
of SDAs among the half-open cages, we find that the interaction between DMHMI
and external half-open cages is not sensitive to the orientation of DMHMI molecule,
while the amino group of DBU molecule is more prone to the surface silanol due to
the forming of H-bonds (Figure 5c). The most stable orientation was carefully
determined among possible configurations as shown in Figure S9. The adsorption
energy and the corrected surface free energy due to the adsorbed SDAs are listed in
Table S5.

Table S4 The surface free energies of surface termination along 7 directions.
Terminals* γsurf (mJ m-2)(001)a 233(001)b 231(001)c 191(010) 238(100)a 283(100)b 309(100)c 305(110) 205(130) 246(201) 392(510)a 392(510)b 293
*The superscript means the least density of surface hydroxyls along certain direction is not unique.

Figure S8. The structures of stable terminations of (110) surface (a), (100) surface (b),
(001) surface(c) and (010) surface (d) predicted by DFT calculations.
(110) (100) (001) (010)a b c d

Table S5 The adsorption energy Eads (eV) of SDA1 and SDA2 on the external
surfaces of IWR zeolite, the surface free energy γ (mJ m-2) the corrected surface free
energy γcor (mJ m-2). Dcage (1016/m2) means the density of half-cages on the external
surfaces.
Surfaces Dcage (1016/m2) Eads △γ γ γcor
001SDA1 7.1 -0.70 -78 191 113001SDA2 7.1 -1.56 -177 191 14
010SDA1 3.7 -0.78 -48 226 178010SDA2 3.7 -1.39 -84 226 141
100SDA1 5.9 -0.85 -81 270 189100SDA2 5.9 -1.68 -159 270 111
110SDA1 6.3 -0.64 -63 196 133110SDA2 6.3 -1.20 -116 196 80

Figure S9. The geometry of the DMHMI molecule located in the half-cage structure
of the external surface. The DMHMI molecules has a non-planar 7-ring (7R) structure,
which get more close toward the framework of the half-open cage after optimization,
indicating the Van der Waals forces between them. In comparison, DBU mole
additionally interacts with the surface silanols located on the half-open cages as
shown in Figure 5c.

References
1. R. Castañeda, A. Corma, V. Fornés, F. Rey and J. Rius, J. Am. Chem. Soc., 2003,
125, 7820.
2. P. Wu, Y. Liu, N. Liu and M. He, Synthesis of Zeolite ECNU-3, CN 1654328 A
(2005) (in Chinese).
3. Y. Chen, P. Ren, Y. Yun, X. Zhang, W. Guo and X. Wen, Exploration of surface
structure of K-LTL: the prediction of shape and diffusion of single Pt atom,
Manuscript in preparation.
4. J. M. Soler, E. Artacho, J. D. Gale, A. García, J. Junquera, P. Ordejón and D.
Sánchez-Portal, J. Phys.-Condens. Mat., 2002, 14, 2745.
5. G. Kresse and J. Furthmüller, Phys. Rev. B, 1996, 54, 11169.
6. G. Kresse and J. Furthmüller, Comp. Mater. Sci., 1996, 6, 15.
7. J. P. Perdew, K. Burke and M. Ernzerhof, Phys. Rev. Lett., 1996, 77, 3865.
8. J. P. Perdew and Y. Wang, Phys. Rev. B, 1992, 45, 13244.
9. E. Artacho, D. Sánchez-Portál, P. Ordejón, A. García and J. M. Soler, Phys.
Status Solid B, 1999, 215, 809.
10. V. J. Emery and S. A. Kivelson, Phys. C, 1993, 209, 597.
11. E. R. Johnson and A. D. Becke, J. Chem. Phys., 2006, 124, 174104.
12. S. Grimme, S. Ehrlich and L. Goerigk, J. Comp. Chem., 2011, 32, 1456.
13. P. E. Blöchl, Phys. Rev. B, 1994, 50, 17953.
14. P. E. Blöchl, O. Jepsen and O. K. Andersen, Phys. Rev. B, 1994, 49, 16223.
15. G. D. Barmparis, Z. Lodziana, N. Lopez and I. N. Remediakis, Beilstein J.

Nanotech., 2015, 6, 361.