Embed Size (px)
Citation preview

1 | P a g e S u p p o r t i n g I n f o r m a t i o n
Supporting Information Appendix for
“Charting Brachyury-mediated Developmental Pathways During Early Mouse
Embryogenesis”
Table of Contents:
Supplementary Figure 1 - 11.
Supplemental Methods.
Supplementary References.
2 | P a g e S u p p o r t i n g I n f o r m a t i o n
SUPPLEMENTARY FIGURES
3 | P a g e S u p p o r t i n g I n f o r m a t i o n
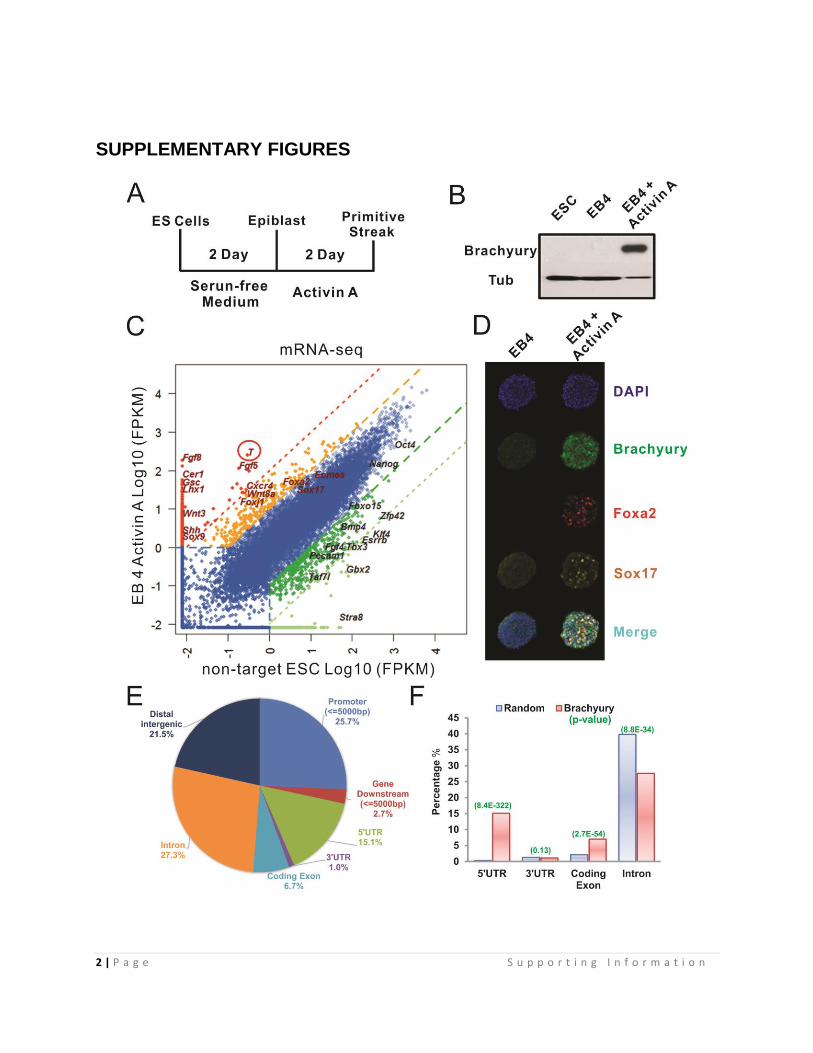
Fig. S1. In vitro Primitive Streak Induction from ES cells
(A) Scheme for ES cell Differentiation: 2 days after culturing in serum-free medium,
embryoid bodies were subjected to a 2 day treatment with Activin A.
(B) Western blots examining Brachyury protein levels after differentiation. ES cells and
EBs without Activin A treatment served as controls
(C) Global differential gene expression analysis by mRNA-seq. The log10-scale FPKM
values of gene for both ES cells and differentiated EBs are plotted. Dark green, 10 fold
down; Light green, 100 fold down; Orange, 10 fold up; Red, 100 fold up relative to the
expression levels in ES cells. See also Dataset S1.
(D) Immunofluorescent staining to analyze primitive streak gene induction (Foxa2, Sox17
and Brachyury) at EB day 4.
(E) Gene-centered Annotation analysis of Brachyury ChIP-seq peaks by CEAS (1)
(F) Brachyury ChIP-seq data set associated gene feature enrichment compared to
random genomic background by CEAS (1)
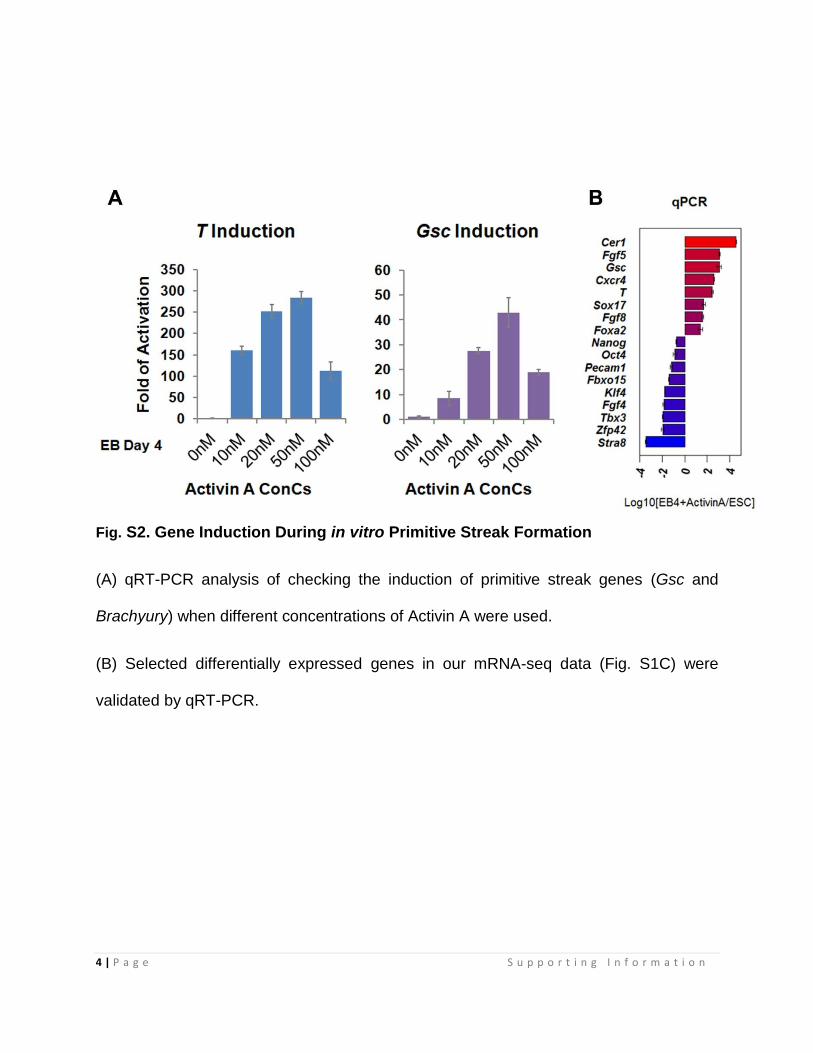
4 | P a g e S u p p o r t i n g I n f o r m a t i o n
Fig. S2. Gene Induction During in vitro Primitive Streak Formation
(A) qRT-PCR analysis of checking the induction of primitive streak genes (Gsc and
Brachyury) when different concentrations of Activin A were used.
(B) Selected differentially expressed genes in our mRNA-seq data (Fig. S1C) were
validated by qRT-PCR.
5 | P a g e S u p p o r t i n g I n f o r m a t i o n
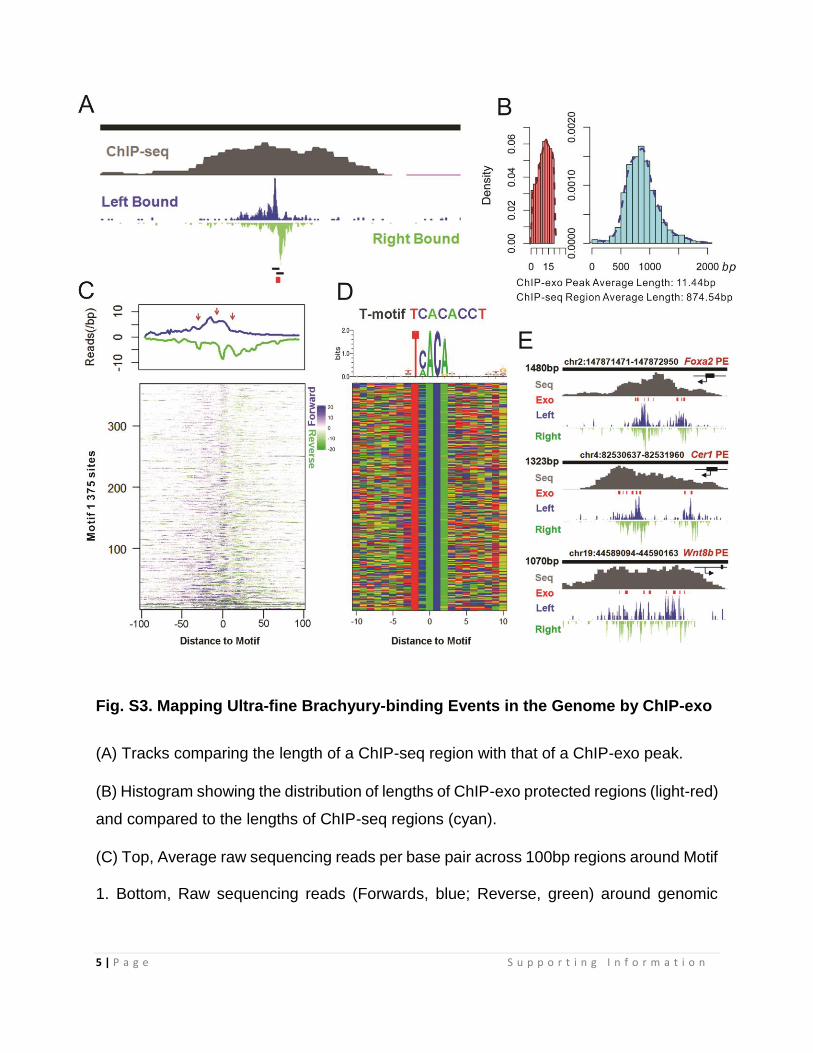
Fig. S3. Mapping Ultra-fine Brachyury-binding Events in the Genome by ChIP-exo
(A) Tracks comparing the length of a ChIP-seq region with that of a ChIP-exo peak.
(B) Histogram showing the distribution of lengths of ChIP-exo protected regions (light-red)
and compared to the lengths of ChIP-seq regions (cyan).
(C) Top, Average raw sequencing reads per base pair across 100bp regions around Motif
1. Bottom, Raw sequencing reads (Forwards, blue; Reverse, green) around genomic

6 | P a g e S u p p o r t i n g I n f o r m a t i o n
regions (1K dataset, See Supplemental Methods) containing the “TCACA” DNA motif (M1)
which matches the first 5 bases of the canonical Brachyury-binding sequence.
(D) Color chart representation of 20bp of sequence located around the midpoint of Motif
1 ordered as in (C).
(E) Multiple Brachyury-binding events were observed at the proximal enhancer (PE)
regions of Foxa2, Cer1 and Wnt8b. The geometric relationship between the PE and the
TSS of the gene is presented at the up-right corner of each ChIP-seq track.
7 | P a g e S u p p o r t i n g I n f o r m a t i o n
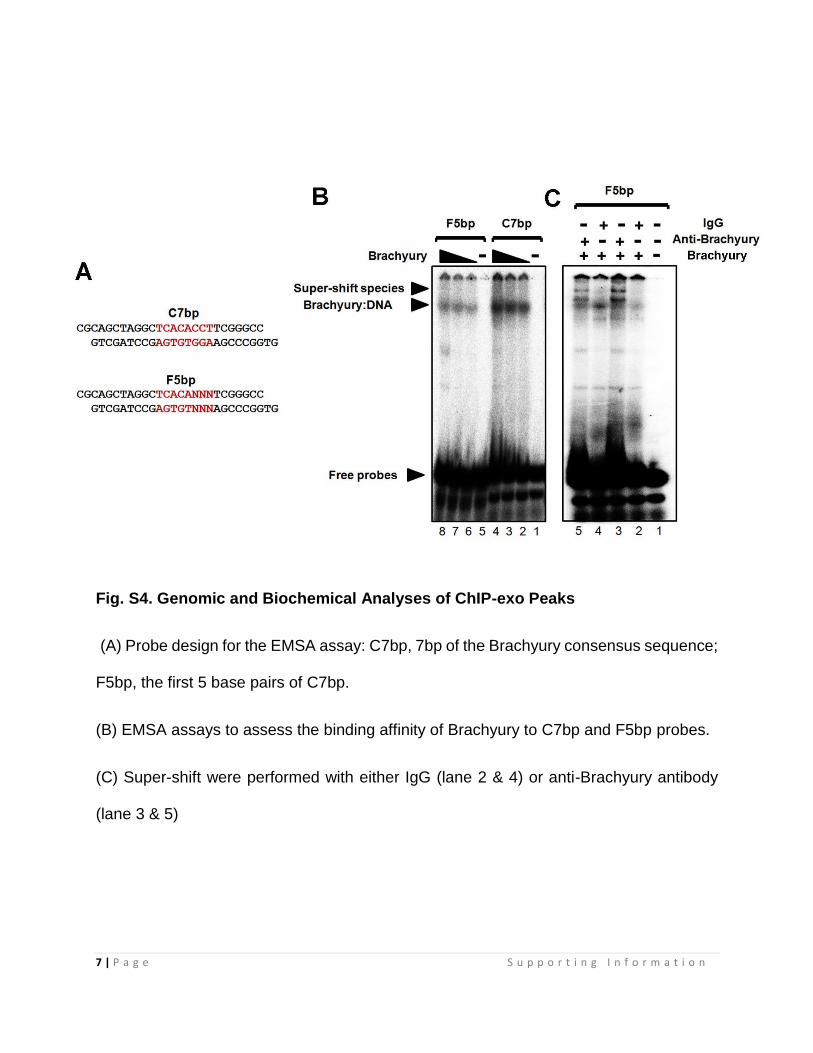
Fig. S4. Genomic and Biochemical Analyses of ChIP-exo Peaks
(A) Probe design for the EMSA assay: C7bp, 7bp of the Brachyury consensus sequence;
F5bp, the first 5 base pairs of C7bp.
(B) EMSA assays to assess the binding affinity of Brachyury to C7bp and F5bp probes.
(C) Super-shift were performed with either IgG (lane 2 & 4) or anti-Brachyury antibody
(lane 3 & 5)
8 | P a g e S u p p o r t i n g I n f o r m a t i o n
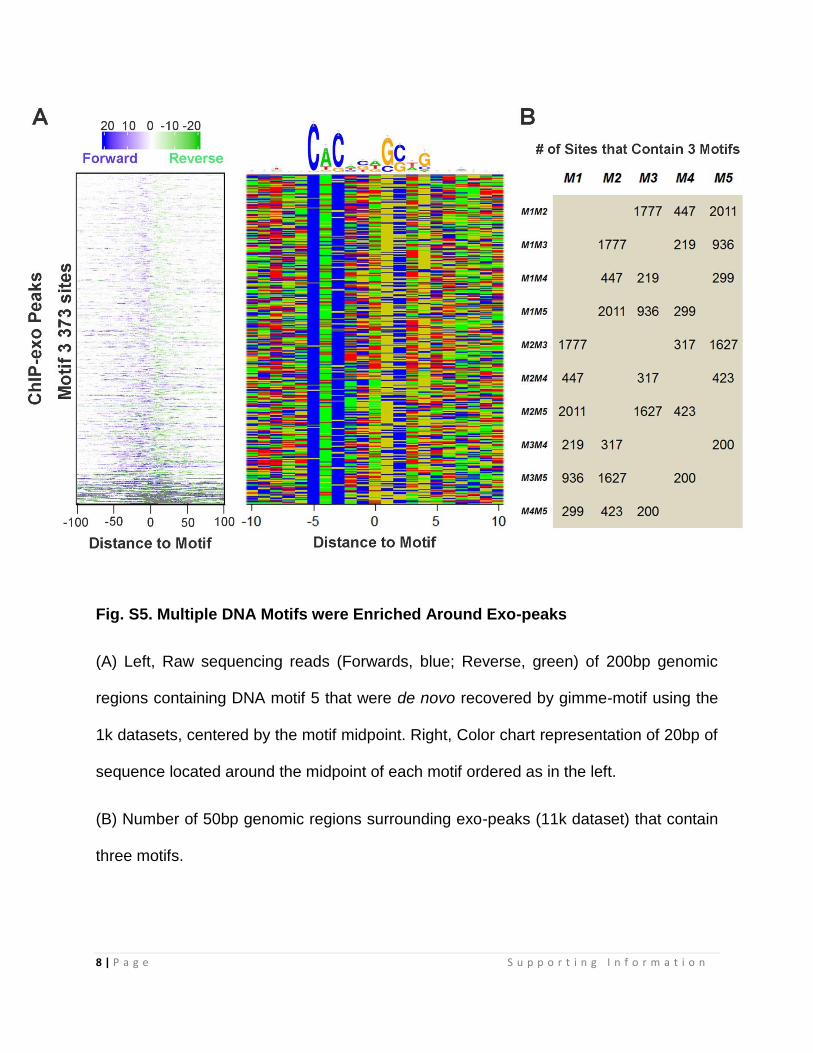
Fig. S5. Multiple DNA Motifs were Enriched Around Exo-peaks
(A) Left, Raw sequencing reads (Forwards, blue; Reverse, green) of 200bp genomic
regions containing DNA motif 5 that were de novo recovered by gimme-motif using the
1k datasets, centered by the motif midpoint. Right, Color chart representation of 20bp of
sequence located around the midpoint of each motif ordered as in the left.
(B) Number of 50bp genomic regions surrounding exo-peaks (11k dataset) that contain
three motifs.
9 | P a g e S u p p o r t i n g I n f o r m a t i o n
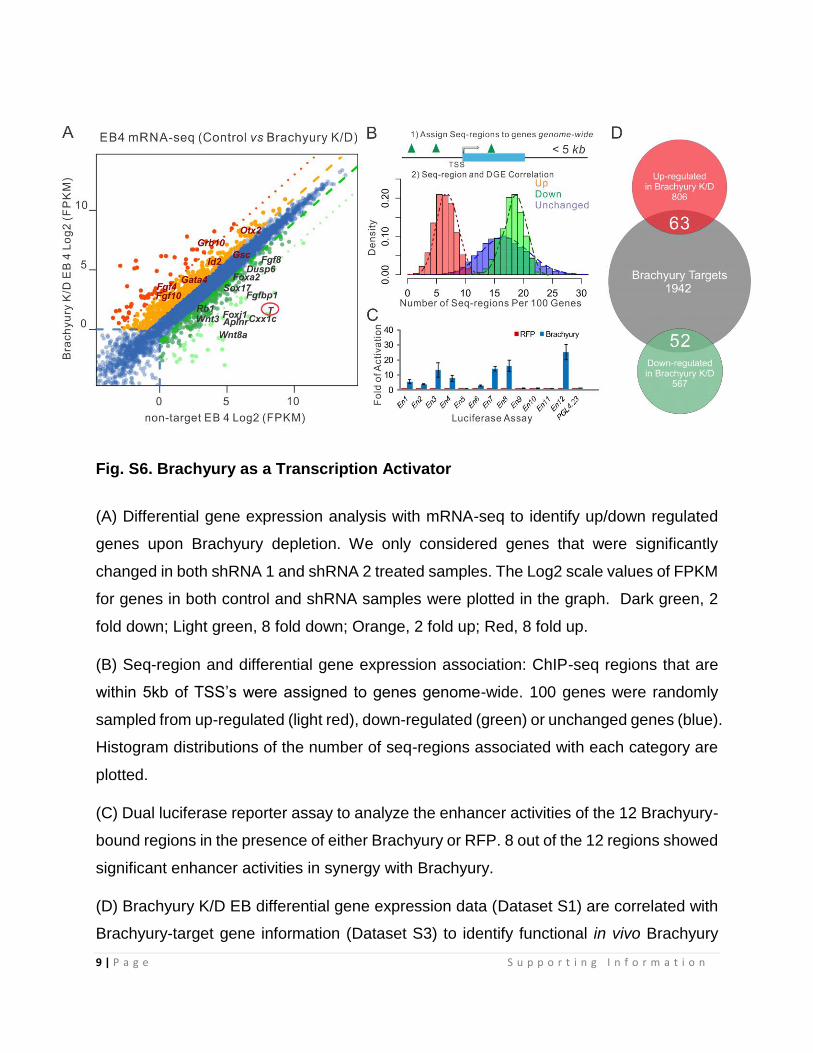
Fig. S6. Brachyury as a Transcription Activator
(A) Differential gene expression analysis with mRNA-seq to identify up/down regulated
genes upon Brachyury depletion. We only considered genes that were significantly
changed in both shRNA 1 and shRNA 2 treated samples. The Log2 scale values of FPKM
for genes in both control and shRNA samples were plotted in the graph. Dark green, 2
fold down; Light green, 8 fold down; Orange, 2 fold up; Red, 8 fold up.
(B) Seq-region and differential gene expression association: ChIP-seq regions that are
within 5kb of TSS’s were assigned to genes genome-wide. 100 genes were randomly
sampled from up-regulated (light red), down-regulated (green) or unchanged genes (blue).
Histogram distributions of the number of seq-regions associated with each category are
plotted.
(C) Dual luciferase reporter assay to analyze the enhancer activities of the 12 Brachyury-
bound regions in the presence of either Brachyury or RFP. 8 out of the 12 regions showed
significant enhancer activities in synergy with Brachyury.
(D) Brachyury K/D EB differential gene expression data (Dataset S1) are correlated with
Brachyury-target gene information (Dataset S3) to identify functional in vivo Brachyury

10 | P a g e S u p p o r t i n g I n f o r m a t i o n
targets. 63 up- and 52 down- regulated Brachyury target genes were identified (listed in
Dataset S4). 2 fold up/down regulated genes are considered in this analysis.
11 | P a g e S u p p o r t i n g I n f o r m a t i o n
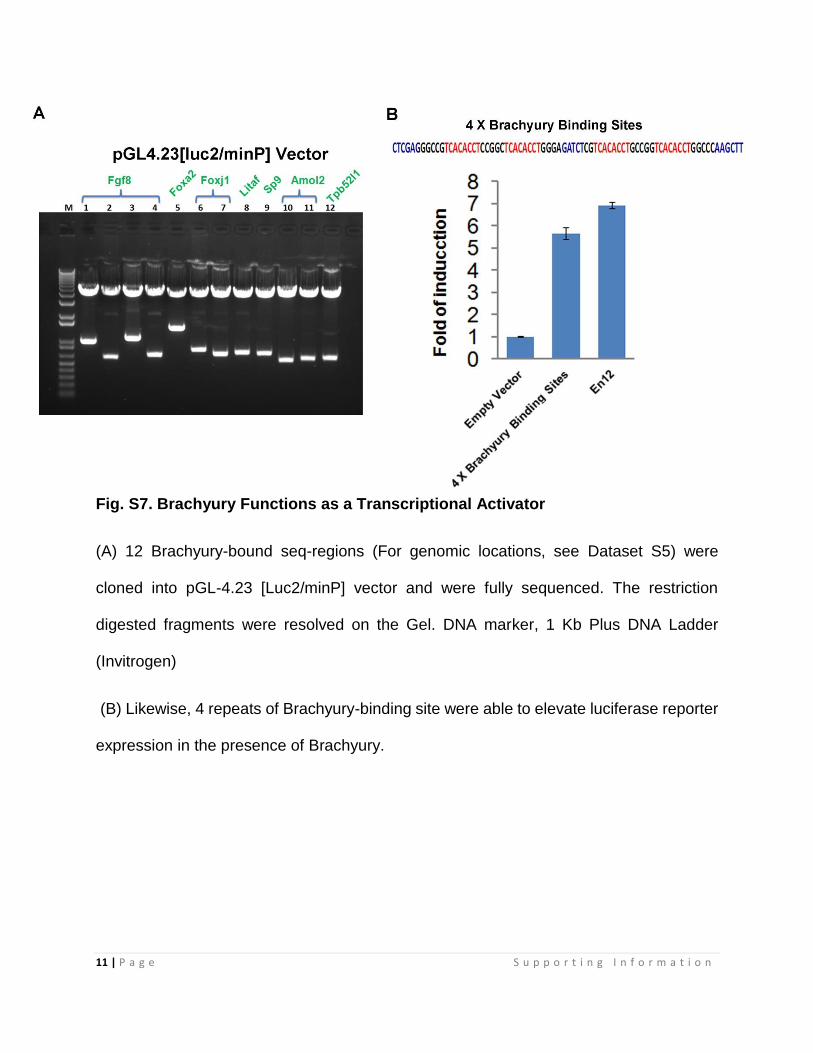
Fig. S7. Brachyury Functions as a Transcriptional Activator
(A) 12 Brachyury-bound seq-regions (For genomic locations, see Dataset S5) were
cloned into pGL-4.23 [Luc2/minP] vector and were fully sequenced. The restriction
digested fragments were resolved on the Gel. DNA marker, 1 Kb Plus DNA Ladder
(Invitrogen)
(B) Likewise, 4 repeats of Brachyury-binding site were able to elevate luciferase reporter
expression in the presence of Brachyury.
12 | P a g e S u p p o r t i n g I n f o r m a t i o n
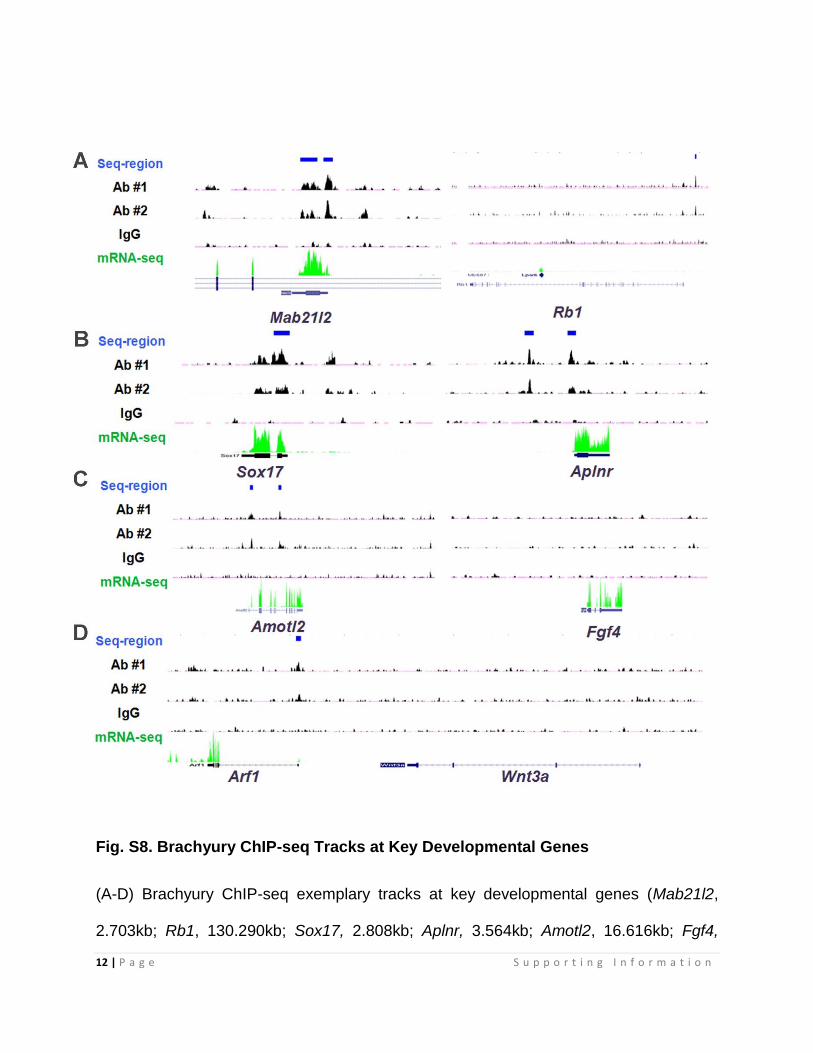
Fig. S8. Brachyury ChIP-seq Tracks at Key Developmental Genes
(A-D) Brachyury ChIP-seq exemplary tracks at key developmental genes (Mab21l2,
2.703kb; Rb1, 130.290kb; Sox17, 2.808kb; Aplnr, 3.564kb; Amotl2, 16.616kb; Fgf4,
13 | P a g e S u p p o r t i n g I n f o r m a t i o n
3.858kb; Wnt3a, 42.71kb). Y axis limit is from 3 to 50 reads for chip-seq data. Auto-scale
is used for mRNA-seq.
Note: Brachyury is highly conserved among all bilaterian animals. Several developmental
genes have been identified as Brachyury direct targets in different model organisms. For
example, Fgf4 is a bone fide target of Brachyury in Xenopus (2). Cyp26a1 is a Brachyury
target in Zebrafish (3). Although Fgf4 and Cyp26a1 are still moderately expressed after
differentiation, no Brachyury sites were found around these two genes (C-D), suggesting
that these regulations are probably evolutionarily divergent. Interestingly, consistent with
the previous report (4), we also found that Wnt3 was down-regulated by Brachyury K/D.
However, no Brachyury sites were located in proximity of the gene (D), implying an
indirect regulation.
14 | P a g e S u p p o r t i n g I n f o r m a t i o n

15 | P a g e S u p p o r t i n g I n f o r m a t i o n
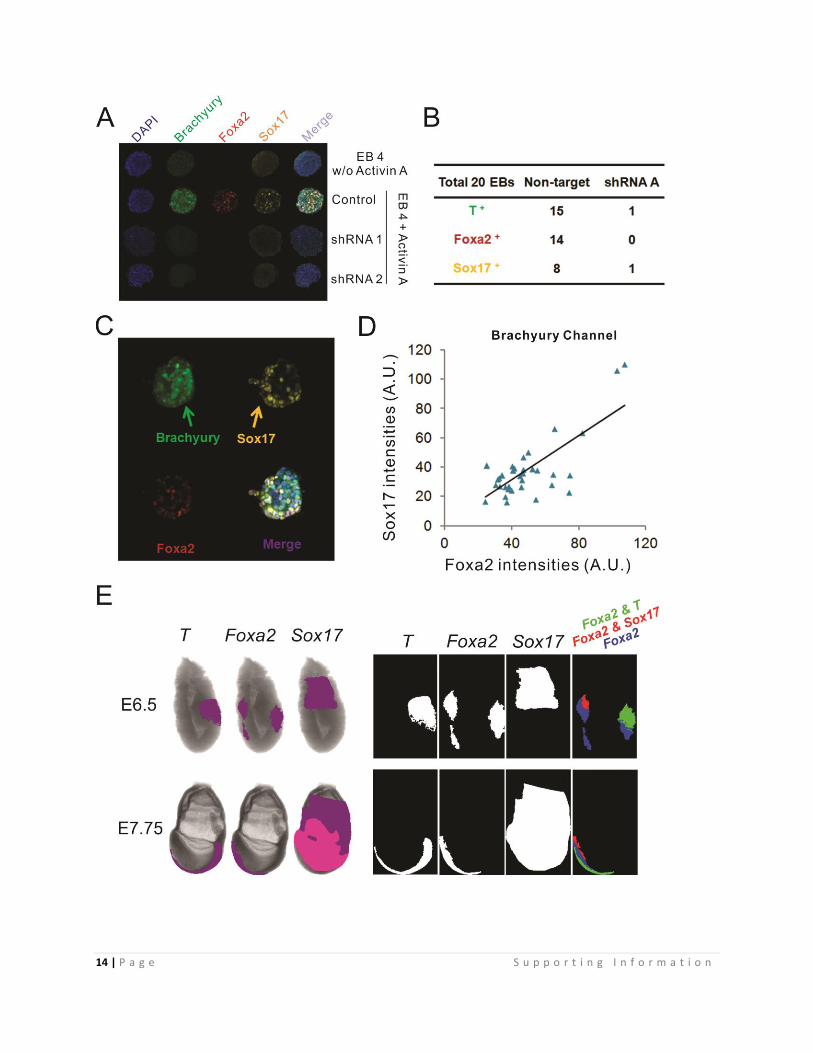
Fig. S9, Extension data for Fig. 3
(A) Immunofluorescent staining to analyze primitive streak gene induction (Foxa2, Sox17
and Brachyury) at EB day 4 without or with Brachyury K/D. Control was the same as in +
Activin A lane shown in Fig. S1D. Statistics was listed in (B).
(B) Counting statistics of Brachyury, Sox17 and Foxa2 positive EBs for control and
shRNA A treated samples
(C) Image showing an EB that had separated Brachyury and Sox17 expressing poles.
(D) Positive correlation between the protein levels of Sox17 and Foxa2 (middle
expression levels) when segmented cell areas were determined by the Brachyury channel.
Middle-to-low expression levels of Foxa2 and Sox17 were detected.
(E) Left, In Situ Hybridization (ISH) assay mapping Brachyury, Foxa2 and Sox17 gene
expression in E6.5 and E7.75 Wt embryos. The publicly shared data was obtained from
EMAGE gene expression database under the citation agreement (id; EMAGE: 111, 3674,
587, 104, 255 and 598)
(http://www.emouseatlas.org/emage/) (5).
Right, the spatial gene expression patterns for images in left panel were extracted with
color information by Matlab and tested for overlaps. The expression of Brachyury and that
of Foxa2 overlap at definitive endoderm and node region. The expression of Sox17 and
that of Foxa2 overlap at the definitive endoderm region.
16 | P a g e S u p p o r t i n g I n f o r m a t i o n
17 | P a g e S u p p o r t i n g I n f o r m a t i o n
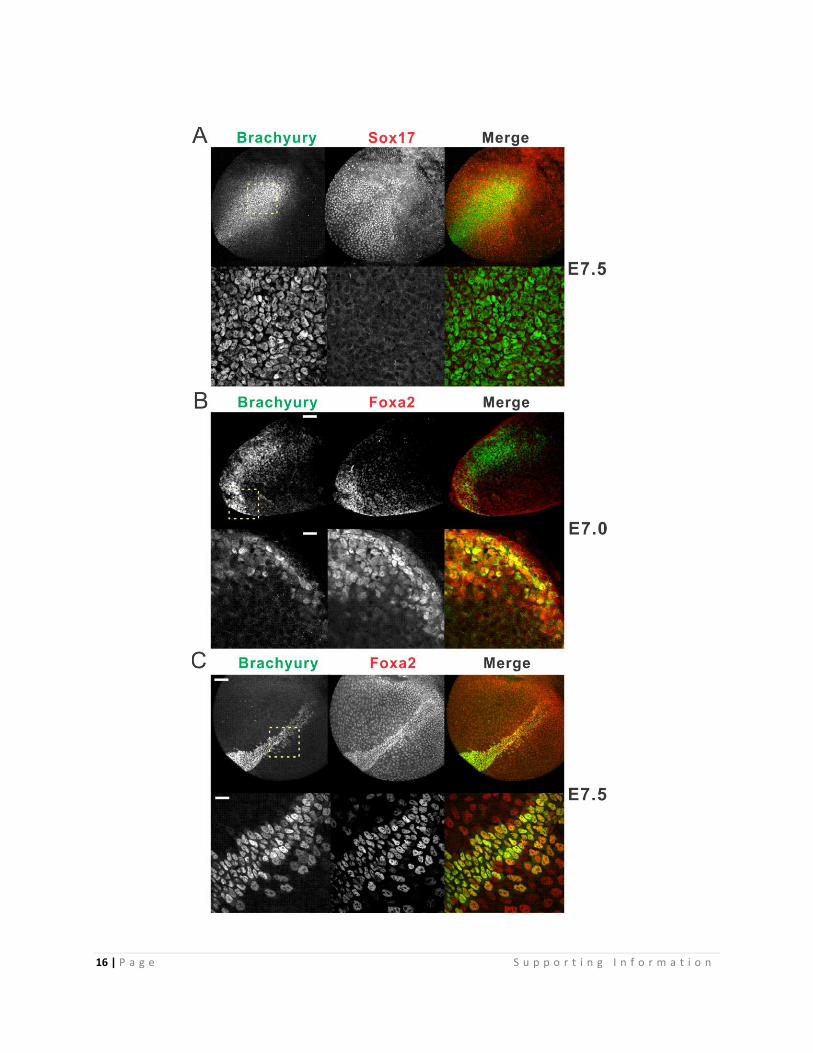
Fig. S10. Brachyury and Foxa2 Embryo Co-Immuno-Staining
(A) Whole mount Brachyury and Sox17 Immuno-staining confocal analysis of E7.5
embryos. Cross section covering primitive streak was selected to show. For other regions,
see Movie S2. Upper 10X magnification (scale bar 100 µm), lower 40X oil magnification
(scale bar 25 µm) of the posterior primitive streak region indicated by the yellow dashed
box in upper panel.
(B) Whole mount Brachyury and Foxa2 Immuno-staining confocal analysis of E7.0
embryos. Cross section covering primitive streak and definitive endoderm is selected to
show. For other regions, see Movie S2. Upper 10X magnification (scale bar 100 µm),
lower 40X oil magnification (scale bar 25 µm) of the node and DE region indicated by the
yellow dashed box in upper panel
(C) Whole mount Brachyury and Foxa2 Immuno-staining confocal analysis of E7.5
embryos. Node/Definitive endoderm region was selected to show. For other regions, see
Movie S2-3. Upper 10X magnification (scale bar 100 µm), lower 40X oil magnification of
DE region indicated by the yellow dashed box in upper panel (scale bar 25 µm). The
anatomy terms of early mouse embryo are reviewed in (6)
18 | P a g e S u p p o r t i n g I n f o r m a t i o n
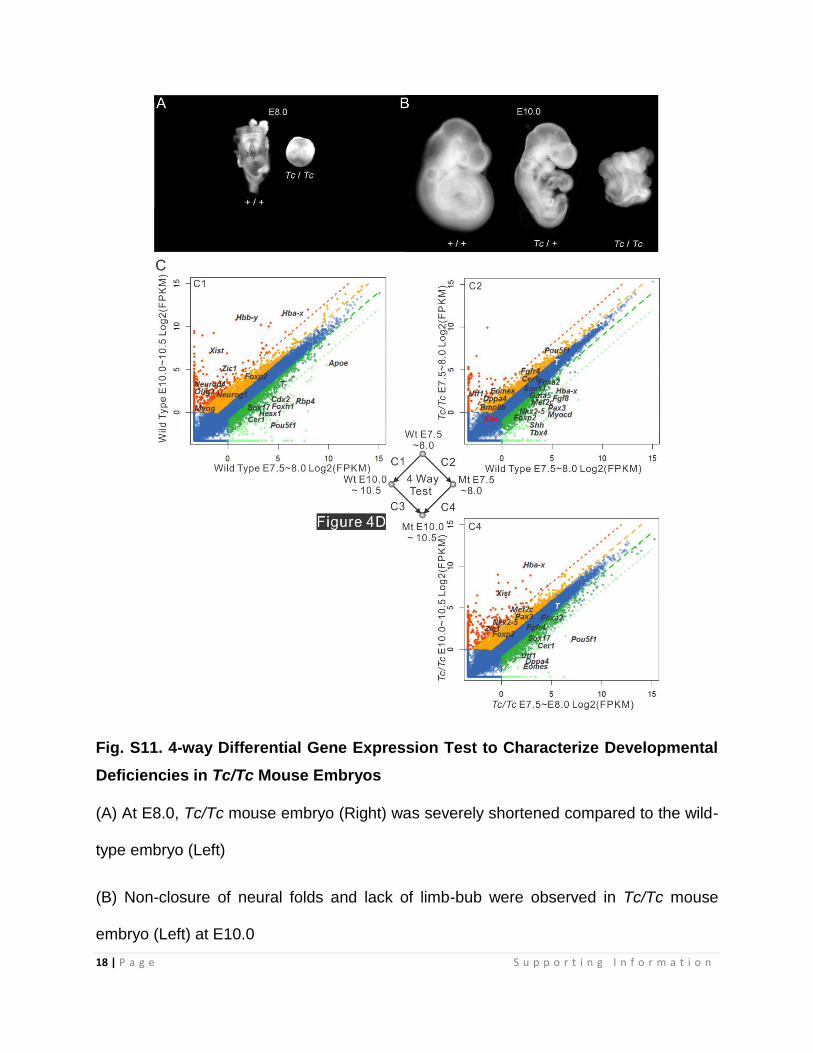
Fig. S11. 4-way Differential Gene Expression Test to Characterize Developmental
Deficiencies in Tc/Tc Mouse Embryos
(A) At E8.0, Tc/Tc mouse embryo (Right) was severely shortened compared to the wild-
type embryo (Left)
(B) Non-closure of neural folds and lack of limb-bub were observed in Tc/Tc mouse
embryo (Left) at E10.0
19 | P a g e S u p p o r t i n g I n f o r m a t i o n
(C) Middle: Diagram of the 4-way comparison for embryos of the indicated genotype and
stage. Wt - Wild-type; Mt – Tc/Tc. Arrow starts with control sample and points at the
treated sample. Total of 4 comparisons were performed. The Log2 scale values of FPKM
for genes in both control and Tc/Tc mutant samples are plotted in the graph. Dark green,
2 fold down; Light green, 8 fold down; Orange, 2 fold up; Red, 8 fold up. The diagram for
the Tc/Tc and WT comparison is presented in Fig. 4D. Selected significantly up and down-
regulated genes are displayed in each graph. All differential gene expression and gene
ontology association data are listed in Dataset S1.
Note:
To fully understand the consequences of Brachyury Loss-of-function, we
conducted a 4-way differential gene expression analysis (C). Specifically, the test
between wild-type samples (Comparison 1, C1) would provide us the baseline information
for normal developmental progress made from E7.5~8.0 to E10.0-10.5. Developmental
deficiencies in the Tc/Tc embryos could then be discerned from the C2 and C3 tests.
Notably, from the C1 comparison, we detected dramatic up-regulation of genes involved
in neural differentiation (Zic1, Foxp2, Neurod4, Olig2 and Neurog1), skeletal muscle
formation (Myog), haematopoiesis (Hbb-y and Hba-x), anatomical structure
morphogenesis (Hoxa6, Hoxc10) and X-chromosome inactivation (Xist). By contrast,
genes involved in gastrulation (T, Cdx2), visceral endoderm (Sox17, Cer1 and Ape),
cardiovascular system development (Foxh1) and pluripotent stem cell maintenance
(Pou5f1) were significantly down-regulated. These differential gene expression changes
20 | P a g e S u p p o r t i n g I n f o r m a t i o n
correlated well with the rapid axial mesoderm development, somite formation, and
neurogenesis that occur between E8.0 and E10.0.
From the C2 comparison, we found that haematopoiesis (Hba-x), cardiovascular
system development (Gata5, Mef2c, Nkx2-5), limb bud formation (Tbx4), gastrulation
(Fgf8) and notochord development (Shh) were all severely compromised in the Tc/Tc
embryos at E7.5~8.0 (C). In line with these observations, at E10.0~10.5, the fetal blood
(Hba-x, Hba-y), neural differentiation (Zic1, Foxp2 and Olig2, Neurog1 and Neurog4) and
skeleton muscle markers (Myog) were significantly down-regulated. It is also worth noting
that the X-chromosome inactivation effector, Xist, was dramatically up-regulated in the
E10.0~10.5 Tc/Tc embryos as seen in wild type E10.0~10.5embryos, indicating a fair
comparison between these two conditions. However, in contrast to E7.5~8.0,
cardiovasulcar system development in the E10.0~10.5.Tc/Tc embryos appears to be
normal. Next, we found that genes involved in cardiovasulcar system development (Mef2c
and Nkx2-5) were significantly up-regulated in E10.0~10.5 Tc/Tc embryos (Comparison
4, C4). Together, these data suggest that Brachyury-mediated regulation promotes
cardiovascular system induction but may not be necessary for its early development. It’s
interesting to note that cardiovascular lineages originate from lateral plate mesoderm(7).
On the other hand, Brachyury is clearly essential for axial mesoderm related
developmental processes, such as notochord development and neural tube patterning
(8). These results suggest that Brachyury might provide distinct functions for axial and
lateral plate mesoderm development. Since notochord is critical for proper neural tube
induction and formation, the lack of notochord formation and sonic hedgehog signaling
could at least partially explain some of the neural differentiation defects observed in the
21 | P a g e S u p p o r t i n g I n f o r m a t i o n
Tc/Tc mice. Interestingly however, unlike the in vitro differentiation system, we didn’t
observe significant changes of Foxa2 and Sox17 gene expression in Tc/Tc mouse
embryos (Dataset S1).
We note that Brachyury functional targets detected in vivo versus in vitro only
partially overlap (Dataset S4). This result may be in part due to the fact that In vitro
primitive streak formation is an isolated system with relatively high purity of Brachyury
expressing cells. Under such conditions, it is likely easier to detect Brachyury regulation
of genes whose expression is not specific to primitive streak such as Foxa2, Sox17,
Dusp6 as well as house-keeping genes (Rb1, Rps3a, Rpl22). We suspect that in vivo, the
impact of Brachyury loss-of-function on these genes may be masked by redundant gene
expression from other tissue types in the embryo. On the other hand, in an isolated in
vitro differentiation system, the in vivo developmental and signaling cues from other cell-
types are missing. Thus, it would be less likely for us to detect expression changes of
genes regulated by Brachyury in synergy with external signals. The opposite situation
occurs in vivo where it may be easier to identify expression changes of genes regulated
by Brachyury in conjunction with external signaling pathways. This situation may also
explain why most Brachyury target genes identified in Tc/Tc embryos are related to a
specific signaling pathway and the induction of a specific cell-type (Fgf8, Wnt5b, Msgn1,
Mllt3). One advantage of our study is that the combination of both in vitro and in vivo
approaches might provide a more comprehensive set of potential functional Brachyury
target genes. Taken in aggregate, these studies provide a useful guide for future genetic
studies to achieve a better understanding of the finely balanced cell-lineage commitment
and morphogenic events mediated by Brachyury. Our studies also suggest that the in

22 | P a g e S u p p o r t i n g I n f o r m a t i o n
vitro differentiation of ES cells could provide a useful system to isolate and study critical
regulatory factors of cell-fate determination and that could be extended to study
transcriptional control mechanisms of other early developmental regulators.
23 | P a g e S u p p o r t i n g I n f o r m a t i o n
SUPPLEMENTAL METHODS
ES Cell Culture and Differentiation
Mouse D3 (ATCC) ES cells were cultured on 0.1% gelatin coated plates in the absence
of feeder cells. The ES cell medium was prepared by supplementing knockout DMEM
(Invitrogen) with 15% FBS, 1mM glutamax, 0.1mM nonessential amino acids, 1mM
sodium pyruvate, 0.1mM 2-mercaptoethanol and 1000 units of LIF (Millipore). Serum free
in vitro differentiation of EBs was performed as previously described (9) with minor
modifications. Specifically, cells were plated at a concentration of 75,000cells/ml. After 2
days, 20ng/ml Activin A (R&D) was added into medium without dissociation/re-
aggregation. After 2 additional days, EBs were harvested for experiments. As for
electroporation experiment with EB day 2 cells, EBs were first dissociated by trypsin into
single cells and then, we used the Nucleofector Kits for Mouse Embryonic Stem Cells
(Lonza) for electroporation.
Brachyury Antibody Production
For antibody used in Brachyury western blot, staining and ChIP experiments, rabbits were
immunized with Brachyury residues 249-436 GST fusion proteins. It is important to note
that the sequence of the antigen region is specific to Brachyury but not to other T-box
proteins. The antisera obtained were further affinity-purified using MBP-antigen fusion
protein immobilized on Affigel 10/15 resin (Bio-Rad).
Lentivirus-mediated shRNA Knockdown
24 | P a g e S u p p o r t i n g I n f o r m a t i o n
Anti-Brachyury shRNA A (Sense, 5-CCTTCCTTGATGCCAAAGAAA-3) and anti-
Brachyury shRNA B (Sense, 5-GCCTGTGTCTTTCAGCAAAGT-3) were cloned into
pLKO.1 - TRC Cloning Vector (10). Lentiviral particles were generated by transfecting
TLA-HEK293T cells (Open Biosystems) with a PLKO.1 shRNA vector and packaging
vectors, psPAX2 and pMD2.G (Addgene), according to the RNAi consurtium protocol (10).
Viruses were concentrated using Fast-Trap Lentivirus Purification and Concentration Kit
(Millipore). The titer of virus stock was determined using QuickTiter Lentivirus Titer Kit
(Cell Biolabs. Inc).
Western Blot
Whole cell extracts from ES Cells and EBs were isolated using RIPA buffer that contained
Complete Protease Inhibitor Cocktail (Roche). Protein concentrations were measured
using Bio-Rad Protein Assay against BSA standards. Protein from each sample was
resolved by SDS-PAGE. Primary antibodies used: Brachyury (Custom-made), Sox17
(R&D systems AF1924), Foxa2 (Cell Signaling 8186), beta-tubulin (E7) and beta-actin
(A2228, Sigma). HRP conjugated secondary antibodies (Pierce) were used at a dilution
of 1:5000. Western Lightning Plus–ECL (Perkin) was used for chemiluminescent
detection.
qRT-PCR
Total RNA was extracted with Trizol LS Reagent (Invitrogen), and reverse-transcribed by
SuperScript III First-Strand Synthesis System with oligo-dT primer (Invitrogen). cDNA
25 | P a g e S u p p o r t i n g I n f o r m a t i o n
corresponding to 10ng of total RNA was used in each iQ Sybr Green Supermix (Bio-Rad)
reaction. Reactions were performed in triplicates on a DNA Engine Opticon 2 Real Time
cycler. Cycle threshold values (log2 scale) were obtained in MJ opticon analysis software
(Bio-Rad). Housekeeping genes, beta-actin and Gapdh, served as internal controls.
Primer information is in Dataset S5.
Immunofluorescence Staining
Whole mount staining was performed for embryoid bodies and embryos in suspension.
EB or Embryo samples were first fixed with 4% paraformaldehyde, permeabilized with
PBST (PBS plus 0.2% Triton X-100) and blocked with 10% FCS and 1% BSA in PBST.
Samples were stained with primary antibody in blocking solution. Primary antibodies used:
Brachyury (custom-made, 1:200), Sox17 (R&D systems AF1924, 1:200), Foxa2 (Cell
Signaling 8186, 1:200; R&D system AF2400, 1:100). Secondary antibodies: DyLight
488/549/649 conjugated secondary antibodies (anti-mouse, anti-goat, or anti- rabbit,
1:400, Jackson ImmunoResearch). For triple staining, to avoid secondary antibody cross-
talk, Brachyury antibody was directly conjugated with DyLight 488 Amine-Reactive Dye
and Kits (Pierce). Nuclei were counterstained with DAPI. All imaging analysis was
performed by using ImageJ (11).
Genotyping of Tc/Tc mouse
Tc allele has a 19bp deletion from 1161 to 1179 bp of the Brachyury coding DNA
sequence (CDS), leading to a frame shift and substituting the C-terminal 50 amino acids
26 | P a g e S u p p o r t i n g I n f o r m a t i o n
to an unrelated sequence (32 amino acids) (8). For genotyping, we performed genomic
DNA PCR by two primers flanking the deletion:
P1, 5-CTCTGGTCTGTGAGCAATGGTAC-3;
P2, 5-GTCAGAAATGTCTGTGACTGTAGCAG-3;
DNA sequencing was used to confirm the deletion. Genomic DNA was recovered by
TRizol LS reagent (Invitrogen) after Total RNA extraction.
mRNA-seq Library Preparation
Total RNA was extracted from EB and embryo samples by TRIzol LS reagent (Invitrogen).
For EB samples, 8µg of the total RNA from each sample was convert to mRNA-seq library
using mRNA-Seq Sample Prep Kit (Illumina). For mouse embryo samples, we used 4~5
Tc/Tc or WT embryos at each time point (E7.5~8.0, E10.0~10.5). mRNA was first
enriched from 2µg of the total RNA by Dynabeads Oligo(dT) (Invitrogen). Then, directional
mRNA-seq libraries was prepared by ScriptSe v2 Kits (Epicentre).
Expression Level Estimation, Differential Expression Testing and Gene Ontology
Analysis
We sequenced ESC and EB day 4 mRNA-seq samples in 50bp paired-end format (PE
reads; 1 lane HiSeq per sample). Mouse embryo directional RNA-seq samples were
sequenced in 50bp single-end format (1 lane HiSeq per sample). We mapped our
sequencing data back to the mouse reference genome (mm9) by Bowtie (12). Transcript
isoforms were reconstructed from PE reads using Tophat (13) and abundances estimated
using Cufflinks (14). Read counts were tallied for each Ensembl annotated protein-coding
27 | P a g e S u p p o r t i n g I n f o r m a t i o n
gene (Ensembl 61) incremented by 1 and differential expression tested using Cuffdiff
using all qualified samples. Gene Ontology (15) analysis was performed separately on
up-regulated and down-regulated genes at each time-point using GOSeq (16) with
Wallenius gene-length correction.
ChIP-seq and ChIP-exo library preparation
Chromatin Immunoprecipitation (ChIP) was performed according to (17) with minor
modifications. Briefly, cross-linked EB chromatin was sheared using Covaris S2 system
to a size range of 100bp ~ 400bp. Immunoprecipitation was conducted with either a
specific antibody or mock IgG conjugated Protein A (rabbit and guinea pig) or G (mouse)
Sepharose beads (GE Healthcare). The reverse cross-linking was performed at 70oC
overnight. After RNAse A and Proteinase K treatment, sample was deproteinized with
UltraPure Phenol: Chloroform: Isoamyl Alcohol (Invitrogen) and further purified with
Qiaquick PCR purification kit (Qiagen). DNA concentration was measured with Quant-
iT™ PicoGreen dsDNA Reagent (invitrogen). About 10ng of ChIP enriched DNA was
converted to ChIP-seq library using ChIP-seq DNA Sample Prep Kit (Illumina). ChIP-exo
library was prepared by following the published protocol with minor modifications (18).
Specifically, we adapted the SoLid sequencer adaptors/primers to make the final library
compatible with the illumina Tru-seq small-RNA system. The detailed primer information
is in Dataset S5.
ChIP-seq Peak Calling, Seq Region Definition and GREAT Analysis
28 | P a g e S u p p o r t i n g I n f o r m a t i o n
We sequenced chromatin-IP and control libraries in 50bp single-end format for ChIP-seq
libraries (one lane of HiSeq per sample). Reads were mapped to the mouse genome
(mm9) using Bowtie (12) and peaks called using MACS (2.0beta; (19)) at an approximate
1% FDR (“bound regions”). We merged overlapping bound regions from both antibodies
to produce a set of 3160 regions. Bound-regions and annotation-terms association was
calculated by Genomic Regions Enrichment of Annotations Tool (GREAT) (20).
Evolution Conservation Analysis
Mouse genes with one or more Brachyury binding sites 10kb < the TSS were considered
as Brachyury target genes (Dataset S4). The list of 218 Zebrafish Brachyury homolog (Ntl)
target genes was obtained from the report by Morley et al. (21) and we further converted
zfin gene symbols to ensembl gene symbols (Dataset S4). Common genomic regions
bound by Xenopus Brachyury homolog (XBra) (Stage 11-12.5) detected in both ChIP-seq
replicates (22) were correlated with JGI v4.1 assembly gene annotations. Genes with one
or more XBra binding sites 10kb < the TSS were considered as XBra Target genes
(Dataset S4). Zebrafish and Xenopus target genes were converted to mouse homolog
genes by ensemble BioMart (23) and then correlated with mouse target gene information.
The results are listed in Dataset S4.
ChIP-exo Peak Calling and Bound-region Definition
We sequenced exo library in 50bp single-end format by using the illumina HiSeq platform.
After removal of the 3 prime most 14 bp which tend to have higher error rates, we mapped
our sequencing data back to the mouse reference genome (mm9) by Bowtie (12). We
29 | P a g e S u p p o r t i n g I n f o r m a t i o n
further reduced the mapped read regions to single 5’-end point, which reflects the cross-
linking point between protein and DNA. The resulting cross-linking point distribution was
used to identify peaks on the forward (Left) and reverse (Right) strand separately using
the peak calling algorithm in GeneTrack (24). For bound-region calculation, we first
identified any pairs of left and right peaks that were located within 20bps to each other.
Then, we defined the window between the middle point of the left peak and that of the
right peak as the bound-region. Peak-pairing and bound-region calculation were
performed with R programming (scripts are available upon request). The resulting 11503
paired-peaks were defined as exo-peaks (11k dataset). Top 10% of exo-peaks (1k
dataset) were used for motif discovery.
Motif Discovery, Localization and EMSA assay
The de novo motif discovery was conducted by Gimmemotifs (25) using 20bp of
sequence flanking the midpoint of exo-peaks from the 1k dataset. 5 motifs were recovered
from the analysis and were matched to known transcription factor binding sequences by
Jaspar (26). The plots for local raw-read enrichment and color charts for motif sequences
were generated by customized R scripts. We further calculated motif preference
localization results by using the motif_localization_plots.py module in Gimmemotifs.
Finally, we took 50bp of sequence flanking the peaks in the 11k dataset for co-localization
analysis by using pwmscan.py module in Gimmemotifs and bedtools (27) (intersectbed).
Likewise, we used the same number of 50bp random genomic regions to calculate
background co-localization events. EMSA assay were performed with standard protocol.

30 | P a g e S u p p o r t i n g I n f o r m a t i o n
Flag-tagged Brachyury protein was first over-expressed in 293T cells and then purified
for EMSA reactions.
31 | P a g e S u p p o r t i n g I n f o r m a t i o n
SUPPLEMENTAL REFERENCES
1. Shin H, Liu T, Manrai AK, & Liu XS (2009) CEAS: cis-regulatory element annotation
system. Bioinformatics 25(19):2605-2606.
2. Casey ES, O'Reilly MA, Conlon FL, & Smith JC (1998) The T-box transcription factor
Brachyury regulates expression of eFGF through binding to a non-palindromic response
element. Development 125(19):3887-3894.
3. Martin BL & Kimelman D (2010) Brachyury establishes the embryonic mesodermal
progenitor niche. Genes & development 24(24):2778-2783.
4. Evans AL, et al. (2012) Genomic targets of Brachyury (T) in differentiating mouse
embryonic stem cells. PloS one 7(3):e33346.
5. Richardson L, et al. (2010) EMAGE mouse embryo spatial gene expression database: 2010
update. Nucleic acids research 38(Database issue):D703-709.
6. Arnold SJ & Robertson EJ (2009) Making a commitment: cell lineage allocation and axis
patterning in the early mouse embryo. Nature reviews. Molecular cell biology 10(2):91-
103.
7. Abu-Issa R & Kirby ML (2007) Heart field: from mesoderm to heart tube. Annual review
of cell and developmental biology 23:45-68.
8. Stott D, Kispert A, & Herrmann BG (1993) Rescue of the tail defect of Brachyury mice.
Genes & development 7(2):197-203.
9. Gadue P, Huber TL, Paddison PJ, & Keller GM (2006) Wnt and TGF-beta signaling are
required for the induction of an in vitro model of primitive streak formation using
embryonic stem cells. Proc Natl Acad Sci U S A 103(45):16806-16811.
10. Moffat J, et al. (2006) A lentiviral RNAi library for human and mouse genes applied to an
arrayed viral high-content screen. Cell 124(6):1283-1298.
11. Schneider CA, Rasband WS, & Eliceiri KW (2012) NIH Image to ImageJ: 25 years of
image analysis. Nature methods 9(7):671-675.
12. Langmead B, Trapnell C, Pop M, & Salzberg SL (2009) Ultrafast and memory-efficient
alignment of short DNA sequences to the human genome. Genome biology 10(3):R25.
13. Trapnell C, Pachter L, & Salzberg SL (2009) TopHat: discovering splice junctions with
RNA-Seq. Bioinformatics 25(9):1105-1111.
14. Trapnell C, et al. (2010) Transcript assembly and quantification by RNA-Seq reveals
unannotated transcripts and isoform switching during cell differentiation. Nat Biotechnol
28(5):511-515.
15. Ashburner M, et al. (2000) Gene ontology: tool for the unification of biology. The Gene
Ontology Consortium. Nat Genet 25(1):25-29.
16. Young MD, Wakefield MJ, Smyth GK, & Oshlack A (2010) Gene ontology analysis for
RNA-seq: accounting for selection bias. Genome Biol 11(2):R14.
17. Boyer LA, et al. (2006) Polycomb complexes repress developmental regulators in murine
embryonic stem cells. Nature 441(7091):349-353.
18. Rhee HS & Pugh BF (2011) Comprehensive genome-wide protein-DNA interactions
detected at single-nucleotide resolution. Cell 147(6):1408-1419.
19. Zhang Y, et al. (2008) Model-based analysis of ChIP-Seq (MACS). Genome Biol
9(9):R137.
32 | P a g e S u p p o r t i n g I n f o r m a t i o n
20. McLean CY, et al. (2010) GREAT improves functional interpretation of cis-regulatory
regions. Nature biotechnology 28(5):495-501.
21. Morley RH, et al. (2009) A gene regulatory network directed by zebrafish No tail accounts
for its roles in mesoderm formation. Proceedings of the National Academy of Sciences of
the United States of America 106(10):3829-3834.
22. Gentsch GE, et al. (2013) In Vivo T-box transcription factor profiling reveals joint
regulation of embryonic neuromesodermal bipotency. Cell reports 4(6):1185-1196.
23. Kinsella RJ, et al. (2011) Ensembl BioMarts: a hub for data retrieval across taxonomic
space. Database : the journal of biological databases and curation 2011:bar030.
24. Albert I, Wachi S, Jiang C, & Pugh BF (2008) GeneTrack--a genomic data processing and
visualization framework. Bioinformatics (Oxford, England) 24(10):1305-1306.
25. van Heeringen SJ & Veenstra GJ (2011) GimmeMotifs: a de novo motif prediction pipeline
for ChIP-sequencing experiments. Bioinformatics (Oxford, England) 27(2):270-271.
26. Portales-Casamar E, et al. (2010) JASPAR 2010: the greatly expanded open-access
database of transcription factor binding profiles. Nucleic acids research 38(Database
issue):D105-110.
27. Quinlan AR & Hall IM (2010) BEDTools: a flexible suite of utilities for comparing
genomic features. Bioinformatics (Oxford, England) 26(6):841-842.