Embed Size (px)
Citation preview
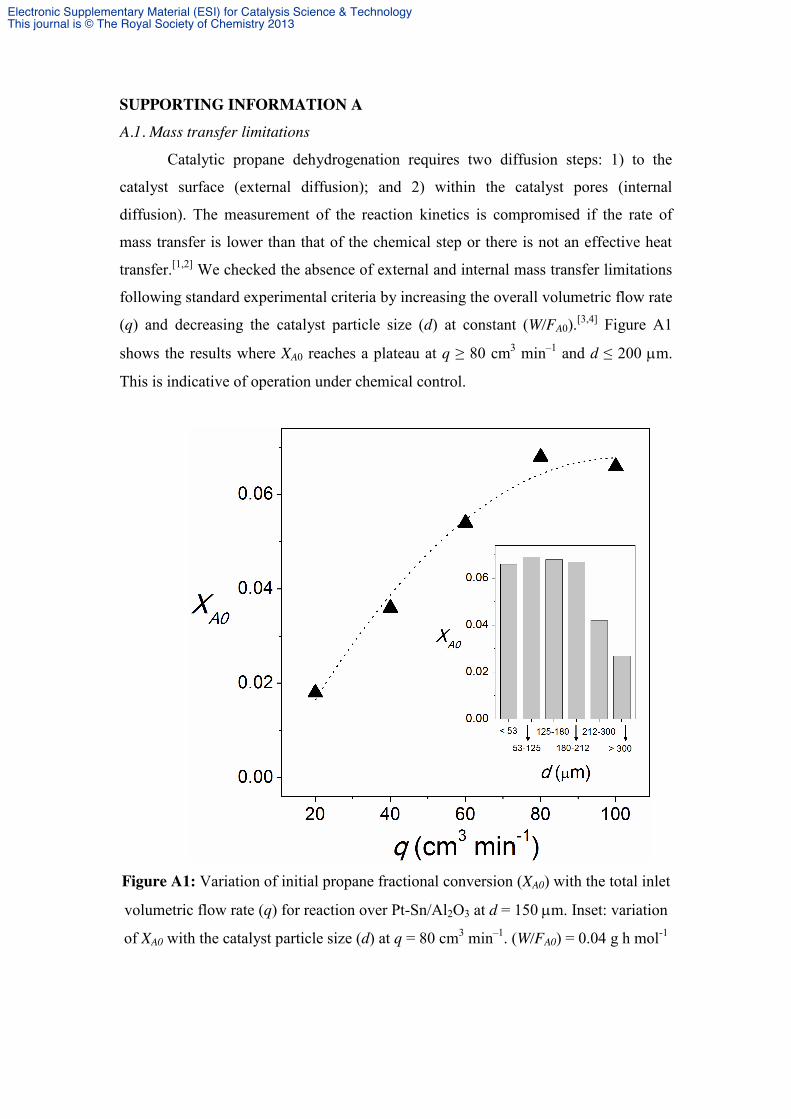
SUPPORTING INFORMATION A A.1. Mass transfer limitations
Catalytic propane dehydrogenation requires two diffusion steps: 1) to the
catalyst surface (external diffusion); and 2) within the catalyst pores (internal
diffusion). The measurement of the reaction kinetics is compromised if the rate of
mass transfer is lower than that of the chemical step or there is not an effective heat
transfer.[1,2] We checked the absence of external and internal mass transfer limitations
following standard experimental criteria by increasing the overall volumetric flow rate
(q) and decreasing the catalyst particle size (d) at constant (W/FA0).[3,4] Figure A1
shows the results where XA0 reaches a plateau at q ≥ 80 cm3 min–1 and d ≤ 200 m.
This is indicative of operation under chemical control.
Figure A1: Variation of initial propane fractional conversion (XA0) with the total inlet
volumetric flow rate (q) for reaction over Pt-Sn/Al2O3 at d = 150 m. Inset: variation
of XA0 with the catalyst particle size (d) at q = 80 cm3 min–1. (W/FA0) = 0.04 g h mol-1
Electronic Supplementary Material (ESI) for Catalysis Science & TechnologyThis journal is © The Royal Society of Chemistry 2013
A.2. Heat transport limitations
This section presents all necessary steps and calculations in order to
demonstrate that the reactions have been conducted in a regime free from heat
transport limitations. Table A1 shows the reaction conditions (in terms of partial
pressures/molar fractions and temperature) and the initial propane consumption rate
for each experiment.
A.2.1. Estimation of the reacting fluid density (mix, kg m–3)
The density of the reacting fluid mixture is
mix mix mixM V (A1)
1
n
mix i ii
M y M
(A2)
where Mmix and Mi are the average molecular weight of the fluid and compound i (g
mol–1) and yi is the molar fraction of compound i. mixV is the molar volume of the fluid:
mix mix gV Z R T P (A3)
where P is the pressure (101330 N m–2), T is the temperature (K) and Rg is the ideal
gas constant (8.314 J mol–1 K–1). Zmix is the compressibility factor of the fluid: 0 1
mix mix mix mixZ Z Z (A4)
where mix is the fluid acentric factor
1
n
mix i ii
y
(A5)
i is the acentric factor of compound i and Zmix(0) and Zmix
(1) are acentric contributions
to Zmix which are found graphically using the fluid reduced temperature (Tr,mix) and
pressure (Pr,mix)
, ,r mix c mixT T T (A6)
, ,r mix c mixP P P (A7)
The values of Tc,mix (the fluid critical temperature, K) and Pc,mix (the fluid critical
pressure, N m–2) are calculated from
, ,1
n
c mix i c ii
T y T
(A8)
Electronic Supplementary Material (ESI) for Catalysis Science & TechnologyThis journal is © The Royal Society of Chemistry 2013
, ,1
,
,1
n
c mix g i c ii
c mix n
i c ii
T R y ZP
y V
(A9)
where Tc,i is the critical temperature of compound i (K), ,c iV is the critical molar
volume of compound i (m3 mol–1). Zc,i is the critical compressibility factor of
compound i,
, ,,
,
c i c ic i
c i g
V PZ
T R
(A10)
where Pc,i is the critical pressure of compound i (N m–2). The critical constants (Tc,i,
Pc,i and ,c iV ) and acentric factors (i) where taken from reference literature[5] or
estimated by group contribution methods, as established elsewhere.[6] The values of
mix at each experimental condition can be found in Table A2.
A.2.2. Estimation of the reacting fluid dynamic viscosity (mix, kg m–1 s–1)
The dynamic viscosity of the reacting fluid mixture is
1
1
ni i
mix ni
j ijj
y
y
(A11)
where ij is an interaction parameter
21/2 1/4
1/2
1
8 1
i j j i
ij
i j
M M
M M
(A12)
ji ij i j j iM M (A13)
and i is the dynamic viscosity of compound i (kg m–1 s–1). The latter was found
graphically[6] (in cP) for each compound at different temperatures (573 K–823 K) and
fitted to
5 32.40 10 1.35 10Propane T (A14)
5 32.82 10 0.48 10Propene T (A15)
2
5 31.34 10 6.20 10H T (A16)
Electronic Supplementary Material (ESI) for Catalysis Science & TechnologyThis journal is © The Royal Society of Chemistry 2013
5 35.23 10 8.23 10Ar T (A17)
The values of mix at each experimental condition can be found in Table A2.
A.2.3. Estimation of the reacting fluid heat capacity (Cp,mix, J K–1 mol–1)
The heat capacity of the reacting fluid mixture is
, ,1
n
p mix i p ii
C y C
(A18)
2 3 4,p iC A B T C T D T E T (A19)
where Cp,i are the heat capacities of compound i (J K–1 mol–1) and the constants (A–E)
were found elsewhere[5] (range of validity: 50 K–1000 K) and are listed in Table A3.
Table A2 presents the values of Cp,mix at each experimental conditions.
A.2.4. Estimation of the reacting fluid thermal conductivity (mix, J K–1 m–1 s–1)
The thermal conductivity of the reacting fluid mixture is
1
1
ni i
mix ni
i ijj
y
y A
(A20)
where i is the thermal conductivity of compound i (J K–1 m–1 s–1) and Aij is an
interaction parameter
21/2 1/4
1/2
1
8 1
i j j i
ij
i j
g g M MA
M M
(A21)
,
,
r i ji
j ir j
f Tgg f T
(A22)
, , ,exp 0.0464 exp 0.2412r i r i r if T T T (A23)
1/6 2/3 1/2, ,i c i c i iT P M
(A24)
The estimation of i is dependent on the nature of the compound,[6] drawing on the
method of Thodos for propane and propene (eqn. (A25)) and the averaged Eucken
correction for H2 and Ar (eqns. (A26–A28)).
Electronic Supplementary Material (ESI) for Catalysis Science & TechnologyThis journal is © The Royal Society of Chemistry 2013
3/2 6, ,14.52 5.14 10r i p i
ii
T C
(A25)
1 2 2i Eucken Eucken (A26)
1 , 4.47Eucken i i p i gM C R (A27)
2 , 1.32 3.52Eucken i i p i gM C R (A28)
The values of mix at each experimental condition can be found in Table A2.
A.2.5. Estimation of propane diffusivity in the reacting fluid (DA,mix, m2 s–1)
The diffusivity of propane in the reacting fluid mixture is
,1 ,
1n
A mixi j A j
Dy D
(A29)
where DA,j is the diffusivity of propane in component j and can be estimated from the
Chapman-Enskog relationship (in cm2 s–1) 3/2
, 1/2 2
0.00266A j
Aj Aj D
TDP M
(A30)
2
1 1AjA j
MM M
(A31)
2Aj A j (A32)
The value of D, the diffusion collision integral, can be calculated from
0.1561 * * **
1.06036 0.193 1.03587 1.76474exp 0.47635 exp 1.52996 exp 3.89411D T T TT
(A33)
*Aj
T T k (A34)
1/2
Aj A jk k k (A35)
Data for i (Å) and (/k)i (K) can be found in the literature[5] and Table A2 presents
the values of DA,mix for each experimental point.
A.2.6. Estimation of the fluid-to-catalyst heat transfer coefficient (h, J K–1 m–2 s–1)
The fluid-to-catalyst heat transfer coefficient is calculated from
Electronic Supplementary Material (ESI) for Catalysis Science & TechnologyThis journal is © The Royal Society of Chemistry 2013
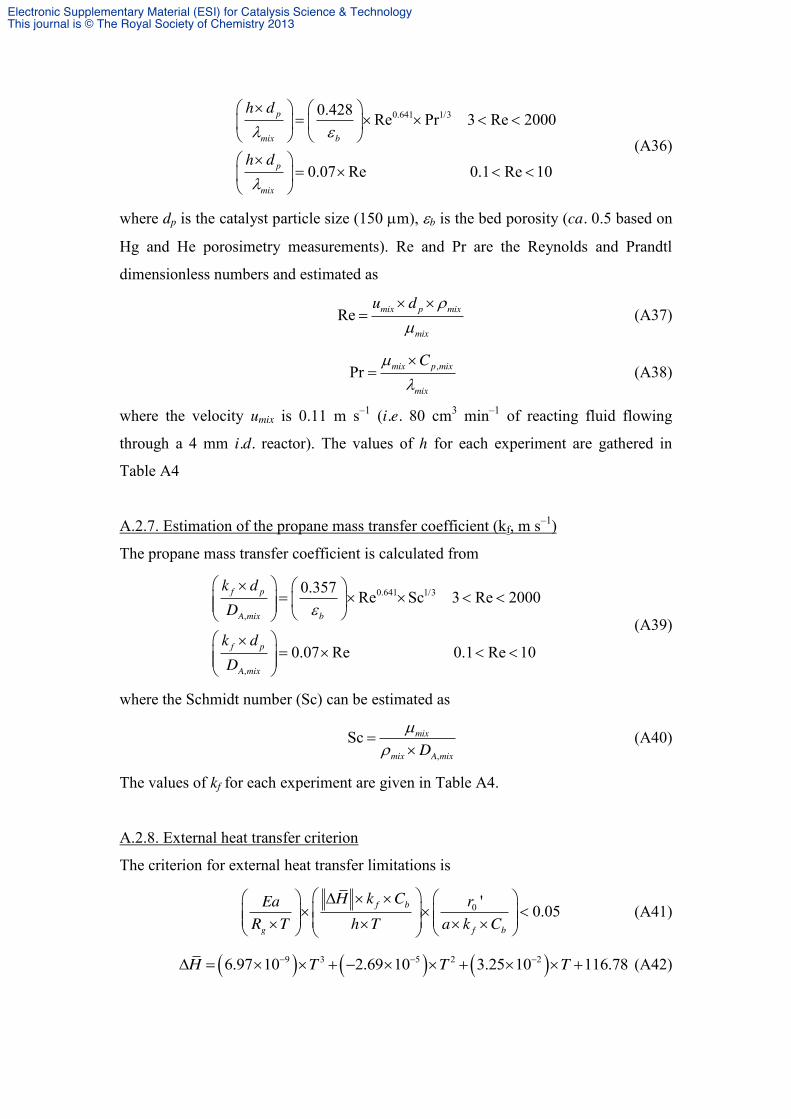
0.641 1/30.428 Re Pr 3 Re 2000
0.07 Re 0.1 Re 10
p
mix b
p
mix
h d
h d
(A36)
where dp is the catalyst particle size (150 m), b is the bed porosity (ca. 0.5 based on
Hg and He porosimetry measurements). Re and Pr are the Reynolds and Prandtl
dimensionless numbers and estimated as
Re mix p mix
mix
u d
(A37)
,Pr mix p mix
mix
C
(A38)
where the velocity umix is 0.11 m s–1 (i.e. 80 cm3 min–1 of reacting fluid flowing
through a 4 mm i.d. reactor). The values of h for each experiment are gathered in
Table A4
A.2.7. Estimation of the propane mass transfer coefficient (kf, m s–1)
The propane mass transfer coefficient is calculated from
0.641 1/3
,
,
0.357 Re Sc 3 Re 2000
0.07 Re 0.1 Re 10
f p
A mix b
f p
A mix
k dD
k dD
(A39)
where the Schmidt number (Sc) can be estimated as
,
Sc mix
mix A mixD
(A40)
The values of kf for each experiment are given in Table A4.
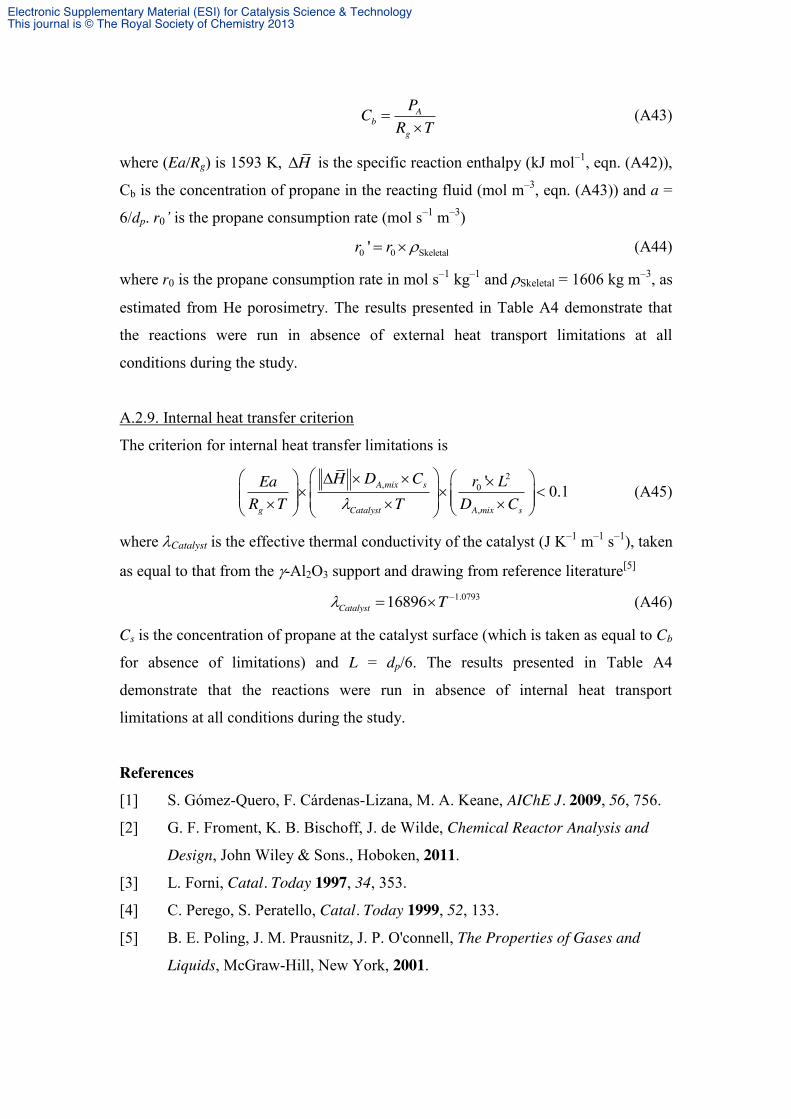
A.2.8. External heat transfer criterion
The criterion for external heat transfer limitations is
0 ' 0.05f b
g f b
H k C rEaR T h T a k C
(A41)
9 3 5 2 26.97 10 2.69 10 3.25 10 116.78H T T T (A42)
Electronic Supplementary Material (ESI) for Catalysis Science & TechnologyThis journal is © The Royal Society of Chemistry 2013
Ab
g
PCR T
(A43)
where (Ea/Rg) is 1593 K, H is the specific reaction enthalpy (kJ mol–1, eqn. (A42)),
Cb is the concentration of propane in the reacting fluid (mol m–3, eqn. (A43)) and a =
6/dp. r0’ is the propane consumption rate (mol s–1 m–3)
0 0 Skeletal'r r (A44)
where r0 is the propane consumption rate in mol s–1 kg–1 and Skeletal = 1606 kg m–3, as
estimated from He porosimetry. The results presented in Table A4 demonstrate that
the reactions were run in absence of external heat transport limitations at all
conditions during the study.
A.2.9. Internal heat transfer criterion
The criterion for internal heat transfer limitations is
2, 0
,
' 0.1A mix s
g Catalyst A mix s
H D C r LEaR T T D C
(A45)
where Catalyst is the effective thermal conductivity of the catalyst (J K–1 m–1 s–1), taken
as equal to that from the -Al2O3 support and drawing from reference literature[5] 1.079316896Catalyst T (A46)
Cs is the concentration of propane at the catalyst surface (which is taken as equal to Cb
for absence of limitations) and L = dp/6. The results presented in Table A4
demonstrate that the reactions were run in absence of internal heat transport
limitations at all conditions during the study.
References [1] S. Gómez-Quero, F. Cárdenas-Lizana, M. A. Keane, AIChE J. 2009, 56, 756.
[2] G. F. Froment, K. B. Bischoff, J. de Wilde, Chemical Reactor Analysis and
Design, John Wiley & Sons., Hoboken, 2011.
[3] L. Forni, Catal. Today 1997, 34, 353.
[4] C. Perego, S. Peratello, Catal. Today 1999, 52, 133.
[5] B. E. Poling, J. M. Prausnitz, J. P. O'connell, The Properties of Gases and
Liquids, McGraw-Hill, New York, 2001.
Electronic Supplementary Material (ESI) for Catalysis Science & TechnologyThis journal is © The Royal Society of Chemistry 2013

[6] R. H. Perry, D. W. Green, Perry's Chemical Engineering' Handbook,
McGraw-Hill, New York, 1973.
Electronic Supplementary Material (ESI) for Catalysis Science & TechnologyThis journal is © The Royal Society of Chemistry 2013
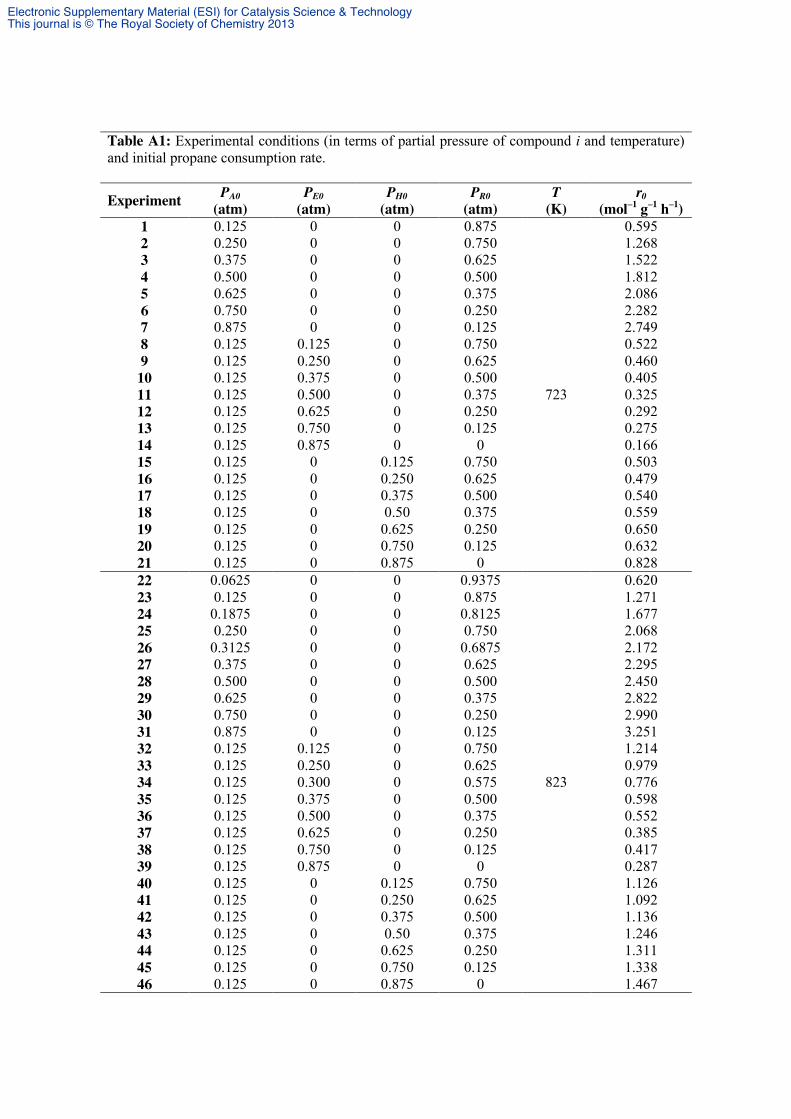
Table A1: Experimental conditions (in terms of partial pressure of compound i and temperature) and initial propane consumption rate.
Experiment PA0 (atm)
PE0 (atm)
PH0 (atm)
PR0 (atm)
T (K)
r0 (mol–1 g–1 h–1)
1 0.125 0 0 0.875
723
0.595 2 0.250 0 0 0.750 1.268 3 0.375 0 0 0.625 1.522 4 0.500 0 0 0.500 1.812 5 0.625 0 0 0.375 2.086 6 0.750 0 0 0.250 2.282 7 0.875 0 0 0.125 2.749 8 0.125 0.125 0 0.750 0.522 9 0.125 0.250 0 0.625 0.460
10 0.125 0.375 0 0.500 0.405 11 0.125 0.500 0 0.375 0.325 12 0.125 0.625 0 0.250 0.292 13 0.125 0.750 0 0.125 0.275 14 0.125 0.875 0 0 0.166 15 0.125 0 0.125 0.750 0.503 16 0.125 0 0.250 0.625 0.479 17 0.125 0 0.375 0.500 0.540 18 0.125 0 0.50 0.375 0.559 19 0.125 0 0.625 0.250 0.650 20 0.125 0 0.750 0.125 0.632 21 0.125 0 0.875 0 0.828 22 0.0625 0 0 0.9375
823
0.620 23 0.125 0 0 0.875 1.271 24 0.1875 0 0 0.8125 1.677 25 0.250 0 0 0.750 2.068 26 0.3125 0 0 0.6875 2.172 27 0.375 0 0 0.625 2.295 28 0.500 0 0 0.500 2.450 29 0.625 0 0 0.375 2.822 30 0.750 0 0 0.250 2.990 31 0.875 0 0 0.125 3.251 32 0.125 0.125 0 0.750 1.214 33 0.125 0.250 0 0.625 0.979 34 0.125 0.300 0 0.575 0.776 35 0.125 0.375 0 0.500 0.598 36 0.125 0.500 0 0.375 0.552 37 0.125 0.625 0 0.250 0.385 38 0.125 0.750 0 0.125 0.417 39 0.125 0.875 0 0 0.287 40 0.125 0 0.125 0.750 1.126 41 0.125 0 0.250 0.625 1.092 42 0.125 0 0.375 0.500 1.136 43 0.125 0 0.50 0.375 1.246 44 0.125 0 0.625 0.250 1.311 45 0.125 0 0.750 0.125 1.338 46 0.125 0 0.875 0 1.467
Electronic Supplementary Material (ESI) for Catalysis Science & TechnologyThis journal is © The Royal Society of Chemistry 2013
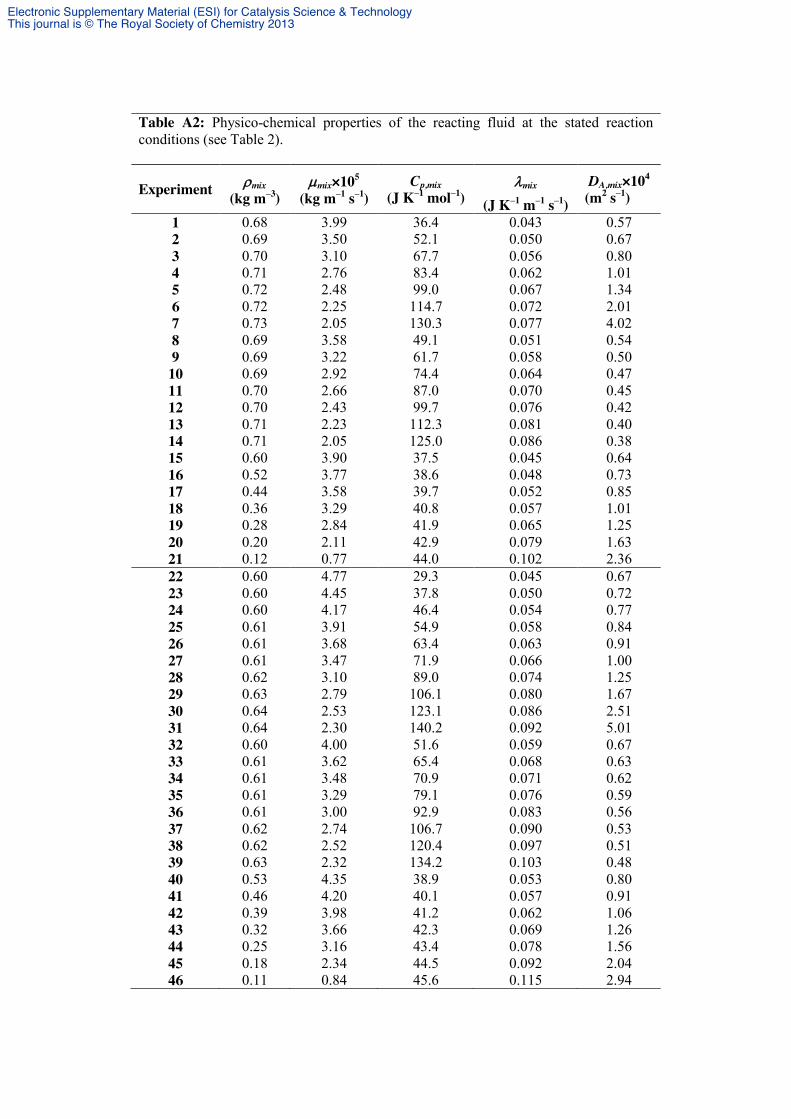
Table A2: Physico-chemical properties of the reacting fluid at the stated reaction conditions (see Table 2).
Experiment mix (kg m–3)
mix×105 (kg m–1 s–1)
Cp,mix (J K–1 mol–1)
mix (J K–1 m–1 s–1)
DA,mix×104 (m2 s–1)
1 0.68 3.99 36.4 0.043 0.57 2 0.69 3.50 52.1 0.050 0.67 3 0.70 3.10 67.7 0.056 0.80 4 0.71 2.76 83.4 0.062 1.01 5 0.72 2.48 99.0 0.067 1.34 6 0.72 2.25 114.7 0.072 2.01 7 0.73 2.05 130.3 0.077 4.02 8 0.69 3.58 49.1 0.051 0.54 9 0.69 3.22 61.7 0.058 0.50 10 0.69 2.92 74.4 0.064 0.47 11 0.70 2.66 87.0 0.070 0.45 12 0.70 2.43 99.7 0.076 0.42 13 0.71 2.23 112.3 0.081 0.40 14 0.71 2.05 125.0 0.086 0.38 15 0.60 3.90 37.5 0.045 0.64 16 0.52 3.77 38.6 0.048 0.73 17 0.44 3.58 39.7 0.052 0.85 18 0.36 3.29 40.8 0.057 1.01 19 0.28 2.84 41.9 0.065 1.25 20 0.20 2.11 42.9 0.079 1.63 21 0.12 0.77 44.0 0.102 2.36 22 0.60 4.77 29.3 0.045 0.67 23 0.60 4.45 37.8 0.050 0.72 24 0.60 4.17 46.4 0.054 0.77 25 0.61 3.91 54.9 0.058 0.84 26 0.61 3.68 63.4 0.063 0.91 27 0.61 3.47 71.9 0.066 1.00 28 0.62 3.10 89.0 0.074 1.25 29 0.63 2.79 106.1 0.080 1.67 30 0.64 2.53 123.1 0.086 2.51 31 0.64 2.30 140.2 0.092 5.01 32 0.60 4.00 51.6 0.059 0.67 33 0.61 3.62 65.4 0.068 0.63 34 0.61 3.48 70.9 0.071 0.62 35 0.61 3.29 79.1 0.076 0.59 36 0.61 3.00 92.9 0.083 0.56 37 0.62 2.74 106.7 0.090 0.53 38 0.62 2.52 120.4 0.097 0.51 39 0.63 2.32 134.2 0.103 0.48 40 0.53 4.35 38.9 0.053 0.80 41 0.46 4.20 40.1 0.057 0.91 42 0.39 3.98 41.2 0.062 1.06 43 0.32 3.66 42.3 0.069 1.26 44 0.25 3.16 43.4 0.078 1.56 45 0.18 2.34 44.5 0.092 2.04 46 0.11 0.84 45.6 0.115 2.94
Electronic Supplementary Material (ESI) for Catalysis Science & TechnologyThis journal is © The Royal Society of Chemistry 2013
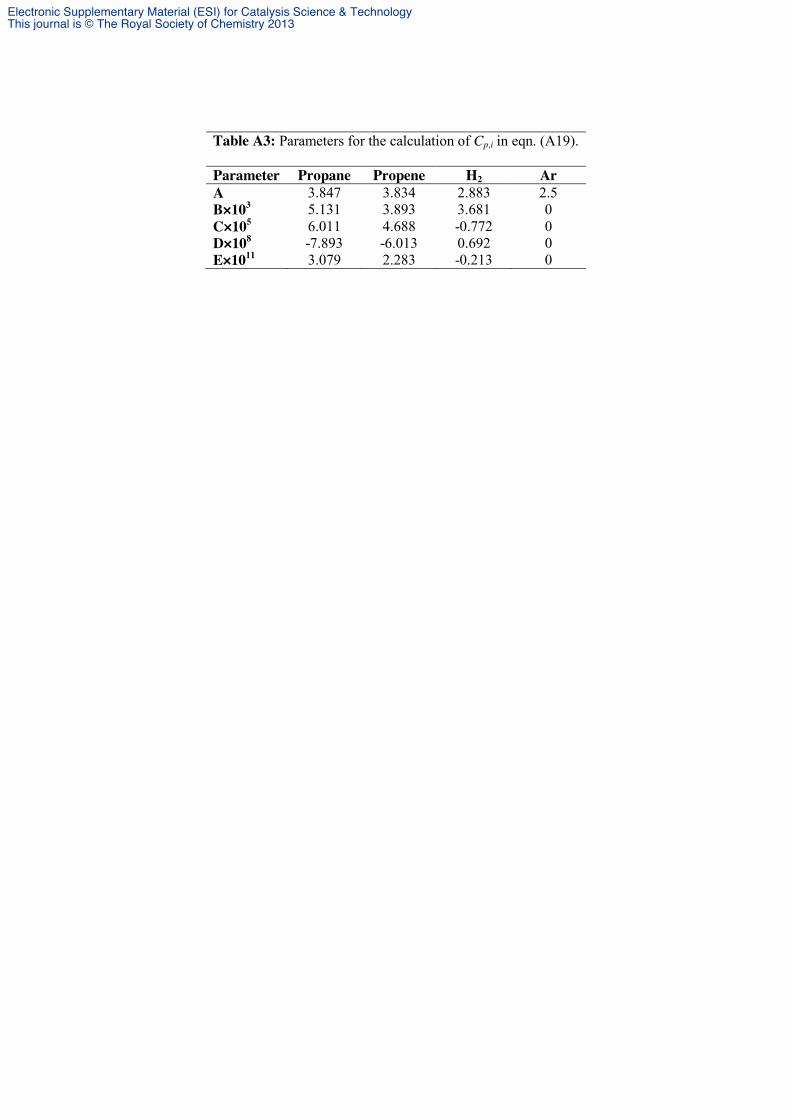
Table A3: Parameters for the calculation of Cp,i in eqn. (A19). Parameter Propane Propene H2 Ar A 3.847 3.834 2.883 2.5 B×103 5.131 3.893 3.681 0 C×105 6.011 4.688 -0.772 0 D×108 -7.893 -6.013 0.692 0 E×1011 3.079 2.283 -0.213 0
Electronic Supplementary Material (ESI) for Catalysis Science & TechnologyThis journal is © The Royal Society of Chemistry 2013
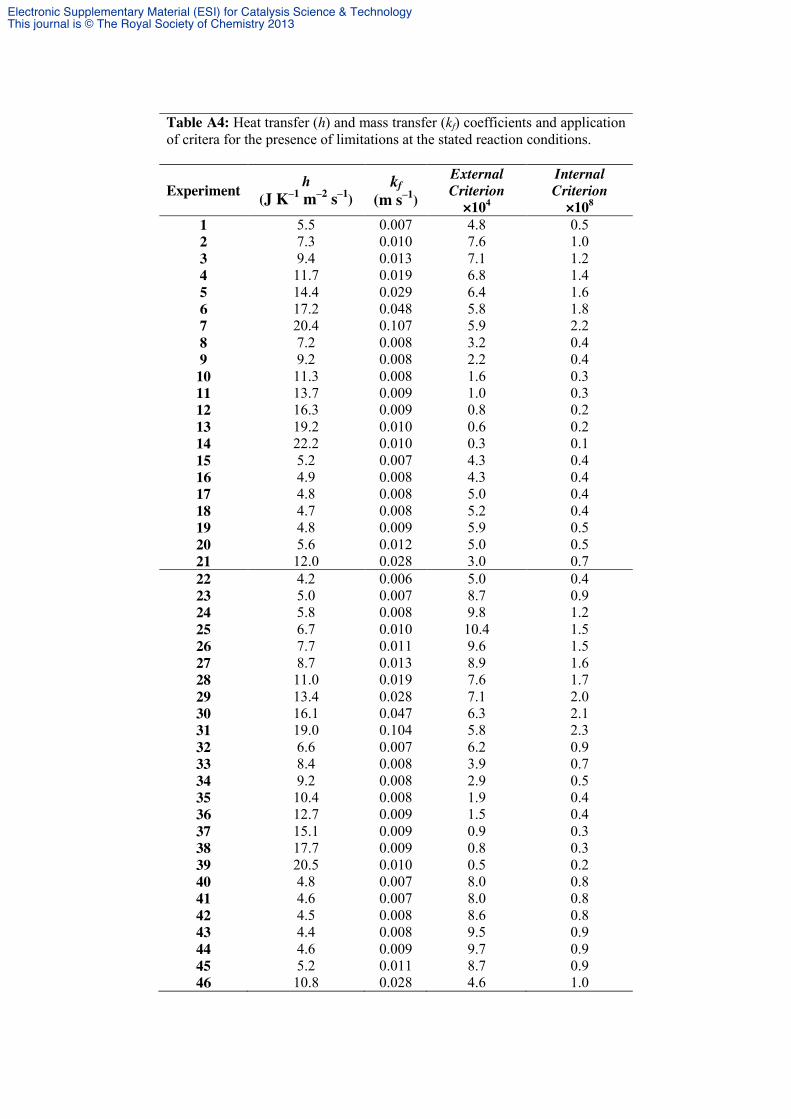
Table A4: Heat transfer (h) and mass transfer (kf) coefficients and application of critera for the presence of limitations at the stated reaction conditions.
Experiment h (J K–1 m–2 s–1)
kf (m s–1)
External Criterion ×104
Internal Criterion ×108
1 5.5 0.007 4.8 0.5 2 7.3 0.010 7.6 1.0 3 9.4 0.013 7.1 1.2 4 11.7 0.019 6.8 1.4 5 14.4 0.029 6.4 1.6 6 17.2 0.048 5.8 1.8 7 20.4 0.107 5.9 2.2 8 7.2 0.008 3.2 0.4 9 9.2 0.008 2.2 0.4 10 11.3 0.008 1.6 0.3 11 13.7 0.009 1.0 0.3 12 16.3 0.009 0.8 0.2 13 19.2 0.010 0.6 0.2 14 22.2 0.010 0.3 0.1 15 5.2 0.007 4.3 0.4 16 4.9 0.008 4.3 0.4 17 4.8 0.008 5.0 0.4 18 4.7 0.008 5.2 0.4 19 4.8 0.009 5.9 0.5 20 5.6 0.012 5.0 0.5 21 12.0 0.028 3.0 0.7 22 4.2 0.006 5.0 0.4 23 5.0 0.007 8.7 0.9 24 5.8 0.008 9.8 1.2 25 6.7 0.010 10.4 1.5 26 7.7 0.011 9.6 1.5 27 8.7 0.013 8.9 1.6 28 11.0 0.019 7.6 1.7 29 13.4 0.028 7.1 2.0 30 16.1 0.047 6.3 2.1 31 19.0 0.104 5.8 2.3 32 6.6 0.007 6.2 0.9 33 8.4 0.008 3.9 0.7 34 9.2 0.008 2.9 0.5 35 10.4 0.008 1.9 0.4 36 12.7 0.009 1.5 0.4 37 15.1 0.009 0.9 0.3 38 17.7 0.009 0.8 0.3 39 20.5 0.010 0.5 0.2 40 4.8 0.007 8.0 0.8 41 4.6 0.007 8.0 0.8 42 4.5 0.008 8.6 0.8 43 4.4 0.008 9.5 0.9 44 4.6 0.009 9.7 0.9 45 5.2 0.011 8.7 0.9 46 10.8 0.028 4.6 1.0
Electronic Supplementary Material (ESI) for Catalysis Science & TechnologyThis journal is © The Royal Society of Chemistry 2013
APPENDIX B
Perego and Peratello described the importance of thermodynamics in that the heat of
reaction and maximum conversion determine the limits of the system.[1]
We have accordingly
analysed the thermodynamics of our case drawing on reference data for propane, propylene
and hydrogen as a function of temperature.[2]
The specific enthalpy ( H ) as is given in eqn.
(B1). The dehydrogenation of propane is strongly endothermic (≈129 kJ mol–1
) within 723
and 823 K.
9 3 5 2 26.97 10 2.69 10 3.25 10 116.78H T T T (B1)
Similarly, the specific Gibbs free energy ( G , kJ mol–1
) and equilibrium constant
(Kp, atm) are given in eqns. (B2) and (B3),
0.137 128.102G T (B2)
71.48 10 exp 15403pK T (B3)
The equilibrium conversion was finally calculated using eqn. (B4)
Equilibrium Conversion 1 1 pP K (B4)
Figure B1 presents the results. The maximum achievable fractional conversion in the
temperature range studied (723 K ≤ T ≤ 823 K) lies between 0.09 and 0.32. These results are
consistent with the works of Michorczyk et al.[3,4]
and Assabumrungrat and co-workers.[5]
Moreover, Weckhuysen and Schoonheydt reported that temperatures as high as 870 K are
needed to achieve a 50% conversion.[6]
Additionally, we studied the effect of the presence of
propene and hydrogen (i.e. the reaction products, eqn. (B5)) in the composition of the inlet by
using
3 8 3 6 2C H C H Ha b c (B5)
where a, b and c are the stoichiometric coefficients and the equilibrium fractional conversion
is now calculated from eqns. (B6) and (B7).
21 0p p pP K s P K b c a d s P K b c a d
(B6)
EquilibriumConversiona s
a
(B7)
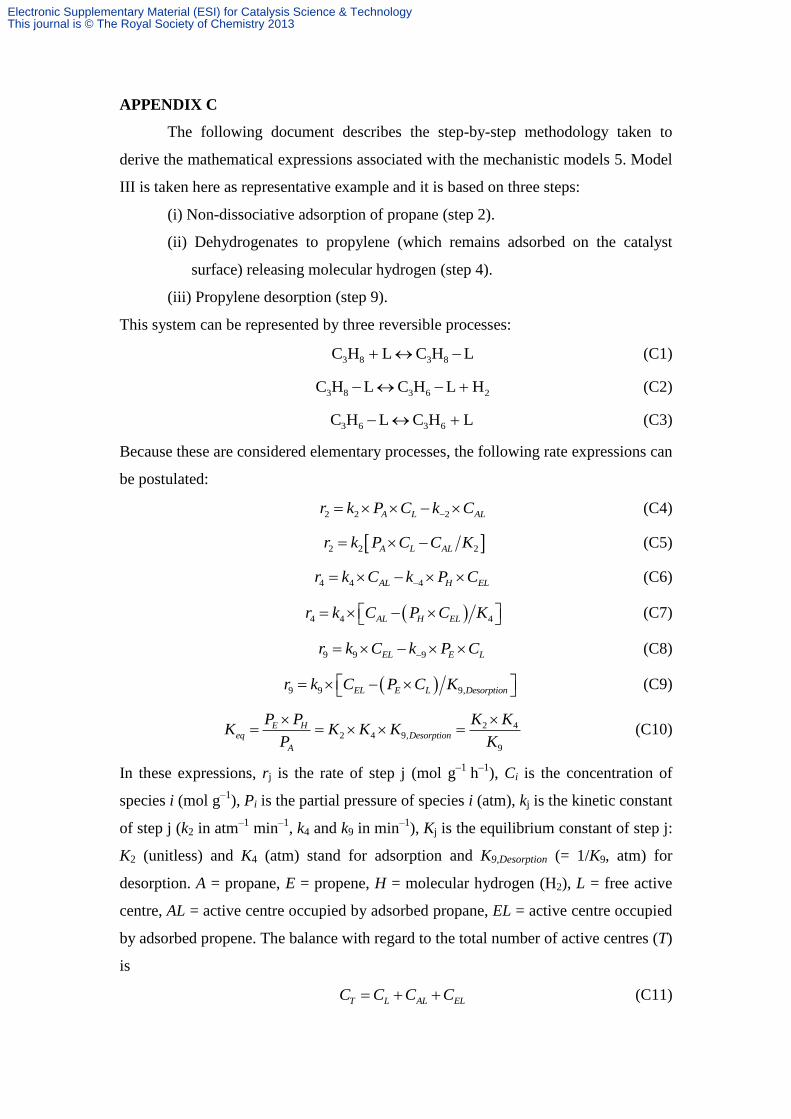
Figure B2 shows the change in propane conversion with the propylene-to-propane
(b/a) and hydrogen-to-propane (c/a) molar ratios. A unique surface is determined for each
reaction temperature. At 700 K, the presence of propylene or hydrogen with propane
decreases conversion, which falls to zero whenever b/a and c/a > 1. An increase in
Electronic Supplementary Material (ESI) for Catalysis Science & TechnologyThis journal is © The Royal Society of Chemistry 2013
temperature (to 900 K) favours dehydrogenation where ratios b/a or c/a > 10 are needed to
significantly decrease conversion at 900 K. This is an important outcome since in a typical
industrial dehydrogenation operational mode, hydrogen is normally co-fed with propane as a
means to supress coke formation.[7]
The simultaneous presence of propylene and hydrogen
have dramatic consequences where no conversion is observed whenever b/a and c/a > 5. Our
results demonstrate the great impact of the presence of reaction products in the inlet stream,
and the importance of this analysis for this reaction.
References:
[1] C. Perego, S. Peratello, Catal. Today 1999, 52, 133.
[2] D. R. Stull, E. F. Westburn., G. C. Sinke, The Chemical Thermodynamics of Organic
Compounds, John Wiley & Sons, Inc., New York, 1969.
[3] P. Michorczyk, J. Ogonowski, React. Kinet. Catal. Lett. 2003, 78, 41.
[4] P. Michorczyk, J. Ogonowski, Appl. Catal. A: General 2003, 251, 425.
[5] S. Assabumrungrat, W. Jhoraleecharnchai., P. Praserthdam, S. Goto, J. Chem. Eng.
Jpn. 2000, 33, 529.
[6] B. M. Weckhuysen, R. A. Schoonheydt, Catal. Today 1999, 51, 223.
[7] M. S. Voronetskii, L. P. Didenko, V. I. Savchenko, Russ. J. Phys. Chem. B 2009, 3,
216.
Electronic Supplementary Material (ESI) for Catalysis Science & TechnologyThis journal is © The Royal Society of Chemistry 2013
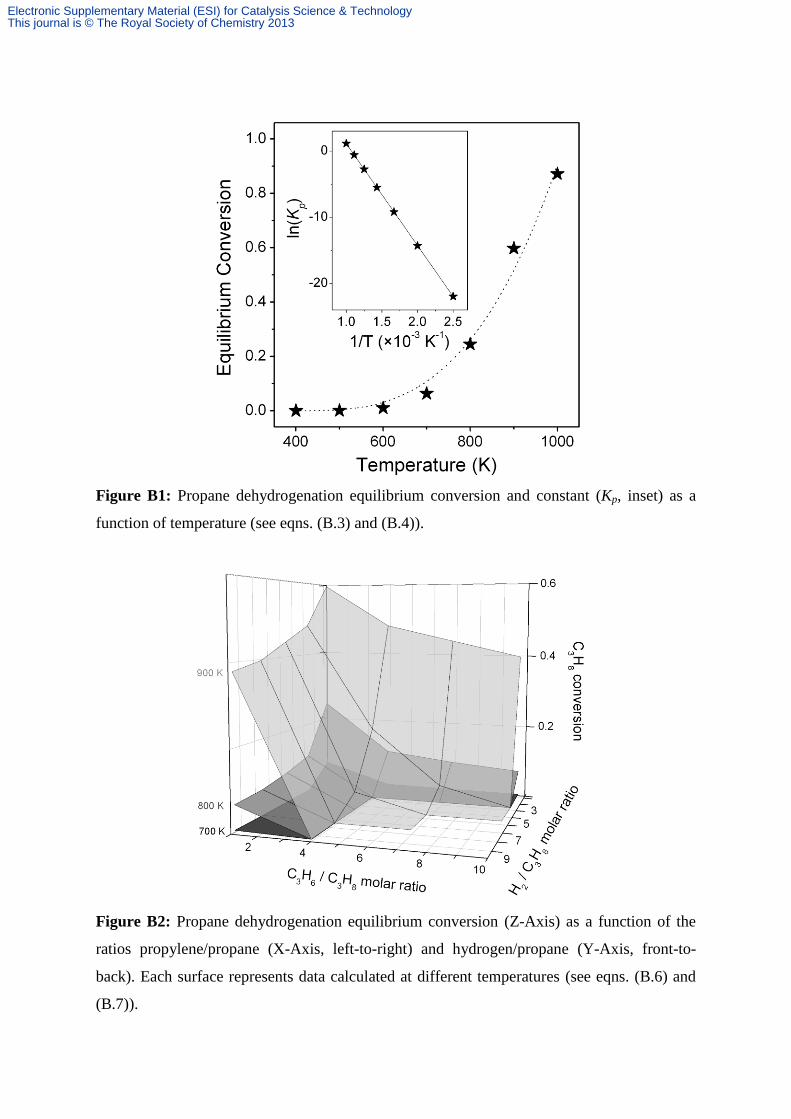
Figure B1: Propane dehydrogenation equilibrium conversion and constant (Kp, inset) as a
function of temperature (see eqns. (B.3) and (B.4)).
Figure B2: Propane dehydrogenation equilibrium conversion (Z-Axis) as a function of the
ratios propylene/propane (X-Axis, left-to-right) and hydrogen/propane (Y-Axis, front-to-
back). Each surface represents data calculated at different temperatures (see eqns. (B.6) and
(B.7)).
Electronic Supplementary Material (ESI) for Catalysis Science & TechnologyThis journal is © The Royal Society of Chemistry 2013
APPENDIX C
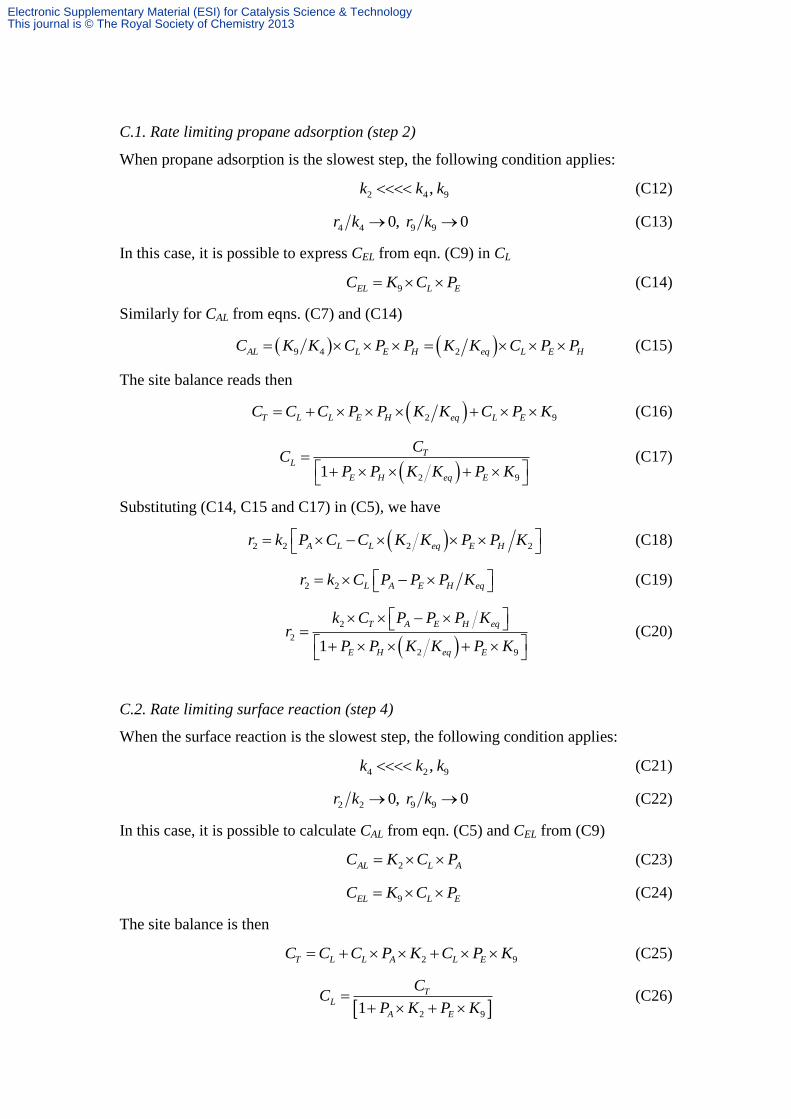
The following document describes the step-by-step methodology taken to
derive the mathematical expressions associated with the mechanistic models 5. Model
III is taken here as representative example and it is based on three steps:
(i) Non-dissociative adsorption of propane (step 2).
(ii) Dehydrogenates to propylene (which remains adsorbed on the catalyst
surface) releasing molecular hydrogen (step 4).
(iii) Propylene desorption (step 9).
This system can be represented by three reversible processes:
3 8 3 8C H L C H L (C1)
3 8 3 6 2C H L C H L H (C2)
3 6 3 6C H L C H L (C3)
Because these are considered elementary processes, the following rate expressions can
be postulated:
2 2 2 A L ALr k P C k C (C4)
2 2 2 A L ALr k P C C K (C5)
4 4 4AL H ELr k C k P C (C6)
4 4 4 AL H ELr k C P C K (C7)
9 9 9EL E Lr k C k P C (C8)
9 9 9, EL E L Desorptionr k C P C K (C9)
2 42 4 9,
9
E Heq Desorption
A
P P K KK K K K
P K
(C10)
In these expressions, rj is the rate of step j (mol g–1
h–1
), Ci is the concentration of
species i (mol g–1
), Pi is the partial pressure of species i (atm), kj is the kinetic constant
of step j (k2 in atm–1
min–1
, k4 and k9 in min–1
), Kj is the equilibrium constant of step j:
K2 (unitless) and K4 (atm) stand for adsorption and K9,Desorption (= 1/K9, atm) for
desorption. A = propane, E = propene, H = molecular hydrogen (H2), L = free active
centre, AL = active centre occupied by adsorbed propane, EL = active centre occupied
by adsorbed propene. The balance with regard to the total number of active centres (T)
is
T L AL ELC C C C (C11)
Electronic Supplementary Material (ESI) for Catalysis Science & TechnologyThis journal is © The Royal Society of Chemistry 2013
C.1. Rate limiting propane adsorption (step 2)
When propane adsorption is the slowest step, the following condition applies:
2 4 9,k k k (C12)
4 4 9 90, 0r k r k (C13)
In this case, it is possible to express CEL from eqn. (C9) in CL
9EL L EC K C P (C14)
Similarly for CAL from eqns. (C7) and (C14)
9 4 2AL L E H eq L E HC K K C P P K K C P P (C15)
The site balance reads then
2 9T L L E H eq L EC C C P P K K C P K (C16)
2 91
TL
E H eq E
CC
P P K K P K
(C17)
Substituting (C14, C15 and C17) in (C5), we have
2 2 2 2A L L eq E Hr k P C C K K P P K
(C18)
2 2 L A E H eqr k C P P P K (C19)
2
2
2 91
T A E H eq
E H eq E
k C P P P Kr
P P K K P K
(C20)
C.2. Rate limiting surface reaction (step 4)
When the surface reaction is the slowest step, the following condition applies:
4 2 9,k k k (C21)
2 2 9 90, 0r k r k (C22)
In this case, it is possible to calculate CAL from eqn. (C5) and CEL from (C9)
2AL L AC K C P (C23)
9EL L EC K C P (C24)
The site balance is then
2 9T L L A L EC C C P K C P K (C25)
2 91
TL
A E
CC
P K P K
(C26)
Electronic Supplementary Material (ESI) for Catalysis Science & TechnologyThis journal is © The Royal Society of Chemistry 2013
Substituting (C23, C24 and C26) in (C7), we have
4 4 2 9 4L A H L Er k K C P P K C P K (C27)
4 4 4 2 9,L A H E Desorptionr k C P P P K K K
(C28)
4 2
4
2 91
T A E H eq
A E
k K C P P P Kr
P K P K
(C29)
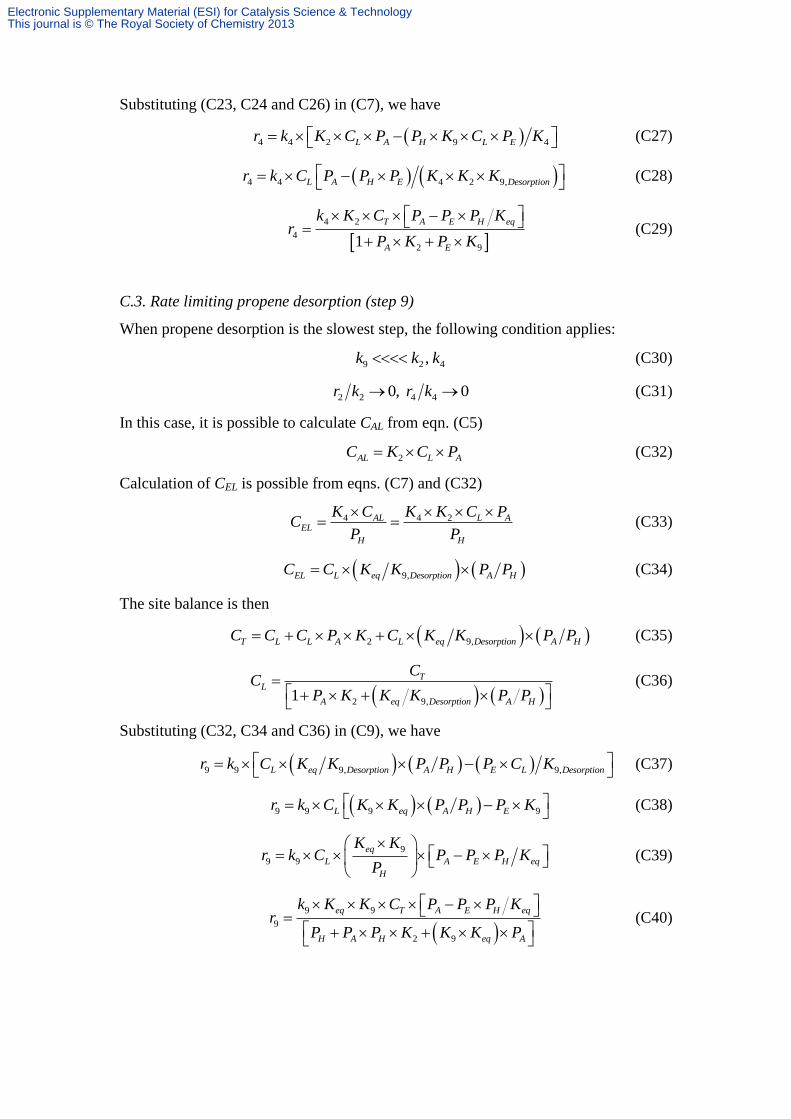
C.3. Rate limiting propene desorption (step 9)
When propene desorption is the slowest step, the following condition applies:
9 2 4,k k k (C30)
2 2 4 40, 0r k r k (C31)
In this case, it is possible to calculate CAL from eqn. (C5)
2AL L AC K C P (C32)
Calculation of CEL is possible from eqns. (C7) and (C32)
4 4 2AL L AEL
H H
K C K K C PC
P P
(C33)
9,EL L eq Desorption A HC C K K P P (C34)
The site balance is then
2 9,T L L A L eq Desorption A HC C C P K C K K P P (C35)
2 9,1
TL
A eq Desorption A H
CC
P K K K P P
(C36)
Substituting (C32, C34 and C36) in (C9), we have
9 9 9, 9,L eq Desorption A H E L Desorptionr k C K K P P P C K
(C37)
9 9 9 9L eq A H Er k C K K P P P K
(C38)
9
9 9
eq
L A E H eq
H
K Kr k C P P P K
P
(C39)
9 9
9
2 9
eq T A E H eq
H A H eq A
k K K C P P P Kr
P P P K K K P
(C40)
Electronic Supplementary Material (ESI) for Catalysis Science & TechnologyThis journal is © The Royal Society of Chemistry 2013