Embed Size (px)
Citation preview
Available online at www.sciencedirect.com
1071-5819/$ - se
http://dx.doi.or
nCorrespond
E-mail addr
Int. J. Human-Computer Studies 71 (2013) 4–23
www.elsevier.com/locate/ijhcs
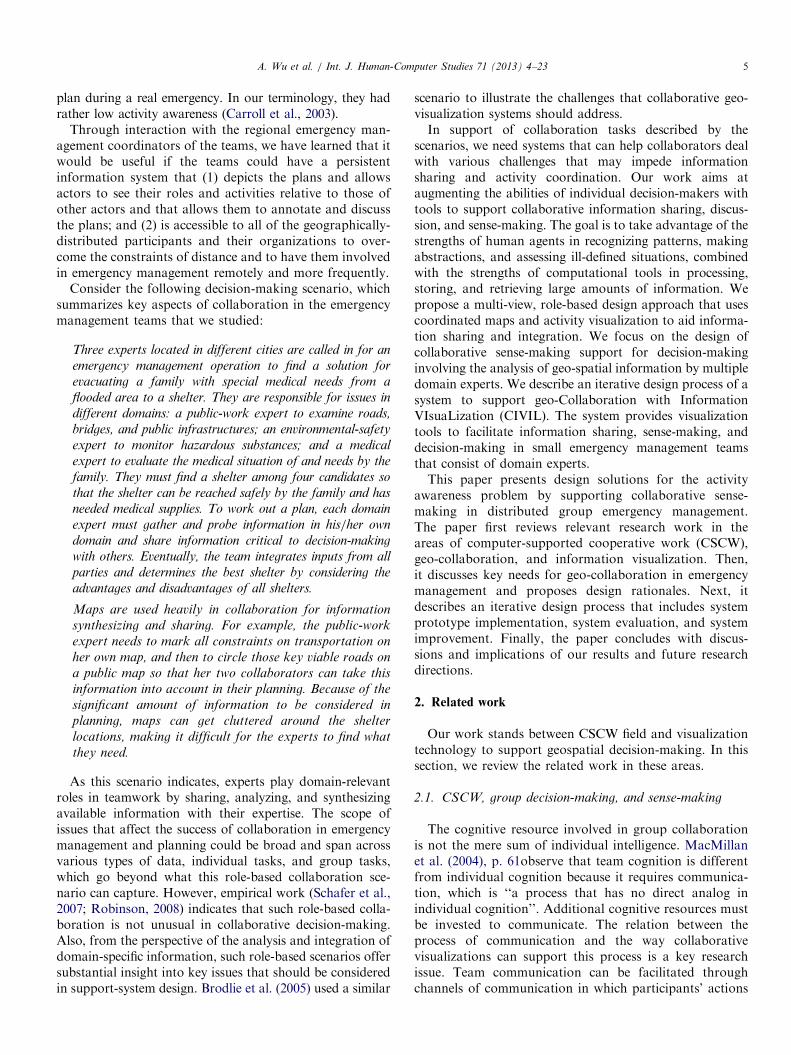
Supporting collaborative sense-making in emergency managementthrough geo-visualization
Anna Wu, Gregorio Convertino, Craig Ganoe, John M. Carroll, Xiaolong (Luke) Zhangn
Penn State University, State College, PA 16802, United States
Received 21 January 2011; received in revised form 26 April 2012; accepted 16 July 2012
Available online 16 August 2012
Abstract
In emergency management, collaborative decision-making usually involves collaborative sense-making of diverse information by a
group of experts from different knowledge domains, and needs better tools to analyze role-specific information, share and synthesize
relevant information, and remain aware of the activities of others. This paper presents our research on the design of a collaborative
sense-making system to support team work. We propose a multi-view, role-based design to help team members analyze geo-spatial
information, share and integrate critical information, and monitor individual activities. Our design uses coordinated maps and activity
visualization to aid decision-making as well as group activity awareness. The paper discusses design rationale, iterative design of
visualization tools, prototype implementation, and system evaluation. Our work can potentially improve and extend collaborative tasks
in emergency management.
& 2012 Elsevier Ltd. All rights reserved.
Keywords: Computer-supported cooperative work; Geo-collaboration; Visualization; Collaborative sense-making; Web-based application
1. Introduction
Decision-making in complex task situations such asemergency management often requires the collection andanalysis of various kinds of information. Such decision-making processes usually involve multiple domain experts,who can interpret and synthesize domain-specific informa-tion for the team. Our previous research on the process ofknowledge sharing in emergency management teams incentral Pennsylvania found that the teams engaged in heavysense-making activities require collaborative work on geo-spatial information (Schafer et al., 2007, 2008). With aseries of laboratory studies, we investigated how emergencymanagement teams shared knowledge, and explored thedesign requirements and measurement of the effects ofcollaborative software tools to support knowledge sharingand decision-making (Convertino et al., 2008, 2009, 2011).
In many American communities emergency managementis carried out by a loosely coordinated group of community
e front matter & 2012 Elsevier Ltd. All rights reserved.
g/10.1016/j.ijhcs.2012.07.007
ing author. Tel.: þ1 814 8639462; fax: þ1 814 865 6426.
ess: [email protected] (X. (Luke) Zhang).
organizations—volunteer fire companies, municipal police,partly-volunteer emergency medical technicians, and soforth. In our field work (Schafer et al., 2008) ‘‘shadowed’’the emergency management coordinator for Central Penn-sylvania for a year and found that coordination acrossthese many groups is difficult—even in better-integratedlocal government and community groups. For example,the various groups usually meet face-to-face only 1–2 timesper year, due to the constraints of their availability, tocarry out table-top simulation exercises or full scaleemergency walk-through. The purpose of these exercisesis to develop, debug, refine, and practice regional emer-gency plans, so that various contributing organizations willbe able to effectively coordinate in a real emergency andhave a shared understanding upon which to base necessaryimprovisations that may be required in a real emergency.In studying this activity, we found that there was sig-
nificant plan recall failure. People just do not remember theplans very well through the many months during which theyare not practicing or reviewing the plans. They do not have agood understanding of what others are doing within the plan,which could be an obstacle to effectively improvising on the
A. Wu et al. / Int. J. Human-Computer Studies 71 (2013) 4–23 5
plan during a real emergency. In our terminology, they hadrather low activity awareness (Carroll et al., 2003).
Through interaction with the regional emergency man-agement coordinators of the teams, we have learned that itwould be useful if the teams could have a persistentinformation system that (1) depicts the plans and allowsactors to see their roles and activities relative to those ofother actors and that allows them to annotate and discussthe plans; and (2) is accessible to all of the geographically-distributed participants and their organizations to over-come the constraints of distance and to have them involvedin emergency management remotely and more frequently.
Consider the following decision-making scenario, whichsummarizes key aspects of collaboration in the emergencymanagement teams that we studied:
Three experts located in different cities are called in for an
emergency management operation to find a solution for
evacuating a family with special medical needs from a
flooded area to a shelter. They are responsible for issues in
different domains: a public-work expert to examine roads,
bridges, and public infrastructures; an environmental-safety
expert to monitor hazardous substances; and a medical
expert to evaluate the medical situation of and needs by the
family. They must find a shelter among four candidates so
that the shelter can be reached safely by the family and has
needed medical supplies. To work out a plan, each domain
expert must gather and probe information in his/her own
domain and share information critical to decision-making
with others. Eventually, the team integrates inputs from all
parties and determines the best shelter by considering the
advantages and disadvantages of all shelters.
Maps are used heavily in collaboration for information
synthesizing and sharing. For example, the public-work
expert needs to mark all constraints on transportation on
her own map, and then to circle those key viable roads on
a public map so that her two collaborators can take this
information into account in their planning. Because of the
significant amount of information to be considered in
planning, maps can get cluttered around the shelter
locations, making it difficult for the experts to find what
they need.
As this scenario indicates, experts play domain-relevantroles in teamwork by sharing, analyzing, and synthesizingavailable information with their expertise. The scope ofissues that affect the success of collaboration in emergencymanagement and planning could be broad and span acrossvarious types of data, individual tasks, and group tasks,which go beyond what this role-based collaboration sce-nario can capture. However, empirical work (Schafer et al.,2007; Robinson, 2008) indicates that such role-based colla-boration is not unusual in collaborative decision-making.Also, from the perspective of the analysis and integration ofdomain-specific information, such role-based scenarios offersubstantial insight into key issues that should be consideredin support-system design. Brodlie et al. (2005) used a similar
scenario to illustrate the challenges that collaborative geo-visualization systems should address.In support of collaboration tasks described by the
scenarios, we need systems that can help collaborators dealwith various challenges that may impede informationsharing and activity coordination. Our work aims ataugmenting the abilities of individual decision-makers withtools to support collaborative information sharing, discus-sion, and sense-making. The goal is to take advantage of thestrengths of human agents in recognizing patterns, makingabstractions, and assessing ill-defined situations, combinedwith the strengths of computational tools in processing,storing, and retrieving large amounts of information. Wepropose a multi-view, role-based design approach that usescoordinated maps and activity visualization to aid informa-tion sharing and integration. We focus on the design ofcollaborative sense-making support for decision-makinginvolving the analysis of geo-spatial information by multipledomain experts. We describe an iterative design process of asystem to support geo-Collaboration with InformationVIsuaLization (CIVIL). The system provides visualizationtools to facilitate information sharing, sense-making, anddecision-making in small emergency management teamsthat consist of domain experts.This paper presents design solutions for the activity
awareness problem by supporting collaborative sense-making in distributed group emergency management.The paper first reviews relevant research work in theareas of computer-supported cooperative work (CSCW),geo-collaboration, and information visualization. Then,it discusses key needs for geo-collaboration in emergencymanagement and proposes design rationales. Next, itdescribes an iterative design process that includes systemprototype implementation, system evaluation, and systemimprovement. Finally, the paper concludes with discus-sions and implications of our results and future researchdirections.
2. Related work
Our work stands between CSCW field and visualizationtechnology to support geospatial decision-making. In thissection, we review the related work in these areas.
2.1. CSCW, group decision-making, and sense-making
The cognitive resource involved in group collaborationis not the mere sum of individual intelligence. MacMillanet al. (2004), p. 61observe that team cognition is differentfrom individual cognition because it requires communica-tion, which is ‘‘a process that has no direct analog inindividual cognition’’. Additional cognitive resources mustbe invested to communicate. The relation between theprocess of communication and the way collaborativevisualizations can support this process is a key researchissue. Team communication can be facilitated throughchannels of communication in which participants’ actions
A. Wu et al. / Int. J. Human-Computer Studies 71 (2013) 4–236
relative to task- relevant objects is public (McCarthy et al.,1991). This suggests that collaborative visualization – suchas deictic expressions like ‘‘this,’’ ‘‘there,’’ and ‘‘it’’ – maybe made visible and public through the use of telepointers,pen tools, or annotation tools.
The distinction between personal and shared spaces hasbeen indicated as a useful feature of workspaces for peoplewho work with artifacts in collaboration. When Greenberget al. (1999) investigated how people moved their personalartifacts into the public domain and back again, theyargued that the use of automatic publication may beinappropriate because it denies individuals the opportunityto express personal relevancy, and discourages people fromusing the tool to develop ideas not yet ready for dissemi-nation. The results of a study on annotation sharing(Marshall and Brush, 2002) show that when transferredfrom personal to shared workspace people’s annotationsundergo habitual filtering or publishing operations (e.g.,clarifications). This suggests that the same informationtends to satisfy different functions depending on whether itis presented privately (e.g., to aid memory) or publicly(e.g., to aid communication).
Unsupported individuals and groups are both limitedand biased when they need to use large and dynamicinformation corpora to make decisions under uncertainconditions. We isolate three main systematic limitations orbiases that affect groups’ ability to accurately shareknowledge and make decisions.
1.
Groups’ biased analysis and discussion: when sharingand discussing both shared and unshared information,collaborators tend to favor familiar information overunfamiliar information. Unless corrective interventionsare introduced, group discussions are systematicallybiased toward shared information at the expense ofunshared and less familiar information (see hiddenprofile in Stasser and Titus, 2003).2.
Limited information processing capacity: collaboratorshave both a limited capacity to process massiveamounts of information in a short interval of timeand a limited ability to accurately distinguish andmanage distinct epistemological categories of informa-tion at the same time: facts and sources, inferencesabout facts and sources, how-to knowledge about thetask, experts’ related experience (e.g., Tversky andKahneman, 1974).3.
Groups’ biased synthesis and decisions: when interpretingthe meaning and weighing the relevance of informationunder uncertainty and social influence, a group makedecisions under the influence of systematic biases such asanchoring to early hypotheses and bias in posterior-probability estimates (e.g., Convertino et al., 2008).Decision-making often involves sense-making activities.Sense-making is a key component of knowledge work, andoccurs when people face new problems or unfamiliar
situations and their knowledge is insufficient for thetask. Sense-making finds critical patterns in a seeminglyunstructured situation by developing successively moresophisticated representations and fitting information intothese representations in service of a task (Russell et al.,1993). Traditional theories of sense-making have tendedto be either purely top-down or bottom-up. Top-downapproaches emphasize the necessity of using proper repre-sentations in sense-making (Russell et al., 1993; Qu andFurnas, 2005). A representation usually refers to a dia-grammatic (e.g., trees, graphs), pictorial, or narrativedescription of a data relationship. An appropriate repre-sentation is necessary to guide such sense-making activitiesas searching and integrating information. Bottom-upapproaches de-emphasize the role of a priori representa-tions in guiding sense-making, and adopt a ‘‘from data towisdom’’ method focused on information exploration andinductive construction of knowledge schemata (Ackoff,1989). The strength of bottom-up approaches is in thepotential for new insights and discoveries of structures andrelationships in data. Recently, researchers have proposedhybrid approaches for sense-making as a process involvingboth finding appropriate representations to suit givenstructures and developing structures based on availableinformation (Bodnar, 2005; Pirolli et al., 2005; Pirolli andCard, 2005; Klein et al., 2006). However, some questionsremain, including how to connect top-down and bottom-up activities.Sense-making also exists in group activities and
researchers have called for new designs to support colla-borative sense-making because of its importance to groupactivities. Research has shown that group sense-makingoften involves a team of people who analyze, share, andsynthesize relevant information together (Schafer et al.,2008; Robinson, 2008). Paul et al. (2008) argue the needfor flexible representation where tools are switched toaddress the gaps in sense-making between individualsand groups. Qu and Hansen (2008) suggest that sharedrepresentations among group members are important tocollaborative sense-making.
2.2. Awareness in distributed groups
Awareness in computer-mediated groups is an issue thathas been extensively researched. Generally speaking,awareness is about the knowledge of others in a group,which can help better understand the group activities andimprove group performances (Dourish and Bellotti, 1992).Awareness information concerns different perspective ofgroup behaviors, such as presence awareness (Curry, 1999;Slater et al., 1992), which is about whether a person isavailable in workspace, and activity awareness (Carrollet al., 2003), which emphasizes the importance of under-standing activity context in situations beyond face-to-facesituations.Our interest here is in activity awareness. The term
‘‘activity’’ refers to ‘‘substantial and coherent collective
A. Wu et al. / Int. J. Human-Computer Studies 71 (2013) 4–23 7
endeavors directed at meaningful objectives’’ and the‘‘activity awareness’’ as ‘‘the sharing requirement’’(Carroll et al., 2003). With this definition, a team formedof multiple stakeholders with different responsibilities needto know what others are doing and how they are doing tosucceed in their coordination. In coordination tasks, teammembers often need to share and manipulate resources(human power, natural resources, time etc.). Knowing theavailability of required resources and who is dealing withsuch resources is important as well. Knowledge of otherpeople’s interaction with object in the shared workspace isdefined as action awareness, which is widely supported insynchronized collaboration (e.g., radar views, telepointers).
The idea to support high-level activity awareness providesdesign opportunities in taking advantage of mediated tech-nology for distributed collaboration. Carroll et al. (2006)have identified potential techniques to support activityawareness from four aspects: common ground (e.g., radarview, media space), communities of practice (e.g., annotation,discussion board), social capital (e.g., activity log visualiza-tion, resource usage indicators), and human development(e.g., historical view of personal profile, annotated workflow).Carroll et al. (2003) demonstrated an early effort in supportactivity awareness in virtual classroom through situation,group, task, and tool factors.
2.3. Supporting geo-collaboration with visualization
Generally speaking, information visualization can sup-port decision-making (Card et al., 1999) by increasing thememory and process resource available to users and byusing visual representations to enhance pattern detection.In case of geo-collaboration, maps offer additional help forgroup activities. In this section, we first review literature onusing conventional information visualization techniques tosupport sense-making and group decision-making. Then,we examine visualization techniques for specific roles withthe use of maps, or geo-visualization, in supporting groupactivities.
2.3.1. Information visualization to support sense-making
and group decision-making
Weick and Meader (1993) called for ‘‘sense-making sup-port systems’’ to construct consensual definitions for buildingcommon understanding. Visualization has been used toachieve this goal. DiBiase (1990) distinguished two purposesof visual artifacts – assisting visual thinking in the privatedomain and facilitating visual communication in the publicdomain – and indicated the important role of visualizationtools as a medium to enhance group communication. Studiesin the military sector have shown that visualization techni-ques can help people to rapidly comprehend complexlytangled information in emergency situations (Feibush et al.,2000). Recently, Bier et al. (2008) presented a system tofacilitate the discovery and organization of relevant informa-tion in collaborative intelligent analysis; other systems aimedspecifically at increasing the quality of the group reasoning
by reducing judgment bias in these collaborative conditions(Convertino et al., 2008).The presence of visualization also can influence the level
of participation of the members and the informationsharing process during group decision-making. Studies ofcomputer-supported communities have shown that mem-ber participation or community development can beinfluenced using appropriate tools (Beenen et al., 2004).Shared visualizations can help collocated working groupsto communicate more effectively by externalizing thecommunication process (DiMicco et al., 2003).Although visualization is regarded as a powerful tool for
group sense-making, most existing visualization systemslargely focus on visualizing artifacts and content for thetasks. There is still very limited support for visualizingrelevant aspects of the work process in order to enhancethe awareness and sense-making abilities of groups.
2.3.2. Geo-visualization to support group decision-making
Maps have been used in various professions for a verylong time in problem solving and decision-making byproviding visual representations of geographic space(MacEachren, 1995). However, the functions of maps havebeen dramatically expanded in modern times. Nowadays,maps are regarded as artifacts that facilitate complexhuman activities involving the use, access, and organiza-tion of geo-spatial information (MacEachren and Kraak,2001). Research in psychology also has found that mapsare cognitive artifacts that can help individuals by extend-ing their memory and easing information processing(Tversky, 2000). As shared means for group tasks, theycan help collaborators to jointly focus attention andcommunicate more effectively (e.g., Heiser et al., 2004;Clark and Krych, 2004).Geo-visualization, a new discipline that emerged from the
Geographic Information Science (GIScience) field, goesbeyond simple graphic representations of geo-spatial infor-mation, which is the focus of cartography, and considersbroader issues such as the integration of knowledge con-struction with geo-spatial information, user interface design,and cognitive challenges in perceiving and processing geo-spatial information (MacEachren and Kraak, 2001).Recent advances in computer graphics, computer net-
works, collaborative software, and Web-based technology(e.g., Google Maps and Yahoo! Maps) have triggered adigital revolution in the use of maps in many aspects ofhuman life. In this context, researchers argue that the scopeof issues that geo-visualization addresses should befurther extended to support advanced analytical tasks.Kraak (2006) calls for research on how to use maps toencourage knowledge exploration and stimulate new ideasand analysis. Andrienko and Andrienko (2006) indicate thatcomputer-based geo-visual analytical tools become importantto spatial decision-making activities, and identify key issuesassociated with geo-visual analytics, including the explorationof problems and solutions, the integration of heterogeneous
A. Wu et al. / Int. J. Human-Computer Studies 71 (2013) 4–238
information, reasoning, deliberation, communication amongstakeholders, and so on.
Geo-visualization is important to group decision-making in many ways. From the perspective of carto-graphic representation, maps can facilitate group discus-sion by offering cartographic objects to talk about, objectsto think about, and objects used for action coordination(MacEachren and Cai, 2006). Maps also can serve as visualmediation and event context to help group members tounderstand a task. For example, Armstrong and Densham(1995) showed that different map types can help peoplecompare alternative solutions to the same problem;research by Rinner (2001, 2006) showed that by explicitlylinking arguments in a discussion with related geographicobjects, argumentation maps can improve the analysis andsummarization of current status in conversations and assistpeople completing geospatial related planning tasks.
Research efforts also have been made to investigate thedesign of geo-visualization systems for group activities.Brodlie et al. (2005) argue that distributed geo-visualization systems must consider the integration of threeimportant factors: data, people, and computationalresources. From the aspect of information sharing ingroup, Brodlie (2005) offers various models on collabora-tive visualization that can be applied in the design ofdifferent kinds of systems. Fuhrmann and Pike (2005)outline a set of user-centered design approaches forcollaborative geo-visualization tools.
In summary, sharing, synthesizing, and making sense ofgeo-spatial and non-geo-spatial information are critical tocollaborative decision-making in emergency management andplanning. Conventional Geographic Information Systems(GIS) (e.g., ArcGIS) and map services (e.g., online digitalmaps) are insufficient to support such collaborative activitiesbecause they are usually designed for individual users(MacEachren and Brewer, 2004). The gap between theseGIS tools and the need for geo-collaboration has beenidentified by some researchers (Cai, 2005). Research effortshave been made to explore new theoretical understandingsof collaborative geo-visualization (Brodlie et al., 2005;MacEachren, 2005; Brodlie, 2005) and new designs to supportcollaborative geo-visualization (Kemp, 2005; Fuhrmann andPike, 2005). However, most of these efforts are targeted forgeneric models or high-level design issues that are insufficientto handle the complex activities in geo-collaboration weobserved in emergency management and planning.
3. Design rationale
Our design rationale was based on a previous field study(Schafer et al., 2007). This study focused on emergencymanagement activities in central Pennsylvania, and summar-ized key software requirements for geo-collaboration deci-sion-making in emergency management. In this section, webriefly present the fieldwork and design requirements, andthen discuss the design of our geo-collaboration system.
The fieldwork studied two communities in the centralPennsylvania, observing emergency management practice.In the study, local emergency management coordinatorswere interviewed about their planning activities, and archivaldata (e.g., meeting minutes and e-mail records among teammembers) were collected. Some emergency planning meetingswere audio-recorded, transcribed, and analyzed.The study developed a set of software design require-
ments to support emergency response planning activities.More importantly, the study informed the design of twolab experiments on decision-making processes in geo-collaboration (Convertino et al., 2008, 2009, 2011). Boththe field study and lab work identified key sense-makingprocesses performed by the work groups and suggested theneed for better tools to support both their top-down andbottom-up sense-making activities.
3.1. Tools to support bottom-up (data-driven) activities
Bottom-up activities usually focus on exploring new data.Such data exploration activities are largely conducted onmaps. Maps are effective organizers of geospatial data.Moreover, when shared in a group, they allow referencingof shared objects while the members discuss and plantogether (i.e., deixis). Our system design introduced multiple,role-based views coordinated with a team view. As a result, inour laboratory studies, each group member used two mapsfor data exploration: one personal map with role-specificdata for individual analysis and one shared map for the teamto share information and build a group plan. With thesemaps, the individuals could conduct the following activities:
�
Exploring geographic locations. To make a good emer-gency management plan, team members need to be ableto explore and understand the focus areas and sur-rounding areas. Such exploration could be conductedby either individual planners or by a team. For example,finding a route to evacuate people from an emergencyrequires planners to know and explore road systems inthe area as well as in neighboring areas. Planners caneither gather such information individually or as a team. � Labeling and annotating geographic locations. In colla-boration, planners often need to add important infor-mation related to certain locations. They may sketch onmap locations or write down comments. Addedinformation can be role-specific or shared within theteam. Thus, tools to support individual and collabora-tive sketching and annotation on maps should beprovided.
3.2. Tools to support top-down (representation-driven)
activities
Top-down activities are guided by certain knowledgerepresentation. Often, people use representation tools toexternalize critical information and knowledge, such as
A. Wu et al. / Int. J. Human-Computer Studies 71 (2013) 4–23 9
what activities individuals performed, what informationwas involved in discussions, what decision has beenreached, and so on. Thus, tools are needed to support:
�
Clustering and aggregation of information contents. Thefield study (Schafer et al., 2007) shows that collabora-tive sense-making often involves the integration ofrelevant information from different sources. It is impor-tant to give sense-makers tools to cluster and aggregateinputs from individuals. Tools like sorting tables andhistogram charts should be provided for informationreview and analysis. � Representation of activity data. Activity awareness iscritical to group work (Carroll et al., 2003). Teammembers should know what work individuals have done,when they did that work, where their contributions were,and so on. Timeline tools should be provided for suchactivity awareness. The granularity of timelines can bechanged, and if so, sense-makers can cluster and aggre-gate activities based on different activity attributes (e.g.,location) (Zhang et al., 2010) and action types (Gotz andZhou, 2009).
The above design requirements lead to the followingdesign considerations for a geo-collaboration supportingsystem in emergency management.
3.3. Map-centric collaboration support
Geo-collaboration often involves large amount of geos-patial information. It would be desirable to have artifactsto externalize geospatial information so that collaboratorscan easily refer to common geospatial objects in discus-sions and planning.
3.4. Annotation and sketching support
Maps are often designed for general purposes. Withmaps, paper-based or digital, users can obtain geospatialinformation and common tools that map designers orsystems have prepared for general public. Using maps incollaboration, individuals may need to express their per-sonal perspectives or opinions, which are usually related toobjects on maps. To make such individual informationreviewable for future discussions, tools are needed torecord the information. Individual users should have toolsto take notes of the ideas that occur to them, compare theadvantages and disadvantages of specific options in dis-cussions, and add comments on spatial objects. Individualsalso should have sketching tools to illustrate spatialrelationships among objects of interest, and to mark whereissues may reside.
While annotation and sketching tools have been widelyused to help individuals analyze complex information(Fernandes et al., 1997), they also are important to groupcollaboration by facilitating group activities. For example,
Tversky (2000) argues that tools like sketching allowpeople to depict their internal understanding of theexternal world in social interaction.
3.5. Awareness support
In collaboration, it is important to provide users withawareness information, i.e., to let them know who iscollaborating and what others are doing (Dourish andBellotti, 1992). In collaboration that heavily involvesinformation and knowledge exchange among domainexperts, awareness becomes even more important toprompt information and knowledge sharing without for-cing team members to strategize the work overtly. The aimis to create the conditions for seamlessly sharing knowl-edge and coordinating action at low cost.For a geo-collaboration team with domain experts,
supporting such ‘‘implicit coordination’’ (Kleinman andSerfaty, 1989) requires tools to help collaborators accessvarious indications of members’ roles and their actions.For example, team members and information artifactsassociated with them (e.g., comments and sketches) canbe color-coded to help others recognize individual con-tributions. Telepointers (Greenberg et al., 1996) can beprovided so that team members know where a teammate isfocusing and what that teammate is doing.
3.6. Multiple map views to support both personal and shared
activities
In geo-collaboration, where maps are the central artifactfor collaborative activities, having both a personal or role-specific map view as well as a shared or team map view isimportant. Prior research has suggested that providingteam members with a personal workspace improves thequality of collaboration (Olson et al., 1992) becausepersonal workspace allows individuals to perform role-specific activities that they do not want to share withothers. The availability of a shared view among collabora-tors who work on problem solving tasks improves theircommunication efficiency (i.e., management of content)(Clark and Krych, 2004; Heiser et al., 2004) and helpsthem to build task structure knowledge and situationawareness (i.e., useful to managing the process) (Krautet al., 2002).It is also important to consider, in this context, that
when experts work on complex problems under realconditions, they regularly experience information overloadin managing both role-specific and shared information.Therefore, they need adequate support to filter outirrelevant information. We argue that the availability ofdistinct views for role-specific and shared information canhelp each team member to ‘‘selectively’’ share withteammates their role-specific (or unique) content, thuslimiting their cognitive load while at the same timeoffering a personal space for individual analysis(Convertino et al., 2008, 2009, 2011). In fact, in our design,
A. Wu et al. / Int. J. Human-Computer Studies 71 (2013) 4–2310
personal (role-specific) and shared (team) map views servedifferent purposes. The personal map view displays role-specific information and allows individuals to analyze theirown data privately and explore various options before theydecide what information and knowledge to share withothers. At a team level, with different role-specific viewsused at the same time, the team members can execute dataanalysis and exploration in parallel, making collaborationmore efficient. The team (shared) map, as the commonview of all team members, is the place where sharedinformation is displayed and where commonly-relevantobjects and places are examined collectively. Informationin the personal (role-specific) workspace often needs to betransferred to the shared space. Thus, the capacity totransfer information from role-specific maps to sharedones should be provided.
The technique of using multiple views already has beenproven useful in helping individuals make sense of complexdata sets (Roberts, 1998; Baldonado et al., 2000). How-ever, this technique has been largely used in the context ofsingle-user applications to address issues like the balancebetween context and content information (North andShneiderman (2000)). More recently, research on colla-borative systems has pointed to new needs to be accountedfor in the design of collaborative applications: the need tomanage large and heterogeneous knowledge sets, differentprofessional roles, distinct role-specific and shared dataand workspaces, and support for a sufficient level ofmutual awareness among collaborators (see Convertinoet al., 2005, for a more detailed review).
3.7. Coordinated views to support sense-making and
awareness
To help team collaboration, information artifacts inmultiple views also need to be coordinated. Team membersmay contribute to the teamwork by offering new annota-tions and creating new sketches. These new objects canappear in different views, such as in the public map as wellas in the team action timeline, each of which servesdifferent purposes (see prior section). To better understandand judge the contributions to teamwork by individuals,people need to understand how objects in different viewsare related (e.g., knowing which place an annotation isabout in the public map and when the annotation wasposted in the team action timeline). Using techniques suchas color-coding or a dual-pointer to coordinate informa-tion artifacts in different views can help people connectobjects of interest and understand the actions of teammembers.
It should be noted that multiple coordinated views havealready been used to support information analysis. Forexample, Roth and his colleagues have proposed designslike SageTools (Roth et al., 1995) and Visage (Lucas andRoth, 1996) to use multiple views to support informationexploration and analysis by individuals. Our use of multi-ple coordinated views focuses more on supporting group
activities, such as sharing selective information within agroup, enforcing specific roles that team members assume,and improving activity awareness (Convertino et al., 2005).The Command Post of the Future is a real multiple-viewsystem developed by General Dynamics (http://www.gdc4.com) to support teams of U.S. military commanders inmaintaining real-time situational awareness and coordinat-ing operations in the battlefield (the system was deployedin the Iraq and Afghanistan wars). The coordinated viewsinclude shared interactive maps populated with data andcoordinated with graphical and text-based views (Thomasand Cook, 2005). Different from our design, this systemdoes not include role-specific views of the map, as distinctfrom and coordinated with the shared team view.
4. Design, implementation, and evaluation of system
prototypes
Based on the above design considerations, we developedsystem prototypes to support role-based geo-collaboration.These system prototypes are targeted at multi-expert teamsmaking complex decisions based on maps. The design andimplementation of system prototypes went through a two-phased iterative process that included technical systemimplementation, system evaluation, and system functionimprovement.
4.1. Phase I: Java system prototype
The first system prototype was a Java application. Wechose the Java technology because of its platform inde-pendence, which allows broader distributed collaboration,and the availability of geospatial information tools, whichare critical to geo-collaboration support functions. Below,we briefly present the final version of the system and itsevaluation in the field and the lab. See Carroll et al. (2007)for details on earlier versions of this prototype, andConvertino et al. (2008, 2009, 2011) and Convertino andCarroll (2011) about the lab evaluation studies. This workin Phase I is summarized here because it was foundationalfor the design work that followed in Phase II (Section 4.2).
4.1.1. Architecture
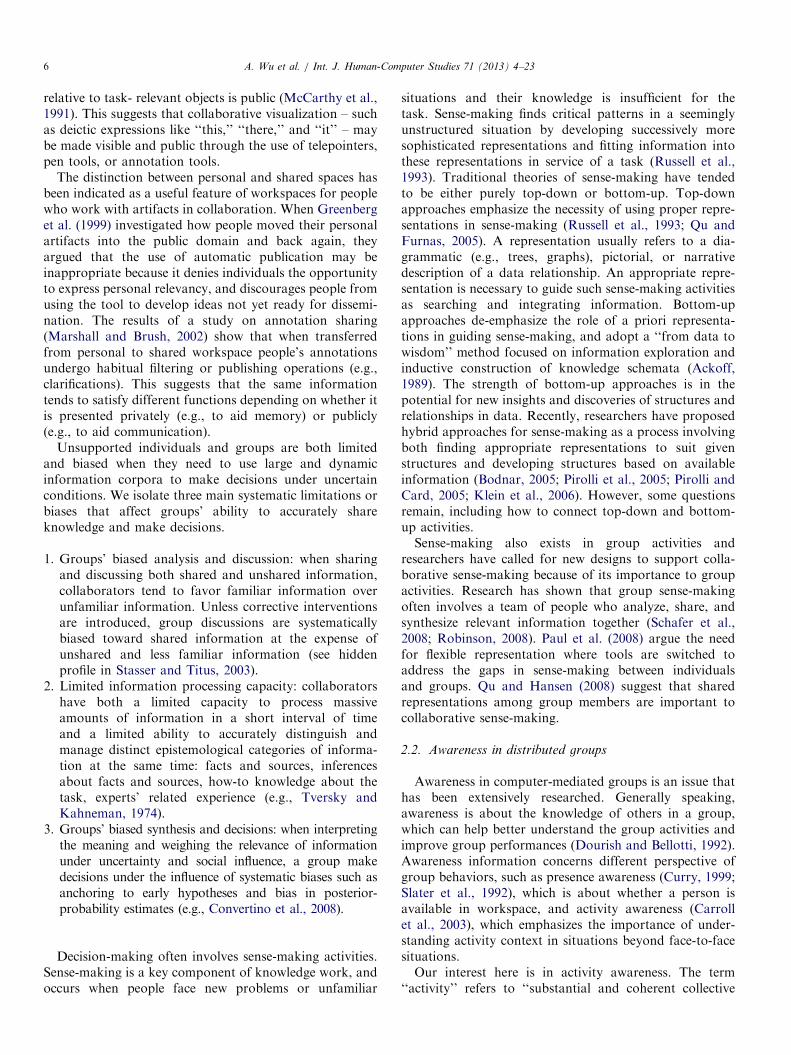
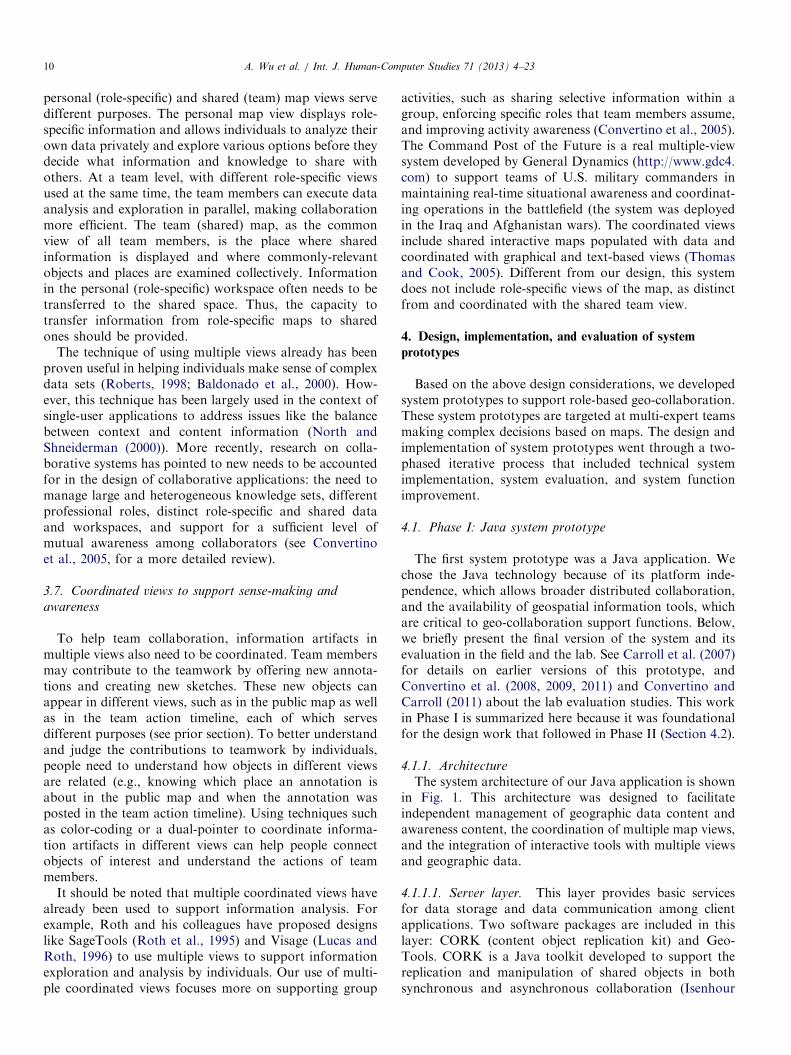
The system architecture of our Java application is shownin Fig. 1. This architecture was designed to facilitateindependent management of geographic data content andawareness content, the coordination of multiple map views,and the integration of interactive tools with multiple viewsand geographic data.
4.1.1.1. Server layer. This layer provides basic servicesfor data storage and data communication among clientapplications. Two software packages are included in thislayer: CORK (content object replication kit) and Geo-Tools. CORK is a Java toolkit developed to support thereplication and manipulation of shared objects in bothsynchronous and asynchronous collaboration (Isenhour
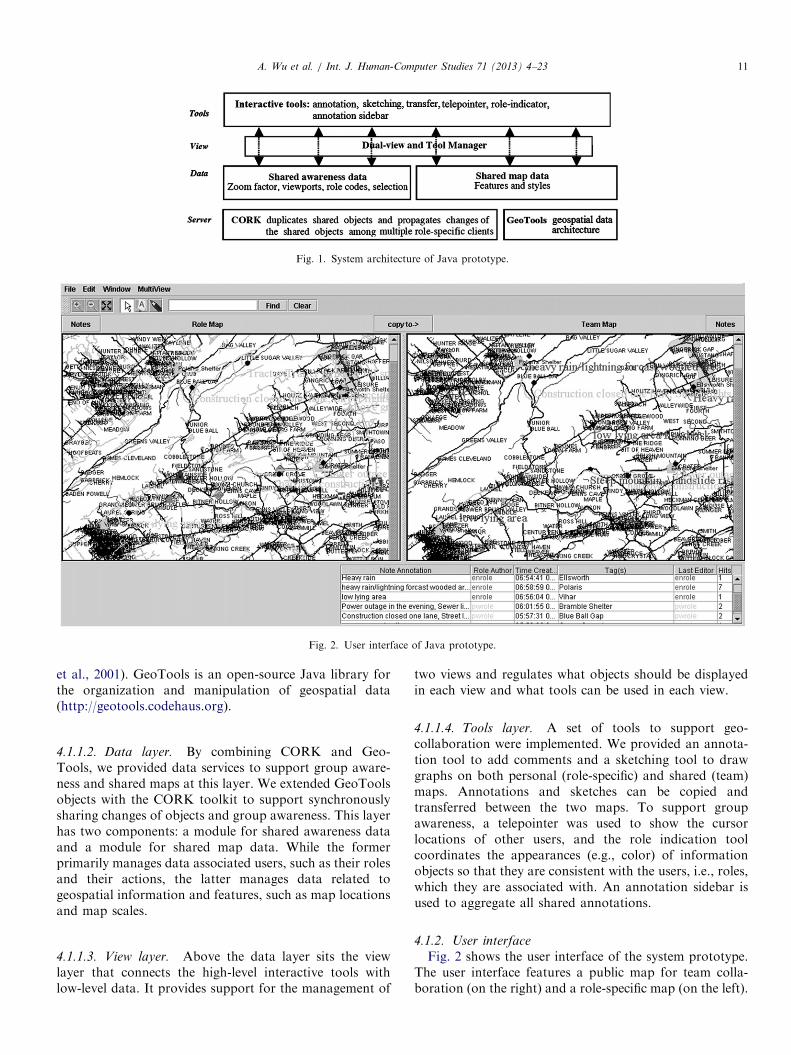
Fig. 1. System architecture of Java prototype.
Fig. 2. User interface of Java prototype.
A. Wu et al. / Int. J. Human-Computer Studies 71 (2013) 4–23 11
et al., 2001). GeoTools is an open-source Java library forthe organization and manipulation of geospatial data(http://geotools.codehaus.org).
4.1.1.2. Data layer. By combining CORK and Geo-Tools, we provided data services to support group aware-ness and shared maps at this layer. We extended GeoToolsobjects with the CORK toolkit to support synchronouslysharing changes of objects and group awareness. This layerhas two components: a module for shared awareness dataand a module for shared map data. While the formerprimarily manages data associated users, such as their rolesand their actions, the latter manages data related togeospatial information and features, such as map locationsand map scales.
4.1.1.3. View layer. Above the data layer sits the viewlayer that connects the high-level interactive tools withlow-level data. It provides support for the management of
two views and regulates what objects should be displayedin each view and what tools can be used in each view.
4.1.1.4. Tools layer. A set of tools to support geo-collaboration were implemented. We provided an annota-tion tool to add comments and a sketching tool to drawgraphs on both personal (role-specific) and shared (team)maps. Annotations and sketches can be copied andtransferred between the two maps. To support groupawareness, a telepointer was used to show the cursorlocations of other users, and the role indication toolcoordinates the appearances (e.g., color) of informationobjects so that they are consistent with the users, i.e., roles,which they are associated with. An annotation sidebar isused to aggregate all shared annotations.
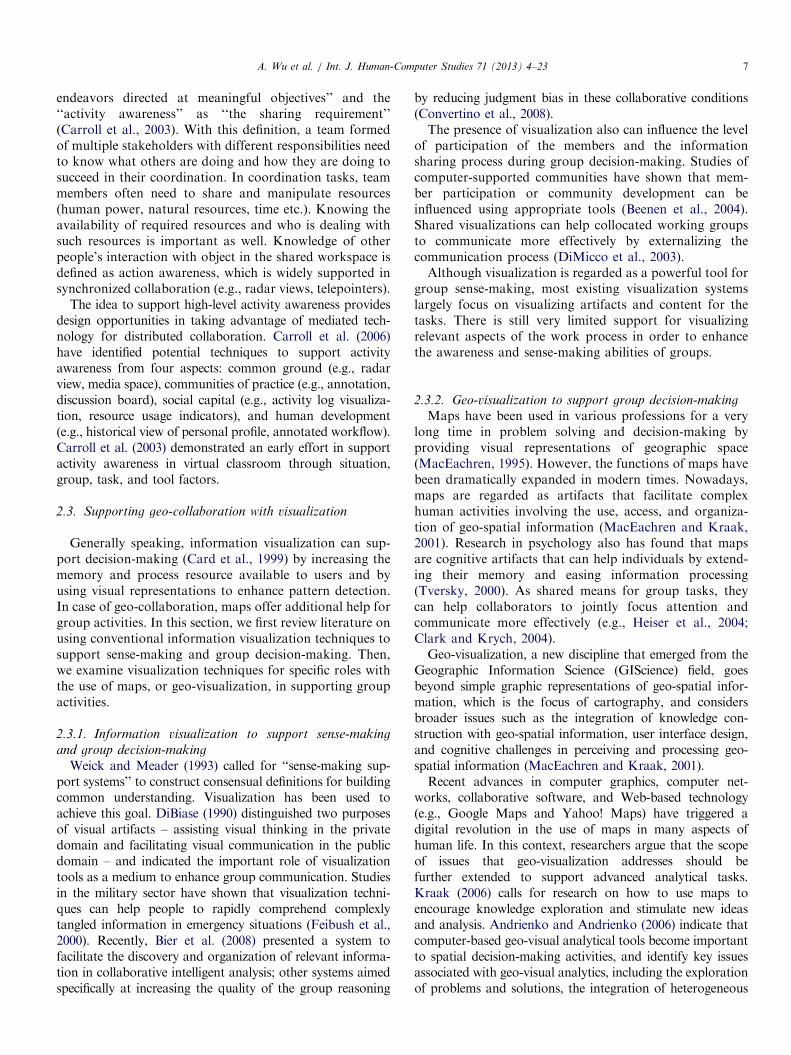
4.1.2. User interface
Fig. 2 shows the user interface of the system prototype.The user interface features a public map for team colla-boration (on the right) and a role-specific map (on the left).
A. Wu et al. / Int. J. Human-Computer Studies 71 (2013) 4–2312
Each map displays multiple layers of geographical data.Each user’s public map has the same set of information,but information on a user’s personal map is not sharedwith others. Users can choose different tools (e.g., zoomingand panning maps, adding annotations, sketching) byeither clicking tool icons organized in tool bars, orselecting menu items.
The prototype also provided a sorting table to display allshared annotations. The table lists important attributes ofeach annotation item, including content, creator, the timethe item was created, geographic location associated,person who made the most recent change, and times beingreviewed. By clicking on a table column the user can re-sort all annotations.
4.1.3. System evaluation
In this research, we systematically integrated field andlab methods to evaluate the prototype. The fieldwork withreal experts ensured validity and relevance to the realworld. The lab studies, meanwhile, enabled us to performcontrolled experimentation with the proposed design (fordetails, see Convertino and Carroll, 2011).
We conducted field work and a focus-group interviewstudy in which we demonstrated the system to an emer-gency management team in central Pennsylvania andcollected feedback about the overall design concept andvarious tools. The field work was important because onlyemergency management professionals can provide accuratefeedback regarding whether our high-level design is appro-priate to the real-world practice.
Asking emergency management professionals to partici-pate in lab studies always presents many challenges,considering the limited availability of these individualsand their small number. Therefore, we modeled the workconditions and designed the tasks in the lab based on ourfield observations and with the help of experts (see Schaferet al., 2007) and ran a lab study with university studentsfrom campus. The lab study was necessary because itallows us to accurately measure the use of designed toolsby controlling the user task and the use of tools, reducingthe potential impacts of other factors on user behaviors.
4.1.3.1. Fieldwork. We demonstrated our system to theemergency management team and presented the majorfeatures of the system. The team expressed interest in ourdesign. The map-centric, role-based approach was regardedas very valuable and suitable for their needs and practice inreal-world planning sessions. In particular, interactive mapswere welcomed by the team. Compared with paper mapsthey had used in the real-world practice, the digital mapsoffered the team more freedom in exploring and interpret-ing geo-spatial information.
While the team members showed enthusiasm about theoverall design concept, their attitude toward the technol-ogy was reserved. The client-server architecture offeredsome benefits to the team by allowing individuals to workin a more distributed manner and balance role-specific and
collaborative activities. However, through the discussionswith the team, we found several issues that could poten-tially prevent our system from being used successfully.These issues were concerned with the technical constraintsof installing, maintaining, and using the system. First, ourprototype requires the management and maintenance oftwo key modules, CORK and GeoTools. Second, to createnew training scenarios on new geographic locations, wehad to add more geospatial data into the GeoTools. This isbecause the GeoTools is not a GIS system containing realdata; rather it is just a toolkit to process geospatial dataprovided by users. The team, only including emergencymanagement professionals, lacked the technical know-howto address these concerns.
4.1.3.2. Lab evaluation. The purpose of the lab study wasto investigate the impact of our system on collaboration.In particular, we were interested in knowing how ourvisualization tools may facilitate the outcomes and pro-cesses of collaborative decision-making.
4.1.3.2.1. Experiment design. Existing research showsthat proper deployment of geo-visualization tools canfacilitate spatio-temporal analytics in dynamic situations(e.g., Andrienko and Andrienko, 2006). In tasks likeemergency management and planning, maps can become‘‘visual index’’ used for various tasks, including construct-ing heuristic knowledge, ordering decision option, andarguing outcome between different stakeholders(Jankowski and Nyerges, 2001). Our experiment wasaligned with this view of the role of technology in groupdecision.The experiment was a between-subject design. The
independent variables were the way in which collaborationwas conducted and technologies were involved. Twotreatments were selected. One treatment was a face-to-face setup (FTF), in which team members worked togetherin a collocated environment and with paper-based maps.The other treatment was a software environment (SW), inwhich individual team members were put into differentrooms and collaborated with each other by using oursystem prototype.
4.1.3.2.2. Participants. In total, ninety-six participantswere recruited for the experiment from Pennsylvania StateUniversity. Twelve of the participants were universityemployees, and the rest were students. Their ages rangedfrom 20 to 45. The participants had little prior experiencewith emergency response planning or operations.The participants were grouped into thirty-two three-
person teams. To encourage equal participation and avoidmale dominance (Herring, 1993), we created same-gendergroups (except in one case). In the FTF treatment, we hadsix male teams, five female teams, and one mixed-genderteam with one female and two males. In the SW treatment,we had ten male teams and ten female teams.
4.1.3.2.3. Team task. The experimental task was toconstruct a plan to evacuate a family in an imaginaryemergency situation, similar to the collaborative decision-
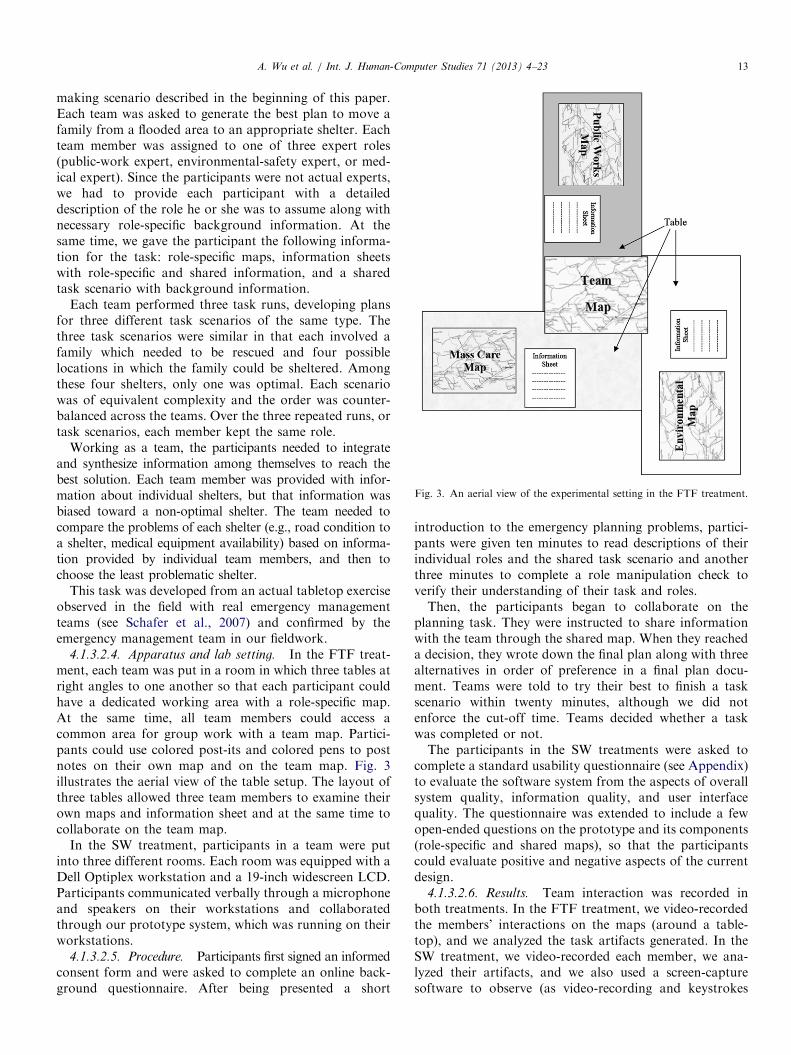
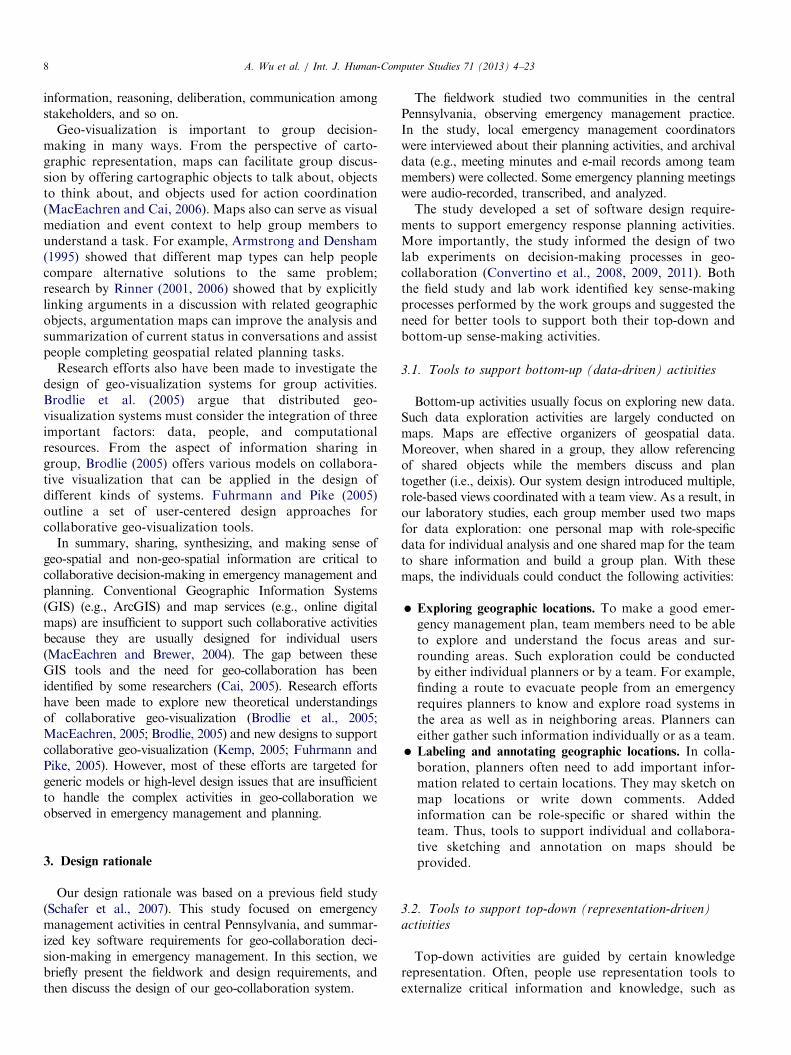
Fig. 3. An aerial view of the experimental setting in the FTF treatment.
A. Wu et al. / Int. J. Human-Computer Studies 71 (2013) 4–23 13
making scenario described in the beginning of this paper.Each team was asked to generate the best plan to move afamily from a flooded area to an appropriate shelter. Eachteam member was assigned to one of three expert roles(public-work expert, environmental-safety expert, or med-ical expert). Since the participants were not actual experts,we had to provide each participant with a detaileddescription of the role he or she was to assume along withnecessary role-specific background information. At thesame time, we gave the participant the following informa-tion for the task: role-specific maps, information sheetswith role-specific and shared information, and a sharedtask scenario with background information.
Each team performed three task runs, developing plansfor three different task scenarios of the same type. Thethree task scenarios were similar in that each involved afamily which needed to be rescued and four possiblelocations in which the family could be sheltered. Amongthese four shelters, only one was optimal. Each scenariowas of equivalent complexity and the order was counter-balanced across the teams. Over the three repeated runs, ortask scenarios, each member kept the same role.
Working as a team, the participants needed to integrateand synthesize information among themselves to reach thebest solution. Each team member was provided with infor-mation about individual shelters, but that information wasbiased toward a non-optimal shelter. The team needed tocompare the problems of each shelter (e.g., road condition toa shelter, medical equipment availability) based on informa-tion provided by individual team members, and then tochoose the least problematic shelter.
This task was developed from an actual tabletop exerciseobserved in the field with real emergency managementteams (see Schafer et al., 2007) and confirmed by theemergency management team in our fieldwork.
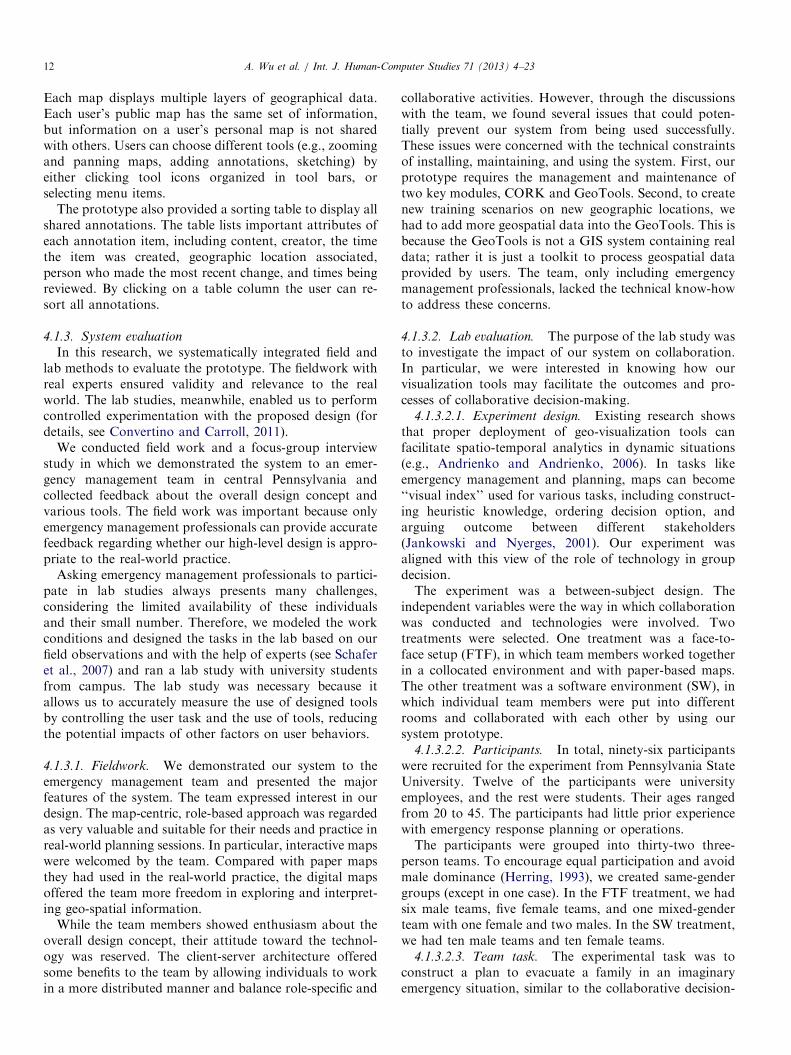
4.1.3.2.4. Apparatus and lab setting. In the FTF treat-ment, each team was put in a room in which three tables atright angles to one another so that each participant couldhave a dedicated working area with a role-specific map.At the same time, all team members could access acommon area for group work with a team map. Partici-pants could use colored post-its and colored pens to postnotes on their own map and on the team map. Fig. 3illustrates the aerial view of the table setup. The layout ofthree tables allowed three team members to examine theirown maps and information sheet and at the same time tocollaborate on the team map.
In the SW treatment, participants in a team were putinto three different rooms. Each room was equipped with aDell Optiplex workstation and a 19-inch widescreen LCD.Participants communicated verbally through a microphoneand speakers on their workstations and collaboratedthrough our prototype system, which was running on theirworkstations.
4.1.3.2.5. Procedure. Participants first signed an informedconsent form and were asked to complete an online back-ground questionnaire. After being presented a short
introduction to the emergency planning problems, partici-pants were given ten minutes to read descriptions of theirindividual roles and the shared task scenario and anotherthree minutes to complete a role manipulation check toverify their understanding of their task and roles.Then, the participants began to collaborate on the
planning task. They were instructed to share informationwith the team through the shared map. When they reacheda decision, they wrote down the final plan along with threealternatives in order of preference in a final plan docu-ment. Teams were told to try their best to finish a taskscenario within twenty minutes, although we did notenforce the cut-off time. Teams decided whether a taskwas completed or not.The participants in the SW treatments were asked to
complete a standard usability questionnaire (see Appendix)to evaluate the software system from the aspects of overallsystem quality, information quality, and user interfacequality. The questionnaire was extended to include a fewopen-ended questions on the prototype and its components(role-specific and shared maps), so that the participantscould evaluate positive and negative aspects of the currentdesign.
4.1.3.2.6. Results. Team interaction was recorded inboth treatments. In the FTF treatment, we video-recordedthe members’ interactions on the maps (around a table-top), and we analyzed the task artifacts generated. In theSW treatment, we video-recorded each member, we ana-lyzed their artifacts, and we also used a screen-capturesoftware to observe (as video-recording and keystrokes
A. Wu et al. / Int. J. Human-Computer Studies 71 (2013) 4–2314
logs) each member’s interaction with the software and withhis or her collaborators. The recorded videos from eachteam were transcribed and coded for data analysis.
The resulting data allowed us to conduct an in-depthanalysis about group collaboration. Other publications(Convertino et al., 2008, 2009, 2011) of ours providedmore detailed results about group activities, such asperformance, communication structures, the perceptionof group processes and performance, and the retention oftask-relevant information. Here, we report results relatedto group information sharing, group performance, anduser feedback on the overall user interface.
Increased Content Sharing when Using Software: Wefound that our prototype system encourages more efficientsharing of information content. We first compared thepercentage of both ‘‘push’’ acts (adding information) and‘‘pull’’ acts (replying to questions) in interactions amongFTF and SW team members. We conducted this compar-ison because existing studies of common ground and mediafor communication have shown that changes in theproportion of some categories of dialog acts, such asquerying acts, are associated with changes in the mediaand setting conditions for building common ground. Forexample, Clark and Brennan (1991) argued that extradialogues within a group are often needed when themedium the group rely on provides comparatively lesssupport for common ground building. Some research(O’Conaill and Whittaker, 1997; Sanford et al., 2004) hasobserved that the distributions of ‘‘align’’ and ‘‘query’’ actsin groups can vary from group to group, depending ontheir communicating technologies.
Our data showed that the SW teams used a greaterproportion of push acts (10.9%) than the FTF teams did(8.5%), and a smaller proportion of pull acts (3.0%) thanthe FTF team (4.4%). We used a semi-parametric versionof the Poisson regression model (Agresti, 2002) to test theeffect of the collaboration setting (FTF vs. SW) on theproportions of push and pull acts. For the push acts,we found that the difference between two treatmentsapproaches significance (߼ .26(0.15), po .08). For the pullacts, the difference is significant (߼� .81(0.15), po .001).This result suggests that the team members shared informa-tion more efficiently when they worked remotely throughour interactive prototype, compared to those who workedface-to-face using physical maps.
We further compared the percentage of push and pullacts between the first and the third task scenarios in theSW treatment. We found an increment of the proportionof push acts, from 9.5% to 12.2%, and a decrement of thepull acts, from 3.7% to 2.3%). The increment of push actsis significant (ß¼ .12(0.06), po .05), while the decrement ofpull acts is nearly significant (ß¼ .11(0.06), po .06). Thisresult suggests that the support provided by the softwarenot only offset the cost of working remotely, but alsofavored a faster growth in the efficiency of content sharingover the repeated task runs. In fact, over time the teamsbegan to push relevant information directly into the
discussion rather than waiting for a request, which makesthe content sharing process more efficient: i.e., a push act(adding information) replaced two or more request andresponse acts. Also, this improvement in efficiency wasfurther facilitated in the teams that used our SW prototype(vs. physical maps), even if they worked remotely (vs. face-to-face).
Improved Process of Sharing when Using Software: Wealso found that using software in collaboration allowsteams to share information more smoothly with less needfor explicit coordination. We compared the percentage of‘‘checking dialogue’’ acts (e.g., verifying one’s own oranother’s understanding of previously presented informa-tion, clarifying previous information, confirming thereceipt of information) between two treatments. Ouranalysis showed the number of checking acts in the SWteams was lower than that in the FTF teams (34% vs.39%), and the difference is significant (ß¼� .18(0.18),po .001). The checking acts are one measure of the costsfor coordinating a sharing process (Sanford et al., 2004).Our result shows that our software design has successfullyreduced this cost.The reduction in the need for information checking
allows teams to have more time for other high-levelactivities, such as judging (e.g., offering individual judg-ment, opinion, and preference on available information).By comparing the percentage of ‘‘judging’’ acts betweentwo treatments, we found that a larger proportion in theSW teams than that in the FTF teams (23% vs. 20%). Thedifference is significant (ß¼� .40(0.21), po .05).
Good Group Performances when Using Software: Ourdata showed that our software enabled the teams toperform the task with slightly faster on average comparedto the teams working face-to-face on paper maps(16.63 min vs. 18.1 min). The time difference is not statis-tically significant (t30¼1.08, p¼ .145). The distributedteams using our prototype also were slightly better inproducing optimal plans than those meeting face-to-facewith paper maps—41.7% of final plans were correct withthe software treatment while 38.9% were with the face-to-face treatment. The difference is not significant using aMann–Whitney Test (p¼ .452).
User Feedback on User Interface: The results from thepost-test questionnaire by participants in the SW team showthat the participants were satisfied with our software design.The median of the overall rating on the system was 5 in 7-point rating scale (from 1—strongly disagree to 7—stronglyagree), above the neutral point (4). More specifically,participants were positive about system use (e.g., easy useof the system, easy to learn, etc.) with a median of 6, as wellas user interface quality (e.g., pleasant user interface, havingtools expected, etc.) with a median of 5. They were neutralabout information quality (e.g., easy to find informationneeded, clear system message) with a median of 4.In summary, the results from Phase I indicate that our
Java-based prototype can indeed facilitate effective knowl-edge sharing and implicit coordination in geo-collaboration.
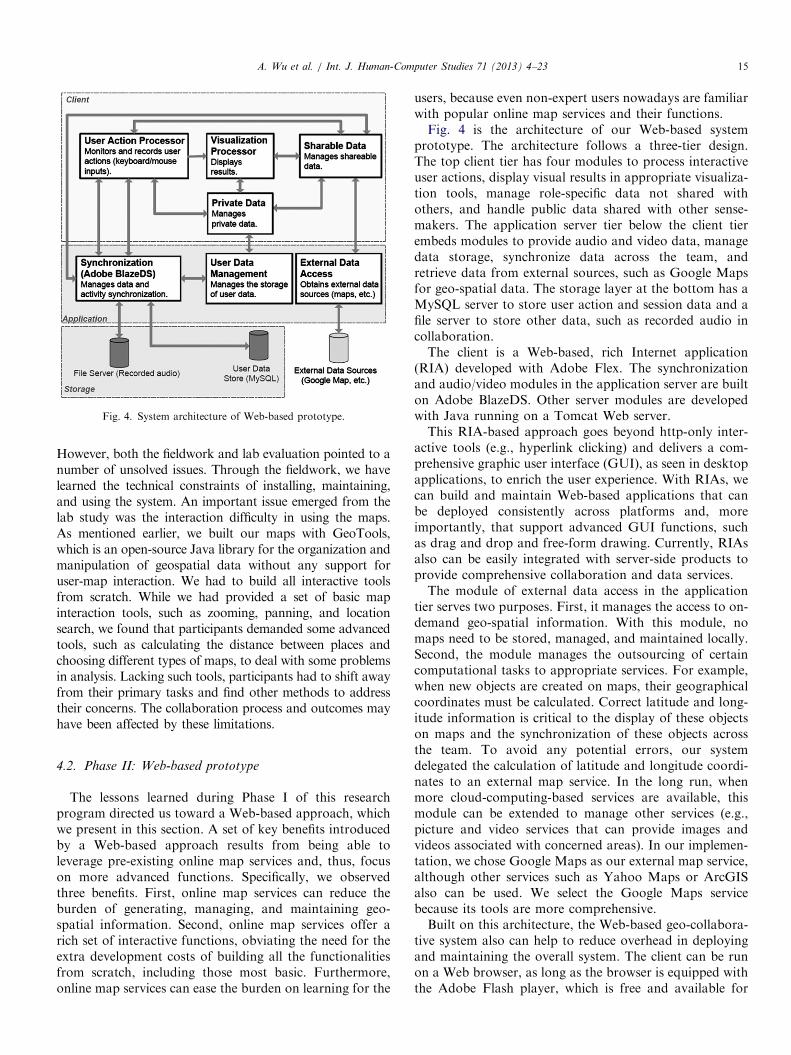
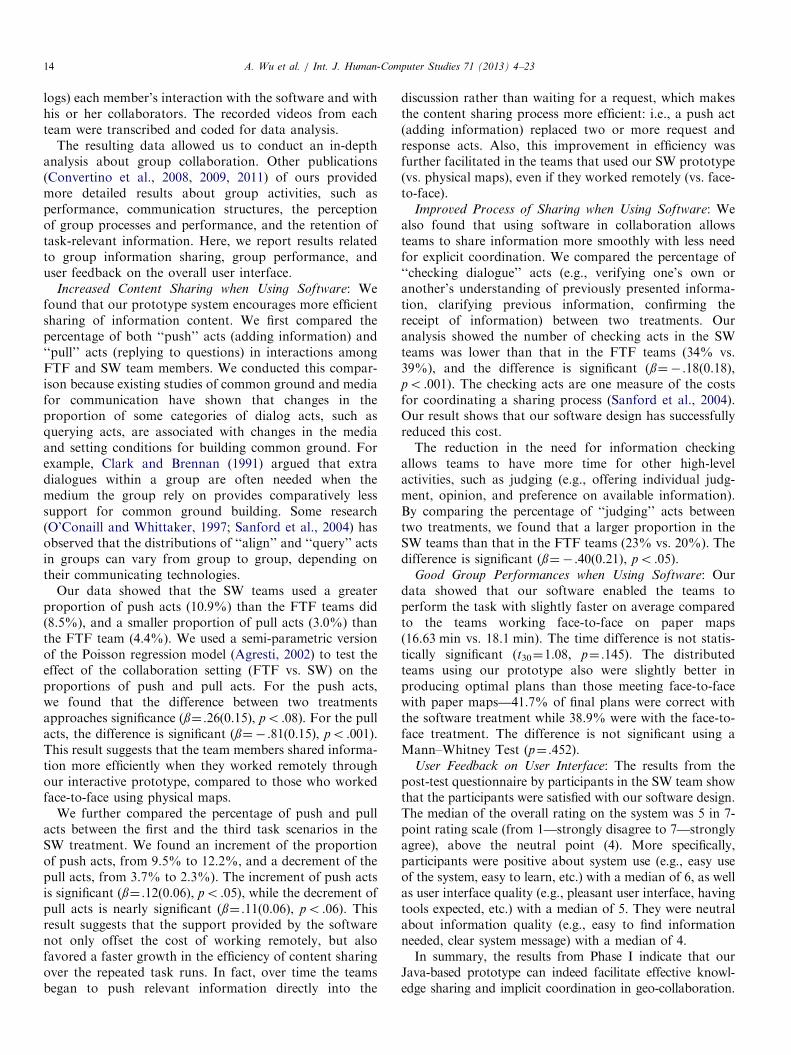
Fig. 4. System architecture of Web-based prototype.
A. Wu et al. / Int. J. Human-Computer Studies 71 (2013) 4–23 15
However, both the fieldwork and lab evaluation pointed to anumber of unsolved issues. Through the fieldwork, we havelearned the technical constraints of installing, maintaining,and using the system. An important issue emerged from thelab study was the interaction difficulty in using the maps.As mentioned earlier, we built our maps with GeoTools,which is an open-source Java library for the organization andmanipulation of geospatial data without any support foruser-map interaction. We had to build all interactive toolsfrom scratch. While we had provided a set of basic mapinteraction tools, such as zooming, panning, and locationsearch, we found that participants demanded some advancedtools, such as calculating the distance between places andchoosing different types of maps, to deal with some problemsin analysis. Lacking such tools, participants had to shift awayfrom their primary tasks and find other methods to addresstheir concerns. The collaboration process and outcomes mayhave been affected by these limitations.
4.2. Phase II: Web-based prototype
The lessons learned during Phase I of this researchprogram directed us toward a Web-based approach, whichwe present in this section. A set of key benefits introducedby a Web-based approach results from being able toleverage pre-existing online map services and, thus, focuson more advanced functions. Specifically, we observedthree benefits. First, online map services can reduce theburden of generating, managing, and maintaining geo-spatial information. Second, online map services offer arich set of interactive functions, obviating the need for theextra development costs of building all the functionalitiesfrom scratch, including those most basic. Furthermore,online map services can ease the burden on learning for the
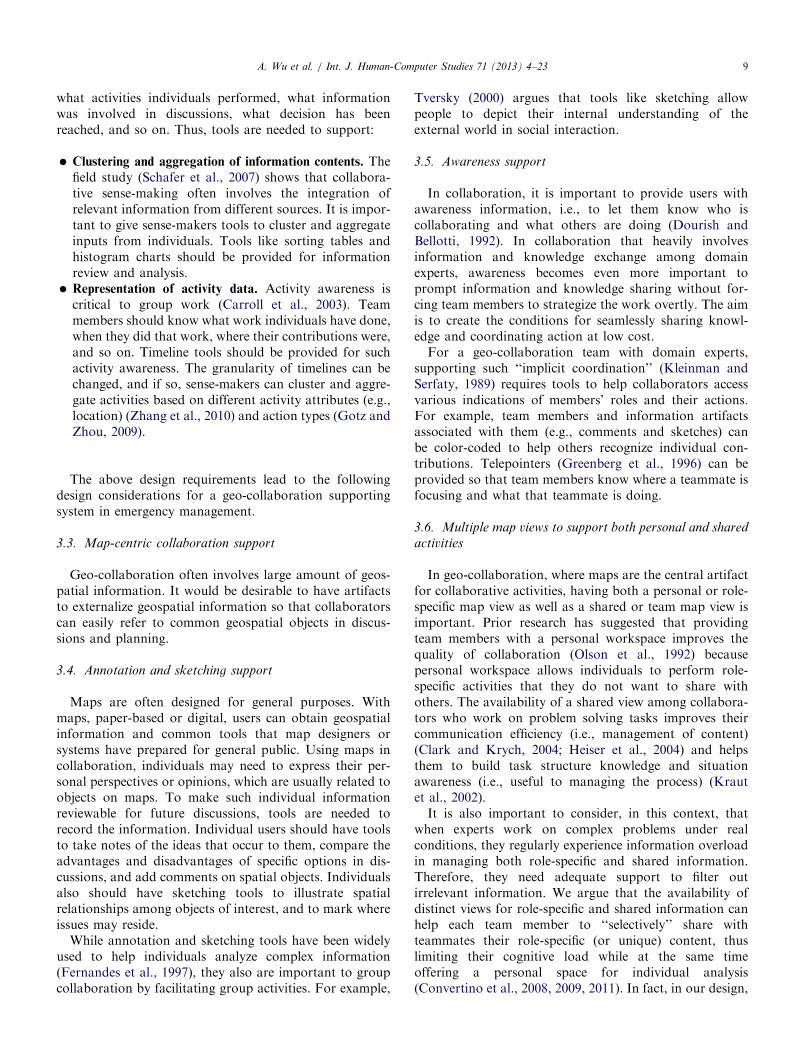
users, because even non-expert users nowadays are familiarwith popular online map services and their functions.Fig. 4 is the architecture of our Web-based system
prototype. The architecture follows a three-tier design.The top client tier has four modules to process interactiveuser actions, display visual results in appropriate visualiza-tion tools, manage role-specific data not shared withothers, and handle public data shared with other sense-makers. The application server tier below the client tierembeds modules to provide audio and video data, managedata storage, synchronize data across the team, andretrieve data from external sources, such as Google Mapsfor geo-spatial data. The storage layer at the bottom has aMySQL server to store user action and session data and afile server to store other data, such as recorded audio incollaboration.The client is a Web-based, rich Internet application
(RIA) developed with Adobe Flex. The synchronizationand audio/video modules in the application server are builton Adobe BlazeDS. Other server modules are developedwith Java running on a Tomcat Web server.This RIA-based approach goes beyond http-only inter-
active tools (e.g., hyperlink clicking) and delivers a com-prehensive graphic user interface (GUI), as seen in desktopapplications, to enrich the user experience. With RIAs, wecan build and maintain Web-based applications that canbe deployed consistently across platforms and, moreimportantly, that support advanced GUI functions, suchas drag and drop and free-form drawing. Currently, RIAsalso can be easily integrated with server-side products toprovide comprehensive collaboration and data services.The module of external data access in the application
tier serves two purposes. First, it manages the access to on-demand geo-spatial information. With this module, nomaps need to be stored, managed, and maintained locally.Second, the module manages the outsourcing of certaincomputational tasks to appropriate services. For example,when new objects are created on maps, their geographicalcoordinates must be calculated. Correct latitude and long-itude information is critical to the display of these objectson maps and the synchronization of these objects acrossthe team. To avoid any potential errors, our systemdelegated the calculation of latitude and longitude coordi-nates to an external map service. In the long run, whenmore cloud-computing-based services are available, thismodule can be extended to manage other services (e.g.,picture and video services that can provide images andvideos associated with concerned areas). In our implemen-tation, we chose Google Maps as our external map service,although other services such as Yahoo Maps or ArcGISalso can be used. We select the Google Maps servicebecause its tools are more comprehensive.Built on this architecture, the Web-based geo-collabora-
tive system also can help to reduce overhead in deployingand maintaining the overall system. The client can be runon a Web browser, as long as the browser is equipped withthe Adobe Flash player, which is free and available for
A. Wu et al. / Int. J. Human-Computer Studies 71 (2013) 4–2316
different platforms. The server requires Adobe BlazeDS ina Tomcat Web server and MySQL, both of which are freeand easier to install and maintain than CORK andGeoTools.
Of course, this Web-based approach also has its limita-tions. First, although we have embraced as many open-source products as possible (e.g., BlazeDS, Tomcat, andMySQL are either open-source or open to the generalpublic), some tools and services do not offer transparentcodes and may impose restrictions on the development,deployment, and use of Web-based applications. For exam-ple, the availability of the Google Maps service is critical tothis approach, and the interruption of its service can paralyzeour system. The recent outages of the Google Mail servicejust show the vulnerability of the dependence of onlineservices. One way to address this issue is to integrate andrely on multiple map services, rather than just one. Second,security and privacy risks may hinder the running of complexWeb-based applications. Strong security measures requiredto protect the data and user information on the server mayincrease the burdens of managing and maintaining thesystem. One way to deal with this challenge is to carefullyclassify the types of data (or layers of map data) involved andthen to limit the sensitive data to local services or encrypt it ifit must pass through the Internet.
Fig. 5. User interface of W
4.2.1. User interface of Web-based prototype
Fig. 5 shows the user interface of the Web-based systemprototype. The map service integrated to this user interfaceis Google Maps. The overall user interface is dominated bytwo maps—one personal (role-specific), the other shared(team). Below the two maps is a set of tools to supportcollaboration and decision-making, including a chattingtool, a table to sort all annotations, a chart to aggregateannotations, and a timeline to visualize individuals’ anno-tation activities. These tools to support decision-makingare new with respect to the Java-based prototype, while thecollaborative functions introduced with the earlier proto-type are still supported in the Web-based prototype.Users can interact with maps in the exactly same way as
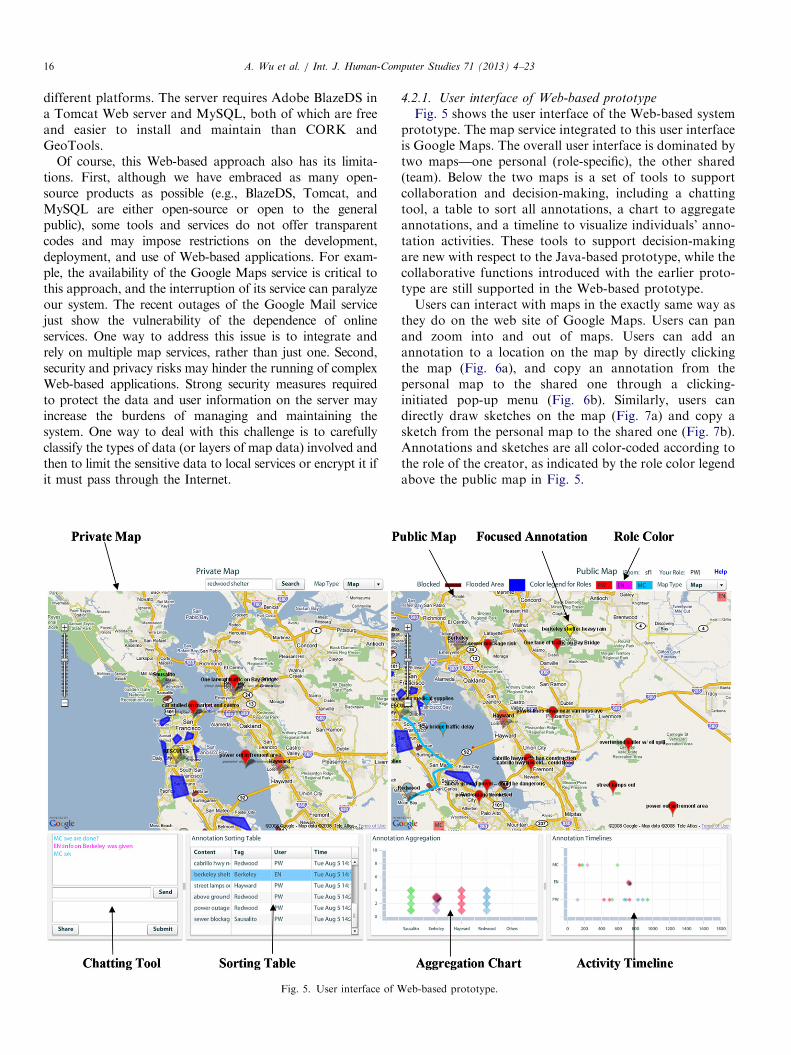
they do on the web site of Google Maps. Users can panand zoom into and out of maps. Users can add anannotation to a location on the map by directly clickingthe map (Fig. 6a), and copy an annotation from thepersonal map to the shared one through a clicking-initiated pop-up menu (Fig. 6b). Similarly, users candirectly draw sketches on the map (Fig. 7a) and copy asketch from the personal map to the shared one (Fig. 7b).Annotations and sketches are all color-coded according tothe role of the creator, as indicated by the role color legendabove the public map in Fig. 5.
eb-based prototype.
Fig. 6. Annotation activities on map. (a) Adding an annotation and (b) copying an annotation.
A. Wu et al. / Int. J. Human-Computer Studies 71 (2013) 4–23 17
To help information analysis, and thus sense-making,our design also coordinates the representations of informa-tion artifacts across different tools. For example, Fig. 5shows the view of a user who was examining the secondannotation item from the table. As the item was clickedand its background turned blue, its corresponding repre-sentations in the aggregation chart (the top dot on thesecond column from the left) were also highlighted alongwith it in the timeline (the single dot in the middle line),and in the public map (the focused annotation as indi-cated). Seeing these different symbols of the same object in
different visualization tools, the user can examine the samepiece of information from different perspectives and withindifferent contexts. Such coordinated design also helps tounite data-exploration activities and data-representationactivities across maps, the sorting table, the aggregationchart, and the timeline.
4.2.2. Evaluation of Web-based prototype
Again, we evaluated the Web-based prototype withfieldwork and lab study. The goal of the fieldwork wasto use a focus-group interview to validate the Web-design
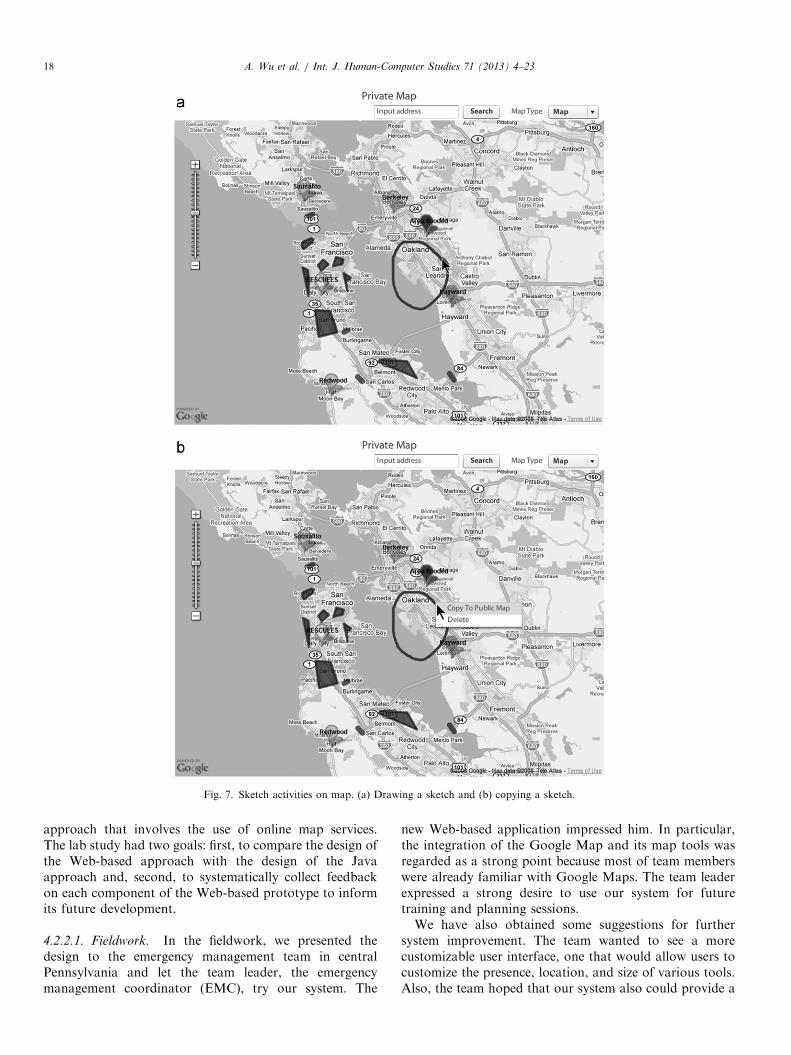
Fig. 7. Sketch activities on map. (a) Drawing a sketch and (b) copying a sketch.
A. Wu et al. / Int. J. Human-Computer Studies 71 (2013) 4–2318
approach that involves the use of online map services.The lab study had two goals: first, to compare the design ofthe Web-based approach with the design of the Javaapproach and, second, to systematically collect feedbackon each component of the Web-based prototype to informits future development.
4.2.2.1. Fieldwork. In the fieldwork, we presented thedesign to the emergency management team in centralPennsylvania and let the team leader, the emergencymanagement coordinator (EMC), try our system. The
new Web-based application impressed him. In particular,the integration of the Google Map and its map tools wasregarded as a strong point because most of team memberswere already familiar with Google Maps. The team leaderexpressed a strong desire to use our system for futuretraining and planning sessions.We have also obtained some suggestions for further
system improvement. The team wanted to see a morecustomizable user interface, one that would allow users tocustomize the presence, location, and size of various tools.Also, the team hoped that our system also could provide a
A. Wu et al. / Int. J. Human-Computer Studies 71 (2013) 4–23 19
new set of tools that would support cross-scale collabora-tive decision-making among teams from different counties,regions, and states.
One unexpected new user task was raised by the EMCwhen he explored our Web system. After using the toolsprovided our Web system, he realized that the system alsowould support cross-county collaboration and coordina-tion activities in emergency management if appropriatetools could be added. Such cross-county activities hadnever been observed by us in table-top exercises, ormentioned by the emergency management team in anymeetings. Table-top exercises were largely about within-county planning, which is centered on the tasks of localteams building action plans. In comparison, cross-countyemergency management, as we learned from the EMC inthis study, is more centered on the activities of sharingresource among counties through a hierarchy of authority,and also involves the state government. The two situationsinvolve different tasks, different resources, and differentgeographical scopes.
The EMC and his team are responsible for emergencyevents in their own county as well as in neighboring counties.Inspired by our Web system, in particular the embeddedonline maps that allow the easy exploration of broadgeographic locations and the browser-based tools that arevery accessible, the EMC thought our Web system may offergood opportunities to combine both emergency tasks withinthe county and ones involving multiple counties.
4.2.2.2. Lab evaluation. In the lab study, we focused moreon collecting user feedback about the design of the Web-based application, rather than analyzing group processes.This is because the Web-based application provides a set ofgeo-collaborative tools that is very similar to those in theJava application. First, we assessed whether or not the newprototype performed as well as the prior Java-based proto-type in terms of usability (using the same participant pooland questionnaire). Second, we collected systematic feedbackon the components of the prototype in order to evaluate thecurrent design and inform future development.
4.2.2.2.1. Participants, procedure, and apparatus. Werecruited twelve students who had participated in the studyof the Java prototype for this lab study. The task andprocedure in this lab study were the same as those seen inthe software environment (SW) in the study of the Java
Table 1
Comparison of ratings between Java-based system (N¼60) an
quartile range).
Java-based
MED
Overall evaluation (items 1–19) 5
System use (items 1–8) 6
Information quality (items 9–15) 5
Interface quality (items 16–18) 5
prototype, except that each team only needed to completetwo task scenarios rather than three. We used the samepost-test questionnaire for system evaluation, the Compu-ter System Usability test (CSU, Lewis, 1995). The usabilityquestionnaire was extended with a set of open-endedquestions, two of which pertained to the overall prototypewhile several other questions focused on each tool orcomponent.
4.2.2.2.2. Usability evaluation ratings: Overall assess-
ment. The average ratings (medians) of the overallWeb-based prototype were positive. Similar to the evalua-tion results about the Java-based prototype, the mediansof the ratings for the Web-based prototype were above theneutral value (4) of the scale—5 for system use quality, 5for information quality, and 5 for interface quality.Table 1 compares the evaluation results of the Web-
based system with the results of the prior Java-basedversion. It is a consistent finding across the evaluationsof both Java-based and Web-based systems thatthe participant ratings were positive about the overalldesign. We observed a slight increment in the ratings ofquality of the interface for the Web-based tool (Median¼5inter-quartile range¼1.2 vs. Median¼5 inter-quartilerange¼3). The ratings related to system usage were slightlylower for the web-based tool than for the prior Java-basedversion (Median¼5 inter-quartile range¼2 vs. Median¼6inter-quartile range¼1). This is probably due to the factthat the participants of the Web-based study were alreadyfamiliar with the general idea of the system because of theirparticipation in the prior study of the Java-based system.Thus, their experience with the Web-based system may notbe as fresh as that with the Java-based system.
4.2.2.2.3. Qualitative evaluation of the design and its
components. In addition to the quantitative usabilityratings, the participants also provided open-ended feed-back on the design and its components. They listed the topthree positive and top three negative issues with the currentdesign of the prototype. Then, they evaluated the useful-ness and ease of use for each component: the chat tool, thepersonal (role-specific) map, the shared (team) map, theannotations sorting table, and the two visualizations(annotation aggregation and timeline). These questionswere aimed at evaluating our design decisions. Participantscould indicate what the valuable functions were, if any,and what aspects need to be improved or changed.
d Web-based system (N¼12) (MED: median, IQR: inter-
Web-based
IQR MED IQR
2 (6–4) 5 2 (6–4)
1 (6–5) 5 2 (6–4)
3 (6–3) 5 2 (6–4)
3 (6–3) 5 1.2 (6–4.8)
A. Wu et al. / Int. J. Human-Computer Studies 71 (2013) 4–2320
Not surprisingly, the chat tool and the public map wereseen as the most central tools for supporting theknowledge-sharing process. The chat tool was seen asuseful for discussion and clarification, comparing andanalyzing, and getting a response quickly (although tosome users the chat box appeared too small). The publicmap was seen as the main means for sharing informationvia the map functions of annotations or sketching; thepersonal (role-specific) map was seen as useful for pre-liminary or individual work. Regarding the maps, someusers pointed to the issues of clutter, low readability, anddifficult retrieval of annotations once numerous notes hadbeen added to specific areas of the map. More advancedvisualization techniques, such as text annotation clusteringand aggregation, are needed to simplify the visualizationand management of cluttered information.
Among the tools aimed at supporting the decision-making process (annotation table and the two visualiza-tions), the participants considered the annotation aggrega-tion chart as the most useful and easy to use. This toolallowed them to easily compare decision choices analyzedby the team while at the same time having an overview ofall discussion results.
Subjects also raised some issues on the Web-based design.First, while the online maps offered more flexibility andfreedom in information exploration and integration, subjectssuggested that the current coordination mechanism amongpublic maps be improved. Participant indicated that syn-chronizing the type (e.g., road map, satellite map, etc.), thelocation, and the scale of the public map among all teammembers led to competition over the control of the publicmap. For example, when one team member was manipulat-ing the public map, others may interrupt his or her work.A better mechanism of public map synchronization, such asprotocols on handling shared global views among multipleusers (Morris et al., 2004), is needed. Second, the easiness ofadding tags or text annotations led to a new need for effectivetag management. Subjects indicated that with many tags, itbecame important to have advanced tools (e.g., data-miningtools) to group and aggregate tags so that when map isshrunk, tags will not clutter the view.
5. Discussion
This paper has described an iterative design researchinvestigation of collaborative support for geo-spatial plan-ning. Through the analysis of our two prototypes, we havemade progress in mapping and managing a tradeoff spaceof requirements for effective geo-collaboration, specificallyfor operations planning tasks.
Our interest here is in augmenting collaborative sense-making by using visualization tools to externalize artifactsthat are important to both individual and group activities.The system design includes multiple personal (role-specific)maps that are coordinated with a shared (team) map. Eachuser is presented with a personal map view and a sharedmap view. This reminds the users that they have a specific
role to play in the collaborative activity and a specific setof responsibilities to their teammates. This multiple-view,role-based design helps them keep track of the informationthey have, and compare what they know with what theirpartners have presented in the shared map. These aresignificant affordances in the geo-spatial planning task thatare not typical in a paper-based, face-to-face version of thetask (i.e., the real world). Our evaluation indicates poten-tial benefits of our system in support of the sense-makingprocesses of distributed geo-collaboration.This research also helps us develop a set of design
guidelines for geo-collaboration supporting systems:
�
Provide both personal (role-specific) and shared (team)maps and support information transfer between them.In collaboration, people often need personal workspaceto examine information and explore options privatelybefore sharing them with their team. People also needto share information with others through public space.In geo-collaboration, maps are what people largelyfocus on, so both personal and shared maps are critical. � Provide tools that allow users to add personalcomments and drawings that overlay on maps. In geo-collaboration, comments and drawings are oftenassociated with specific geographic locations. Mappingthese user-created artifacts directly onto objects onmaps can improve the understanding, retrieval, andsharing of these comments and drawings.
� Provide tools for information sorting (e.g., tables) andaggregation (e.g., bar charts and timelines). In particular,when decision-making involves heavy information sense-making activities, these tools should not only allow usersto manipulate and examine information in various ways,but also show the interconnections of data points fromdifferent data dimensions through coordinated views.
� Leverage online maps to reduce the burden on technol-ogy management and learning. Maps are the centralartifacts in geo-collaboration, so providing maps withwhich people are familiar could help to reduce overheadin accessing, manipulating, and sharing geospatialinformation. Of course, reliance on a particular mapsystem may face the risk of system interruption, asmentioned previously. Therefore, consideration shouldbe given to designs that integrate multiple maps servicesand formats (e.g., Google Maps, Yahoo Maps). ThisWeb-based approach offers users opportunities to col-laborate from diverse devices and platforms.
We also are aware of the limitations of this research.First, our systems focus on one specific geo-collaborationtask. Although the task is well grounded in empiricalevidence, geo-collaboration activities can be very diverse,ranging from a small-scale evacuation due to flooding in alocal community to a large-scale hurricane relief in aregion. Different geo-collaboration purposes demand dif-ferent tools (Cai, 2005), and our current design may have
A. Wu et al. / Int. J. Human-Computer Studies 71 (2013) 4–23 21
difficulty in supporting geo-collaboration activities withdifferent natures. Second, our visualization tools are stilllimited. Tools like aggregation bar charts, sorting tables,and timelines may be good enough for the current task, butcould be insufficient for other broader and more compli-cated geo-collaboration tasks. For example, people mayneed other advanced tools to analyze multi-dimensionaldata when browsing U.S. census data about a regionrequiring evacuation, to integrate 3-D models with mapswhen searching for a building in a metropolitan city, or towatch real-time photos or videos when monitoring fast-changing situations. Our current design could not help insuch tasks. Furthermore, our focus here is on high-leveldesigns concerning system architecture and visualizationmodules, and issues concerning tool-using behaviors, suchas managing cluttered annotations and sketches on maps,have not been investigated.
6. Conclusion
The contribution of the work reported in this paper lies inthe design research on a new collaborative system for teamsdoing complex geo-spatial planning tasks. Our design of amulti-view, role-based system has the potential to improveand extend collaborative tasks in emergency management.We will continue working with emergency managementprofessionals to expand the task scope and task scenariosour system can address. Also, we will improve our design byimplementing more tools so that users can choose what theyneed and customize the collection and layout of visualizationtools in their user interface. We hope the availability of moretools and user interface customization can broaden theapplication scope of our system. Furthermore, we will deployour system to emergency manage teams so that we canconduct longitudinal studies on user behaviors by collectingdata on the use of the system.
Acknowledgments
This work was funded partially by the U.S. Office ofNaval research under award N000140510549 and by theNational Science Foundation under Grant no. 0948601.
Appendix. System evaluation questionnaire
System use quality (1 strongly disagree, 4 neutral, 7 strongly
agree)
1. Overall I am satisfied with how easy it is to use thissystem.
2. It was simple to use this system. 3. I can effectively complete my work using this system. 4. I am able to complete my work quickly using this system. 5. I am able to efficiently complete my work using thissystem. 6. I feel comfortable using this system.7. It was easy to learn to use this system.
8. I believe I became productive quickly using this system.Information quality (1 strongly disagree, 4 neutral, 7
strongly agree)
9. The system gives error messages that clearly tell mehow to fix problems.
10. Whenever I make a mistake using the system, Irecover easily and quickly. 11. The information (such as online help, on-screenmessages, and other documentation) provided with thissystem is clear. 12. It is easy to find the information I needed. 13. The information provided for the system is easy tounderstand. 14. The information is effective in helping me completethe tasks and scenarios. 15. The organization of information on the systemscreens is clear.Interface quality (1 strongly disagree, 4 neutral, 7 strongly
agree)
16. The interface of this system is pleasant.
17. I like using the interface of this system. 18. This system has all the functions and capabilitiesI expect it to have.Overall (1 strongly disagree, 4 neutral, 7 strongly agree)
19. Overall, I am satisfied with this system.Open-ended questions on usefulness and usability: overall
and by tool
A. List the most negative aspects: 1y; 2y; 3y;
B. List the most positive aspects: 1y; 2y; 3y; C. About the private map: what did you use it for? D. About the public map: what did you use it for? E. (n) About the chat tool: what did you use it for? F. (n) About the annotation sorting table: was it usefuland how? Was it easy to use? G. (n) About the annotation aggregation chart (barchart): Was it useful and how? Was it easy to use? H. (n) About the annotation timelines chart (rightmostchart): Was it useful and how? Was it easy to use?(n) Extra items used when evaluating the web-basedprototype.
References
Ackoff, R.L., 1989. From data to wisdom. Journal of Applied Systems
Analysis 16 (1), 3–9.
Agresti, A., 2002. Categorical Data Analysis. John Wiley & Sons, NJ.
Andrienko, N., Andrienko, G., 2006. The complexity challenge to
creating useful and usable geovisualization tools. In: Proceedings of
GIScience 2006, 23–27, Munster, Germany.
Armstrong, M.P., Densham, P., 1995. Cartographic support for colla-
borative spatial decision-making. In: Proceedings of AUTOCARTO,
49–58.
A. Wu et al. / Int. J. Human-Computer Studies 71 (2013) 4–2322
Baldonado, M.Q.W., Woodruff, A., Kuchinsky, A., 2000. Guidelines for
using multiple views in information visualization. In: Proceedings of
the Working Conference on Advanced Visual Interfaces, 110–119.
Beenen, G., Ling, K., Wang, X., Chang, K., Frankowski, D., Resnick, P.,
Kraut, R.E., 2004. Using social psychology to motivate contributions
to online communities. In: Proceedings of the 2004 ACM Conference
on Computer Supported Cooperative Work, pp. 212–221.
Bier, E.A., Card, S.K., Bodnar, J.W., 2008. Entity-based collaboration
tools for intelligence analysis. In: Proceedings of the IEEE Symposium
on Visual Analytics Science and Technology, pp. 99–106.
Bodnar, J.W., 2005. Making sense of massive data by hypothesis testing.
Proceedings of 2005 International Conference on Intelligence Analy-
sis. Last retrieved on March 13, 2010, from /http://cryptome.org/
intel-2005.htmS.
Brodlie, K., 2005. Models of collaborative visualization. In: Dykes, J.,
MacEachren, A., Kraak, M. (Eds.), Exploring Geovisualization.
Elsevier, Amsterdam, pp. 463–475.
Brodlie, K., Fairbairn, D., Kemp, Z., Schroeder, M., 2005. Connecting
people, data, resources: distributed geovisualization. In: Dykes, J.,
MacEachren, A., Kraak, M. (Eds.), Exploring Geovisualization.
Elsevier, Amsterdam, pp. 425–444.
Cai, G., 2005. Extending distributed GIS to support geo-collaborative
crisis management. Geographic Information Science 11 (1), 4.
Card, S.K., Mackinlay, J.D., Shneiderman, B., 1999. Readings in
Information Visualization: Using Vision to Think. Morgan Kaufmann
Publishers, Inc, San Francisco, CA, USA.
Carroll, J.M., Neale, D.C., Isenhour, P.L., Rosson, M.B., McCrickard,
D.S., 2003. Notification and awareness: synchronizing task-oriented
collaborative activity. International Journal of Human–Computer
Studies 58 (5), 605–632.
Carroll, J.M., Rosson, M.B., Convertino, G., Ganoe, C.H., 2006.
Awareness and teamwork in computer-supported collaborations.
Interacting with Computers 18 (1), 21–46.
Carroll, J.M., Mentis, M., Convertino, G., Rosson, M.B., Ganoe, C.,
Sinha, H., Zhao, D., 2007. Prototyping collaborative geospatial
emergency planning. Proceedings of ISCRAM 2007, 105–113.
Clark, H.H., Brennan, B.E., 1991. Grounding in communication. In:
Resnick, L.B., Levine, J., Teasley, S.D. (Eds.), Perspectives on Socially
Shared Cognition. American Psychological Association, Washington.
Clark, H.H., Krych, M.A., 2004. Speaking while monitoring addressees
for understanding. Journal of Memory and Language 50 (1), 62–81.
Convertino, G., Ganoe, C., Schafer, W., Yost, B., Carroll, J.M., 2005. A
multiple view approach to support common ground in distributed and
synchronous geo-collaboration. In: Proceedings of the 3rd Interna-
tional Conference on Coordinated and Multiple Views in Exploratory
Visualization, 121–132.
Convertino, G., Mentis, H.M., Rosson, M.B., Carroll, J.M., Slavkovic,
A., Ganoe, C.H., 2008. Articulating common ground in cooperative
work: content and process. Proceedings of the ACM Conference on
Human Factors in Computing Systems 2008, 1637–1646.
Convertino, G., Billman, D., Shrager, J., Pirolli, P., Massar, J.P., 2008.
The CACHE study: group effects in computer-supported collaborative
analysis. Computer-Supported Cooperative Work 17 (4), 353–393.
Convertino, G., Mentis, H.M., Rosson, M., Slavkovic, A., Carroll, J.M.,
2009. Supporting content and process common ground in computer-
supported teamwork. Proceedings of the ACM Conference on Human
Factors in Computing Systems 2009, 2339–2348.
Convertino, G., Carroll, J.M., 2011. Toward experimental methods in
collaborative computing research. In: Sharlene, J., Hesse-Biber, N.
(Eds.), The Handbook of Emergent Technologies in Social Research.
Oxford University Press.
Convertino, G., Mentis, H.M., Slavkovic, A., Rosson, M.B., Carroll,
J.M., 2011. Supporting common ground in teamwork: a design
research process. in the special issue on social media and collaborative
systems for crisis management. ACM Transaction of Computer–
Human Interaction (TOCHI) 18 (4) Article 22.
Curry, K., 1999. Supporting collaborative awareness in tele-immersion.
In: Proceedings of the IPTW ‘99.
DiBiase, D., 1990. Scientific visualization in the earth sciences. Bulletin of
the College of Earth and Mineral Sciences 59 (2), 13–18.
DiMicco, J.M., Hollenback, K.J., Neale, D.C., Isenhour, P.L., Carroll,
J.M., Rosson, M.B., 2003. The impact of increased awareness while
face-to-face. Human–Computer Interaction 22, 47–96.
Dourish, P., Bellotti, V., 1992. Awareness and coordination in shared
workspaces. In: Proceedings of the ACM Conference on Computer-
Supported Cooperative Work 1992, 107–114.
Feibush, E., Gagvani, N., Williams, D., 2000. Visualization for situational
awareness. IEEE Computer Graphics and Applications 20 (5),
38–45.
Fernandes, J.P., Fonseca, A., Pereira, L., Faria, A., Figueira, H.,
Henriques, I., Garc- ~ao, R., Camara, A., 1997. Visualization and
interaction tools for aerial photograph mosaics. Computers &
Geoscience 23 (4), 465–474.
Fuhrmann, S., Pike, W., 2005. User-centred design of collaborative
geovisualization tools. In: Dykes, J., MacEachren, A., Kraak, M.
(Eds.), Exploring Geovisualization. Elsevier, Amsterdam, pp.
553–576.
Gotz, D., Zhou, M., 2009. Characterizing users’ visual analytic activity
for insight provenance. Information Visualization 8 (1), 42–55.
Greenberg, S., Boyle, M., Laberge, J., 1999. PDAs and shared public
displays: making personal information public, and public information
personal. Personal Technologies 3 (1), 54–64.
Greenberg, S., Gutwin, C., Roseman, M., 1996. Semantic telepointers for
groupware. Proceedings of the Australian Conference on Computer–
Human interaction 1996, 54–61.
Heiser, J., Tversky, B., Silverman, M., 2004. Sketches for and from
collaboration. In: Gero, J.S., Tversky, B., Knight, T. (Eds.), Visual
and Spatial Reasoning in Design III. Key Centre for Design Research,
Sydney, pp. 69–78.
Herring, S.C., 1993. Gender and democracy in computer-mediated
communication. Electronic Journal of Communication 3, 1–17.
Isenhour, P.L., Rosson, M.B., Carroll, J.M., 2001. Supporting interactive
collaboration on the Web with CORK. Interacting with Computers 13
(6), 655–676.
Jankowski, P., Nyerges, T.L., 2001. GIS for Group Decision Making.
Taylor & Francis Publishers, UK.
Kemp, Z., 2005. A knowledge-based collaborative environment for
geovisualization: ontologies for multiple perspectives on distributed
data resources. In: Dykes, J., MacEachren, A., Kraak, M. (Eds.),
Exploring Geovisualization. Elsevier, Amsterdam, pp. 295–512.
Klein, G., Moon, B., Hoffman, R.R., 2006. Making sense of sense-
making 2: a macrocognitive model. IEEE Intelligent Systems 21 (5),
88–92.
Kleinman, D.L., Serfaty, D., 1989. Team performance assessment in
distributed decision making. In: Proceedings of the Interactive
Networked Simulation for Training Conference, 22–27.
Kraak, M.-J., 2006. Why maps matter in GIScience. Cartographic
Journal 43, 82–89.
Kraut, R.E., Gergle, D., Fussell, S.R., 2002. The use of visual information
in shared visual spaces: informing the development of virtual co-
presence. In: Proceedings of the ACM Conference on Computer-
Supported Cooperative Work 2002, 31–40.
Lewis, J.R., 1995. IBM computer usability satisfaction questionnaires:
psychometric evaluation and instructions for use. International Jour-
nal of Human-Computer Interaction 7 57-57.
Lucas, P., Roth, S.F., 1996. Exploring information with Visage.
Proceedings of Human Factors in Computing Systems 1996,
396–397.
MacEachren, A.M., 1995. How Maps Work: Representation, Visualiza-
tion, and Design. The Guilford Press, New York.
MacEachren, A.M., Kraak, M., 2001. Research challenges in geovisua-
lization. Cartography and Geographic Information Science 28 (1),
3–12.
MacEachren, A.M., Brewer, I., 2004. Developing a conceptual framework
for visually-enabled geocollaboration. International Journal of Geo-
graphical Information Science 18 (1), 1–34.
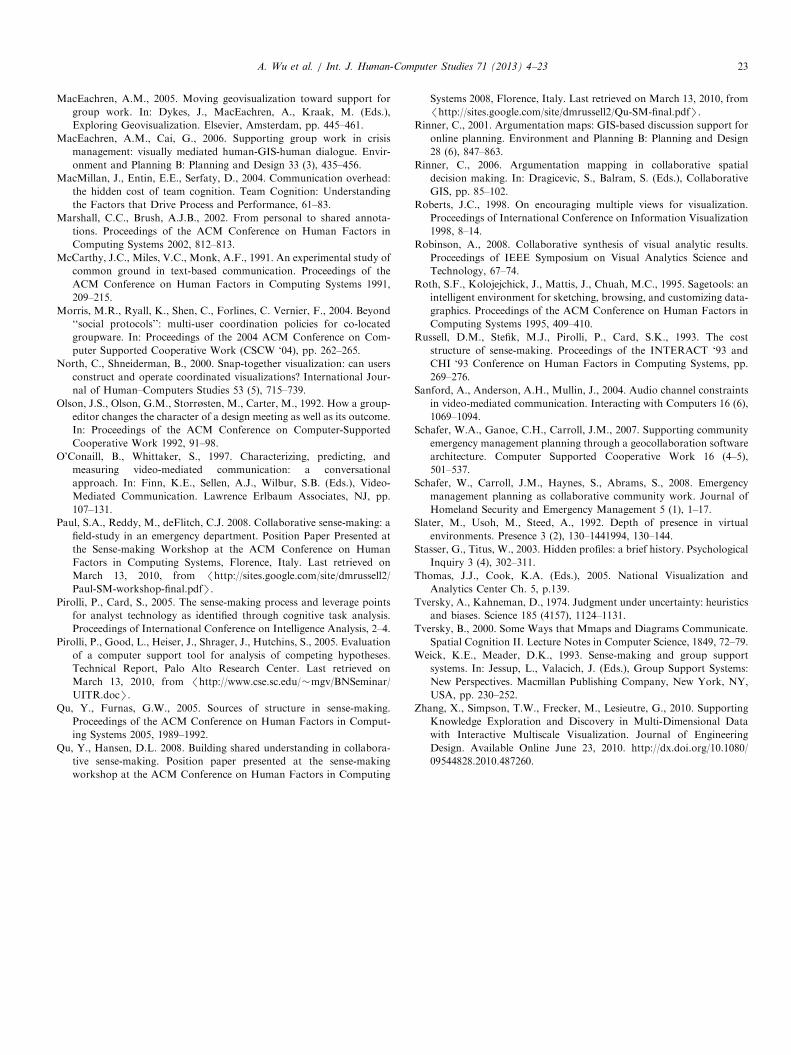
A. Wu et al. / Int. J. Human-Computer Studies 71 (2013) 4–23 23
MacEachren, A.M., 2005. Moving geovisualization toward support for
group work. In: Dykes, J., MacEachren, A., Kraak, M. (Eds.),
Exploring Geovisualization. Elsevier, Amsterdam, pp. 445–461.
MacEachren, A.M., Cai, G., 2006. Supporting group work in crisis
management: visually mediated human-GIS-human dialogue. Envir-
onment and Planning B: Planning and Design 33 (3), 435–456.
MacMillan, J., Entin, E.E., Serfaty, D., 2004. Communication overhead:
the hidden cost of team cognition. Team Cognition: Understanding
the Factors that Drive Process and Performance, 61–83.
Marshall, C.C., Brush, A.J.B., 2002. From personal to shared annota-
tions. Proceedings of the ACM Conference on Human Factors in
Computing Systems 2002, 812–813.
McCarthy, J.C., Miles, V.C., Monk, A.F., 1991. An experimental study of
common ground in text-based communication. Proceedings of the
ACM Conference on Human Factors in Computing Systems 1991,
209–215.
Morris, M.R., Ryall, K., Shen, C., Forlines, C. Vernier, F., 2004. Beyond
‘‘social protocols’’: multi-user coordination policies for co-located
groupware. In: Proceedings of the 2004 ACM Conference on Com-
puter Supported Cooperative Work (CSCW ‘04), pp. 262–265.
North, C., Shneiderman, B., 2000. Snap-together visualization: can users
construct and operate coordinated visualizations? International Jour-
nal of Human–Computers Studies 53 (5), 715–739.
Olson, J.S., Olson, G.M., Storrøsten, M., Carter, M., 1992. How a group-
editor changes the character of a design meeting as well as its outcome.
In: Proceedings of the ACM Conference on Computer-Supported
Cooperative Work 1992, 91–98.
O’Conaill, B., Whittaker, S., 1997. Characterizing, predicting, and
measuring video-mediated communication: a conversational
approach. In: Finn, K.E., Sellen, A.J., Wilbur, S.B. (Eds.), Video-
Mediated Communication. Lawrence Erlbaum Associates, NJ, pp.
107–131.
Paul, S.A., Reddy, M., deFlitch, C.J. 2008. Collaborative sense-making: a
field-study in an emergency department. Position Paper Presented at
the Sense-making Workshop at the ACM Conference on Human
Factors in Computing Systems, Florence, Italy. Last retrieved on
March 13, 2010, from /http://sites.google.com/site/dmrussell2/
Paul-SM-workshop-final.pdfS.
Pirolli, P., Card, S., 2005. The sense-making process and leverage points
for analyst technology as identified through cognitive task analysis.
Proceedings of International Conference on Intelligence Analysis, 2–4.
Pirolli, P., Good, L., Heiser, J., Shrager, J., Hutchins, S., 2005. Evaluation
of a computer support tool for analysis of competing hypotheses.
Technical Report, Palo Alto Research Center. Last retrieved on
March 13, 2010, from /http://www.cse.sc.edu/�mgv/BNSeminar/
UITR.docS.
Qu, Y., Furnas, G.W., 2005. Sources of structure in sense-making.
Proceedings of the ACM Conference on Human Factors in Comput-
ing Systems 2005, 1989–1992.
Qu, Y., Hansen, D.L. 2008. Building shared understanding in collabora-
tive sense-making. Position paper presented at the sense-making
workshop at the ACM Conference on Human Factors in Computing
Systems 2008, Florence, Italy. Last retrieved on March 13, 2010, from
/http://sites.google.com/site/dmrussell2/Qu-SM-final.pdfS.
Rinner, C., 2001. Argumentation maps: GIS-based discussion support for
online planning. Environment and Planning B: Planning and Design
28 (6), 847–863.
Rinner, C., 2006. Argumentation mapping in collaborative spatial
decision making. In: Dragicevic, S., Balram, S. (Eds.), Collaborative
GIS, pp. 85–102.
Roberts, J.C., 1998. On encouraging multiple views for visualization.
Proceedings of International Conference on Information Visualization
1998, 8–14.
Robinson, A., 2008. Collaborative synthesis of visual analytic results.
Proceedings of IEEE Symposium on Visual Analytics Science and
Technology, 67–74.
Roth, S.F., Kolojejchick, J., Mattis, J., Chuah, M.C., 1995. Sagetools: an
intelligent environment for sketching, browsing, and customizing data-
graphics. Proceedings of the ACM Conference on Human Factors in
Computing Systems 1995, 409–410.
Russell, D.M., Stefik, M.J., Pirolli, P., Card, S.K., 1993. The cost
structure of sense-making. Proceedings of the INTERACT ‘93 and
CHI ‘93 Conference on Human Factors in Computing Systems, pp.
269–276.
Sanford, A., Anderson, A.H., Mullin, J., 2004. Audio channel constraints
in video-mediated communication. Interacting with Computers 16 (6),
1069–1094.
Schafer, W.A., Ganoe, C.H., Carroll, J.M., 2007. Supporting community
emergency management planning through a geocollaboration software
architecture. Computer Supported Cooperative Work 16 (4–5),
501–537.
Schafer, W., Carroll, J.M., Haynes, S., Abrams, S., 2008. Emergency
management planning as collaborative community work. Journal of
Homeland Security and Emergency Management 5 (1), 1–17.
Slater, M., Usoh, M., Steed, A., 1992. Depth of presence in virtual
environments. Presence 3 (2), 130–1441994, 130–144.
Stasser, G., Titus, W., 2003. Hidden profiles: a brief history. Psychological
Inquiry 3 (4), 302–311.
Thomas, J.J., Cook, K.A. (Eds.), 2005. National Visualization and
Analytics Center Ch. 5, p.139.
Tversky, A., Kahneman, D., 1974. Judgment under uncertainty: heuristics
and biases. Science 185 (4157), 1124–1131.
Tversky, B., 2000. Some Ways that Mmaps and Diagrams Communicate.
Spatial Cognition II. Lecture Notes in Computer Science, 1849, 72–79.
Weick, K.E., Meader, D.K., 1993. Sense-making and group support
systems. In: Jessup, L., Valacich, J. (Eds.), Group Support Systems:
New Perspectives. Macmillan Publishing Company, New York, NY,
USA, pp. 230–252.
Zhang, X., Simpson, T.W., Frecker, M., Lesieutre, G., 2010. Supporting
Knowledge Exploration and Discovery in Multi-Dimensional Data
with Interactive Multiscale Visualization. Journal of Engineering
Design. Available Online June 23, 2010. http://dx.doi.org/10.1080/
09544828.2010.487260.


![Temporal Visualization of Boundary-based Geo-information ...Wright [KW04] and Thakur and Hanson [TH10] proposed other possible designs. An extensive review of space/time visualization](https://img.pdfslide.us/doc/110x75/60ac1c4dc4b7717ff621b28a/temporal-visualization-of-boundary-based-geo-information-wright-kw04-and-thakur.jpg)