Embed Size (px)
Citation preview

Supported by
Offer Construction for Generators with Offer Construction for Generators with Inter-temporal Constraints viaInter-temporal Constraints via
Markovian DP and Decision AnalysisMarkovian DP and Decision Analysis
Grant Read, Paul StewartGrant Read, Paul StewartRoss James and Deb ChattopadhyayRoss James and Deb Chattopadhyay

Presentation Outline
• Deregulated Electricity Market Offering Process
• Intertemporal Constraints
• Literature
• Two-Phase DP Algorithm Concept
• DA/DP Concept
• Conclusions
2

Electricity Markets
3
Quantity (MW)
Price
($/MWh)
Q* Q*’
P*
P*’
Demand Curve
Rest-of-Market Supply Curve
Total Supply Curve
offer
Player perspective
4
Quantity (MW)
Price
($/MWh)
Q*Q*’
P*
Generator offerResidual
Demand Curve
P*’
Generator marginal cost
Generator profit
Note, we are only optimising a single-player reaction to the assumed residual demand curve, not finding a multi-player equilibrium

Intertemporal Considerations
5
Market outcome expectations and correlations
Reactions of rival market participants
Linkages within a Company
• Water/Fuel storage limits
• Reservoir Balancing
• Inflow correlations
• Unit operational rules (ramping, startup/shutdown etc)
• We will focus on the impact of:
• Market price correlations
• For an energy limited (hydro or thermal) plant
Intuition
• Inter-temporal interactions make a difference• Some may be managed by adjusting the shape of the
(monotone) offer curve– Provided an increase in this period’s price always implies an
increase in desired output
• Others may have to be managed by dynamically moving the (vertical) offer curve– Eg if an increase in this period’s price may imply a decrease in
desired output, so as to save fuel/water for even higher prices implied for later
6

Optimal offer curves with correlation
• Optimal offer curves for various hours of the day– Derived by plotting price/quantity pairs– Assuming higher price now implies a higher price path for the
rest of the day
quantity
Price

Literature
8
Philpott, Zakeri, Pritchard, etc
•Optimal offers for a Market Distribution Function = (roughly) a set of possible residual demand curves
Rajaraman & Alvarado (2003). Optimal Bidding Strategy in Electricity Markets Under Uncertain Energy and Reserve Prices
• Two-Level Dynamic Program
• Lower Level: Determining the optimal offer for the given state
• Upper Level: Moving back through horizon, constructing a value curve (defined over reservoir level) for each previous market outcome.
•Two-Dimensional (Markov) Dynamic Program for upper level
• Reservoir Level, Previous Market Outcome
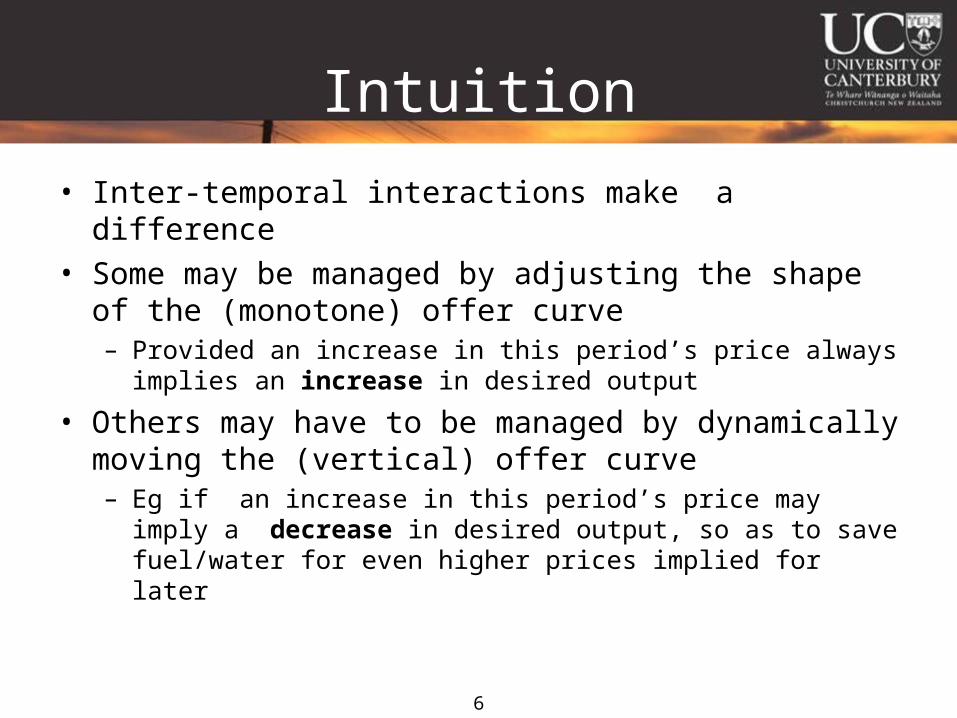
Upper Level Markov DP
9
T-2 T-1 T
1 1 1
222
0.6 0.4
0.70.3
1
1 2
2From
To
0.9 0.1
0.50.5
1
1 2
2From
To
Value
Value
Reservoir Level
Reservoir Level
Market States

Lower Level DP
10
Quantity (MW)
Price
($/MWh)
(Similar to Philpott et al, noting that there may be many possible residual demand curves corresponding to each “market state”)

Our Goals
Given that Alvarado et al have developed this basic approach, our goals are:– To improve its computational efficiency by efficiently
separating the upper/lower DP levels in a two-phase approach
– To extend it to cover more general uncertainty structures
– (To test our intuition with respect to optimal offer patterns)
11

Two-Phase DP Approach
12
• This offering process needs to be done once every half hour, and so it is important that the computational complexity of what needs to be done on the spot, in “real-time” is minimised.
• Two-Phase DP that we have developed recognises that the construction of the offers at a given market state is very repetitive and inefficient.
• Uses a concept we call marginal cost patching, to enable the production of all the offers to be brought out of real-time into a “Pre-Processing Phase”
• The “Real-Time Phase” that remains is highly efficient and can deal with highly detailed representations of a generator’s situation in a reasonable amount of time.
Two-Level DPPre-Processing Phase
(Lower-Level DP)Real-Time Phase (Upper Level DP)
+

Marginal Cost Patching
13
The optimal offer price at any particular quantity level depends only on the local marginal cost level. It is therefore independent of the marginal cost levels occurring at higher/lower quantities
So segments of the optimal offers for constant marginal costs can be patched together to provide the optimal offer for a marginal cost curve that is stepped
For example, the optimal offer for a firm with a marginal cost curve that steps from MC1 to MC2 at the quantity BP will be the combination of:
• The section of the offer from 0 to BP under the assumption that marginal cost is equal to MC1 over the entire range, and
• The section of the offer from BP to Qmax under the assumption that marginal cost is equal to MC2 over the entire range

Two-Phase DP Approach• The actual marginal cost structure (eg water value curve) is
unknown at the start of the analysis– It is determined internally by the DP, – So we can not pre-compute optimal offer curves
• But Marginal Cost Patching enables us to bring the lower level DP out of real time, by:– Producing a set of offers for a set of fixed MC levels in advance
• Then, in the real time DP, for each period and market state:
– We know the end-of period expected marginal water value curve (by backwards recursion); so
– We can quickly patching together segments of fixed-MC offers to produce an offer curve matching that marginal water value curve.

Pre-Processing Diagram
15
Quantity (MW)
Price
($/MWh)
Offer (MC=5)
Offer (MC=10)
Offer (MC=20)
Optimal offer curves for various assumed MC levels
Set of possible residual demand curves for this market state
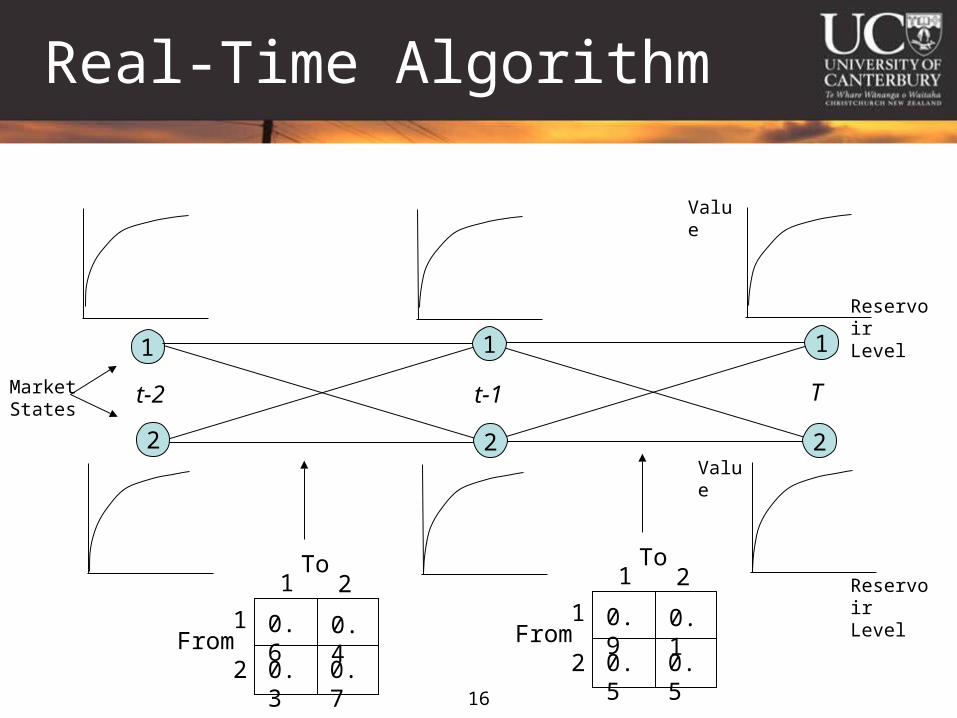
Real-Time Algorithm
16
t-2 t-1 T
1 1 1
222
0.6 0.4
0.70.3
1
1 2
2From
To
0.9 0.1
0.50.5
1
1 2
2From
To
Value
Value
Reservoir Level
Reservoir Level
Market States
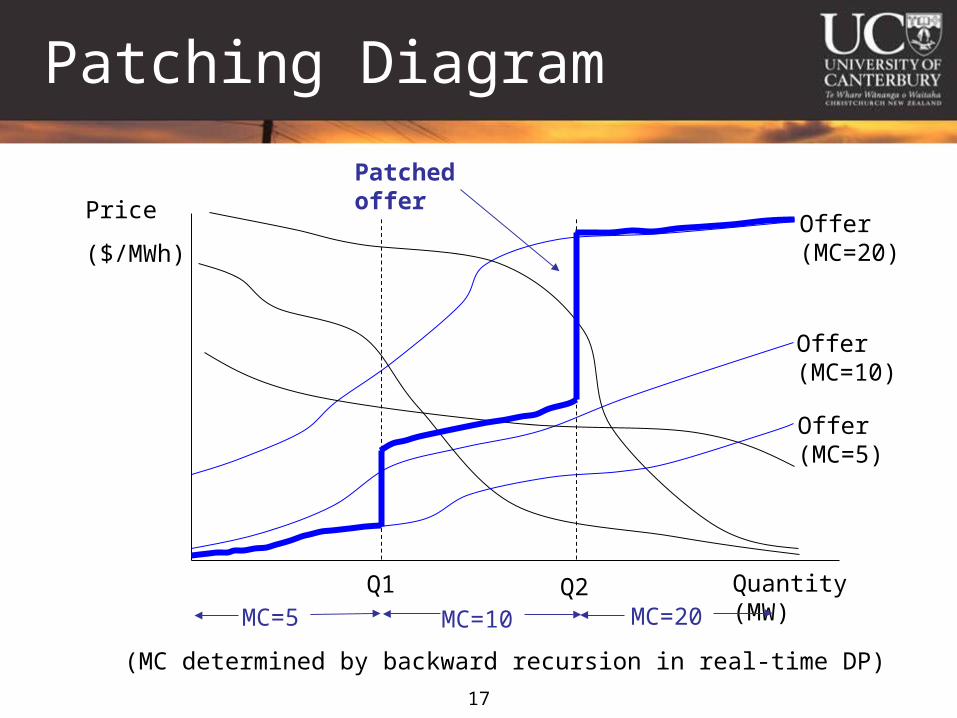
Patching Diagram
17
Offer (MC=10)
Offer (MC=20)
Patched offer
Quantity (MW)
Price
($/MWh)
Offer (MC=5)
Q1 Q2MC=5 MC=10 MC=20
(MC determined by backward recursion in real-time DP)

RT Phase – Finding Values
18
Quantity (MW)
Price
($/MWh)
(These price quantity pairs then provide a pdf for outcomes for the period in the real time DP recursion)

Results – Computation Time
19
• Results over 320 Test Instances covering a wide range of the problem domain. Largest problem considered:
• 40 Periods
• 300 Reservoir Levels
• 40 Dispatch Levels
• 100 Possible RD Curves per Period
• 110 Fixed MC Levels
Algorithm Mean Computational Time
R&A Two-Level
Our Pre-Processing Phase
Our Real-Time Phase
80,324 seconds (22.3 hours)
4578 seconds (1.3 hours)
99 seconds

Results – Solution Quality
20
Algorithm Mean Percentage Error
R&A Two-Level
Our Two-Phase Approach
5.0%
1.7%
These differences:
• Are defined in terms of deviation from (deterministic) optimality, as determined by ex post simulation on a dataset which contains some non-Markov correlations
• Arise from differences in the degree of approximation employed. The R&A algorithm could be made more accurate, but at even higher computational cost

Extension: DA/DP
• Not all uncertainty is well described by a Markov Chain• Often it will become clear at some point in time that a
new state of the world has arisen, and will remain for some time. For example:– A major breakdown– A change in weather– A different competitor strategy
• Our DA/DP approach models this structure using:– A DA “decision Tree” linking macro-states on a coarse time
scale– A set of Markov DPs optimising behaviour within each macro-
sate on a finer time scale

DA/DP Structure (example)
22
•
Aggressive, High-Price Offering Strategy Implemented (Macro-State 1)
Defensive, Low-Price Offering Strategy Implemented (Macro-State 2)
t=2 t=3 t=4 t=5 t=1 End of Horizon
Terminal Nodes

Results
• Despite added “complexity”, computational time actually reduces, for the same TOTAL number of micro-states– By about 25% in real time, and much more in pre-processing– because the number of possible state transitions etc reduces
• But the real issues are:– Does this structure exist in the real world?– How much do we gain by modelling it?
And this obviously depends on the “strength” of the structure
• For our test problem set, the gain was actually quite marginal (1.6% error >> 1.3% on average, or 6.9%>>5.6% worst case)
– Still, it is better… and significantly quicker

Conclusions
• MC patching can be used to create a TWO-PHASE DP• This separation greatly improves computational efficiency, so more
complex problems can be considered• Solution quality is also superior to the original R&A algorithm• Generalisation to the DA/DP structure can:
– Further reduce computation time; and– Further improve solution quality
…. Provided the real world actually exhibits this structure
• (Solutions exhibit the expected patterns with respect to offer curve dynamics)
• This methodology is quite workable for real-time application to a single reservoir/stockpile situation– Various extensions and variations are covered in the thesis
(See http://www.mang.canterbury.ac.nz/people/stewart.shtml )
• But a multi-reservoir model is the obvious next step