Embed Size (px)
Citation preview
Support Services ChampionsService Technology Spending and Adoption
Trends
John Ragsdale
VP, Technology Research
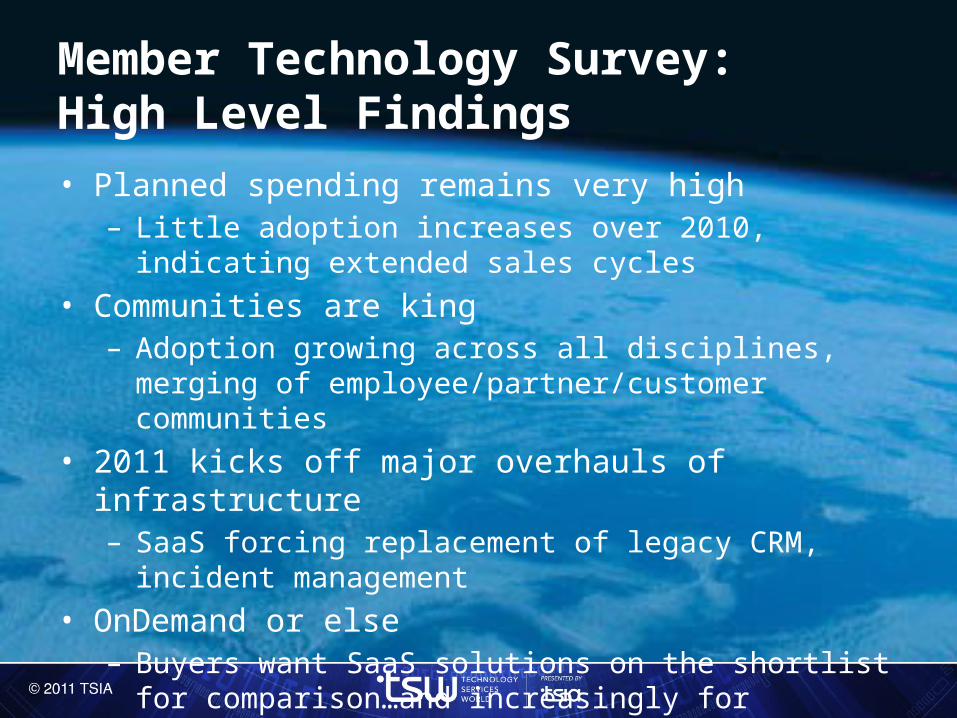
Member Technology Survey:High Level Findings
• Planned spending remains very high– Little adoption increases over 2010, indicating extended
sales cycles
• Communities are king– Adoption growing across all disciplines,
merging of employee/partner/customer communities
• 2011 kicks off major overhauls of infrastructure– SaaS forcing replacement of legacy CRM, incident
management
• OnDemand or else– Buyers want SaaS solutions on the shortlist for
comparison…and increasingly for purchase
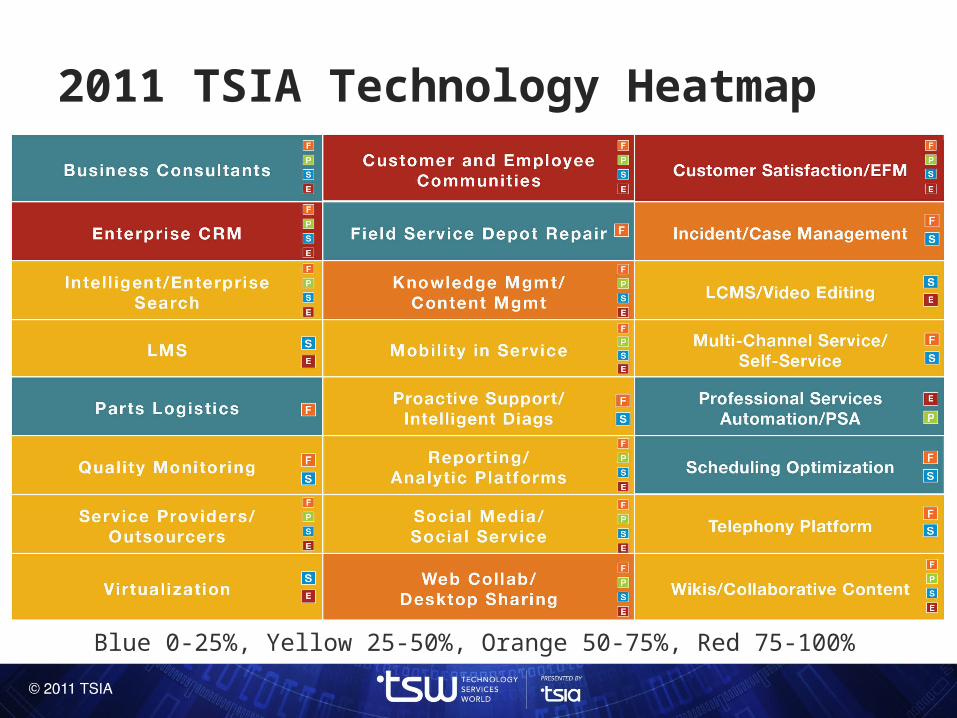
2011 TSIA Technology Heatmap
Blue 0-25%, Yellow 25-50%, Orange 50-75%, Red 75-100%
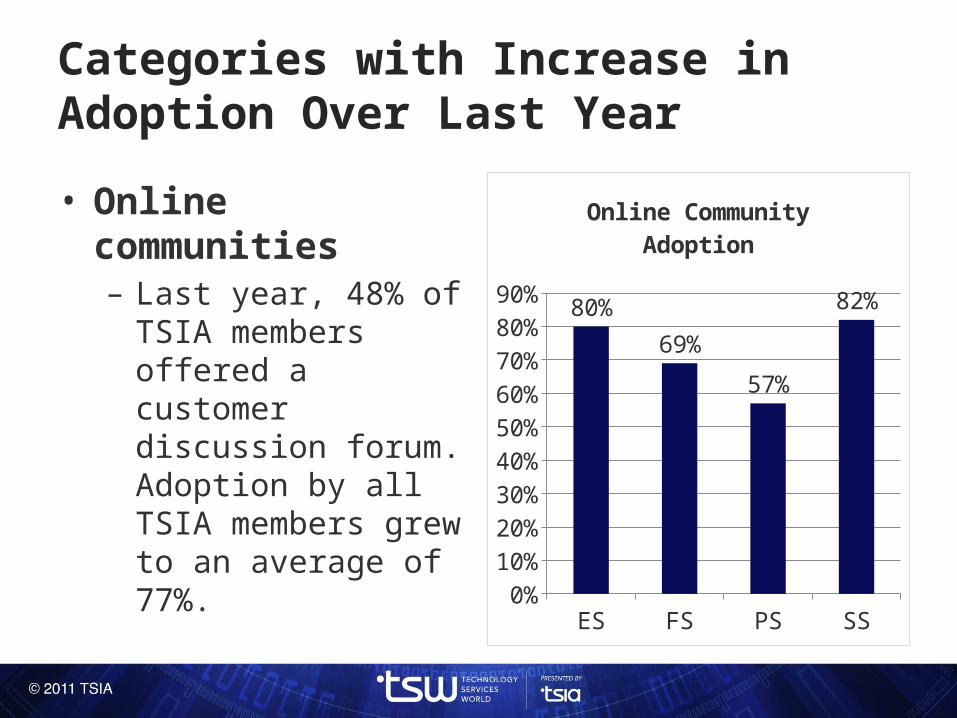
Categories with Increase in Adoption Over Last Year
• Online communities– Last year, 48% of TSIA
members offered a customer discussion forum. Adoption by all TSIA members grew to an average of 77%.
ES FS PS SS0%
10%
20%
30%
40%
50%
60%
70%
80%
90%80%
69%
57%
82%
Online Community Adoption
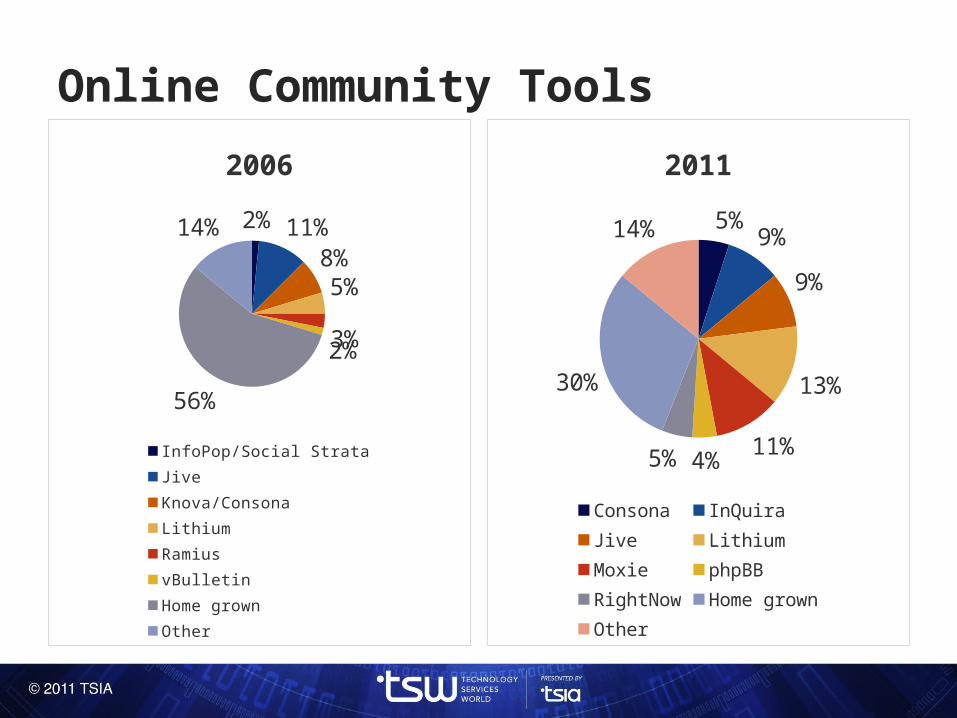
Online Community Tools
2%11%
8%
5%
3%2%
56%
14%
2006
InfoPop/Social Strata JiveKnova/Consona LithiumRamius vBulletinHome grown Other
5%9%
9%
13%
11%4%5%
30%
14%
2011
Consona InQuiraJive LithiumMoxie phpBBRightNow Home grownOther
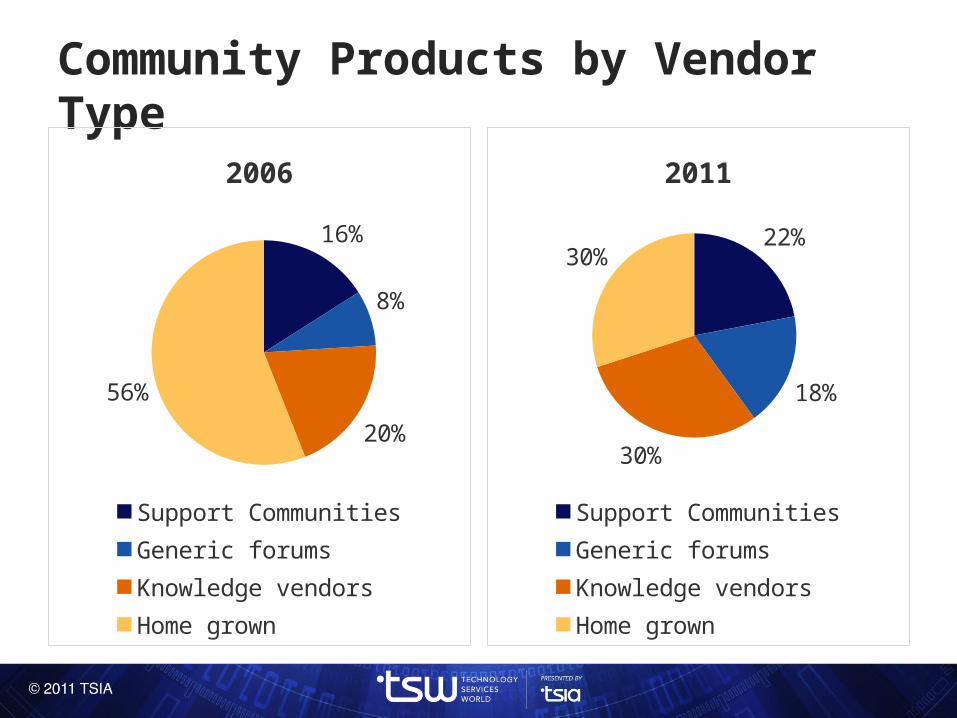
Community Products by Vendor Type
16%
8%
20%
56%
2006
Support CommunitiesGeneric forumsKnowledge vendorsHome grown
22%
18%
30%
30%
2011
Support CommunitiesGeneric forumsKnowledge vendorsHome grown
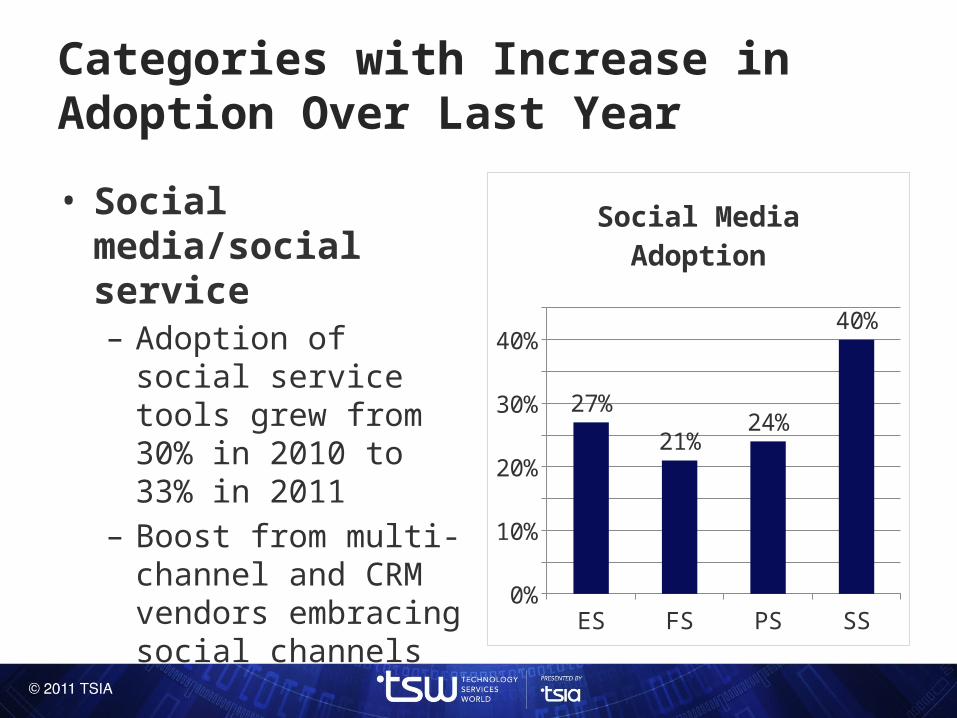
Categories with Increase in Adoption Over Last Year
• Social media/social service– Adoption of social
service tools grew from 30% in 2010 to 33% in 2011
– Boost from multi-channel and CRM vendors embracing social channels
ES FS PS SS0%
5%
10%
15%
20%
25%
30%
35%
40%
45%
27%
21%24%
40%
Social Media Adoption
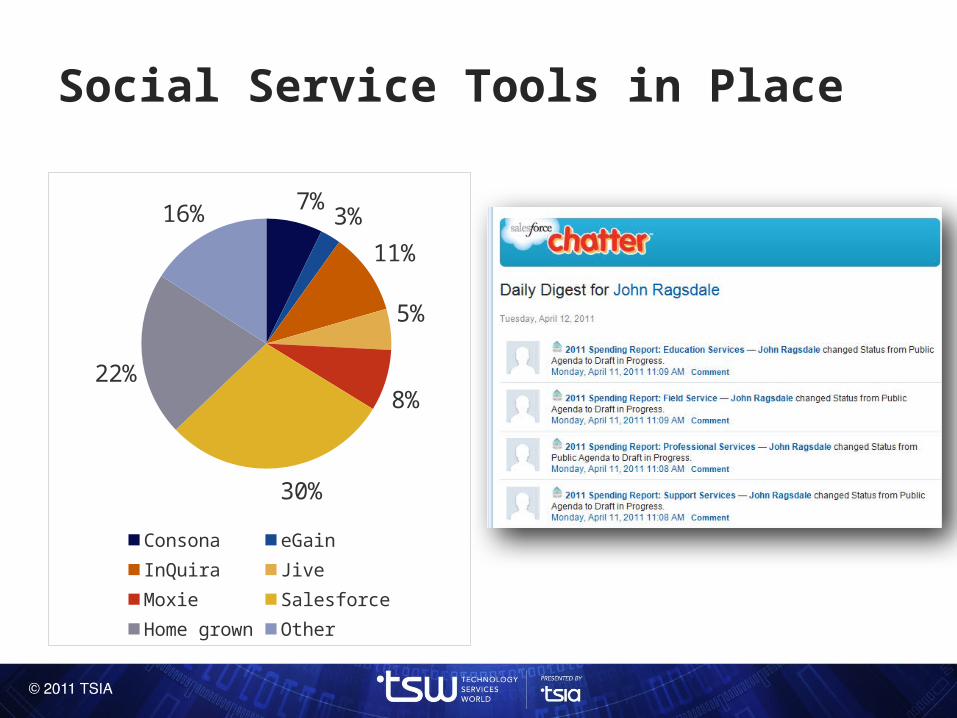
Social Service Tools in Place
7%3%
11%
5%
8%
30%
22%
16%
Consona eGainInQuira JiveMoxie SalesforceHome grown Other
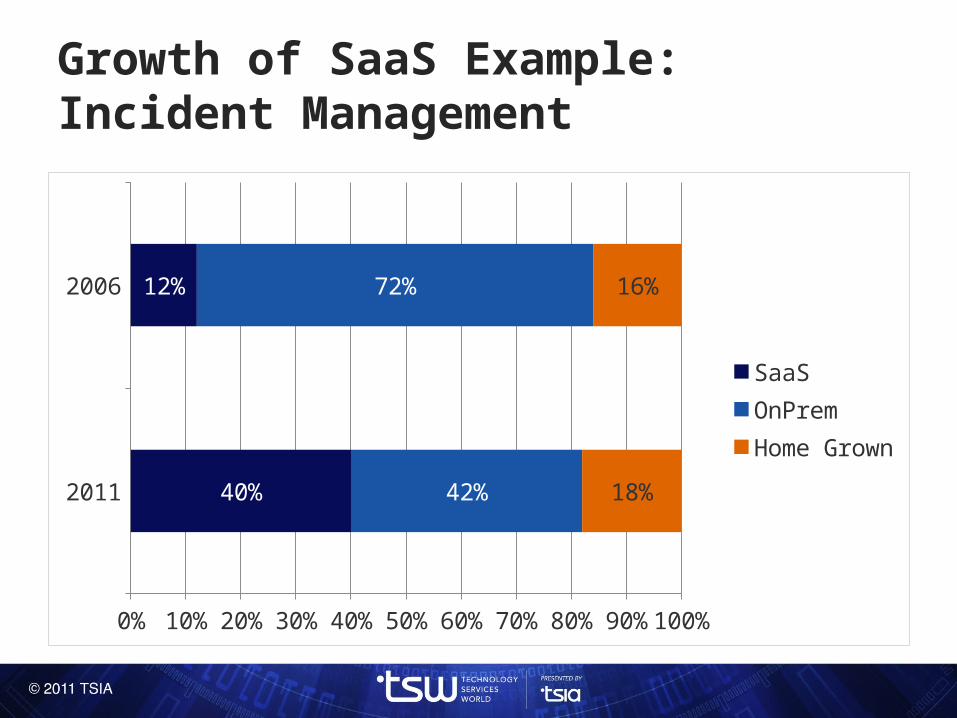
Growth of SaaS Example: Incident Management
2011
2006
0% 10% 20% 30% 40% 50% 60% 70% 80% 90%100%
40%
12%
42%
72%
18%
16%
SaaSOnPremHome Grown
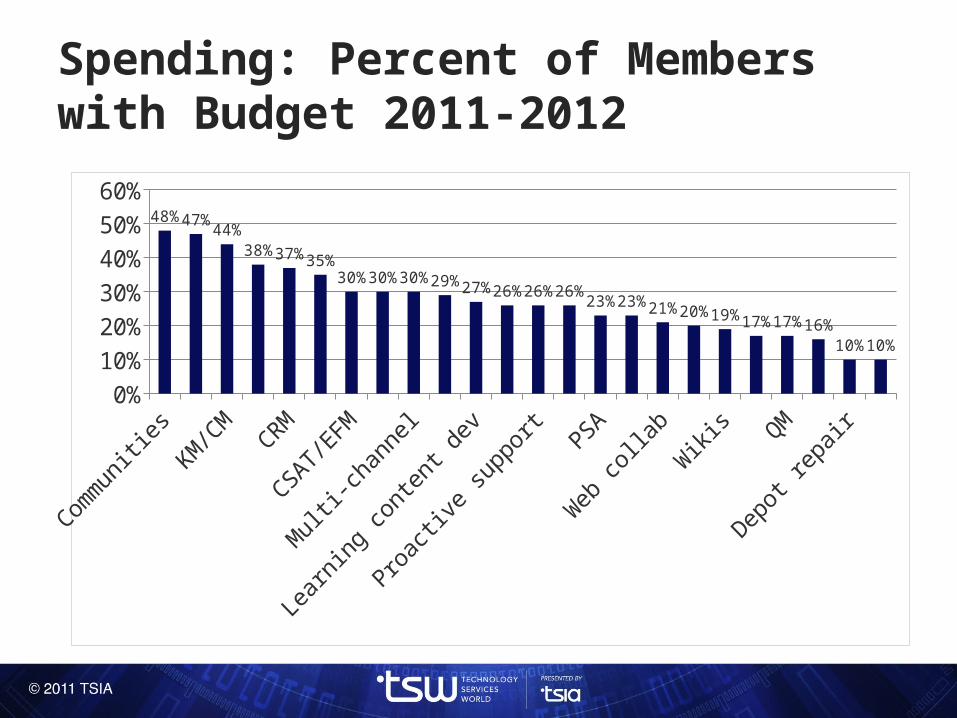
Spending: Percent of Members with Budget 2011-2012
0%
10%
20%
30%
40%
50%
60%48%47%
44%38%37%35%
30%30%30%29%27%26%26%26%23%23%21%20%19%17%17%16%
10%10%
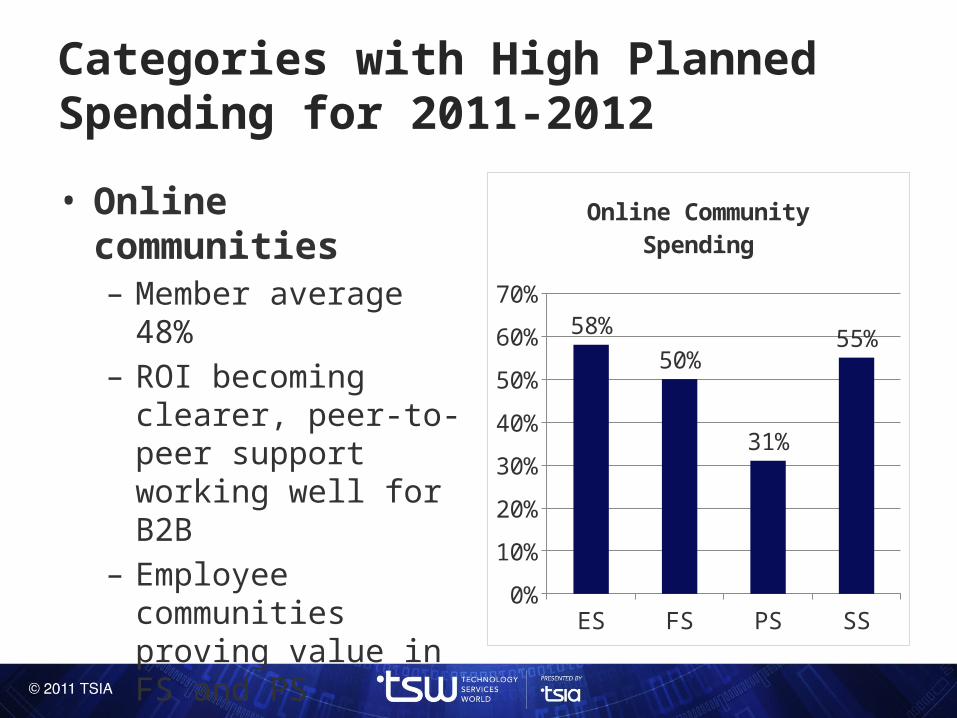
Categories with High Planned Spending for 2011-2012
• Online communities– Member average 48%– ROI becoming clearer,
peer-to-peer support working well for B2B
– Employee communities proving value in FS and PS
– Blending of employee and customer communities ES FS PS SS
0%
10%
20%
30%
40%
50%
60%
70%
58%
50%
31%
55%
Online Community Spend-ing
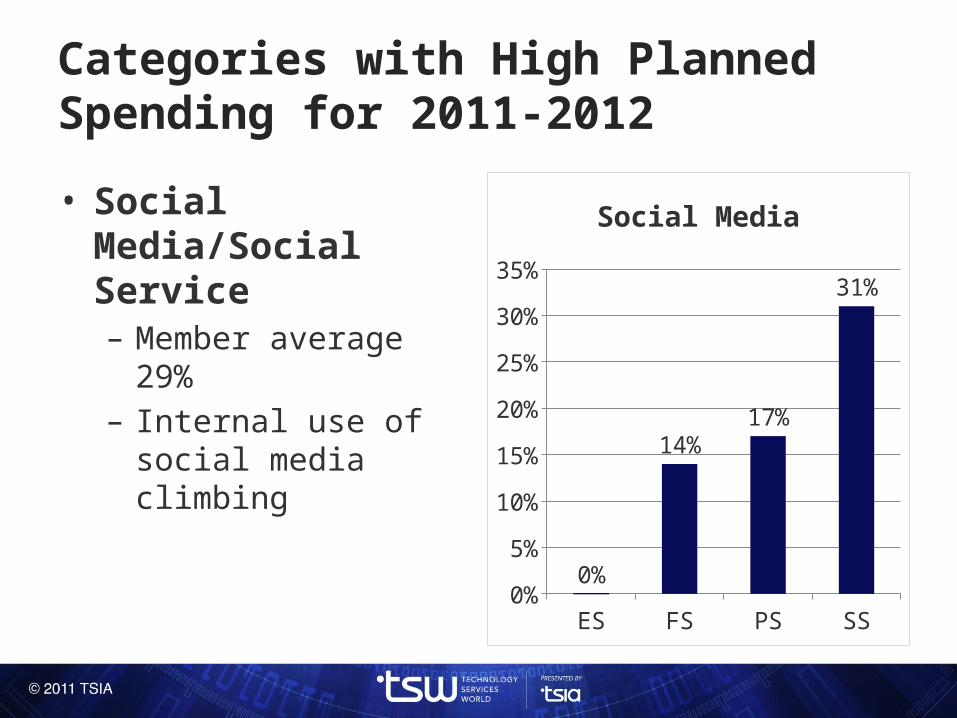
Categories with High Planned Spending for 2011-2012
• Social Media/Social Service– Member average 29%– Internal use of social
media climbing
ES FS PS SS0%
5%
10%
15%
20%
25%
30%
35%
0%
14%17%
31%
Social Media
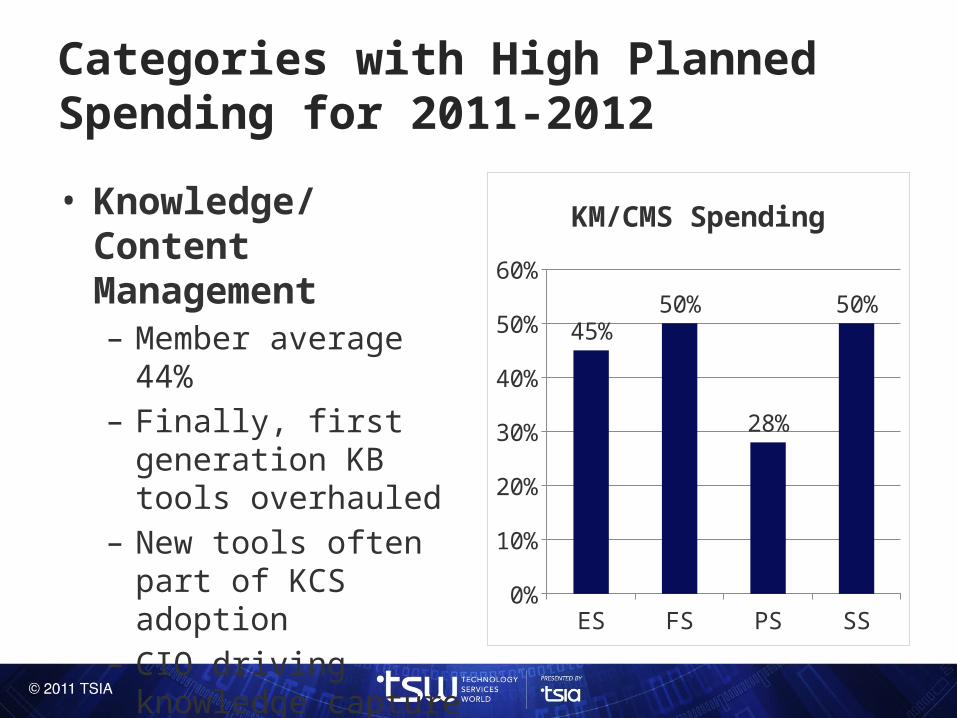
Categories with High Planned Spending for 2011-2012
• Knowledge/Content Management– Member average 44%– Finally, first generation
KB tools overhauled– New tools often part of
KCS adoption– CIO driving knowledge
capture projects due to retiring baby boomers
ES FS PS SS0%
10%
20%
30%
40%
50%
60%
45%50%
28%
50%
KM/CMS Spending
Final Thoughts…• “Best of breed” for communities
still requires multiple products– Forum + KM + Search +
Analytics• Remember that SaaS products
have advantages AND disadvantages– Ease of implementation and
low cost vs. depth and breadth, especially for reporting
• For more detail: Technology Spending and Adoption Trends, today at 4:15 PM in Grand B
Bestof
Breed