Embed Size (px)
Citation preview
0
Supplementary Notes Table of Contents
1. Revised Schedule VI of the Companies Act
2. Equity as a Call Option 3. Risky Debt and Options 4. Dilution 5. Merton Miller’s Argument 6. Capital Structure Policies in Practice 7. Bharat Hotels Company : A Case Study in Corporate Valuation 8. Equivalence of the Two Formulae 9. Marakon Approach 10. Mckinsey Approach 11. Dynamics of Restructuring 12. Corporate Governance in Developed World 13. The Case for Indexed Options 14. Strategic Performance Measurement : Evolving Practice 15. Translation Methods 16. Exchange Rate Regimes 17. Types of Intangible Assets and Approaches to Valuation 18. The Economic Approach to Valuation 19. Infosys Technologies : An Exemplar Intangible-Intensive Company 20. Hedging with Real Tools and Options 21. Case Studies in Risk Management 22. Financial Innovations 23. Financial Engineering and Corporate Strategy

1
Note 1 EQUITY AS A CALL OPTION
As we have seen, a call option entitles its holder to buy the underlying equity stock. So it may seem strange that the equity stock of a firm can itself be regarded as a call option. This section shows why the equity stock of a firm may be viewed as a call option on its assets. This is a valuable insight with important applications. Dietary
Suppose that Alpha Company, a levered company, has debt in the form of bonds that will
mature in year 1. On maturity the amount payable is B1. This is equal to B0 (1 + rb), where B0 is the amount of debt outstanding now and rb is the promised interest rate. (In general, rb is higher than the risk-free rate as there is some chance of default.) V0 represents the value of Alpha Company now and V1 the value in year 1. V0 is known but V1 is uncertain.
What would be the value of Alpha’s equity in year 1? If the value of the firm, V1, happens to
be greater than B1, the claim of debtholders, the value of Alpha’s equity, S1, would be V1 - B1, as equity stockholders have a residual claim in the firm. If V1 happens to be equal to or less than B1,S1 would be zero, because the limited liability feature ensures that the value of equity cannot become negative. Thus S1 = Max (V1- B1, 0).
What would be the value of bonds, B1, in year 1? It will simply be equal to the value of the
firm less the value of equity, or V1- S1. Put differently, it is V1 — Max (V1 — B1, 0). It can also be expressed as Min (B1, V1). The payoffs for equity stockholders and bondholders are summarised below:
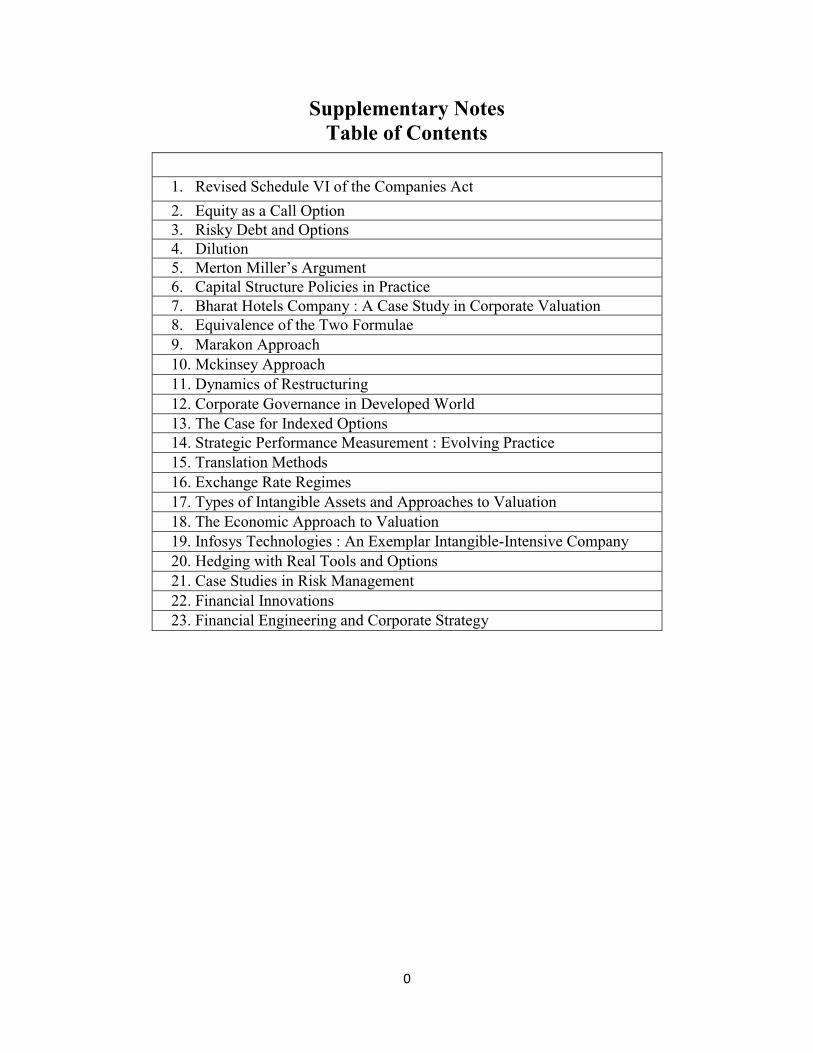
Default No default V1 < B1 V1 ≥ B1 Value of equity, S 0 V1 - B1 Value of bonds, B V1 B1 Value of the firm, S + B V1 V1 Exhibits 1 (a) and (b) show diagrammatically the payoffs of bondholders and equity stockholders.
2
Exhibit 1
Payoff of Bondholders and Equity Stockholders Payoff of Bondholders Payoff of stockholders, S1 B V1 - B1 B0 (1 + rb) B1 = B1 B1 Value of the B1 Value of Firm (V1) the firm (V1) (a) (b) - B1
From the foregoing analysis, it is evident that equity represents a call option on the assets of
the firm with an exercise price equal to the redemption value of bonds. This means whenever a firm borrows the lenders (bondholders) acquire the firm but the equity stockholders enjoy the option to buy back the firm by redeeming the bonds. Hence there is a similarity between equity value and call value. So, the equity can be valued by employing the Black-Scholes formula B1 S0 = V0 N (d1) - N (d2) (1) ert
where S0 is the market value of equity, V0 is the value of the firm, and B1 is the face value of the firm’s debt. V0 ln + (r + 1/2σ2 ) t d 1 = B1 σ t V0 ln + (r + 1/2σ2 ) t d 2 = B1 σ t
To illustrate how the value of the firm is split between equity and bonds, let us consider an example. Zenith Company has a current value of 1000. The face value of its outstanding bonds too is 1000. These are 1year discount bonds with an obligation of 1000 in year 1. The risk-free interest rate is 12 percent and the variance of the continuously compounded rate of return on the firm’s assets is 16 percent.

3
What is the present value of Zenith’s equity, S0, and debt, B0? The Black-Scholes model may be applied to answer this question:
B1 N (d2) S0 = V0 N (d1) - ert 1000 N (d2) = 1000 N (d1) - e0.12 1000 x 0.5398 = 1000 x 0.6915 - = 212.7 1.1275 V0 d1 = in + ( r — 1/ 2 σ2 ) t σ t B1 1000 = in + (0.12 + 1/2 x 0.16)1 0.4 1 = 0.50 1000 N (d1) = 0.6915 V0 d2 = in + ( r — 1/ 2 σ2 ) t σ t B1 1000 = in + (0.12 - 1/2 x 0.16)1 0.4 1 = 0.10 1000 N (d2) = 0.5398 B0 = V0 — S0 = 1000 - 212.7 = 787.3
Given the analogy between equity and call option, the value of equity can be depicted with the help of the call option diagram given in Exhibit 2. In this figure the market value of the firm is shown on the horizontal axis. The 45-degree line stemming from the origin of the graph represents the total value of equity (stocks) and debt claims (bonds), which by definition equals the value of the firm. The 45-degree line emanating from 892.86 (the present value of the bond under certainty) shows the present value of the exercise price from the point of view of equity stockholders. The curved line reflects the value of equity.

4
Exhibit 2
Value of Equity
Value of bonds and stock Value of bonds Value of stock Value of firm 892.86

5
Note 2 RISKY DEBT AND OPTIONS
The theory of options shows how the value of the firm is divided between equity stockholders and bondholders, helps in understanding risky bonds, and clarifies the nature of conflict between equity stockholders and bondholders. Value of the Value of bonds = firm’s assets - Value of equity
Value of the - Value of call option = firm’s assets on the firm’s assets There is another way of expressing the value of risky bonds: Value of = Value of risk-free - Value of put option on risky bonds bonds the assets of the firm
On the right hand side of this expression, the first term is simply B1. It may be noted that the two approaches to the valuation of risky bonds are equivalent, thanks to the put-call parity theorem.
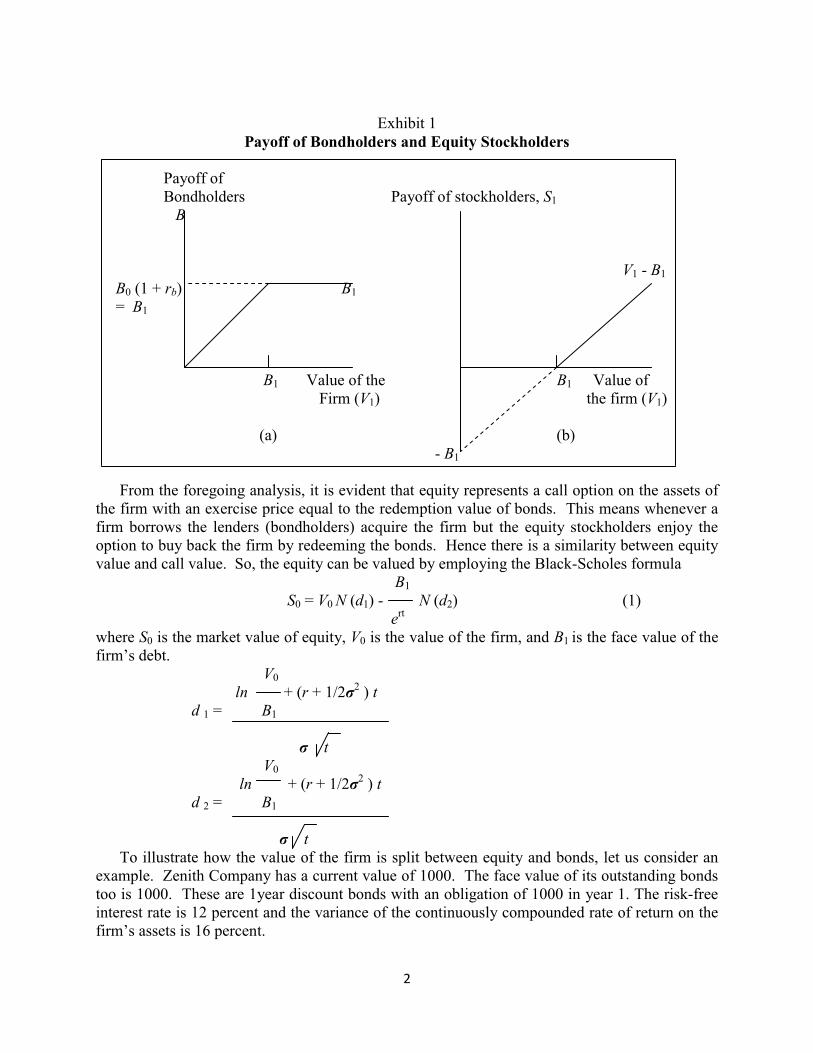
Suppose a firm issues risky bonds with a promise to pay B1 in year 1. The value of these
bonds depends on the value of the firm in year 1, V1, as follows: Outcome V1 < B1 V1 ≥ B1 Value of the bonds V1 B1 Value of Risky Bonds The payoff of risky bonds is Min (V1, B1). This is equivalent to the value of a risk-free bond minus the value of a put option on the assets of the firm, exercisable at B1, held by equity stockholders. The algebra of this equivalence is shown below: Outcome V1 < B1 V1 ≥ B1
Risk-free bonds B1 B1 - Value of a put option on the firm (B1- V1) 0 = Value of the risky bonds V1 B1 The above relationship is shown diagrammatically in Exhibit 1. Value of Loan Guarantees Often the loans of public sector undertakings are guaranteed by the government. What is the value of such loan guarantees? This question may be answered with the help of the insights provided by the option pricing theory. Remember that: Value of bonds = Value of risk-free bonds — Value of put option
This means that: Value of bonds = Value of risky bonds + Value of put option
6
Hence, from the perspective of the lenders (bondholders) the value of the guarantee provided by the government (or any other entity) is equal to the value of the put option. From the point of view of the guarantor (the government or some other entity) the cost of providing guarantee is the value of the put option.
The benefits of loan guarantees accrue to bondholders and equity stockholders as follows: When an existing issue of risky bonds is guaranteed, all the benefits accrue to the existing
bondholders. When a new issue of bonds is guaranteed, a major share of benefits accrues to the
existing equity stockholders and a minor share of benefits accrues to the existing bond holders.
Exhibit 1
Value of Risky Bonds Value of a put Value of risk-free bonds option on the firm B1 B1 B1 Value of the B1 Value of the firm (V1) firm (V1) Value of the risky bonds B1 B1 Value of the firm (V1)

7
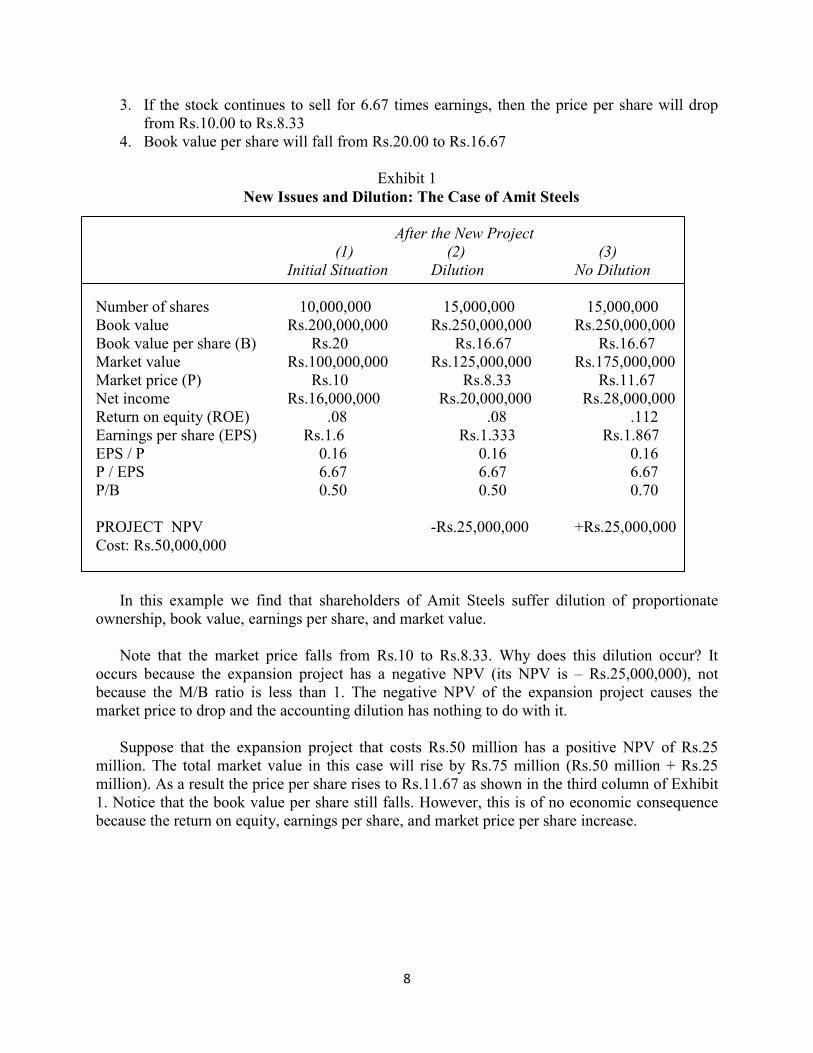
Note 3 DILUTION
When a firm plans to sell securities, dilution is an issue that often comes up for discussion. We can think of dilution in terms of proportionate ownership or market value or book value or earnings per share. Dilution of Proportionate Ownership Dilution of proportionate ownership occurs whenever a firm sells shares to the general public. For example, Ramesh owns 10,000 shares of Bharat International which currently has 100,000 outstanding shares. Thus Ramesh controls 10 percent (10,000 / 100,000) of the votes and has a claim to 10 percent of the income and assets of the firm.
If Bharat International issues 100,000 new equity shares through a public issue and Ramesh does not participate in this issue, his ownership stake will drop to 5 percent (10,000 / 200,000). Note that the value of Ramesh’s shares does not change; he just ends up owning a smaller percentage of a bigger firm.
Dilution of proportionate ownership can be avoided if the firm makes a rights issue.
Remember that a rights issue enables existing shareholders to maintain their proportionate ownership. Dilution of Value: Book Value versus Market Value To examine dilution of value, let us consider an example. As shown in Exhibit 1, Amit Steel currently has 10 million outstanding shares and no debt. Amit Steel has a book value of Rs.200 million or Rs.20 per share. Each share of Amit Steel is selling for Rs.10 and hence the company has a market value of Rs.100 million.
Amit Steel has not been faring well. Its poor performance is reflected in a low market to book
ratio of 0.5. Amit Steel’s net income currently is Rs.16 million. With 10 million shares, earnings per share (EPS) is Rs.1.6 and the return on equity (ROE) is 8 percent (1.6/20.0). Amit Steel has a price-earnings ratio of 6.67 (Rs.10/Rs.1.6). Amit Steel has 100 shareholders, each of whom owns 100,000 shares.
Amit Steel plans to expand its capacity. The expansion project will cost Rs.50 million and
Amit Steel will have to issue 5 million new shares (Rs.10 x 5 million = Rs.50 million). Thus, after the issue there will be 15 million shares outstanding.
The ROE on the expansion project is expected to be the same as for the existing assets. Put
differently, net income would go up by Rs.4 million (Rs.50 million x 8 percent). Total income will thus be Rs.20,000,000. If the expansion project is taken up the following would happen:
1. With 15 million shares outstanding, EPS would be Rs.1.333 (Rs.20 million / 15 million),
down from Rs.1.60. 2. Each old shareholder’s proportionate ownership will drop to 0.67 percent (100,000 /
15,000,000) from the previous 1.00 percent.
8
3. If the stock continues to sell for 6.67 times earnings, then the price per share will drop from Rs.10.00 to Rs.8.33
4. Book value per share will fall from Rs.20.00 to Rs.16.67
Exhibit 1 New Issues and Dilution: The Case of Amit Steels After the New Project (1) (2) (3)
Initial Situation Dilution No Dilution Number of shares 10,000,000 15,000,000 15,000,000 Book value Rs.200,000,000 Rs.250,000,000 Rs.250,000,000 Book value per share (B) Rs.20 Rs.16.67 Rs.16.67 Market value Rs.100,000,000 Rs.125,000,000 Rs.175,000,000 Market price (P) Rs.10 Rs.8.33 Rs.11.67 Net income Rs.16,000,000 Rs.20,000,000 Rs.28,000,000 Return on equity (ROE) .08 .08 .112 Earnings per share (EPS) Rs.1.6 Rs.1.333 Rs.1.867 EPS / P 0.16 0.16 0.16 P / EPS 6.67 6.67 6.67 P/B 0.50 0.50 0.70 PROJECT NPV -Rs.25,000,000 +Rs.25,000,000 Cost: Rs.50,000,000
In this example we find that shareholders of Amit Steels suffer dilution of proportionate
ownership, book value, earnings per share, and market value. Note that the market price falls from Rs.10 to Rs.8.33. Why does this dilution occur? It
occurs because the expansion project has a negative NPV (its NPV is — Rs.25,000,000), not because the M/B ratio is less than 1. The negative NPV of the expansion project causes the market price to drop and the accounting dilution has nothing to do with it.
Suppose that the expansion project that costs Rs.50 million has a positive NPV of Rs.25
million. The total market value in this case will rise by Rs.75 million (Rs.50 million + Rs.25 million). As a result the price per share rises to Rs.11.67 as shown in the third column of Exhibit 1. Notice that the book value per share still falls. However, this is of no economic consequence because the return on equity, earnings per share, and market price per share increase.

9
Note 4 MERTON MILLER ARGUMENT
The issue of optimal debt policy was answered in a novel, though controversial, manner by Merton Miller in his 1976 Presidential Address to the American Finance Association. He argued that the original MM proposition, which says that financial leverage does not matter in a tax free world, is valid in a world where both corporate and personal taxes exist:
To understand Miller’s argument, let us begin with the model of firm valuation when
corporate and personal taxes exist:
(1 - tc) (1 - tpe) VL = VU + D 1 - (1) (1 - tpd) If (1 - tpd) = (1 - tc) (1 - tpe) , Eqn (1) becomes: VL = VU (2)
This is the Modigliani and Miller position proposition in a tax-free world. If tpd = tpe, Eq. (2) becomes: VL = VU + tc D (3)
This is the Modigliani and Miller taking into account only the corporate taxes.
Miller posits that the former case is the correct case. Broadly, the key premises and links in his argument are as follows:
• The personal tax rate on equity income, tpe, is nil; the personal tax rate on debt income,
tpd, varies across investors; the corporate tax rate, tc, is constant across companies. • Companies will change their capital structures in such a manner that, at the margin, the
after tax value of a rupee of debt income is the same as the after-tax value of a rupee of equity income
• If the starting point is an all-equity capital structure, as long as some investors are tax-exempt (tpd =0), companies can by borrowing a rupee of debt enhance their value by tc - this is clear from Eq. (1)
• Once companies exhaust their tax-exempt clientele, they have to sell debt to investors who pay taxes. To induce investors to switch from equity (whose income is tax-exempt) to debt (whose income is taxed), companies have to raise the interest rate. If the risk-adjusted expected rate of return on equity is re, the risk-adjusted expected rate of return on debt should be at least re / (1- tpd ) in order to compensate investors for personal taxes on debt.
6 In the extreme case where tps = 0 and tpd = tc , the tax advantage of debt is nil because (1 - tc) (1 - tpe) (1 - tc) (1 - 0)
1 - = 1 - = 0 (1 - tpd) (1 - tc)
10
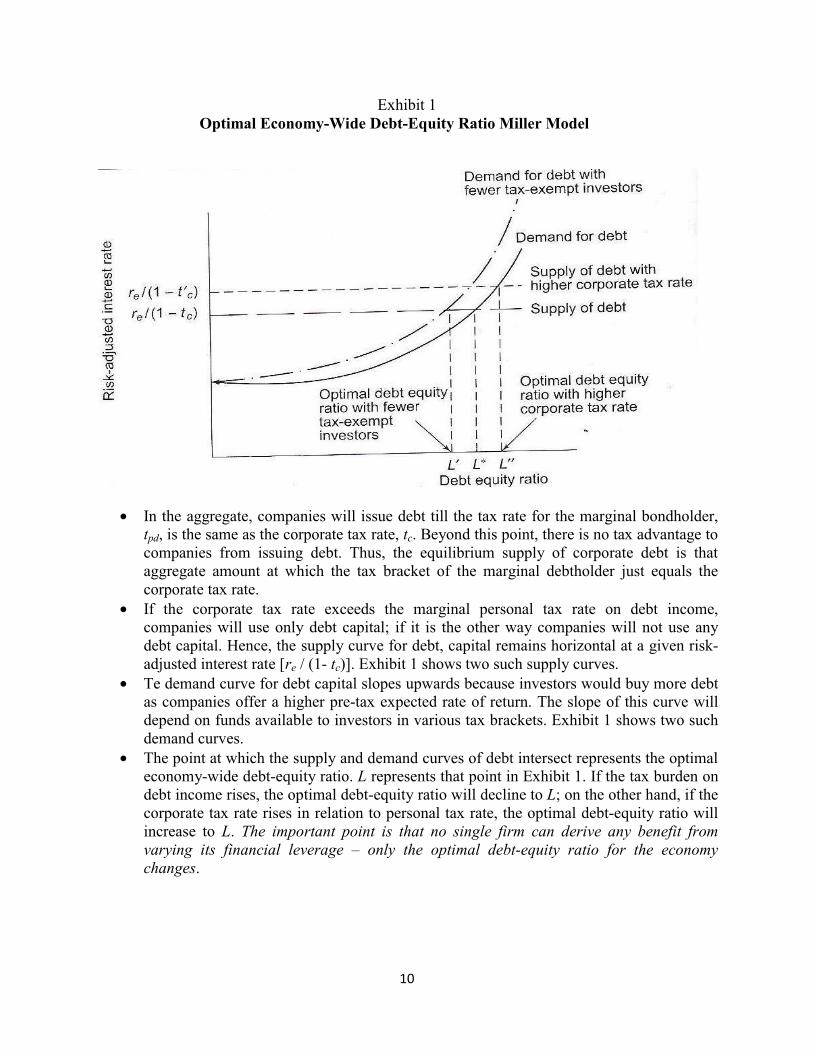
Exhibit 1 Optimal Economy-Wide Debt-Equity Ratio Miller Model
• In the aggregate, companies will issue debt till the tax rate for the marginal bondholder,
tpd, is the same as the corporate tax rate, tc. Beyond this point, there is no tax advantage to companies from issuing debt. Thus, the equilibrium supply of corporate debt is that aggregate amount at which the tax bracket of the marginal debtholder just equals the corporate tax rate.
• If the corporate tax rate exceeds the marginal personal tax rate on debt income, companies will use only debt capital; if it is the other way companies will not use any debt capital. Hence, the supply curve for debt, capital remains horizontal at a given risk-adjusted interest rate [re / (1- tc)]. Exhibit 1 shows two such supply curves.
• Te demand curve for debt capital slopes upwards because investors would buy more debt as companies offer a higher pre-tax expected rate of return. The slope of this curve will depend on funds available to investors in various tax brackets. Exhibit 1 shows two such demand curves.
• The point at which the supply and demand curves of debt intersect represents the optimal economy-wide debt-equity ratio. L represents that point in Exhibit 1. If the tax burden on debt income rises, the optimal debt-equity ratio will decline to L; on the other hand, if the corporate tax rate rises in relation to personal tax rate, the optimal debt-equity ratio will increase to L. The important point is that no single firm can derive any benefit from varying its financial leverage — only the optimal debt-equity ratio for the economy changes.
11
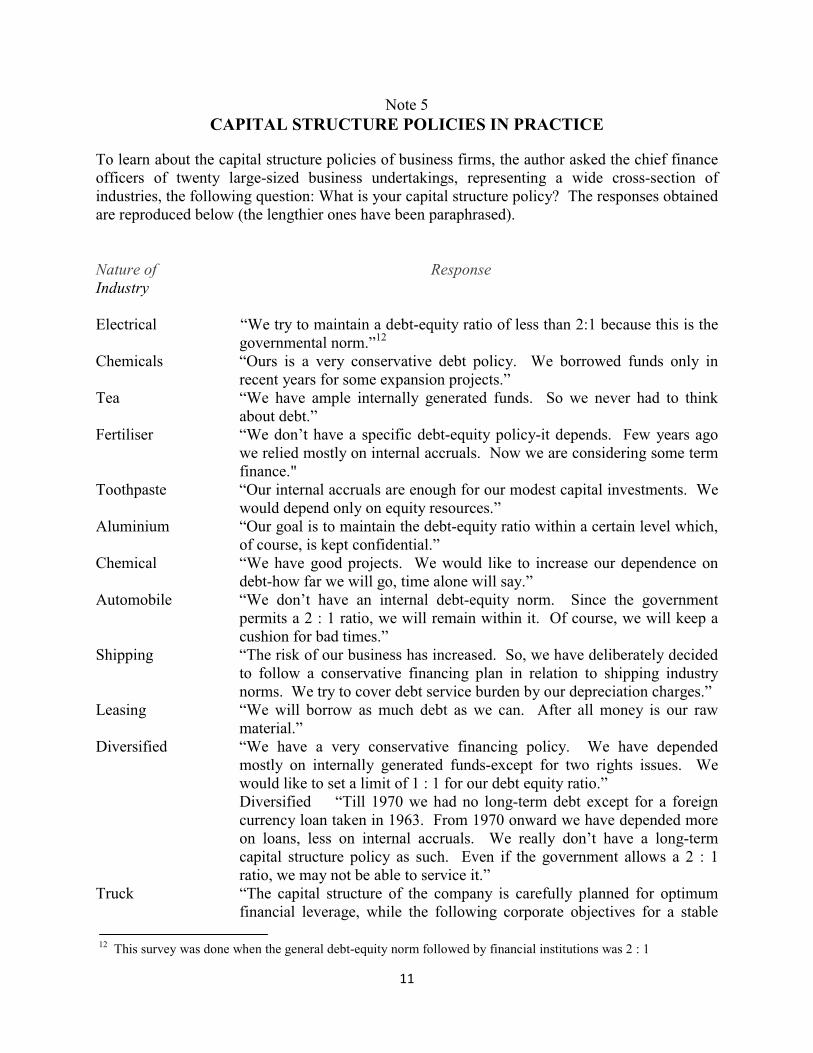
Note 5 CAPITAL STRUCTURE POLICIES IN PRACTICE
To learn about the capital structure policies of business firms, the author asked the chief finance officers of twenty large-sized business undertakings, representing a wide cross-section of industries, the following question: What is your capital structure policy? The responses obtained are reproduced below (the lengthier ones have been paraphrased). Nature of Response Industry Electrical “We try to maintain a debt-equity ratio of less than 2:1 because this is the
governmental norm.”12
Chemicals “Ours is a very conservative debt policy. We borrowed funds only in recent years for some expansion projects.”
Tea “We have ample internally generated funds. So we never had to think about debt.”
Fertiliser “We don’t have a specific debt-equity policy-it depends. Few years ago we relied mostly on internal accruals. Now we are considering some term finance."
Toothpaste “Our internal accruals are enough for our modest capital investments. We would depend only on equity resources.”
Aluminium “Our goal is to maintain the debt-equity ratio within a certain level which, of course, is kept confidential.”
Chemical “We have good projects. We would like to increase our dependence on debt-how far we will go, time alone will say.”
Automobile “We don’t have an internal debt-equity norm. Since the government permits a 2 : 1 ratio, we will remain within it. Of course, we will keep a cushion for bad times.”
Shipping “The risk of our business has increased. So, we have deliberately decided to follow a conservative financing plan in relation to shipping industry norms. We try to cover debt service burden by our depreciation charges.”
Leasing “We will borrow as much debt as we can. After all money is our raw material.”
Diversified “We have a very conservative financing policy. We have depended mostly on internally generated funds-except for two rights issues. We would like to set a limit of 1 : 1 for our debt equity ratio.” Diversified “Till 1970 we had no long-term debt except for a foreign currency loan taken in 1963. From 1970 onward we have depended more on loans, less on internal accruals. We really don’t have a long-term capital structure policy as such. Even if the government allows a 2 : 1 ratio, we may not be able to service it.”
Truck “The capital structure of the company is carefully planned for optimum financial leverage, while the following corporate objectives for a stable
12 This survey was done when the general debt-equity norm followed by financial institutions was 2 : 1
12
funding pattern are retained: (i) All fixed assets to be funded only by long-term funds, i.e. equity + long-term borrowings. (ii) At least 50 percent of working capital to be funded only by long-term funds, i.e., equity + long-term borrowings. (iii) Total debt to equity not to exceed 1:1.”
Pharmaceuticals “Traditionally we had a very conservative capital structure. We are now levering ourselves and have set a debt-equity norm of 1.7: 1. This will give us some margin, given the governmental norm of 2:1,”
Diversified “We finance on a project-by-project basis. There is no long range capital structure in mind.”
Textiles “You see it is like this. We go by the project. If it is good, finances will come — the shareholders will give, the institutions will give. What is the point in talking of a hypothetical capital structure.”
Storage Batteries “We have not borrowed funds. We don’t want to borrow. We don’t want external interference in our business.”
Diversified “We have very promising projects on the anvil which require massive investments. We will borrow as much as we can. It costs us less. After all, we have serviced our debt well in the past.”
Consumer Electronics “Our focus was on technology and production. Finances didn’t pose much of a problem. We have frankly speaking not thought of a capital structure policy.”
Diversified “Before the cement project our debt equity ratio was 0.1 to 1.0. With the borrowings of the cement unit it went upto 1.15 to 1.0. Since this appeared quite safe, we never defined any policy in this respect.”
Some Observations On the basis of the above comments, we may make the following observations:
1. While some firms have been able to articulate their capital structure policy, others have still to do so. The reasons why many firms have not been able to define their capital structure policy with definitiveness seem to be as follows: (a) Widening of the Instruments of Financing The range of the instruments of financing
has widened over the years. Convertible debentures which were relatively unknown in yesteryears have assumed great significance in recent years. Likewise, leasing and hire purchase are becoming important. In addition, some new instruments like cumulative convertible preference shares and cumulative convertible debentures have been introduced or are likely to be introduced.
(b) Lack of Long Experience with Debt Before the emergence of term-lending financial institutions most of the firms relied largely, almost exclusively ,on internal accruals. Hence, debt-equity ratios were very low. With the easier availability of term finance from the sixties and debenture finance in more recent years many firms have resorted to substantial debt finance to support their ever-increasing capital investment programmes. The experience of these firms with debt finance is apparently not sufficiently long to provide a sound basis for delineating their capital structure policies definitively.
(c) Changing Complexion of Business Risk The pace of change in the Indian industry has quickened with the introduction of new products and services, adoption of modern

13
technologies, intensification of competition, and shifts in consumer tastes and preferences. These development are naturally altering the complexion of business risk. In such a fluid situation, it becomes somewhat difficult to articulate capital structure policies because the degree of financial risk a firm can assume depends considerably on the level of its business risk.
2. Firms which have articulated their capital structure policy seem to follow one of the
following five policies: Policy A: No debt should be used in any circumstance. Policy B: Debt should be employed to a very limited extent. Policy C: The ratio of debt to equity should be maintained around 1:1 Policy D: The ratio of debt to equity should be kept within 2:1 Policy E: Debt should be tapped to the extent it is available.

14
Note 6 Bharat Hotels Company
Bharat Hotels Company (BHC) is a major hotel chain of India. The company operates 35 hotels of which 14 are owned by it and the rest are owned by others but managed by BHC. BHC's principal strategy has been to serve the high end of the international and leisure travel markets in major metropolises, secondary cities, and tourist destinations. It plans to continue to develop new businesses and leisure hotels to take advantage of the increasing demand which is emanating from the larger flow of commercial and tourist traffic of foreign as well as domestic travellers. BHC believes that the unique nature of its properties and the emphasis on personal service distinguishes it from other hotels in the country. Its ability to forge management contracts for choice properties owned by others has given it the flexibility to swiftly move into new markets while avoiding the capital intensive and time consuming activity of constructing its hotels. BHC's major competitors in India are two other major Indian hotel chains and a host of other five star hotels which operate in the metropolises as an extension of multinational hotel chains. The foreign hotel majors are considerably stronger than the Indian hotels in terms of financial resources, but their presence in the country has historically been small. With the government committed to developing India as a destination for business and tourism, several hotel majors have announced their intention to establish or expand their presence in the country.
BHC's operating revenues and expenses for the year just concluded (year 0) were as follows:
Operating Revenues Rupees (in million) • Room rent 1043 • Food and beverages 678 • Management fees for managed properties 73
Operating Expenses • Materials 258 • Personnel 258 • Upkeep and services 350 • Sales and general administration 350
BHC's assets and liabilities (in million rupees) at the end of year 0 were as follows:
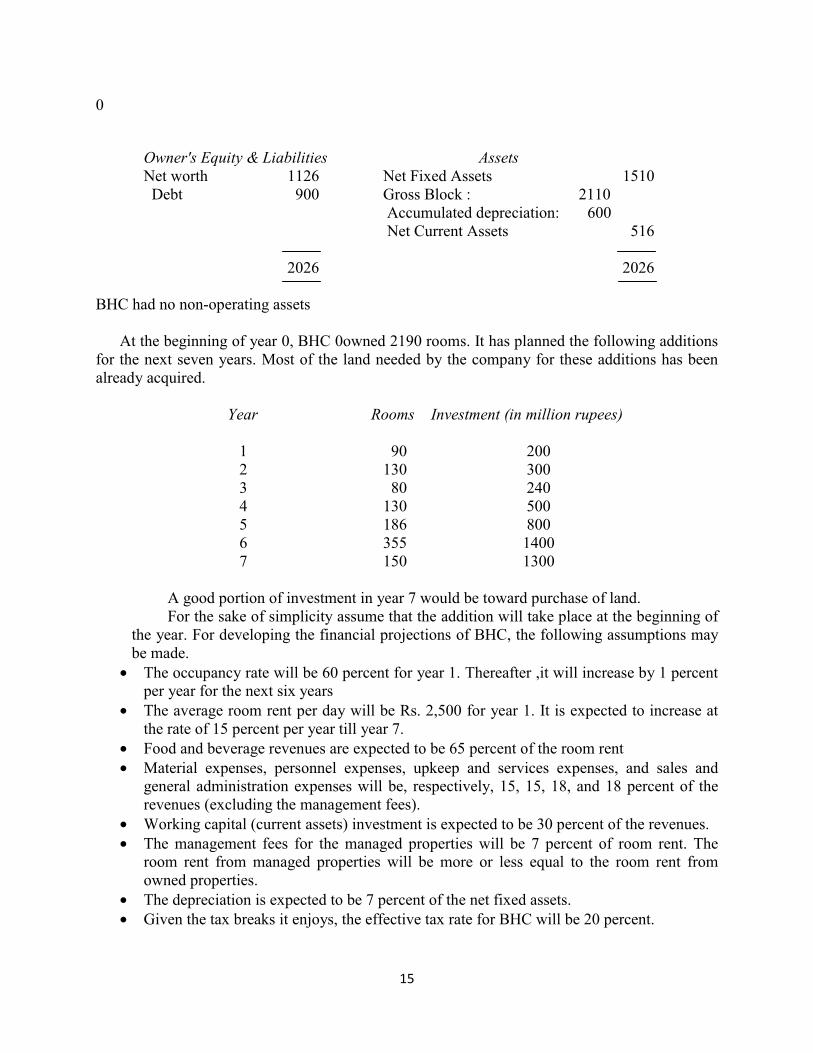
15
0
Owner's Equity & Liabilities Assets Net worth 1126 Net Fixed Assets 1510 Debt 900 Gross Block : 2110
Accumulated depreciation: 600 Net Current Assets 516
2026 2026
BHC had no non-operating assets
At the beginning of year 0, BHC 0owned 2190 rooms. It has planned the following additions
for the next seven years. Most of the land needed by the company for these additions has been already acquired. Year Rooms Investment (in million rupees) 1 90 200 2 130 300 3 80 240 4 130 500 5 186 800 6 355 1400 7 150 1300
A good portion of investment in year 7 would be toward purchase of land. For the sake of simplicity assume that the addition will take place at the beginning of
the year. For developing the financial projections of BHC, the following assumptions may be made.
• The occupancy rate will be 60 percent for year 1. Thereafter ,it will increase by 1 percent per year for the next six years
• The average room rent per day will be Rs. 2,500 for year 1. It is expected to increase at the rate of 15 percent per year till year 7.
• Food and beverage revenues are expected to be 65 percent of the room rent • Material expenses, personnel expenses, upkeep and services expenses, and sales and
general administration expenses will be, respectively, 15, 15, 18, and 18 percent of the revenues (excluding the management fees).
• Working capital (current assets) investment is expected to be 30 percent of the revenues. • The management fees for the managed properties will be 7 percent of room rent. The
room rent from managed properties will be more or less equal to the room rent from owned properties.
• The depreciation is expected to be 7 percent of the net fixed assets. • Given the tax breaks it enjoys, the effective tax rate for BHC will be 20 percent.
16
Besides financial projections, the following information is relevant for valuation.
• The market value of equity of BHC at the end of year 0 is Rs. 3050 million. The imputed market value of debt is Rs. 900 million.
• BHC's stock has a beta of 0.921 • The risk-free rate of return is 12 percent and the market risk premium 8 percent. • The post-tax cost of debt is 9 percent • The free-cash flow is expected to grow at a rate of 10 percent per annum after 7 years. What is the DCF value of the firm?
Solution The DCF value of BHC is calculated as follows. Free Cash Flow Forecast Based on the information provided above, the forecast for revenues and operating expenses is developed in the first three panels of the table below. The schedule for current assets, fixed assets, and depreciation is shown in next table. Finally the free cash flow forecast is developed in the last panel of the table.
17
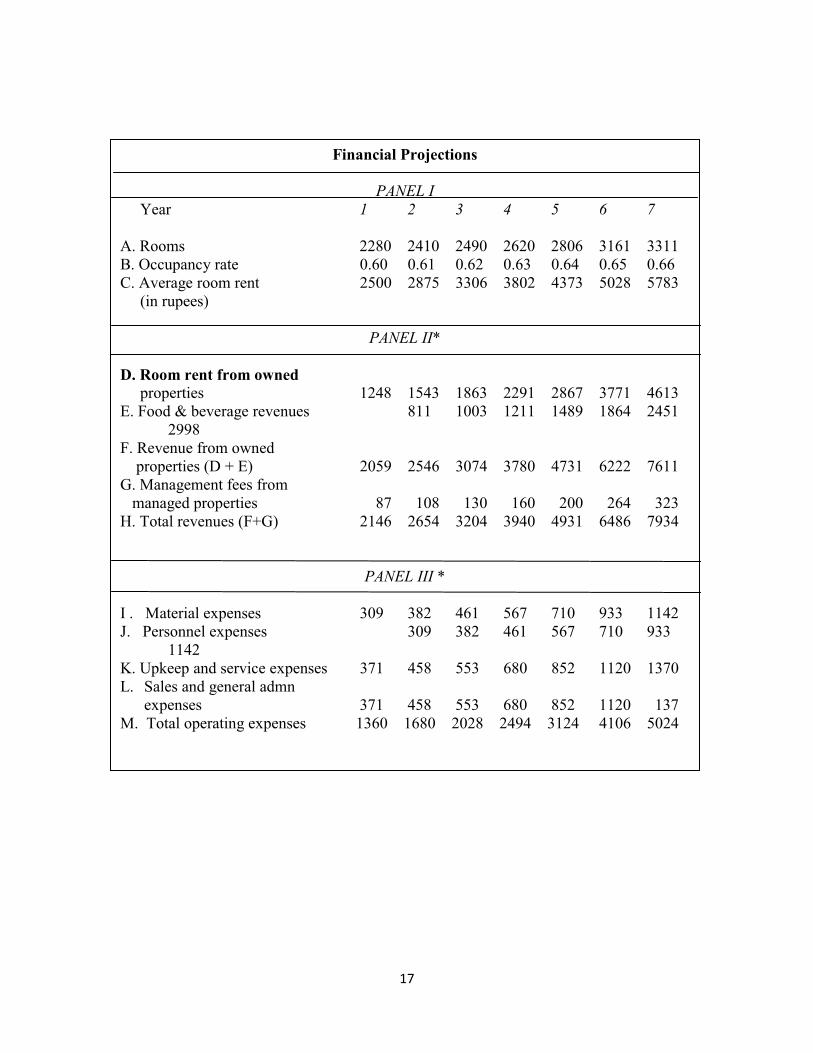
Financial Projections
PANEL I Year 1 2 3 4 5 6 7 A. Rooms 2280 2410 2490 2620 2806 3161 3311 B. Occupancy rate 0.60 0.61 0.62 0.63 0.64 0.65 0.66 C. Average room rent 2500 2875 3306 3802 4373 5028 5783 (in rupees)
PANEL II* D. Room rent from owned properties 1248 1543 1863 2291 2867 3771 4613 E. Food & beverage revenues 811 1003 1211 1489 1864 2451 2998 F. Revenue from owned properties (D + E) 2059 2546 3074 3780 4731 6222 7611 G. Management fees from managed properties 87 108 130 160 200 264 323 H. Total revenues (F+G) 2146 2654 3204 3940 4931 6486 7934
PANEL III * I . Material expenses 309 382 461 567 710 933 1142 J. Personnel expenses 309 382 461 567 710 933 1142 K. Upkeep and service expenses 371 458 553 680 852 1120 1370 L. Sales and general admn
expenses 371 458 553 680 852 1120 137 M. Total operating expenses 1360 1680 2028 2494 3124 4106 5024
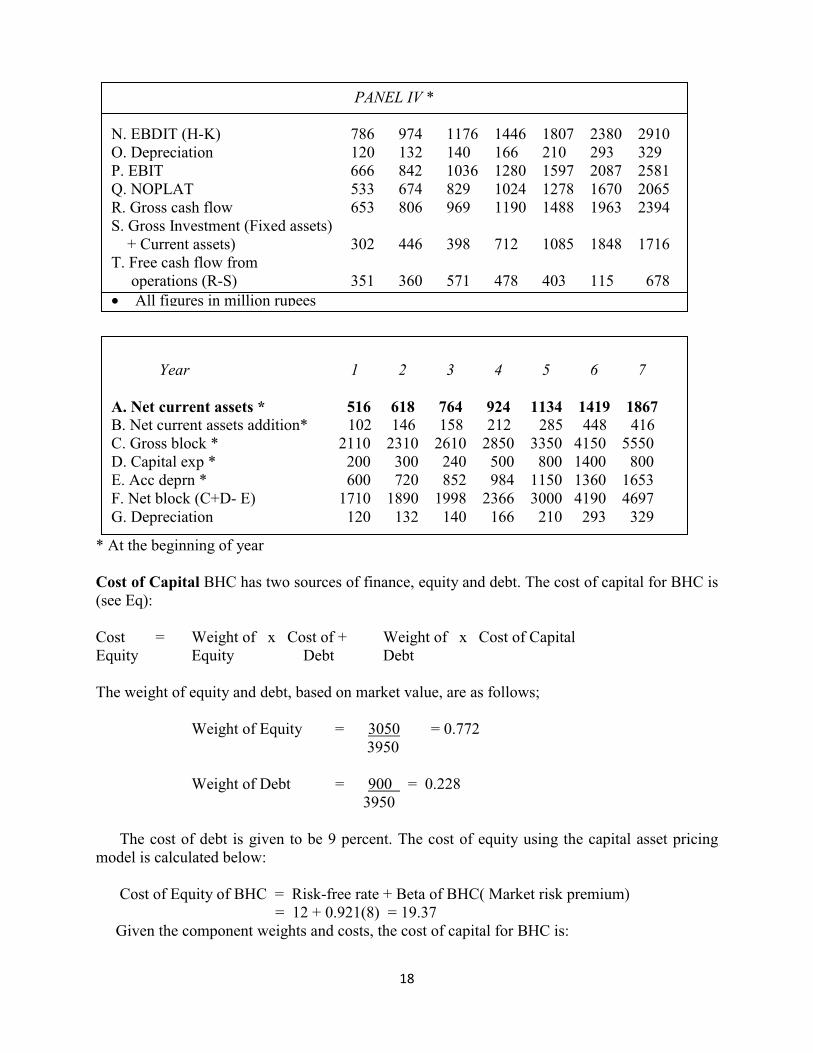
18
* At the beginning of year Cost of Capital BHC has two sources of finance, equity and debt. The cost of capital for BHC is (see Eq): Cost = Weight of x Cost of + Weight of x Cost of Capital Equity Equity Debt Debt The weight of equity and debt, based on market value, are as follows; Weight of Equity = 3050 = 0.772 3950 Weight of Debt = 900 = 0.228 3950
The cost of debt is given to be 9 percent. The cost of equity using the capital asset pricing
model is calculated below: Cost of Equity of BHC = Risk-free rate + Beta of BHC( Market risk premium) = 12 + 0.921(8) = 19.37 Given the component weights and costs, the cost of capital for BHC is:
PANEL IV * N. EBDIT (H-K) 786 974 1176 1446 1807 2380 2910 O. Depreciation 120 132 140 166 210 293 329 P. EBIT 666 842 1036 1280 1597 2087 2581 Q. NOPLAT 533 674 829 1024 1278 1670 2065 R. Gross cash flow 653 806 969 1190 1488 1963 2394 S. Gross Investment (Fixed assets) + Current assets) 302 446 398 712 1085 1848 1716 T. Free cash flow from operations (R-S) 351 360 571 478 403 115 678 • All figures in million rupees
Year 1 2 3 4 5 6 7
A. Net current assets * 516 618 764 924 1134 1419 1867 B. Net current assets addition* 102 146 158 212 285 448 416 C. Gross block * 2110 2310 2610 2850 3350 4150 5550 D. Capital exp * 200 300 240 500 800 1400 800 E. Acc deprn * 600 720 852 984 1150 1360 1653 F. Net block (C+D- E) 1710 1890 1998 2366 3000 4190 4697 G. Depreciation 120 132 140 166 210 293 329

19
(0.772)(19.37) + (0.228) (9) = 17.00 percent Continuing Value The continuing value may be estimated using the growing free cash flow perpetuity method. The projected free cash flow for year 7 is Rs. 678 million. Thereafter it is expected to grow at a constant rate of 10 per cent per year. Hence the expected continuing value at the end of the seventh year is given by CV7 = FCF8 = 678 (1.10) = Rs. 10654 million k-g 0.17-0.10 Calculation and Interpretation of Results The value of equity is equal to:
Discounted free cash flow during the explicit forecast period
+
Discounted continuing value
+
Value of non-operating assets -
Market value of debt claims
= 351
+ 360
+ 571
+ 478
+ 403
+ 115
+ 678
(1.17) (1.17)2 (1.17)3 (1.17)4 (1.17)5 (1.17)6 1.17)7
+ 10654 (1.17)7
+ 0 - 900
= Rs. 4279 million
Since the discounted continuing value [10654/(1.17)7 = Rs . 3550 million looms large in this valuation, it is worth looking into it further. Its key determinant appears to be the expected growth rate in the free cash flow beyond the explicit forecast period. This has been assumed in the preceding analysis to be 10 percent. What happens to the estimate of equity value if the growth rate happens to be different? The sensitivity of the estimate of equity value to variations in the growth rate in a range of, say, 8 percent to 12 percent is shown below:

20
Growth rate Equity value estimate (per cent) (in million rupees)
8 3490 9 3835 10 4279 11 4871

21
Note 7
EQUIVALENCE OF THE TWO FORMULAE The two formulae for determining the continuing value are as follows: Free cash flow perpetuity formula FCF k — g (1) Value driver formula NOPLAT (1 — g/r) k — g (2) As the denominators are identical, to establish the equivalence of the two formulae, we have to prove that FCF = NOPLAT (1 — g/r) (3) Let us start with the following definition of free cash flow (FCF): FCF = NOPLAT — INV (4) where INV = net increase in invested capital. If the return on existing capital employed remains constant, a firm’s NOPLAT in year t is equal to its NOPLAT in year t — 1 plus the return earned on INV made in year t — 1. NOPLATt = NOPLATt-1 + r x INVt-1 (5) Rearranging Eq. (1) gives: NOPLATt — NOPLATt—1 = r x INVt-1 (6) Dividing both sides of Eq. (2) by NOPLATt-1 gives:
NOPLATt — NOPLATt-1 r x INVt-1 = NOPLATt-1 NOPLATt-1 (7)
As the left hand side of Eq. (3) represents the growth (g) in NOPLAT, we get: INV g = r x
NOPLAT (8) This gives: INV = NOPLAT x g/r (9) FCF = NOPLAT — (NOPLAT x g/r) (10) FCF = NOPLAT (1 — g/r) (11)
The ratio g/r may be referred to as the net investment rate. It reflects the ratio of net new investment to NOPLAT.
A simple example shows that the two methods produce identical continuing value estimates, given the same assumptions.
The cash flow projections for a firm are as follows:
22
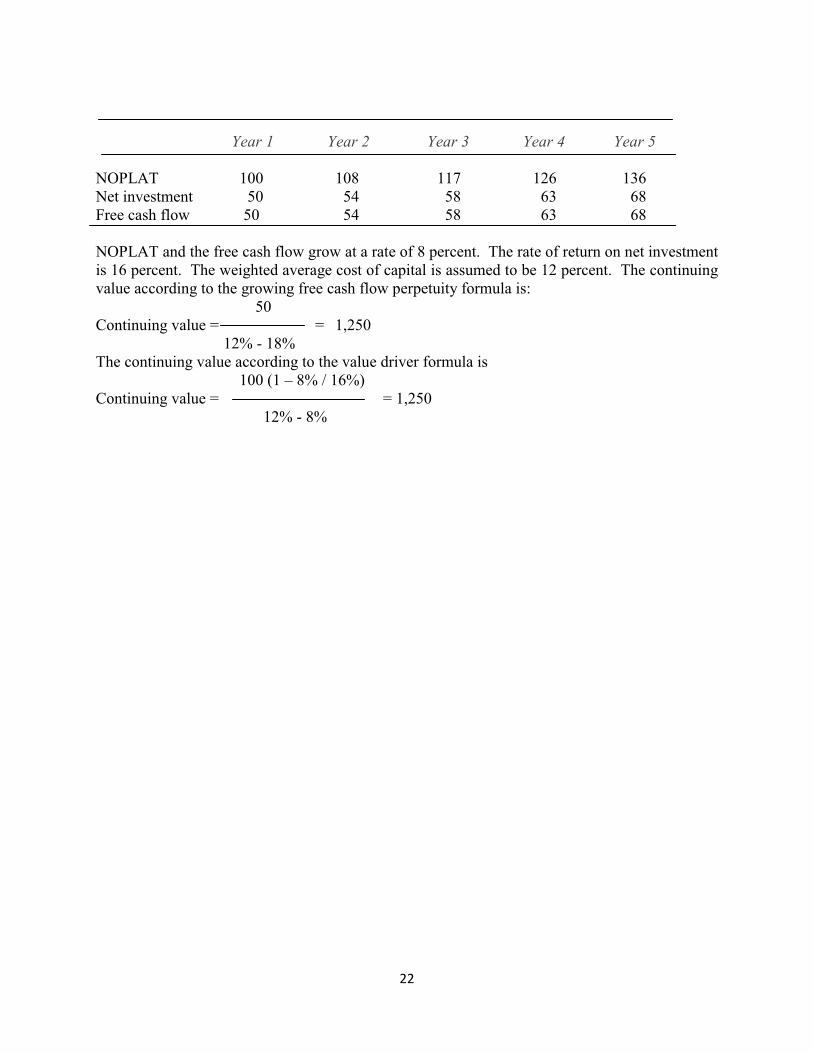
Year 1 Year 2 Year 3 Year 4 Year 5 NOPLAT 100 108 117 126 136 Net investment 50 54 58 63 68 Free cash flow 50 54 58 63 68 NOPLAT and the free cash flow grow at a rate of 8 percent. The rate of return on net investment is 16 percent. The weighted average cost of capital is assumed to be 12 percent. The continuing value according to the growing free cash flow perpetuity formula is: 50 Continuing value = = 1,250 12% - 18% The continuing value according to the value driver formula is 100 (1 — 8% / 16%) Continuing value = = 1,250 12% - 8%
23
Note 8 MARAKON APPROACH
Marakon Associates, an international management consulting firm founded in 1978, has done pioneering work in the area of value based management. The Marakon approach has been comprehensively described in the book The Value Imperative authored by James M. McTaggart, Peter W. Kontes, and Michael C. Mankins.1
The key steps in the Marakon approach are as follows: • Specify the financial determinants of value • Understand the strategic drivers of value • Formulate higher value strategies • Develop superior organisational capabilities
Specify the Financial Determinants of Value The Marakon approach is based on a market-to-book ratio model. According to this model, shareholder wealth creation is measured as the difference between the market value and the book value of a firm’s equity. The book value of equity, B, measures approximately the capital contributed by the shareholders, whereas the market value of equity, M, reflects how productively the firm has employed the capital contributed by the shareholders, as assessed by the stock market. Hence, the management creates value for shareholders if M exceeds B, decimates value if M is less than B, and maintains value if M is equal to B.
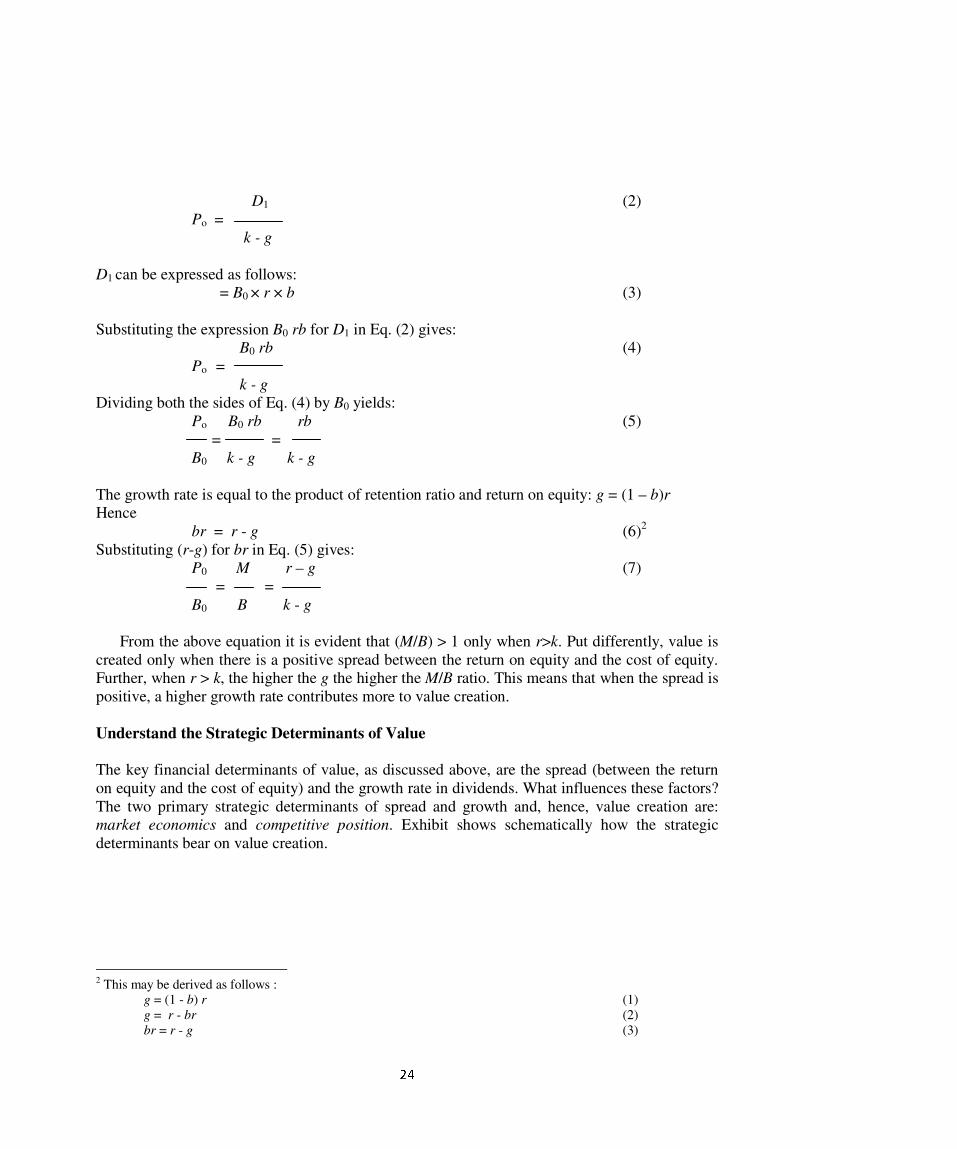
According to the Marakon model, the market-to-book values ratio is a function of the return on equity, the growth rate of dividends (as well as earnings), and the cost of equity:
M r - g
= (1) B k - g where M is the market value of equity, B is the book value of equity, r is return on equity, g is the growth rate in dividends, and k is the cost of equity.
Equation () may be derived from the constant growth dividend discount model. To demonstrate this, we will use the following additional symbols:
Po = market price per share at the end of year 0 (Po = M) D1 = dividend per share at the end of year1 b = dividend payout ratio (1 - b) = retention ratio
According to the constant growth dividend discount model:
1 Published by Free Press, New York in 1994
�
�
D1 (2) Po =
k - g D1 can be expressed as follows: = B0 × r × b (3) Substituting the expression B0 rb for D1 in Eq. (2) gives: B0 rb (4) Po =
k - g Dividing both the sides of Eq. (4) by B0 yields: Po B0 rb rb (5) = =
B0 k - g k - g The growth rate is equal to the product of retention ratio and return on equity: g = (1 – b)r Hence br = r - g (6)2 Substituting (r-g) for br in Eq. (5) gives: P0 M r – g (7) = =
B0 B k - g
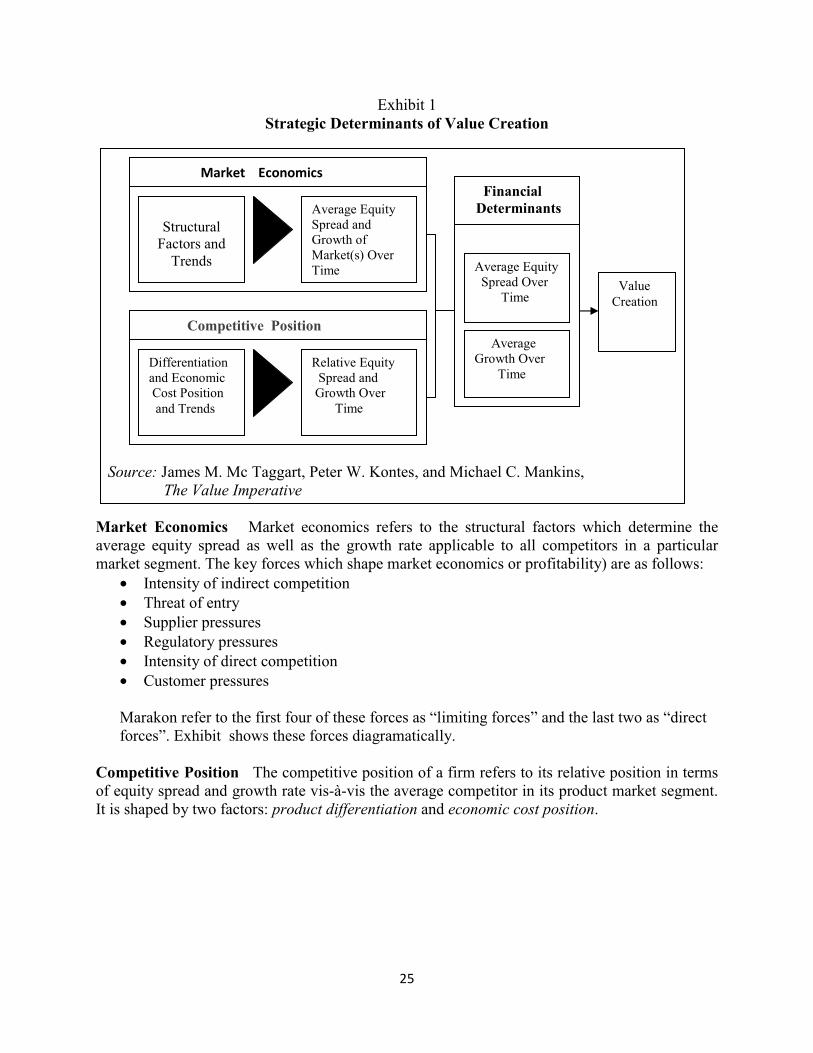
From the above equation it is evident that (M/B) > 1 only when r>k. Put differently, value is created only when there is a positive spread between the return on equity and the cost of equity. Further, when r > k, the higher the g the higher the M/B ratio. This means that when the spread is positive, a higher growth rate contributes more to value creation. Understand the Strategic Determinants of Value The key financial determinants of value, as discussed above, are the spread (between the return on equity and the cost of equity) and the growth rate in dividends. What influences these factors? The two primary strategic determinants of spread and growth and, hence, value creation are: market economics and competitive position. Exhibit shows schematically how the strategic determinants bear on value creation.
�����������������������������������������������������������
2 This may be derived as follows : g = (1 - b) r (1) g = r - br (2) br = r - g (3)
25
Exhibit 1 Strategic Determinants of Value Creation
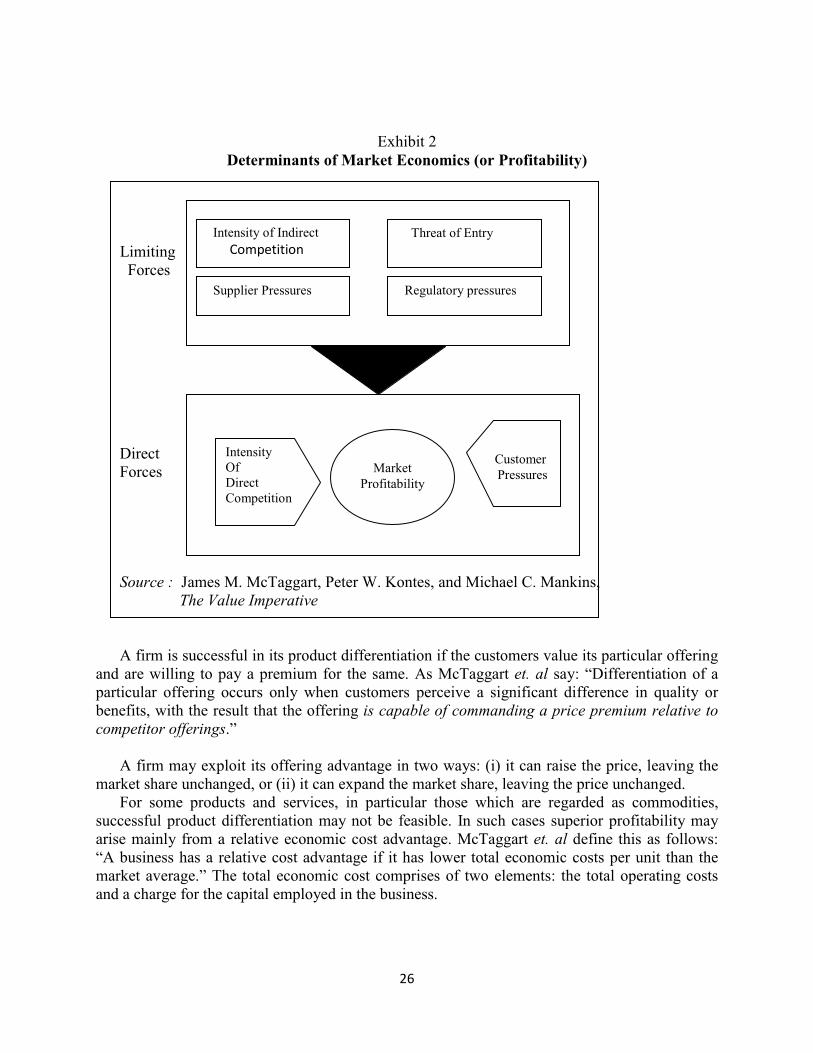
Source: James M. Mc Taggart, Peter W. Kontes, and Michael C. Mankins, The Value Imperative Market Economics Market economics refers to the structural factors which determine the average equity spread as well as the growth rate applicable to all competitors in a particular market segment. The key forces which shape market economics or profitability) are as follows:
• Intensity of indirect competition • Threat of entry • Supplier pressures • Regulatory pressures • Intensity of direct competition • Customer pressures
Marakon refer to the first four of these forces as “limiting forces” and the last two as “direct forces”. Exhibit shows these forces diagramatically.
Competitive Position The competitive position of a firm refers to its relative position in terms of equity spread and growth rate vis-à-vis the average competitor in its product market segment. It is shaped by two factors: product differentiation and economic cost position.
Market Economics
Structural
Factors and Trends
Average Equity Spread and Growth of Market(s) Over Time
Competitive Position
Differentiation and Economic Cost Position and Trends
Relative Equity Spread and Growth Over Time
Financial Determinants
Value Creation
Average Equity Spread Over Time
Average Growth Over Time
26
Exhibit 2 Determinants of Market Economics (or Profitability)
Limiting Forces Direct Forces
Source : James M. McTaggart, Peter W. Kontes, and Michael C. Mankins, The Value Imperative
A firm is successful in its product differentiation if the customers value its particular offering and are willing to pay a premium for the same. As McTaggart et. al say: “Differentiation of a particular offering occurs only when customers perceive a significant difference in quality or benefits, with the result that the offering is capable of commanding a price premium relative to competitor offerings.”
A firm may exploit its offering advantage in two ways: (i) it can raise the price, leaving the
market share unchanged, or (ii) it can expand the market share, leaving the price unchanged. For some products and services, in particular those which are regarded as commodities,
successful product differentiation may not be feasible. In such cases superior profitability may arise mainly from a relative economic cost advantage. McTaggart et. al define this as follows: “A business has a relative cost advantage if it has lower total economic costs per unit than the market average.” The total economic cost comprises of two elements: the total operating costs and a charge for the capital employed in the business.
Customer Pressures
Intensity of Indirect Competition
Threat of Entry
Supplier Pressures Regulatory pressures
Intensity Of Direct Competition
Market Profitability
27
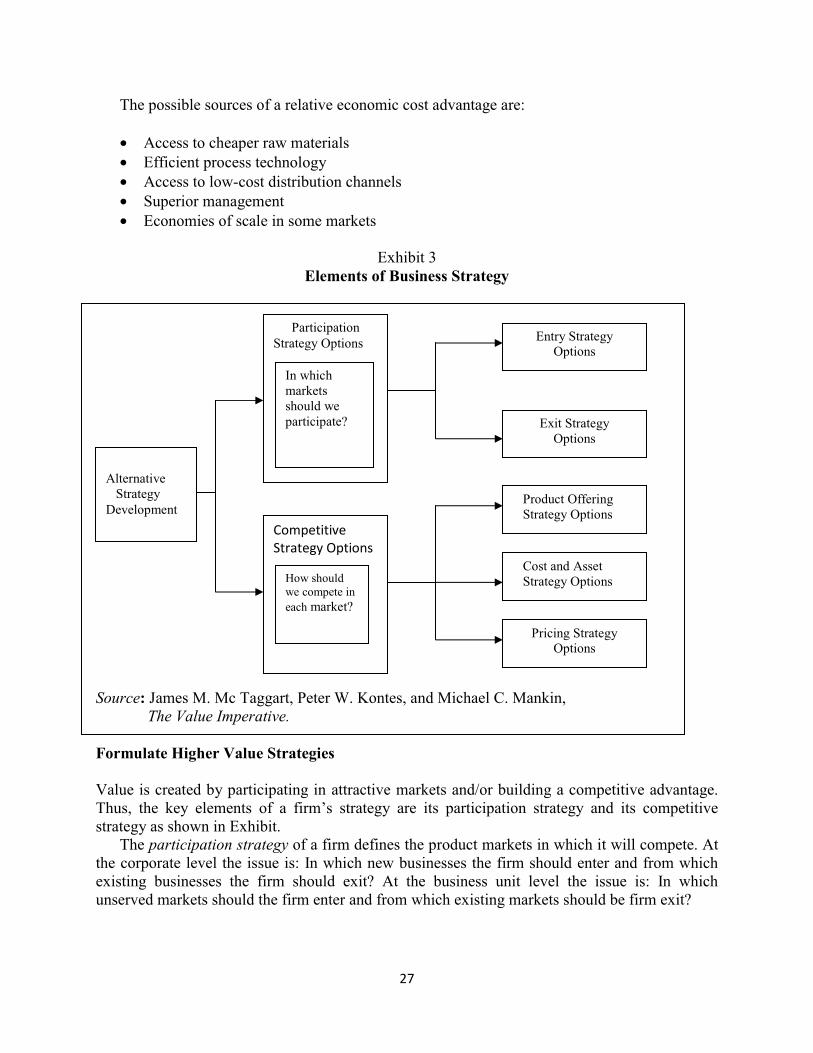
The possible sources of a relative economic cost advantage are: • Access to cheaper raw materials • Efficient process technology • Access to low-cost distribution channels • Superior management • Economies of scale in some markets
Exhibit 3
Elements of Business Strategy
Source: James M. Mc Taggart, Peter W. Kontes, and Michael C. Mankin, The Value Imperative. Formulate Higher Value Strategies Value is created by participating in attractive markets and/or building a competitive advantage. Thus, the key elements of a firm’s strategy are its participation strategy and its competitive strategy as shown in Exhibit.
The participation strategy of a firm defines the product markets in which it will compete. At the corporate level the issue is: In which new businesses the firm should enter and from which existing businesses the firm should exit? At the business unit level the issue is: In which unserved markets should the firm enter and from which existing markets should be firm exit?
Participation Strategy Options
Competitive Strategy Options
Entry Strategy Options
Exit Strategy Options
Product Offering Strategy Options
Cost and Asset Strategy Options
Pricing Strategy Options
Alternative Strategy Development
In which markets should we participate?
How should we compete in each market?
28
The competitive strategy of a business unit spells out the means the management will employ to build competitive advantage and/or overcome competitive disadvantage in the markets served by it. As McTaggart et. al say:
“Development of a competitive strategy involves three related tasks: determining how best to differentiate the product and/or service offering, how best to configure and manage the business unit’s costs and assets, and how to price the product or service offering.”
Develop Superior Organisational Capabilities Higher value strategies, discussed in the previous step, are designed to overcome the forces of competition. They should be combined with superior organisational capabilities which enable a firm to overcome the internal barriers to value creation and to counter what Warren Buffett calls the “institutional imperative” (the forces which lead to divergence between the goals of managers and shareholders). The key organisational capabilities are:
• A competent and energetic chief executive who is fully committed to the goal of value maximisation.
• A corporate governance mechanism that promotes the highest degree of accountability for creation or destruction of value.
• A top management compensation plan which is guided by the principle of “relative pay for relative performance”.
• A resource allocation system which is based on four principles: (i) the principle of zero-based resource allocation, (ii) the principle of funding strategies, not projects, (iii) the principle of no capital rationing, and (iv) the principle of zero tolerance for bad growth.
• A performance management process (the high-level strategic and financial control process) which is founded on two basic principles: (i) The performance targets are driven by the plans, rather than the other way around. (ii) The process should have integrity implying that the performance contract must be fully honored by both sides, the chief executive and each business unit head.
29
Note 9 MCKINSEY APPROACH
McKinsey & Company, a leading international consultancy firm, has developed an approach to VBM which has been very well articulated by Tom Copeland, Tim Koller, and Jack Murrin of McKinsey & Company3. According to them:
“Properly executed, value based management is an approach to management whereby the company’s overall aspirations, analytical techniques, and management processes are all aligned to help the company maximize its value by focusing decision making on the key drivers of value.”
Value Thinking To make value happen, a company's actions should be based on a foundation of value thinking, which has two dimensions viz., value metrics and vale mindset. Value Metrics Does the management understand how companies create value? Does the management know how the stock market values companies? Does the company include opportunity cost of capital in its measurements? Do the metrics reflect economic results or accounting results? Value Mindset How much does the management care about shareholder value creation? Does the CEO strive to seek as much value for shareholders as possible? For example, Sir Brian, Chairman of Lloyds TSB Group said in 1998: "We are willing to go on changing in order to double the value of the company — to stretch ourselves beyond the things that we are doing at the moment."
5 Tom Copeland, Tim Koller, and Jack Murrin, Valuation: Measuring and Managing the Value of Companies, Second Edition, New York: John Wiley & Sons Inc. 1994.

30
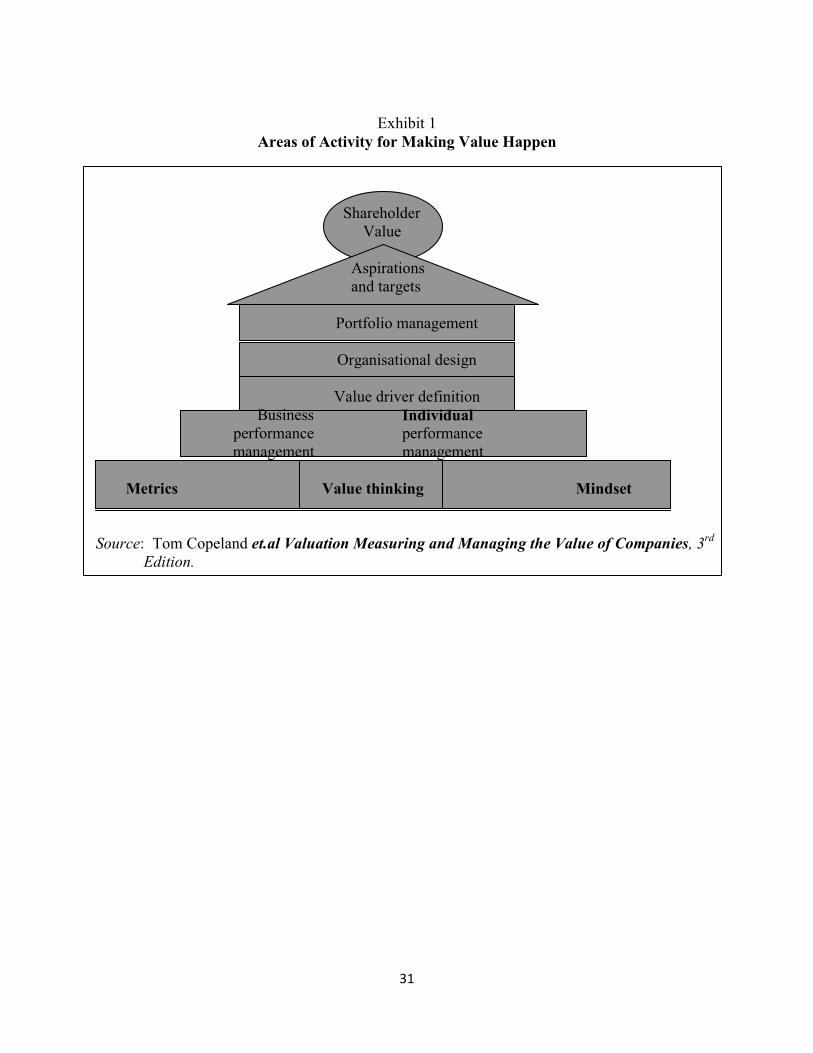
Areas of Activity for Making Value Happen According to the McKinsey approach, there are six areas where a company must focus to make value happen. These are shown in Exhibit 33.7 and briefly discussed below:
1. Aspirations and targets The company must develop a broad statement of purpose that inspires its employees and specify value-linked quantitative targets that provide some degree of stretch.
2. Portfolio management The company must build a portfolio of businesses which exploits its strategic advantages, improves its performance, and provides profitable growth avenues.
3. Organisational design An organisational design with well-defined performance units and individual accountabilities is essential to translate value creation aspirations and strategy into disciplined acquisitions.
4. Value driver identification A value driver is a performance variable such as customer satisfaction or employee productivity which has a bearing on the results of the company. The metrics used for measuring value drivers are called key performance indicators. Examples: customer retention rates and revenue per employee. Value drivers must be identified, prioritised, and institutionalised (incorporated into the targets and scorecards).
5. Business performance management Business performance management involves setting targets for performance units and reviewing periodic progress with the objective of enhancing performance. As Copeland et. al put it: "Business performance management is often the crux of managing for value, as this is where value metrics, value drivers, and targets must translate into everyday actions and decision making".
6. Individual performance management The thrust of individual performance management is on motivating and rewarding strong individual performance and aligning the interest of managers with those of shareholders. Individual performance management involves setting targets, reviewing performance, and giving appropriate rewards.
31
Exhibit 1
Areas of Activity for Making Value Happen
Shareholder Value
Aspirations and targets
Portfolio management
Organisational design
Value driver definition
Business performance management
Individual performance management
Metrics
Value thinking
Mindset
Source: Tom Copeland et.al Valuation Measuring and Managing the Value of Companies, 3rd Edition.
32
Note 10 DYNAMICS OF RESTRUCTURING
In an incisive study on corporate restructuring covering a number of companies over an extended period of time, Gordon Donaldson examined the dynamics of corporate restructuring4. He tried to look at issues like why corporate restructuring occurs periodically, what conditions or circumstances induce corporate restructuring, and how should corporate governance be reformed to make it more responsive to the needs of restructuring. The key insights of this study are described below:
1. Even though the environmental change, which warrants corporate restructuring, is a gradual process, corporate restructuring is often an episodic and convulsive exercise. Why? Typically, an organisation can tolerate only one vision of the future, articulated by its chief executive, and it takes time to communicate that vision and mobilise collective commitment. Once the strategy and structure that reflect that vision are in place, they acquire a life of their own. A constituency develops, with a vested interest in that strategy and structure, which resists change unless it becomes inevitable. As Gordon Donaldson says: “Hence resistance to change often preserves the status quo well beyond its period of relevance so that when change comes, the pent up forces, like an earthquake, capture in one violent moment, a decade of gradual change.”
2. The conditions or circumstances which seem to enhance the probability of voluntary corporate restructuring, but not necessarily guarantee the same, are: (a) Persuasive evidence that the strategy and structure in place have substantially eroded the benefits accruing to one or more principal corporate constituencies. (b) A shift in the balance of power in favour of the disadvantaged constituency. (c) Availability of options to improve performance. (d) Presence of leadership which is capable of and willing to act.
3. Corporate restructuring occurs periodically due to an ongoing tension between the organisational need for stability and continuity on the hand and the economic compulsion to adapt to changes on the other. As Gordon Donaldson says: “The ‘wrongs’ that develop during one period of stable strategy and structure are never permanently ‘righted’ because each new restructuring becomes the platform on which the next era of stability and continuity is constructed.”
Organisational Restructuring
To cope with heightened competition, many firms have undertaken organisational restructuring and performance enhancement programmes. The common elements of these programmes are: (a) regrouping of businesses, (b) decentralisation, (c) downsizing, (d) outsourcing, (e) business process re-engineering, (f) enterprise resource planning, and (g) total quality management.
4 Gordon Donaldson, Corporate Restructuring : Managing the Change Process from Within, HBS Press, Boston, 1994
33
Note 11 CORPORATE GOVERNANCE IN THE DEVELOPED WORLD
Corporate governance is concerned basically with the agency problem that arises from the separation of finance and management (or, in popular terms, ownership and control). It refers to the mechanisms and arrangements employed by financiers (shareholders and lenders) to induce managers, who tend to acquire considerable residual control rights in practice, to care for their interest. As Andrei Shleifer and Robert W. Vishnu say: "Much of the subject of corporate governance deals with constraints that managers put on themselves, or that investors put on managers, to reduce the ex post misallocation and thus to induce investors to provide more funds ex ante."5 It deals with questions like: How do financiers exercise control over managers? How do financiers ensure that managers do not steal the resources placed with them, or squander them on uneconomic projects? More specifically, corporate governance covers issues like the legal rights of financiers, the role of large investors, the method of electing boards of directors, the composition of the board, the composition of various sub-committees of the board, the appointment of the auditors, the ability of the board to maintain surveillance, the system of checks and balances instituted over managerial behaviour, the incentives offered to managers to protect financiers from dissipation of capital, the standards of financial reporting and corporate disclosure, and so on.
A great deal of concern has been expressed all over the world about the shortcomings in the systems of corporate governance. This has been articulated very eloquently by Michael Jensen6, Jonathan Charkham7, and others. In his highly perceptive presidential address to the American Finance Association in 1993, Jensen argued persuasively that the general failure of large companies to restructure and redirect themselves in the absence of external compulsions reflects an inadequacy in the corporate governance mechanisms.
To understand corporate governance in developed countries, we will look at two significantly different models, the Anglo-American model and the German-Japanese model.
5 Andrei Shleifer and Robert W. Vishny "A Survey of Corporate Governance," The Journal of Finance, June 1997
6 Michael C. Jensen, "The Modern Industrial Revolution, Exit and the Failure of Internal Control System," Journal of Finance, July 1993. 7 Jonathan Charkham, Keeping Good Company : A Study of Corporate Governance in Five Countries, Clarendon Press, 1994.
34
Anglo-American Model The distinctive features of the Anglo-American model of corporate governance are as follows: 1. Ownership of companies vests more with institutional investors and less with individual
investors. Though the combined holding of institutional shareholders is often more than 50 percent, rarely does a single institutional investor have more than 10 percent stake in a company. (This may be because of various restrictions applicable to institutional investment).
2. Companies are typically run by professional managers (often referred to as bosses) who have negligible ownership stakes. There is a fairly clear separation of ownership and management. Managers enjoy substantial freedom in running the companies and the typical chief executive officer considers himself as John Wayne, wielding complete control. However, in the wake of scandals at companies like Enron, WorldCom, and Tyco that rocked corporate America in the last few years, a revolution in corporate governance seems to have been sparked. As Louis Lavelle says: “Almost overnight, boards that were at the CEO’s beck and call are more independent, skeptical, and determined than ever to hold top executives accountable. As revolutions go, not a bad start”.
3. Though in theory the management is supposed to be chosen by the directors, in practice it is often the other way. Hence, directors are rarely independent of management. Hence traditionally the independence of directors was compromised. However, in the wake of the Sarbanes — Oxley Act, the old stance of informal co-operation with the CEO has given way to a legalistic, and somewhat antagonistic, relationship.
4. Most institutional investors are reluctant activists. They view themselves as portfolio investors interested in investing in a broadly diversified portfolio of liquid securities. The high churning ratio of these investors suggests that they have a short-term orientation. If they
Dramatic Change In Corporate Governance
There has been a dramatic change in corporate governance in the U.S. since 1980. Before 1980, corporate managements sought to promote the stability and growth of the enterprise and “balance” the claim of various stakeholders, rather than maximise shareholders wealth. Form 1980 onward, corporate managements in the U.S. have embraced the goal of shareholder value creation and this shift, according to informed observers, has contributed, in no small measure, to the improvement in the financial performance of the U.S. companies in the last two decades or so.
In recent years, the forces of deregulation, globalisation, and information technology that are sweeping the world economy have prodded other countries to gradually move to the U.S. model. There has been a definite change in the conventional wisdom on corporate governance since the 1970s and early 1980s, when the bank-centered systems of Japan and Germany were extolled and the U.S. market — based system severely criticised. As Bengst Holstrom and Steve N.Kaplan put it in a Spring 2003 Journal of Corporate Finance article: “Since the mid- 1980s, the American style of corporate governance has reinvented itself and the rest of the world seems to be following the U.S. lead.” In the same article they have argued: “Despite its alleged flaws, the U.S. corporate governance system has performed very well, both on an absolute basis and relative to other countries.”
35
are not satisfied with a company's performance, they simply sell its securities in the market. The myopic outlook of institutional investors builds pressure on management to report good earnings performance in the short run.
5. While most institutional investors seem to have neither the inclination nor the ability to monitor companies effectively, a small, and perhaps growing, number of institutional investors are playing a more active role in corporate governance. They seem to fall primarily into two categories: (i) Institutional investors like Calpers (the California Public Employees Retirement System), who believe that they can earn superior returns only by investing in a small number of companies and actively monitoring them. (ii) Institutional investors who pursue an "index strategy" that requires them to remain committed to stocks included in the index that they are trying to mimic. Such investors have been fairly successful in persuading companies like U.S. Steel, Sears, and Eastman Kodak to refocus their core strategies and even replace chief executive officers at companies like International Business Machines, General Motors, and Goodyear.
6. The disclosure norms are comprehensive, the rules against insider trading tight, and the penalties for price manipulation stiff. These measures provide adequate protection to the small investor and promote general market liquidity. Incidentally, they also discourage large investors from taking an active role in corporate governance.
7. There is a fairly active market for corporate control that provides a credible threat of takeover to consistent underperformers. Indeed, there was a significant hostile takeover activity in the US and the UK during the period 1976-90. Michael Jenson points out that hostile deals, along with leveraged buyouts and other transactions in corporate control, enriched shareholders by more than $700 billion (at 1990 prices), and laments the recent political and legal reaction against takeovers.
Jonathan Charkham characterises the Anglo-American model as one of "high-tension"
because of the important role of the chief executive officer, active capital markets, short-termism, and credible takeover threats. German-Japanese Model The German and the Japanese model of corporate governance, despite some differences among them, share certain important commonalties to justify being bracketed together. Its distinctive features are described below:
1. Banks and financial institutions have substantial stakes in the equity capital of companies. In addition, cross holdings (referred to as keirestsu in Japan) among groups of firms are common in Japan.
2. Institutional investors in Germany and Japan view themselves as long-term investors. They play a fairly active role in management. In general, the long-term commitment of institutions and the close monitoring provided by them seem to have helped companies immensely.
3. In Germany and Japan, disclosure norms are not very stringent, checks on insider trading are not very comprehensive and effective, and the emphasis on liquidity is not high. All this tends to impair the efficiency of the capital market.
4. There is hardly any market for corporate control in Germany and Japan. Takeovers, hostile or otherwise, are not very common.

36
Jonathan Charkham refers to the German-Japanese model as the "networked" system because of the access to vast information through banks, long-termism of investors, infrequent mergers and acquisitions, and the limited role of the capital market.
37
Note 12 THE CASE FOR INDEXED OPTIONS
Conventional stock options are structured as fixed price options, meaning that the exercise price is fixed on the day the options are granted and stays unchanged for the entire option period. If the share price rises above the exercise price, the option holder gains. Thus, fixed price options reward executives for any increase in share price, even if the same is well below what competitors or the market have realised. By the same token, they do not reward executives when there is a decrease in share price, even if the company's share has outperformed the market or its peer group.
Since incentive compensation should reward relative performance and not absolute performance, there is a strong case for indexed options rather than the conventional fixed price options. The exercise price of an indexed option is linked to a benchmark index, which may be a broad market index or a specific sector index.
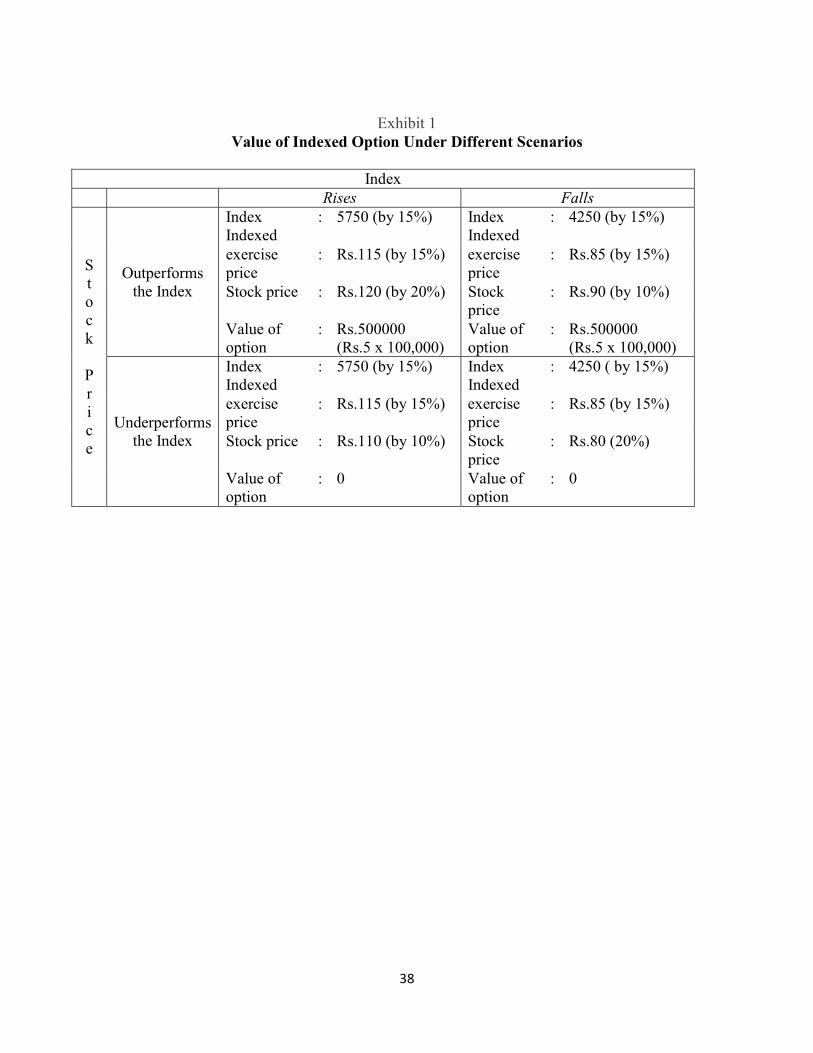
To illustrate how the indexed options work, let us consider an example. Modern Industries Limited's equity stock is currently selling for Rs.100 per share when the Sensex is at a level of 15000. Modern Industries Limited grants an option to its CEO which entitles him to purchase 100,000 shares at an exercise price of Rs.100 (the current market price), but the same will move in line with Sensex in future. Put differently, the CEO is given indexed options. The value of the option granted to the CEO under various scenarios is shown in Exhibit
From Exhibit it is clear that the indexed options reward the CEO only when the company's stock outperforms the market irrespective of whether the market per se moves up or down. As Alfred Rappaport puts it: "Indexed options do not reward underperforming executives simply because the market is rising. Nor do they penalize superior performers because the market is declining. They can keep executives motivated in the bull markets everyone has grown accustomed to but also in sustained bear markets." In nutshell, indexed options reward superior performance in all markets.
38
Exhibit 1
Value of Indexed Option Under Different Scenarios
Index Rises Falls
S t o c k
P r i c e
Outperforms the Index
Index Indexed
: 5750 (by 15%) Index Indexed
: 4250 (by 15%)
exercise price
: Rs.115 (by 15%) exercise price
: Rs.85 (by 15%)
Stock price : Rs.120 (by 20%) Stock price
: Rs.90 (by 10%)
Value of option
: Rs.500000 (Rs.5 x 100,000)
Value of option
: Rs.500000 (Rs.5 x 100,000)
Underperforms the Index
Index Indexed
: 5750 (by 15%) Index Indexed
: 4250 ( by 15%)
exercise price
: Rs.115 (by 15%) exercise price
: Rs.85 (by 15%)
Stock price : Rs.110 (by 10%) Stock price
: Rs.80 (20%)
Value of option
: 0 Value of option
: 0

39
Stock - based Rewards : The U.S .Experience The U.S.has been a pioneer in employing stock-based rewards. Here is a brief survey of the U.S experience.
• Stock-based rewards of various forms have been used. The most common forms are employee stock options, restricted stock grants, and employee stock purchase plans. Under an employee stock option plan, employees are granted call options which give them the right to buy the company’s shares at a specified ‘exercise’ price. Under a restricted stock grant plan, employees are given restricted stocks which they can encash when the vesting occurs, provided they are still employed at the company. Under an employee stock purchase plan, employees are allowed to purchase the shares of the company at a discount.
• Employee stock options seem to thrive during periods of stock market buoyancy. They appeared during the roaring 1920s, became virtually defunct in the bear market of late 1960s and early 1970s, surged in popularity in the bull market of 1980s and 1990s, and lost their lustre in the sluggish market at the beginning of the new millennium.
• Poorly designed employee stock options contributed to the “infectious greed” in 1990s. Leaders of companies like Enron Corporation and Quest Communications International reaped huge undeserved gains from exercising options and disposing shares before the release of bad corporate news.
• After the stock market meltdown in the early years of this millennium, there has been a distinct shift from employee stock options in favour of time-vested restricted stock and performance-vested restricted stock. Employees can cash them as long as they are still employed at the company when the stock vests, either after a set date or upon meeting predetermined standards. Microsoft, for example, has decided to supplant stock options with restricted shares. Amazon.com, too, has done the same.
• To be sure, stock options remain a valuable tool for many companies, particularly fast growing start-ups that don’t have a lot of money to pay its employees.
40
Note 13 STRATEGIC PERFORMANCE MEASUREMENT: EVOLVING PRACTICE 2
A large number of companies all over the world are developing strategic performance measurement (SPM) systems to help them in implementing their business strategies. SPM systems seem to vary widely across companies. Some rely entirely on financial measures like return on capital employed and EVA®8; others rely heavily on non-financial measures like customer satisfaction, market share, and new product development; still others combine both financial and non financial measures in a more or less balanced manner.
A recent survey of the SPM practices of publicly traded industrial and service companies based mainly in the U.S. and Europe revealed the following:
• The most popular financial SPMs used by the respondents in the past three years were
operating margin, return on capital employed, and cash flow. The most commonly cited financial SPMs that the respondents expected to use over the next three years are cash flow, return on capital employed, and economic profit.9
• The top three non-financial SPMs of the past three years were customer satisfaction, market share, and quality. The top three non-financial SPMs expected over the next three years were customer satisfaction, market share, and product development.
• Most respondents expressed the need to integrate the best of financial, strategic, and operating measures. The following comment by Michael Sieglin, Director of Corporate Strategy, Siemens articulates this need: “We believe that value-based planning and balanced scorecard are complementary planning systems: value-based planning is oriented toward the capital markets while scorecards are process-oriented, focused more on key success factors. In our company, there was an increasing need to know more about strategic success factors such as market position, product quality, process cycles, etc. So we developed a whole performance measurement system to meet that need”.
• The principal reasons cited by companies for introducing formal SPM systems are: (a) lack of organisational focus, (b) misalignment of strategy and incentives, (c) frustrated strategy implementation, and (d) confusion about strategy implications.
• Over 80 percent of the companies that said they adopted a formal SPM system also mentioned that their stock performance equalled or surpassed that of their peers.
• 92 percent of the respondents regarded their SPM systems as “important to the company” and 77 percent of the respondents said their SPM systems as “important to the CEO”. Commenting on the importance assigned to SPMs by senior managers, Stephen Gates says: “Much of the interest in SPMs is driven by senior management’s need to respond to a rapidly changing business environment. An effective response requires communicating strategic shifts and aligning organisational thinking so that all employees are ‘singing from the same sheet of music’”.
• 74 percent of the respondents characterised SPM as important to CFOs, while 56 percent mentioned that it was important to corporate strategies. While the CEO leads the
8 EVA® is similar to residual income. 9 Economic profit is similar to residual income.

41
development of SPMs, the CFO or the corporate strategy director leads the implementation and maintenance of the SPM system.
• The respondents have reported several deficiencies characterising their SPM systems. • Investors and managers want to identify leading SPMs rather than the lagging SPMs. But
respondents do not agree on whether an SPM is a leading indicator or a lagging indicator. • Few companies report the SPMs they consider to be leading indicators to investors and
analysts. The reasons for this are: (i) Wall Street analysts focus on financial numbers and are generally not interested in non-financial measures. (ii) Managements are disinclined to depart from the traditional pattern of dialogue with investors. (iii) SPMs are still evolving and some of them are too complex.
• New strategies, major shifts in business environment, and new executive teams are the key forces which are driving the changes in SPMs.

42
Note 14 TRANSLATION METHODS
Internationally, four methods of foreign currency translation are used in practice: the current/noncurrent method, the monetary/nonmonetary method, the temporal method, and the current rate method. Current/Noncurrent Method Under this method, all the current assets and liabilities of the foreign operation are translated into home currency at the current exchange rate, whereas noncurrent assets and liabilities are converted at historical exchange rates prevailing when the assets were acquired or liabilities incurred. The profit and loss account is translated at the average exchange rate of the period, except for items like depreciation and amortisation which are associated with the noncurrent assets and liabilities. The latter items are translated at the same rate as the corresponding balance sheet items. Monetary/Nonmonetary Method Under this method, monetary assets and liabilities — items that represent a claim to receive or an obligation to pay a fixed amount of and liabilities are translated at the current rate and non monetary assets and liabilities are translated at historical rates. Profit and loss account is translated at the average exchange rate of the period, except for revenue and expense items associated with nonmonetary assets and liabilities. The latter items, cost of goods sold and depreciation in the main, are translated at the same rate as the corresponding balance sheet items. Temporal Method Under this method, monetary balance sheet items are translated at the current rate. Nonmonetary balance sheet items are translated at the current rate, if they are carried at current value, or the historical rate, if they are carried at historical cost. Profit and loss account items are normally translated at the average rate for the period. However, cost of goods sold and depreciation and amortisation charges are translated at the same rate as the corresponding balance sheet items. Current Rate Method Under this method, all assets, liabilities, and profit and loss accounts are translated at the current rate.

43
Note 15 EXCHANGE RATE REGIMES
Dr. P.G. Apte* IMF classifies member countries into the following categories according to the exchange rate regime they have adopted.
Exchange Arrangements with no Separate Legal Tender
Under this regime a country either adopts the currency of another country as its legal tender or a group of countries share a common currency. Examples of the former arrangement are countries like Ecuador and Panama which have adopted the US dollar as their legal tender. The most prominent example of the latter category is of course the European Union the sixteen member countries of which all have Euro as their currency. In addition, a few countries which are not part of the European Union have also adopted Euro as their currency. Countries belonging to the West African Economic and Monetary Union (WAEMU) such as Niger, Mali, Senegal and those belonging to the Central African Economic and Monetary Community (CAEMU) such as Cameroon, Chad, Republic of Congo share a common currency called CFA Franc. Countries belonging to the Eastern Caribbean Currency Union (ECCU) such as Antigua and Barbuda, Grenada also have a common currency called East Caribbean dollar which in turn is pegged to the US dollar in a currency board arrangement (see below). Obviously a country adopting such a regime cannot have an independent monetary policy since its money supply is tied to the money supply of the country whose currency it has adopted or controlled by a common central bank which regulates monetary policy in all the member countries belonging to the currency union.
(2) Currency Board Arrangements
A regime under which there is a legislative commitment to exchange the domestic currency against a specified foreign currency at a fixed exchange rate coupled with restrictions on the monetary authority to ensure that this commitment will be honoured. This implies constraints on the ability of the monetary authority to manipulate domestic money supply. In its classificationfor 2006 IMF classified seven countries — Bosnia and Herzegovina, Brunei, Bulgaria, Djibouti, Estonia, HongKong and Lithuania — as having a currency board system. Of these, Estonia has recently joined the European Union and adopted Euro as its currency. However Hanke (2002) argues that none of these countries can be said to conform to all the criteria of an orthodox currency board system. According to him, legislative commitment to convert home currency into a foreign currency at a fixed rate is just one of the six characteristics of an orthodox currency board arrangement. Once again, a country with a currency board arrangement cannot have an independent monetary policy. *Professor and Former Director, IIM Bangalore.
44
(3) Conventional Fixed Peg Arrangements
This is identical to the Bretton Woods system where a country pegs its currency to another or to a basket of currencies with a band of variation not exceeding ± 1% around the central parity. The peg is adjustable at the discretion of the domestic authorities. Forty nine IMF members had this regime as of 2006. Of these, forty four had pegged their currencies to a single currency and the rest to a basket. A country can use a basket such as SDR or construct a basket consisting of currencies of countries which are its major trading partners.
(4) Pegged Exchange Rates within Horizontal Bands
Here there is a peg but variation is permitted within wider bands. It can be interpreted as a sort of compromise between a fixed peg and a floating exchange rate. Six countries had such wider band regimes in 2006.
(5) Crawling Peg
This is another variant of a limited flexibility regime. The currency is pegged to another currency or a basket but the peg is periodically adjusted. The adjustments may be pre-announced and according to a well specified criterion or discretionary in response to changes in selected quantitative indicators such as inflation rate differentials. Five countries were under such a regime in 2006.
(6) Crawling Bands
In this case, the currency is pegged, but the rate is enabled to rise and fall within a band around the peg and the bands are periodically moved up or down. This is done at regular intervals and the extent of fluctuation in rates depends on the situation in the economy.
(7) Managed Floating with no Pre-announced Path for the Exchange Rate
The central bank influences or attempts to influence the exchange rate by means of active intervention in the foreign exchange market — buying or selling foreign currency against the home currency — without any commitment to maintain the rate at any particular level or keep it on any pre-announced trajectory. Fifty three countries including India were classified as belonging to this group in 2006.
(8) Independently Floating
The exchange rate is market determined with central bank intervening only to moderate the speed of change and to prevent excessive fluctuations but not attempting to maintain it at or drive it towards any particular level. In 2008, a little over one-fifth of the member countries of IMF characterized themselves as independent floaters.
It is evident from this that unlike in the pre-1973 years, one cannot characterize the international monetary regime with a single label. A wide variety of arrangements exist and countries move from one category to another at their discretion. This has prompted some analysts to call it the international monetary “nonsystem”.
45
Note 16 TYPES OF INTANGIBLE ASSETS AND APPROACHES TO VALUATION
Types of Intangible Assets The most important types of intangible assets are:
• Brands • Publishing rights • Intellectual property • Licenses
Brands Two popular definitions of brands are given below:
“Brands enable consumers to identify products or services which promise specific benefits. They arouse expectations in the minds of customers about quality, price, purpose, and performance. A brand stands out from commodities because commodities lack identity.” (J. Hugh Davidson, Effective Marketing).
A brand is “a name, term, sign, symbol or design, or a combination of them which is intended to identify the goods or services of one seller to differentiate them from those of competitors. (Philip Kotler, Marketing Management, 4th edition, Prentice-Hall).
Publishing Rights These are rights for commercially exploiting creative and knowledge based materials. From a legal point of view, the principal publishing rights are copyrights (books, articles, photographs, illustrations, and so on), trademarks (titles of magazines, books, and so on), and get-ups (formats, appearance, and so on). Intellectual Property Intellectual property usually covers patents, trademarks, registered designs, and copyrights. The owner of an intellectual property is legally protected against its unauthorised use. A word about patents and copyrights, perhaps the two most important types of intellectual property is in order.
A patent is an invention that has commercial potential which has been granted legal protection. The owner of patent gets a monopoly right to manufacture or use the process for a certain period of time. A copyright is the right pertaining to an original literary, musical, or artistic work. It arises automatically and does not require registration, unlike a patent. The copyright lasts for the author’s lifetime plus 50 years and offers protection against unlicensed use. License A license is an agreement through which a licensor assigns certain rights to a licensee in return for a consideration.
Approaches to Valuing Intangible Assets
There are three broad approaches to valuing an intangible asset: • Cost approach • Market approach • Economic approach
46
Cost Approach According to the cost approach, the value of an intangible asset may be obtained by aggregating the costs (historical costs or replacement costs) incurred in developing the intangible asset.
While the cost approach appears to be objective, consistent, and reliable, it is not relevant for valuing intangible assets. Remember that the value of an asset must reflect the benefits that are expected from it and there is hardly any correlation between the expenditure on an intangible asset and its value. A low cost but highly productive research and development programme may generate highly valuable technical know how and patents. On the other hand, a high cost but infructous research and development programme may be worthless. Market Approach According to the market approach, the value of an intangible asset may be established with reference to the prices at which comparable assets have been traded recently in the market place.
The market approach is theoretically appealing because it is objective, credible, and relevant. However, there are practical problems in using the market approach. First, the activity in the market for intangible assets is rather limited. Second, intangible assets tend to be highly unique, making comparison rather difficult. Economic Approach According to the economic approach, the value of an intangible asset is determined by estimating the cash flows or earnings expected to be generated by the intangible asset and then capitalising it by using an appropriate discount rate or earnings multiple.
Out of the three approaches to valuation of intangibles, the economic approach is the most widely used. So, it is discussed as some length below.
47
Note 17 THE ECONOMIC APPROACH TO VALUATION
Several methodologies are used to value an intangible asset on the basis of economic value. These methodologies involve two broad steps:
1. Estimate the cash flow/ earnings. 2. Capitalise the cash flows/ earnings.
Estimate the Cash Flow / Earnings The cash flows/ earnings associated with an intangible asset may be estimated in the following ways:
• Direct identification method • Brand contribution method • Royalty method
Direct Identification Method If the only significant asset of the business is the intangible asset, it is possible to readily identify the cash flows/ earnings associated with the intangible asset. Examples of this are the earnings/ cash flows generated by a library of film, music, or copyrights. Brand Contribution Method The brand contribution represents the profit or cash flow generated by an intangible asset which is in excess of the profit generated by the underlying business. There are four methods commonly used for estimating the brand contribution: utility cost method, return on capital method, premium profits method, and retail premium method.
Under the utility cost method, the gross contribution of a brand is estimated by subtracting from the turnover generated by the branded product/ service the ‘utility’ cost charged by manufacturers of unbranded products or providers of unbranded services. From the gross brand contribution, marketing costs, other overheads, and taxes are deducted to arrive at the brand contribution after tax.
Under the return on capital method, an appropriate remuneration on capital employed is
deducted from the earnings of the business to identify the brand earnings. By deducting a return on capital, the value added by other assets of the firm such as fixed assets and net working capital is eliminated.
Under the premium profits method an attempt is made to quantify the excess returns
attributable to the intangible assets. The steps involved in applying this method are: (i) Calculate the current fair market value of the net tangible assets. (ii) Assess the return required by a knowledgeable investor from the tangible assets of the business. (iii) Figure out the excess return that is attributable to intangible assets. This is the difference between the return obtained by the branded product manufacturer and the return required from the tangible assets of the business.
48
Under the retail premium method, brand earnings are equated with the price premium commanded by a branded product or service over and above that of an unbranded product or service. The steps involved in applying this method are: (i) Estimate the gross retail premium attributable to the brand as the difference between the average retail price of the branded product or service and the average retail price of the unbranded equivalent. (ii) From the gross retail premium, deduct incremental costs incurred for the branded product to sustain the premium and arrive at the retail premium before tax. (iii) Finally, deduct taxes from the retail premium before tax to get the retail premium after tax. Royalty Method Under the royalty method, you ask the question: What is the estimated post-tax royalty (after deducting the costs associated with maintaining the licensing arrangements) that can be earned from the intangible asset under a hypothetical licensing arrangement? To answer this question, you have to get a handle over: (i) the turnover that the intangible asset is expected to generate, (ii) the royalty rate, and (iii) the cost of maintaining the licensing arrangement. Capitalise the Cash Flows / Earnings Once the cash flows / earnings associated with an intangible asset have been estimated, the next step is to convert them into a capital value. The two commonly used methods of doing this are:
• Discounted cash flow method • Earnings multiple method
Discounted Cash Flow Method According to the discounted cash flow method, the value of an intangible asset is equal to the present value of the net cash flows expected to be generated by the asset. The discount rate used for calculating the present value is the weighted average cost of capital, reflecting the business and financial risks associated with the investment. Earnings Multiple Method According to the earnings multiple method, the value of an intangible asset is estimated by multiplying the earnings attributable to that intangible asset by a suitable earnings multiple (PE ratio).
The earnings multiple method is commonly used in valuation exercises. A business firm may be valued by looking at the PE (price-earnings) ratio for comparable companies and applying it to the earnings of the firm to be valued. The scope for applying the earnings multiple method to intangible assets may be somewhat limited because there are very few transactions involving the sale of intangible assets separated from the underlying business. Illustration of the Royalty Method The royalty method of intangible asset valuation is commonly used for valuing brands, patents, licenses, and franchises. The value of the intangible asset under this method is the capitalised value of the royalties associated with the asset. Exhibit gives an illustration of this method.

�
�
Exhibit 1
Illustration of the Royalty Method
20 X 0 20 X 1 20 X 2 20 X 3 20 X 4 20 X 5 20 X 6 20 X 7 20 X 8 Residual Turnover 500,000 560,000 627,200 702,464 786,760 849,700 917,676 991,091 1070,378 1070,378 Royalty income @ 5% 25,000 28,000 31,360 35,123 39,338 42,485 45,884 49,555 53,519 Taxation @ 30% 7,500 8,400 9,408 10,537 11,801 12,746 13,765 14,866 16,056 Post-tax royalty income
17,500 19,600 21,952 24,586 27,537 29,740 32,119 34,689 37,463 340,573
Discount factor @ 11%
0.901 0.812 0.731 0.659 0.593 0.535 0.482 0.434 0.391 0.391
Net present value 15,768 15,915 16,047 16,202 16,329 15,911 15,481 15,055 14,648 133,164 Net present value of the royalty stream
274,520
The royalty receivable in perpetuity beyond 20 X 8 is 37,463. So its value as at the end of year 20 X 8 is: 37,463/ 0.11 = 340573. Assumptions (i) Turnover will grow at 12% between 20X0 and 20X4 and at 8% between 20X4 and 20X8.
Beyond 20X8 the growth rate will be nil. (ii) All amounts are stated in nominal terms. (iii) The cost of maintaining the licensing arrangement is negligible.
50
Note 18 INFOSYS TECHNOLOGIES: AN EXEMPLAR INTANGIBLE -
INTENSIVE COMPANY1 Infosys was set up in July 1981 by Narayana Murthy and associates who shared a dream of building a world class IT services organisation. Infosys has emerged as a leading global IT services company, headquartered in Bangalore, India, with a turnover that is expected to be about $5 billion in 2010-2011. It provides end-to-end business solutions that leverage technology to enable their clients to enhance business performance. Its solutions span the entire software life cycle encompassing consulting, design, development, re-engineering, maintenance, systems integration, package evaluation, and maintenance. In addition, it offers software products for the banking sector and business process management services through its wholly-owned subsidiary, Infosys BPO.
Infosys has become the icon of modern India. Its achievements are nonpareil. No company in
India has won so many laurels and awards for its multi-faceted accomplishments in so short a time. Exhibit 1 lists some of the awards received by Infosys in 2002-03.
Exhibit 1
A List of Select Awards Received by Infosys Technologies During the Year 2002-03
• Ranked the Best Employer in India by Business Today — Hewitt in their annual survey. • Ranked as the Best Managed Company in India by Asia Money. • Received the Best Annual Report award of the Institute of Chartered Accountants of
India for seventh successive year. • Ranked No.1 among Asia’s Leading Companies in India by Far Eastern Economic
Review. • Rated the Most Globally Competitive Company, Most Dynamic Company, Most Ethical
Company and Best IT Company by Business World.
Stellar Performance Set up in July 1981 with a nominal capital of Rs.10,000, Infosys has achieved phenomenal growth in revenues, profit, and market capitalisation over time. Selective financial data is given below for three years, viz., 1981-1982 (the first year of the company’s existence), 1993-94 (the year after the company made its IPO), and 2002-03 (the last financial year).
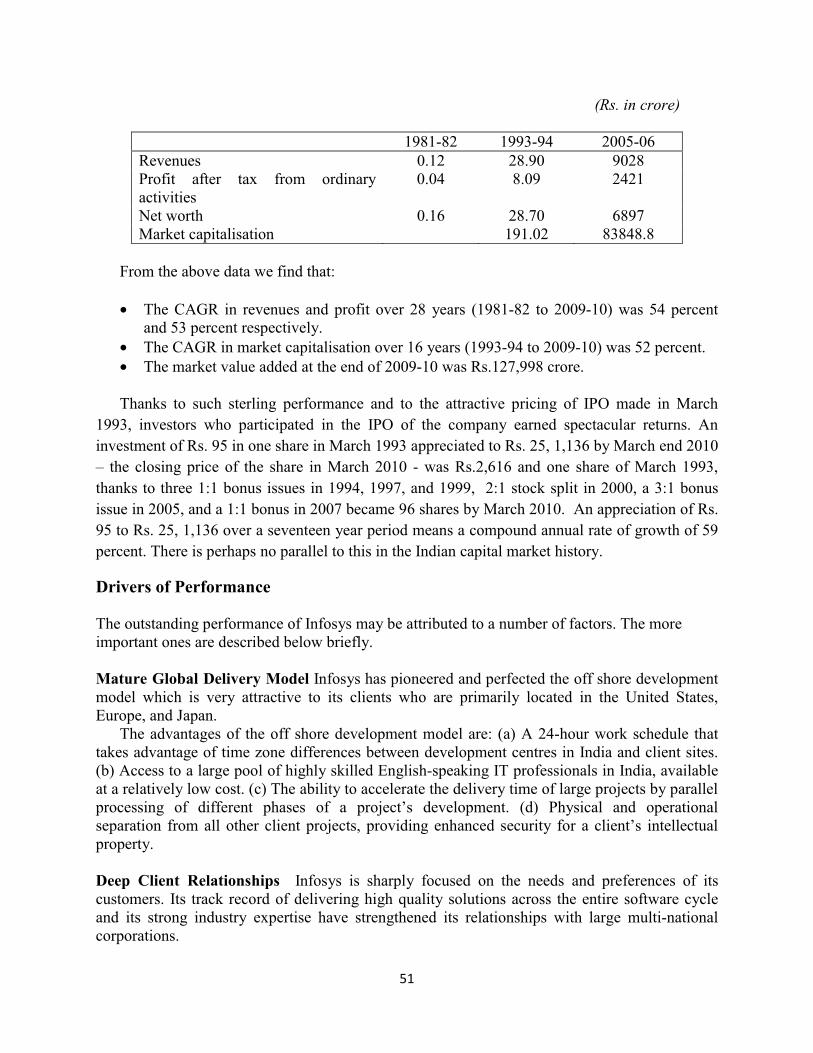
51
(Rs. in crore)
From the above data we find that: • The CAGR in revenues and profit over 28 years (1981-82 to 2009-10) was 54 percent
and 53 percent respectively. • The CAGR in market capitalisation over 16 years (1993-94 to 2009-10) was 52 percent. • The market value added at the end of 2009-10 was Rs.127,998 crore. Thanks to such sterling performance and to the attractive pricing of IPO made in March
1993, investors who participated in the IPO of the company earned spectacular returns. An investment of Rs. 95 in one share in March 1993 appreciated to Rs. 25, 1,136 by March end 2010 — the closing price of the share in March 2010 - was Rs.2,616 and one share of March 1993, thanks to three 1:1 bonus issues in 1994, 1997, and 1999, 2:1 stock split in 2000, a 3:1 bonus issue in 2005, and a 1:1 bonus in 2007 became 96 shares by March 2010. An appreciation of Rs. 95 to Rs. 25, 1,136 over a seventeen year period means a compound annual rate of growth of 59 percent. There is perhaps no parallel to this in the Indian capital market history.
Drivers of Performance The outstanding performance of Infosys may be attributed to a number of factors. The more important ones are described below briefly. Mature Global Delivery Model Infosys has pioneered and perfected the off shore development model which is very attractive to its clients who are primarily located in the United States, Europe, and Japan.
The advantages of the off shore development model are: (a) A 24-hour work schedule that takes advantage of time zone differences between development centres in India and client sites. (b) Access to a large pool of highly skilled English-speaking IT professionals in India, available at a relatively low cost. (c) The ability to accelerate the delivery time of large projects by parallel processing of different phases of a project’s development. (d) Physical and operational separation from all other client projects, providing enhanced security for a client’s intellectual property. Deep Client Relationships Infosys is sharply focused on the needs and preferences of its customers. Its track record of delivering high quality solutions across the entire software cycle and its strong industry expertise have strengthened its relationships with large multi-national corporations.
1981-82 1993-94 2005-06 Revenues 0.12 28.90 9028 Profit after tax from ordinary activities
0.04 8.09 2421
Net worth 0.16 28.70 6897 Market capitalisation 191.02 83848.8
52
Sound Systems and Processes Infosys has laid a lot of emphasis on developing sound systems and processes in various areas such as marketing, project management, delivery, quality, human resources, finance, and technical support.
Inter alia, it has been successfully assessed at Level 5 of the Integrated Capability Maturity Model (SEI — CMMI) developed by the Software Engineering Institute (SEI) at Carnegie Mellon University, U.S. This is a reflection of the maturity and effectiveness of its software processes. The company has also been assessed at Level 5 of the People Capability Maturity Model (PCMM), a testimony of the strong process orientation in its human resources management.
Conducive Work Environment Since the success of Infosys depends on its ability to attract and retain highly talented IT professionals, Infosys pays considerable attention to creating a quality work environment, imparting training, providing challenging assignments, fostering a collegial atmosphere and informal culture, and encouraging free flow of ideas.
Infosys has displayed remarkable foresight in introducing one of the most comprehensive stock option plans in India. The plan has been a very effective instrument to motivate employees, provide long-term incentives for value creation, and induce a sense of ownership among employees. Integrated Performance Management Infosys has an integrated performance management system that sets challenging targets, facilitates objectives-driven appraisal, and links the variable component of the compensation package to individual, unit, and company performance. All this fosters a culture of high performance work ethic. Comprehensive Risk Management Infosys has a very comprehensive approach to risk management. The thrust of its risk management practice is to prevent undue concentration of revenues in any one service, client, industry, or geography, hedge against exchange rate risk, eschew debt, maintain strong liquidity, comply with all legal and statutory requirements, develop strong processes and systems, instill proper financial responsibility, and ensure disaster recovery and business continuity plans for all its operations. Evolved Corporate Governance Infosys firmly believes in aligning the interest of managers with shareholders, complying with the laws in all the countries in which it operates, communicating candidly about how the company is run, and maintaining high standards of transparency and disclosure. The Annual Report of Infosys provides a wealth of information, much beyond what is required statutorily.
The high standards of corporate governance and transparency at Infosys and the quality of its illustrious board instill confidence in investors, both institutional and individual. Combined with the excellent liquidity enjoyed by Infosys shares, this gets translated into a lower cost of capital for the company. Favourable Tax Environment Infosys has benefited from a variety of tax incentives given to software firms in India. These include relief from import duties on hardware, tax exemption for income derived from software, and tax holidays and infrastructure support for companies operating in specially designed “Software Technology Parks”.
53
Management: The Key Force Infosys has set an inspiring vision, pursued a well-crafted strategy of leveraging on the off-shore development model, raised capital economically, invested judiciously in infrastructure, technology, systems, processes, human resources, and brand development, established an effective approach to performance management, managed growth effectively, developed a sound risk management system, and communicated superbly with investors.
All this has been driven by the outstanding leadership and management of the firm who take a balanced approach to the multiple facets of business. The cohesive leadership provided by the founders who strongly share certain values and aspirations, the calibre and talent of its management team, the pattern of ownership and control, and the organisational architecture that instills a value orientation seem to be the foundation for the outstanding performance of this jewel of modern India.
54
Note 19 HEDGING WITH REAL TOOLS AND OPTIONS
While financial derivatives like forwards, futures, swaps, and options are helpful in managing risk exposure, there are various ways of dealing with risk without using derivative contracts. These include conventional approaches and real options such as the following: • Diversify product line and services to reduce economic risks. • Invest in preventive maintenance to mitigate technological risks. • Emphasise quality control to reduce product liability arising from defective products. • Build flexible production systems which can switch between inputs to cope with input
cost risk. • Shorten the time required to get the product to market to deal with competition risk. • Delay investment until some portion of uncertainty is resolved. • Stage R & D investments rather than make huge commitments in one shot. • Hold inventory of production inputs or outputs to hedge supply chain risk. • Contract or abandon unpromising projects and products. • Increase outsourcing to decrease the proportion of fixed costs. • Carry extra liquidity on the balance sheet to tide over difficult periods. • Maintain reserve borrowing power to meet future contingencies. • Locate plants abroad to cope with currency risks. • Build adequate incentives and penalties in contracts with suppliers, customers, sub-
contractors, and others to reduce performance risk. Real versus Financial Options An Indian firm earns one-half of its revenues abroad (mainly in the U S), but presently has production facilities only in India. As the rupee strengthens relative to the U S dollar, its profit margin shrinks. Further, the U S competitors can lower the prices and hurt its sales in the U S.
The Indian firm can help its risks by selling US dollars futures (or forward contracts) or buying US dollar put options. Alternatively, it can set up production facilities in the U S. Which option, real or financial, makes sense? In addressing this issue, bear in mind the following.
1. Real options cost a great deal: the firm must set up plants abroad, reconfigure its supply
chain, forego economies of scale, maintain surplus capacity at several plants, and incur switching costs. However, when exchange rates are highly volatile and plants have a long life, it is even more expensive to buy financial options that can replicate the long-run competitive edge provided by the real options. As A.J. Triantis put it: "Since financial markets are generally considered to be more efficient than the market for real assets, it is more likely that additional value (over and above the benefits of hedging) will come from creating real options rather than purchasing financial options." This is more so when the firm can leverage its existing capabilities as well its reputation in creating real options.
2. In some cases, real options may be the only viable means to handle risks. For example, technological risks, economic risks, performance risks, and statutory risks cannot be easily managed with the help of financial contracts. Perhaps the option to wait before

55
investing and the option to abandon the project may be the only practical way to handle such risks.
3. Real options are far less liquid than financial options. It takes time to acquire as well as dispose off real options, whereas financial contracts can be easily traded. Financial options enable a firm to alter its position quickly and inexpensively. As A.J. Triantis put it: "This is particularly valuable if the firm manages risk based in part on its views of future market conditions, which may change over time. However, this benefit can quickly turn into a major liability if the firm is unable to carefully monitor its traders."
4. A firm that enjoys real options may profit from assuming more risk. For example, a firm that has a flexible production plant can benefit more by manufacturing products subject to high price volatility. An R & D programme (which is a bundle of real options) is more valuable if the firm aims at blockbuster drugs, even though the probability of success is low. As Merck's CFO Judy Lewent put it: "the route to success is to put more money at risk."

56
Note 20 CASE STUDIES IN RISK MANAGEMENT
Each company has to hammer out its approach to risk management taking into account its specific circumstances. Here is a brief description of how two leading companies in India have fashioned their strategy toward risk management.
Infosys Technologies Limited Infosys Technologies Limited, regarded by many as an icon of modern India, has an integrated risk management in which the Board Directors is responsible for monitoring the risk levels and the Management Council is responsible for implementing risk mitigation measures6.
To systematically manage risks Infosys classifies risks into five broad areas: • Business portfolio risks • Financial risks • Legal and statutory risks • Internal process risks • Political risks
The key initiatives and measures taken by Infosys for prudent risk management are summarised below:
Business Portfolio Risks • Restrict business from any single service offering to 25 percent of total revenues • Limit the revenues from any single client to 10 percent of total revenue • Proactively look for business opportunities in new geographical areas to increase their
contribution to total revenues • Closely monitor the proportions of revenue from various vertical domains and focus
marketing efforts in chosen domains • Solicit business from sunrise technologies to keep the risk of technology concentration
within manageable limits. Business Portfolio Risks
• Restrict business from any single service offering to 25 percent of total revenues • Limit the revenues from any single client to 10 percent of total revenue • Proactively look for business opportunities in new geographical areas to increase their
contribution to total revenues • Closely monitor the proportions of revenue from various vertical domains and focus
marketing efforts in chosen domains • Solicit business from sunrise technologies to keep the risk of technology concentration
within manageable limits.
5 The Tariff Advisory Committee (General Insurance) is a statutory body which was set up in 1968, by an amendment to the Insurance Act, with two primary objectives: (i) to ensure an equitable rate structure in the General Insurance Industry, and (ii) to ensure that the same premium is charged for risks of essentially the same hazards. The TAC has developed safety standards for industrial plants in India.
6 The description of risk management in Infosys is based on the information provided in the Annual Report of Infosys for 1998-1999.
57
Financial Risks
• Avoid active trading positions in the foreign currency markets • Hedge a portion of dollar receivables in the forward market • Maintain a highly liquid balance sheet in which liquid assets are around 25 per cent of
revenues and 40 per cent of total assets • Eschew debt or use debt financing only for short-term purposes.
Legal and Statutory Risks
• Clearly chart out a review and documentation process for contracts • Take sufficient insurance abroad to cover possible liabilities arising out of non-
performance of the contract • Avoid contracts which have open ended legal obligations. • Have a compliance officer to advise the company on compliance issues with respect to
the laws of various jurisdictions and ensure that the company is not in violation of the laws.
Internal Process Risks
• Adopt ISO 9001 and CMM Level 5 quality standards • Document and disseminate experienced knowledge • Create a favourable work environment, encourage innovation, practice meritocracy, and
develop a well-balanced compensation plan (that includes ESOP) to attract and retain people.
• Make appropriate investments in technology.
Political Risks
• Explore the possibility of establishing development centres in countries other than India. Tata Iron and Steel Company Tata Iron and Steel Company (TISCO), a manufacturer of steel and steel products, is exposed to a high degree of cyclicality and price fluctuation due to the very nature of its business. In the last few years TISCO has made concerted efforts to mitigate its risks. The key elements in its derisking strategy are: branding, diversification into high value segments, globalisation and geographic diversification.
Tisco has sought to achieve some measure of differentiation through branding. More than 80 percent of its distributed steel products are branded. Its constructions steel is branded as Tiscon, its galvanised sheets as Tata Shaktee, and its steel pipes as Tata Pipes.
Tisco has diversified into high value segments such as auto skins, white good sheets, and
carbon wire rods.
58
Tisco has embarked on a programme of globalisation and geographic diversification. It has acquired Nat Steel, a Singapore based firm, and Millenium Steel, a Thailand based firm. It is setting up a ferrochrome project in South Africa. Its strategy is to expand its geographic reach and to put the right part of the value chain in the right place and link it up properly. For example, semi-finished steel is produced at Jamshedpur and finished steel at Nat Steel for Asian Markets.
Derisking R & D Efforts
In order to mitigate the risks of its R & D efforts, Dr. Reddy's Laboratories (DRL) entered into an agreement with ICICI Ventures for developing and selling products through the ANDA (abbreviated new drug application) route. Under the agreement, DRL would receive $56 million from ICICI Ventures for development, registration, and legal costs relating to ANDAs to be filed in the US in 2004-2006. Once the products start generating revenue, ICICI will receive a royalty on sales for five years. The objective of the deal is to share risks and profits.
59
Note 21 FINANCIAL INNOVATIONS
From the early 1970s there has been an explosive growth in financial innovations. Here is a partial list of important novelties: • Eurodollar accounts • Forward rate agreements • Zero coupon bonds • Commodity bonds • Negotiable certificates of Deposits • Puttable and callable bonds • NOW accounts • Indexed linked gilts • Variable life insurance • Interest rate swaps • Money market mutual funds • Currency swaps • Index funds • Shelf registration process • Options • Electronic funds transfer system • Financial futures • Screen based trading • Options on futures • Leveraged buyouts • Options on indexes This appendix explores various aspects of financial innovations. It is divided into four sections: • What and why of financial innovations • Type of financial innovations • Financial innovations in India • Excesses 1. WHAT AND WHY OF FINANCIAL INNOVATIONS Miller, Silber, and Van Horne characterise and analyse financial innovations somewhat differently. Miller describes financial innovations as unanticipated improvements in the array of financial products and instruments that are stimulated by unexpected tax or regulatory impulses. He cites the following examples1.
• The Eurobond market emerged in response to a 30 percent withholding tax imposed by the US Government on interest payments on bonds sold in the US to overseas investors.
• Zero coupon bonds were offered to exploit a mistake of the Internal Revenue Service in the US which permitted deduction of the same amount each year for tax purposes.( Put differently, the Internal Revenue Service employed simple interest, not compound interest.)
• Financial futures came into being when the Bretton Woods system of fixed exchange rates was abandoned in the early 1970s.
• Paper currency, in a sense the most fundamental financial instrument, was invented when the British Government prohibited the minting of coins by the colonial North America.
• The Eurodollar market developed in response to Regulation Q in the US that imposed a ceiling on the interest rate payable on time deposits with commercial banks.
60
• Financial swaps emerged initially in response to a restriction imposed by the British Government on dollar financing by British firms and sterling financing by non-British firms.
Since taxes and regulation have triggered a number of major financial innovations, Miller
likens them to the grains of sand that irritate the oyster to produce the pearls of financial innovation.
Silber2 looks at financial innovations differently from Miller. He considers innovative financial instruments and processes as devices used by companies to reduce the financial constraints faced by them. Firms, he argues, maximise utility under certain constraints, some dictated by governmental regulation, some defined by the market place, and some self-imposed. Financial innovations seek to reduce the cost of complying with these constraints. Here are two examples.
• A lot of effort has gone into the designing of capital notes, which are essentially debt
instruments but are treated as ‘capital’ for the purposes of bank regulation. • Highly volatile interest rates enhanced the cost of following a policy of investing in fixed
dividend rate preferred stock. This stimulated the development of various forms of adjustable rate preferred stock.
Silber’s constraint-induced model of innovation explains well a large proportion of
commercial bank products. Yet it offers only a partial view of financial innovation as its focus is almost wholly on the issuers of securities, not the investors in securities.
Van Horne3 views a new financial instrument or process as innovative, if it makes the
financial markets more efficient and/or complete. A financial innovation makes the market more efficient if it reduces transaction costs or lowers differential taxes or diminishes ‘deadweight’ losses. A financial innovation makes the market more complete if its after-tax market is one where every contingency in the world is matched by a distinct marketable security.. The sheer number of securities required to span every possible contingency suggests that the market is bound to be incomplete in some way or the other. In such a market, there are unfulfilled investor needs. Hence, there is scope for designing securities to satisfy investor desires with respect to maturity, interest rate, protection, cash flow characteristics, put feature, or some other attribute.
According to Van Horne the following factors prompt financial innovation: volatile inflation
and interest rates, regulatory changes, tax changes, technological advances, the level of economic activity, and academic work on market efficiency and inefficiency.
Collectively, the Miller, Silber, and Van Horne papers suggest that the following factors
drive financial innovations:
1 M.H.Miller, “Financial Innovation: The Last Twenty Years and the Next”, Journal of Financial and Quantitative Analysis, December 1986.
2 W.L. Silber, “The Process of Financial Innovation”, American Economic Review, May 1983, pp. 89-95. 3 J.C. Van Horne, “Of Financial Innovations and Excesses”, Journal of Finance, July 1985, pp. 624-631.
61
• Tax asymmetry • Regulatory or legislative changes • Volatility of financial prices • Transaction costs • Agency costs • Opportunities to reduce some form of risk or reallocate risk • Opportunities to increase an asset’s liquidity • Academic work • Accounting benefit • Technological advances • Level of economic activity
2. TYPES OF FINANCIAL INNOVATIONS Financial innovations may be divided into the following categories:
Category Example A. Consumer-type instruments • Variable life insurance policy • Money market mutual fund B. Securities • Zero coupon bond • Indexed — linked gilts C. Derivative securities • Options • Futures D. Process • Shelf registration process • Screen — based trading E. Creative solutions to a financial • Project financing problem • Leveraged buyout
Since categories A, B and C represent financial products, we may broadly define a financial innovation as a new product or a new process or a creative solution to a financial problem. 3. FINANCIAL INNOVATIONS IN INDIA Till the mid — 1980s, the Indian financial system did not see much innovation. In the last two decades, financial innovation in India has picked up and it is expected to grow in the years to come, as a more liberalised environment affords greater scope for financial innovation.
The important financial innovations that have taken place in India are listed below along with the principal factor which motivated it or fuelled its growth.
Innovation Principal Motivating Factor
• Debt-oriented schemes of mutual funds • Tax benefit • Partially convertible debentures and
fully convertible debentures • Pricing and interest rate regulation
obtaining under the Capital Issues Control Act
62
• Deep discount / Zero coupon bonds • Tax benefit • Puttable and callable bonds • Perceived volatility of interest rates • Stock index futures • Volatility of equity prices • Badla transactions • Restriction on forward trading • Ready forwards • Restrictions under the portfolio
management scheme • Havala transactions • RBI restrictions • Interest rate caps/floors/collars • Volatility of interest rates • Interest rate swaps • Volatility of interest rates • Currency swaps • Volatility of foreign exchange rates • Forward rate agreements • Volatility of interest rates • Automated teller machines • Technology • Screen-based trading • Technology • Floating rate bonds • Volatility of interest rates • Electronic funds transfer • Technology • Money market mutual funds • Volatility of interest rates • Specialised mutual funds • Investor preferences • Exchange-traded options • Volatility of stock prices • Project finance • Risk sharing
4. EXCESSES The frenetic pace of financial innovations, particularly in the US, has been viewed by some with skepticism. Michael Keenan has articulated this concern very well.
“Some are beginning to believe that the last half of the 1980’s will be known in the securities industry as the period when professionals lost track of what they were trying to sell. There have been literally thousands of new instruments created in recent years from the basic spectrum of stocks-bonds-insurance features—options-futures-indexes. No one knows how many instruments are traded; No one agency has supervisory control of all these instruments; No one knows the risk-return characteristics of many of these instruments; No one has studied the portfolio interrelationships of them all; No one has studied how many of these derivative instruments should be valued relative to the base instrument, or how it might be affecting the base instrument (Example: How would an option on a futures guaranteed mortgage package relate to the writing of current mortgage?”4
An allied view has been voiced by Van Horne. “Understandably the promoter wishes to make a profit regardless of whether an idea has
substance. As long as people believe the proposal is a panacea for certain ills, promoters will exploit the opportunity. However, I find disturbing the case being made for such things as: defeasance; certain interest-rate swaps; schemes to dedicate bond portfolio in such a way as to make money out of defined benefit pension plan; financial institutions issuing put options against new and existing bonds in order to alter accounting income; equity-for-debt swaps; the sale of high-yield (junk) bonds to savings and loans associations; and LBOs whether financed with
63
loans or junk bonds. Many are designed to produce accounting profits with little or economic gains”5.
In essence, Keenan and Van Horne suggest that the enthusiasm for financial innovation
seems to have resulted in excesses. Are these excess in the nature of bubbles or balloons? Van Horne thinks that they are in the nature of balloons. This is what he says: “A balloon might be a better metaphor for certain financial promotions. It is blown up to be sure, but not to the extent it pops. The eventual deflation is less abrupt”.
Clearly there can be excesses which tend to be costly. The costs may be in the nature of out-
of-pocket expenses paid to promoters and investment bankers. More important, they are in the nature of misallocation of resources.
In an ideal world of completely rational expectations, there is no scope for financial excesses. However, the real world is characterised by irrationality which permits such excesses to occur.
How can such excesses be checked? It is naïve to think that the promoters of new financial
products will exercise self-restraint. After all, they are driven primarily by the profit motive. Policing by a regulatory body, too, is not a solution, as it is likely to stifle worthwhile innovation and breed corruption. The ultimate discipline has to come from the market-an informed market which responds sensibly to the torrent of financial innovation.
4 W. Michael Keena, “The Securities Industry: Securities Trading and Investment Banking,” Handbook of Financial Market and Institutions, (ed.), E.I. Altman, John Wiley & Sons, New York.
5 Van Horpe, op.cit.
64
Note 22 FINANCIAL ENGINEERING AND CORPORATE STRATEGY
Financial engineering can be employed to solve the problem complex business problems and advance corporate strategy. In an interesting article, Peter Tufano3 presented five case studies illustrating how companies used financial engineering to sharpen their competitive edge. Two of them are summarised below. Controlling Volatility: Enron Capital and Trade Resources
From 1938 to 1978, the price of natural gas in the US was under regulatory control and hence there was scarcely any need or incentive for producers and distributors of natural gas or electricity to differentiate their products. From the late 1970s price controls were lifted and natural gas prices became very volatile - on occasions they were four times as volatile as the Standard & Poor's 500 index. The managers of Enron Capital and Trade Resources (ECT) - a subsidiary of Enron Corporation of Houston, Texas a diversified energy company - perceived a business opportunity in the volatile natural gas market. They envisioned creating a "gas bank" which would act as an intermediary between buyers and sellers, enabling them to shed their risks. In essence, ECT managers thought of bundling methane molecule with reliable deliveries and predictable prices into packages that appealed to buyers. Accordingly they designed a series of products called Enfolio Gas Resource Agreements, basically gas supply contracts customised in terms of quantity, time period, price index, and settlement terms. Three important products were Enfolio GasBank which assured a fixed volume at a fixed price, Enfolio Index which guaranteed a fixed volume at a price linked to natural gas price, and Enfolio GasCap which offered a fixed volume at a price linked to natural gas index but subject to a pre-determined cap.
ECT's risk managers were entrusted with the task of developing a hedging strategy that minimised ECTs net gas exposure. ECT invested millions of dollars in hardware and software and employed hundreds of trained personnel to manage its gas price risk exposure. ECT's success, reflected in market share as well as profits, showed how financial engineers, working in tandem with strategists and marketeers, can effectively differentiate a commodity product without exposing the firm to undue risks.
Adding Capacity with Virtual Bricks and Mortar: TVA The Tennessee Valley Authority (TVA) was set up in 1933 by the US Congress to produce electricity for the south eastern US. TVA built hydroelectric dams, coal-fired- steam and nuclear power plants to generate power. By mid-1994, TVA's demand forecasts suggested that it would have to add capacity requiring substantial outlays. TVA's ability to raise funds for creating new capacity seemed limited because the US Congress had imposed a debt ceiling of $30 billion on TVA and TVA's debt had already reached a level of $26 billion by 1994 (Internally, TVA had set a ceiling 10 percent lower than the ceiling imposed by the US Congress).

65
Fortunately, in the wake of deregulation, electricity could be bought and sold for spot or future delivery. Hence, it was possible for TVA to buy long term fixed price and fixed quantity contracts. This required only a small upfront payment and eliminated the need for making large investments in new generating plants. However, such a strategy would not solve the problem of uncertain demand - when and how much power should TVA buy?
Faced with this situation, members of the Customer Planning Group at TVA wondered in
early 1994 whether TVA could buy call options on power. Options would create a virtual power plant for TVA. TVA requested proposals for option purchase agreements (OPAs) in July 1994.
To its pleasant surprise it received 138 bids totaling 22000 megawatt power. TVA evaluated,
shortlisted, and negotiated a number of OPAs. Thanks to these OPAs, TVA effectively augmented its capacity without physically building power plants. It became evident that the financial engineers who structured, valued, and managed these portfolios of option contracts were as valuable as engineers who designed hydroelectric, coal, and nuclear power plants.
3 Peter Tufano "How Financial Engineering Can Advance Corporate Strategy," Harvard Business Review, January-February 1996.

66
• Twenty three supplementary notes on the following topics: ‘Revised Schedule VI of the
Companies Act,’ ‘Equity as a Call Option,’ ‘Risky Debt and Options,’ ‘Dilution,’ ‘Merton Miller’s Argument,’ ‘Capital Structure Policies in Practice,’ ‘Bharat Hotels Company : A Case Study in Corporate Valuation,’ ‘Equivalence of the Two Formulae,’ ‘Marakon Approach to Value Based Management,’ ‘Mckinsey Approach to Value Based Management,’ ‘Dynamics of Restructuring,’ ‘Corporate Governance in Developed World,’ ‘The Case for Indexed Options,’ ‘Strategic Performance Measurement : Evolving Practice,’ ‘Translation Methods,’ ‘Exchange Rate Regimes,’ ‘Types of Intangible Assets and Approaches to Valuation,’ ‘The Economic Approach to Valuation,’ ‘Infosys Technologies : An Exemplar Intangible-Intensive Company,’ ‘Hedging with Real Tools and Options,’ ‘Case Studies in Risk Management,’ ‘Financial Innovations,’ ‘Financial Engineering and Corporate Strategy.’

Filename: SUPPLEMENTARY NOTES Directory: C:\Documents and
Settings\ashwini\Desktop\dr_prasannachandrafmcdmaterial Template: C:\Documents and Settings\ashwini\Application
Data\Microsoft\Templates\Normal.dotm Title: Subject: Author: Computer Keywords: Comments: Creation Date: 2/14/2011 2:18:00 AM Change Number: 49 Last Saved On: 3/29/2011 5:36:00 AM Last Saved By: Computer Total Editing Time: 654 Minutes Last Printed On: 4/15/2011 5:57:00 PM As of Last Complete Printing Number of Pages: 67 Number of Words: 19,149 (approx.) Number of Characters: 109,155 (approx.)


![notes NOTES ]” BACKGROUND](https://img.pdfslide.us/doc/110x75/61bd44c661276e740b111621/notes-notes-background.jpg)