Embed Size (px)
DESCRIPTION
Supply, Demand, and Equilibrium. Today: An introduction to supply and demand, and how they relate to equilibrium. Who is very hungry and likes bananas?. All the bananas you care to eat for one person (up to however many I have) NOT extra credit, since you get free bananas - PowerPoint PPT Presentation
Citation preview
Supply, Demand, and Equilibrium
Today: An introduction to supply and demand, and how
they relate to equilibrium
Who is very hungry and likes bananas? All the bananas you care to eat for one
person (up to however many I have) NOT extra credit, since you get free bananas
You are eating bananas at your own risk You are not allowed to share bananas
with anyone else Please report to me how many bananas
you eat in about 40 minutes
Previously The 7 Core Principles Thinking like an economist Marginal cost and benefit Working with graphs
Today: Markets Supply, demand, and equilibrium What causes shifts in supply and
demand? What happens when supply and/or
demand shifts?
Central organization versus Markets Central economic organization is
rare today Most economic activity today
occurs in markets Markets do fail sometimes, but this
is the focus of other chapters (e.g. Chapters 8 and 10)
Markets Markets consist of buyers and sellers Assume many buyers and many
sellers Fractional amounts of goods can be
produced We will talk about supply and
demand for most markets Exceptions will be dealt with accordingly
as we get to them
Core principle related to demand Cost-benefit analysis
Recall energy drinks example Think “reservation price” when you think
“willingness to pay” (“WTP”)
Demand Demand states how much of a
good that buyers are willing to purchase given each price
Demand is typically shown on a graph, but it is occasionally displayed on a table
Demand A fundamental characteristic of demand is
that as the price of a good increases, demand typically goes down (all else constant) Recall that WTP for energy drinks decreases as
you consume more Thus, each demand curve is downward
sloping if we graphed it By convention, quantity is on the horizontal
axis and price on the vertical axis
Core principles related to supply Increasing opportunity cost
We want to produce at the lowest cost for each additional unit
Also called “low-hanging-fruit” principle Incentive principle
Businesses will supply less when some units are not profitable
Businesses will supply more when producing more could lead to higher profits
Supply Supply states how much of a good
that sellers are willing to sell given each price
Similar to demand, supply is typically shown on a graph
Supply Low-cost sellers typically enter a
market before high-cost sellers Thus, we would expect that the
sellers with lowest cost to sell a particular good
Supply is then assumed to be upward sloping
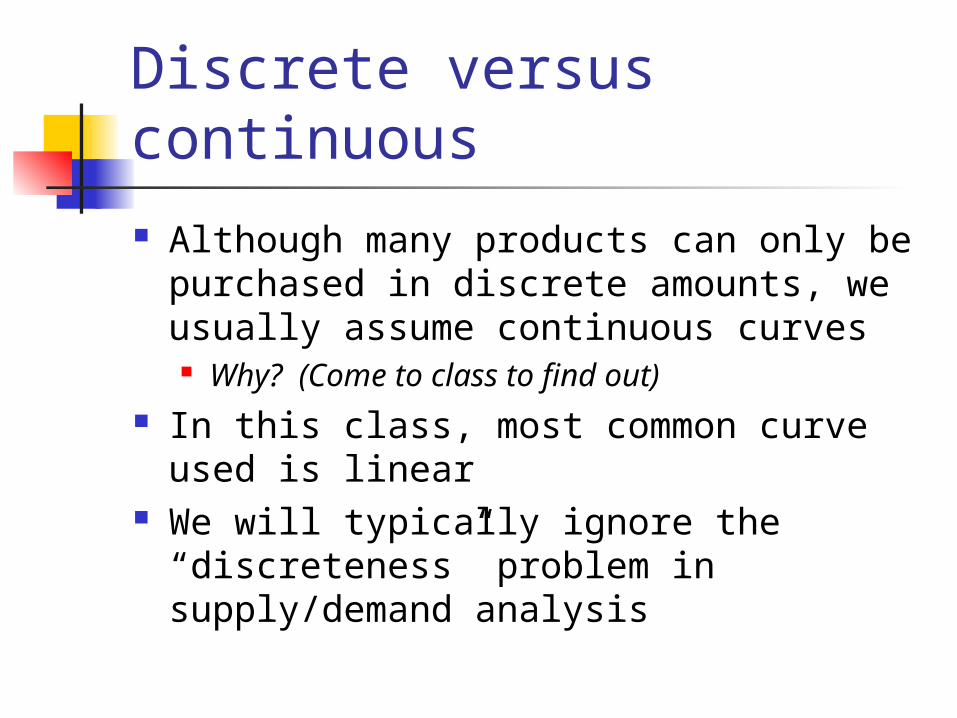
Discrete versus continuous Although many products can only be
purchased in discrete amounts, we usually assume continuous curves Why? (Come to class to find out)
In this class, most common curve used is linear
We will typically ignore the “discreteness” problem in supply/demand analysis
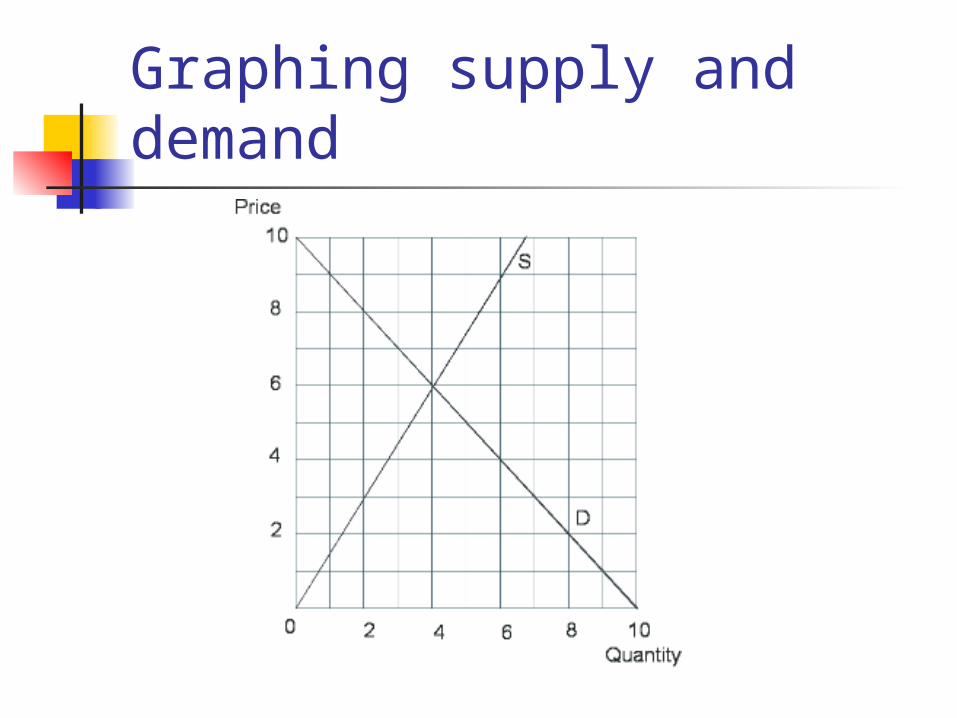
Graphing supply and demand
Equilibrium principle Another core principle
“No cash on the table” “stable” Nobody can be made better off by
changing her/his decision Does not address potential actions
that groups of people can make Later topic, especially with market failure
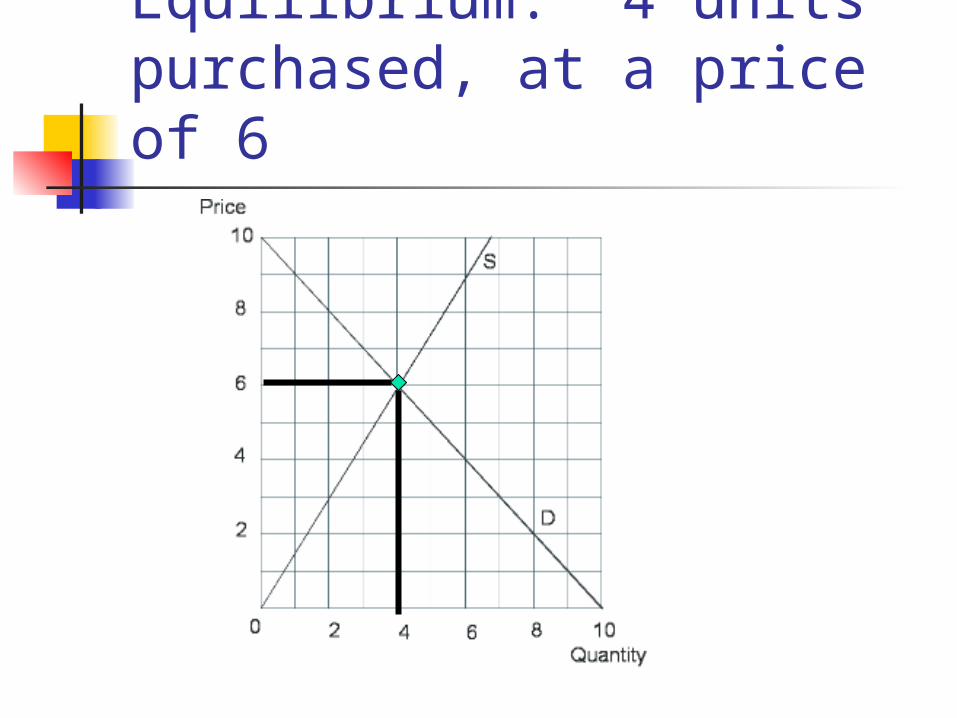
Equilibrium: 4 units purchased, at a price of 6
Why is a price of 6 equilibrium? To show that 6 is the equilibrium
price, we will show that prices above and below are not in equilibrium
We will prove by contradiction that this price could not be equilibrium
Suppose that a price (P) of 4 is equilibrium
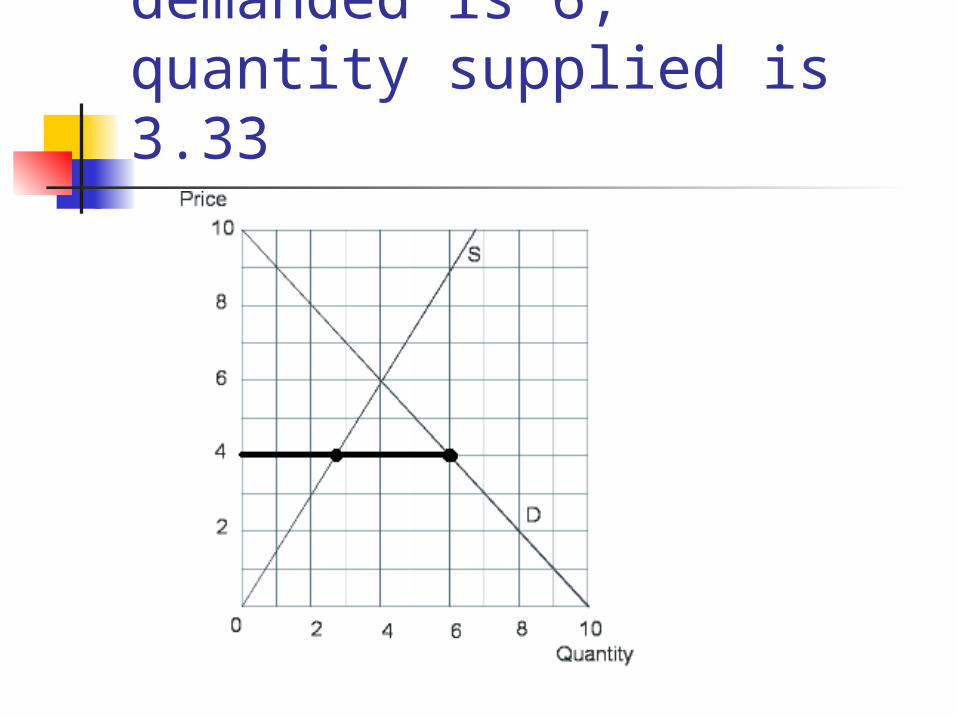
At P = 4: Quantity demanded is 6, quantity supplied is 3.33
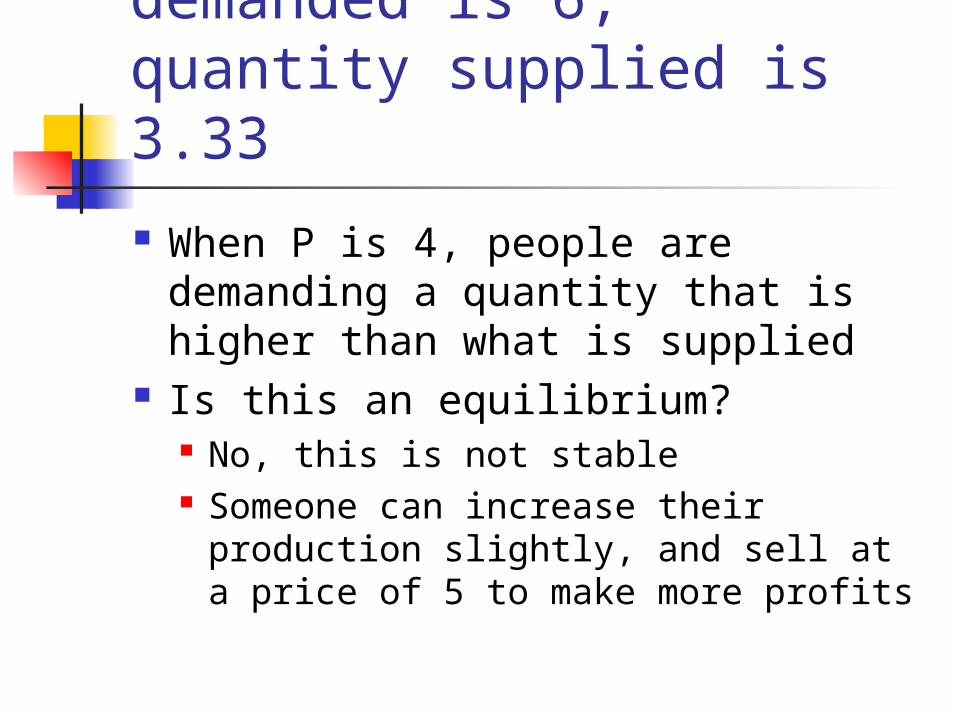
At P = 4: Quantity demanded is 6, quantity supplied is 3.33 When P is 4, people are demanding
a quantity that is higher than what is supplied
Is this an equilibrium? No, this is not stable Someone can increase their
production slightly, and sell at a price of 5 to make more profits
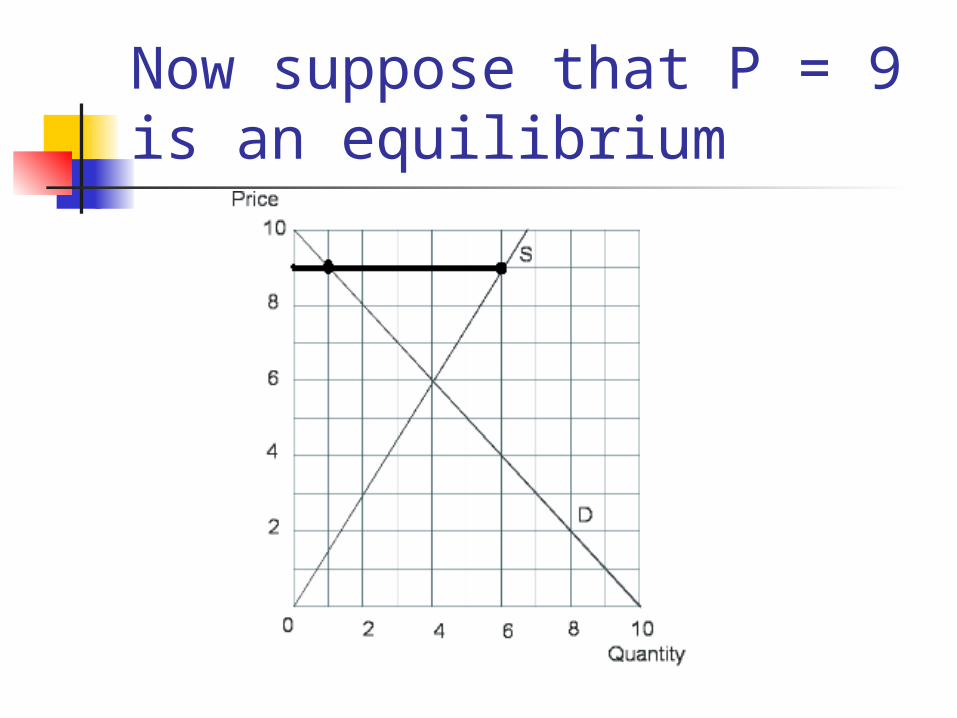
Now suppose that P = 9 is an equilibrium
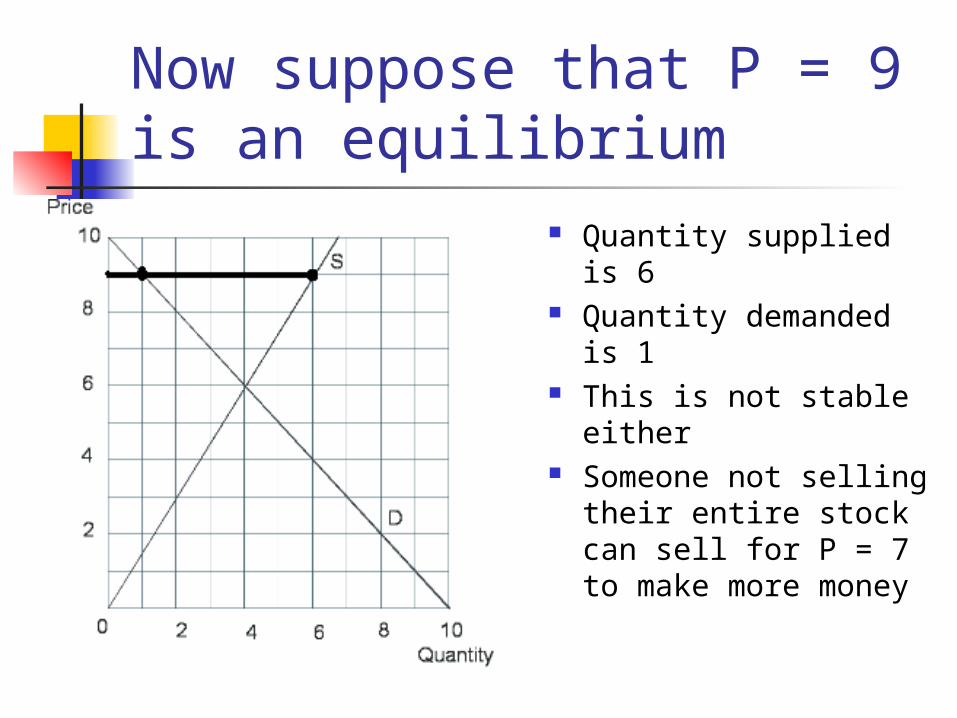
Now suppose that P = 9 is an equilibrium
Quantity supplied is 6
Quantity demanded is 1
This is not stable either
Someone not selling their entire stock can sell for P = 7 to make more money
A change in supply versus a movement along the supply curve A change in supply leads to a shift of the
entire supply curve A movement along the supply curve can
occur when the supply curve does not move Movement occurs when there is a change in
price Similar ideas apply for changes in demand
versus a movement along demand curves
What causes shifts in demand? Price changes of complements and
substitutes Example of complements: baseballs
and baseball bats Example of substitutes: two different
brands of cola
What causes shifts in demand? Income changes
Most goods are normal goods, meaning that when income increases, the demand curve shifts to the right
Some goods are inferior, meaning that when income increases, the demand curve shifts to the left
Changes in preferences, population, and expected future prices
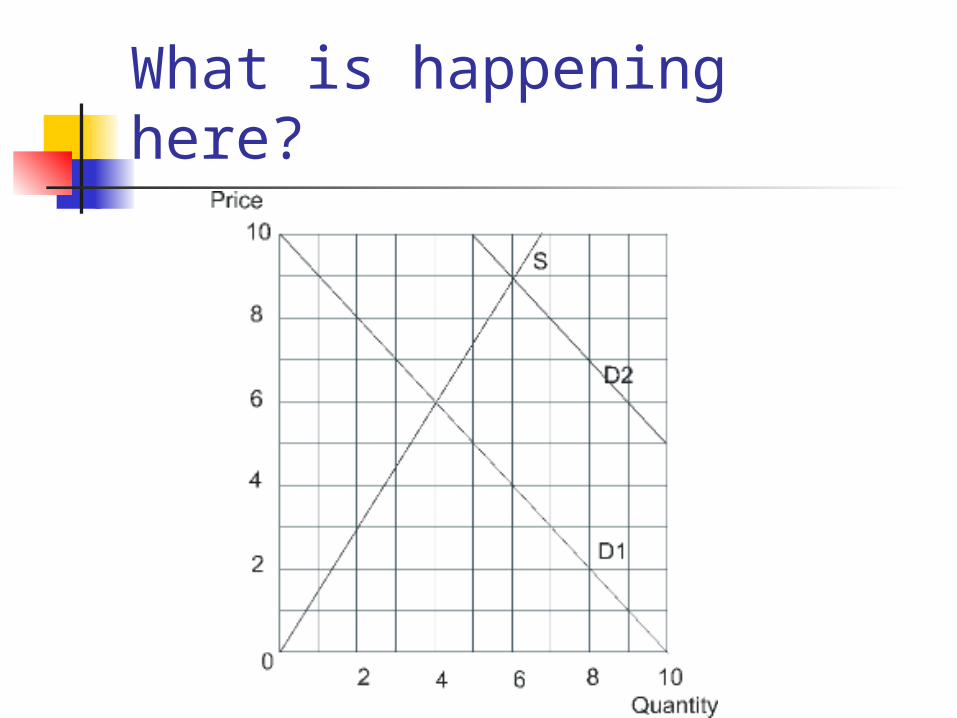
What is happening here?
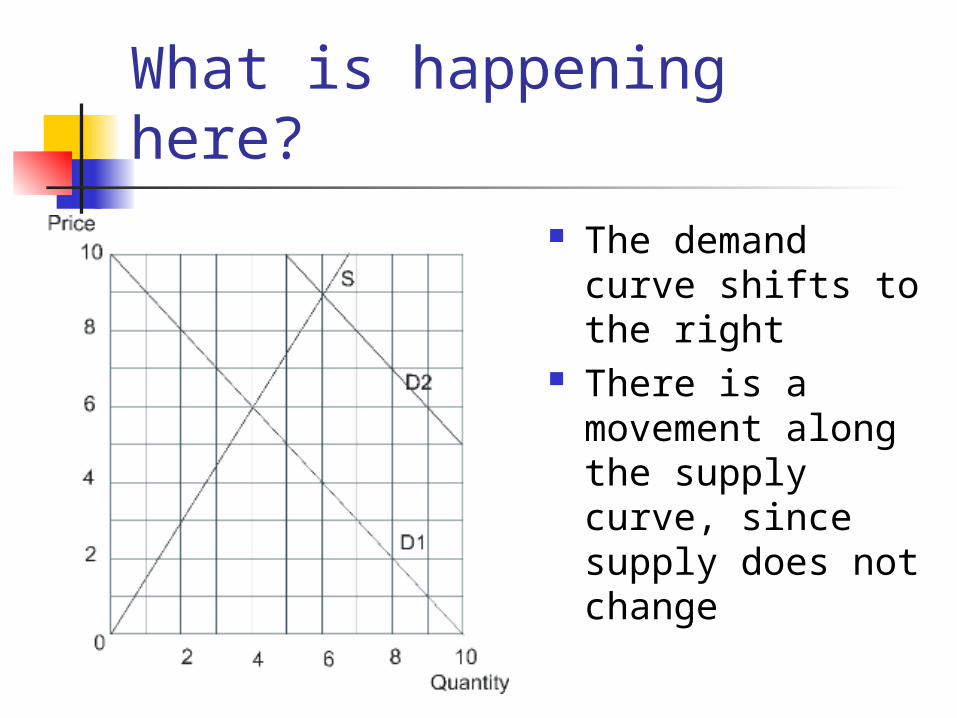
What is happening here? The demand
curve shifts to the right
There is a movement along the supply curve, since supply does not change
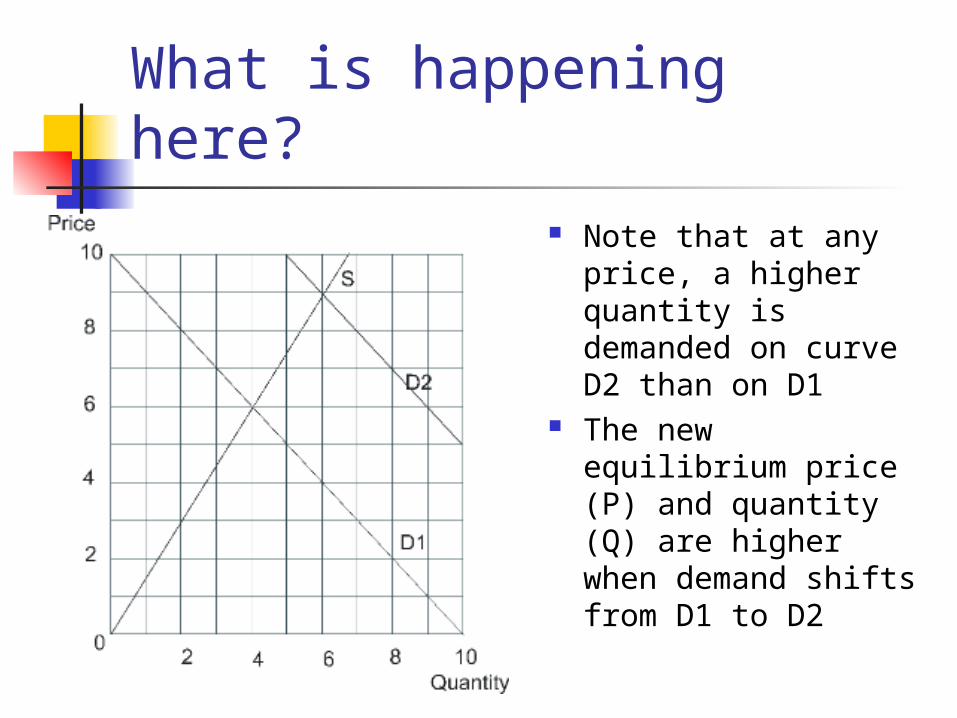
What is happening here? Note that at any
price, a higher quantity is demanded on curve D2 than on D1
The new equilibrium price (P) and quantity (Q) are higher when demand shifts from D1 to D2
What causes shifts in supply? Anything that changes the cost of
production If the cost of production decreases,
supply shifts to the right If the cost of production increases,
supply shifts to the left A change in number of suppliers Expectations of future prices
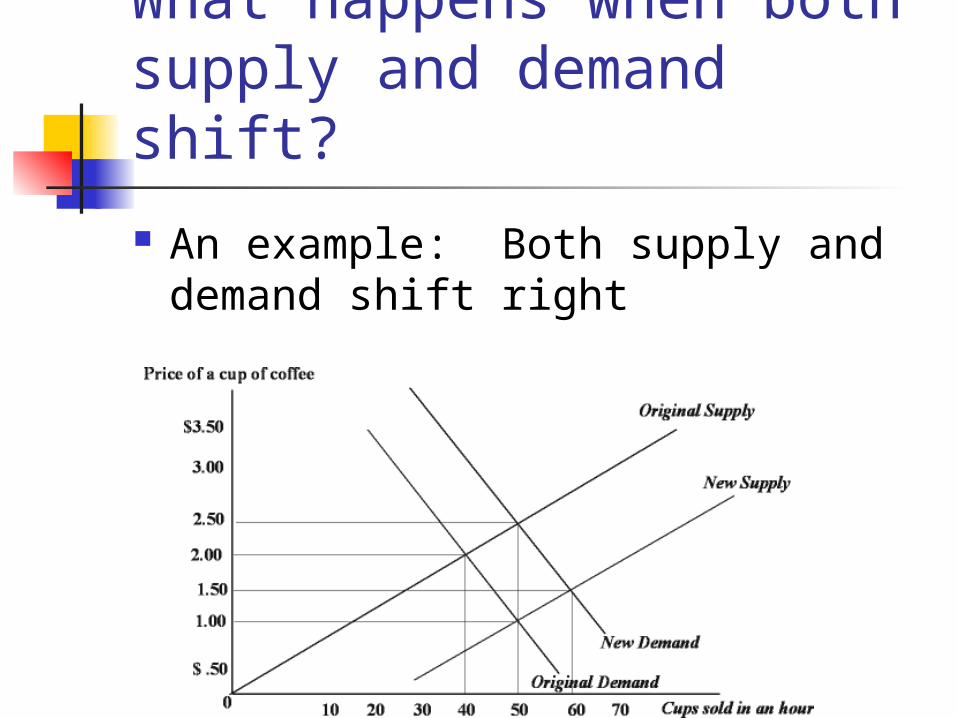
What happens when both supply and demand shift? An example: Both supply and
demand shift right
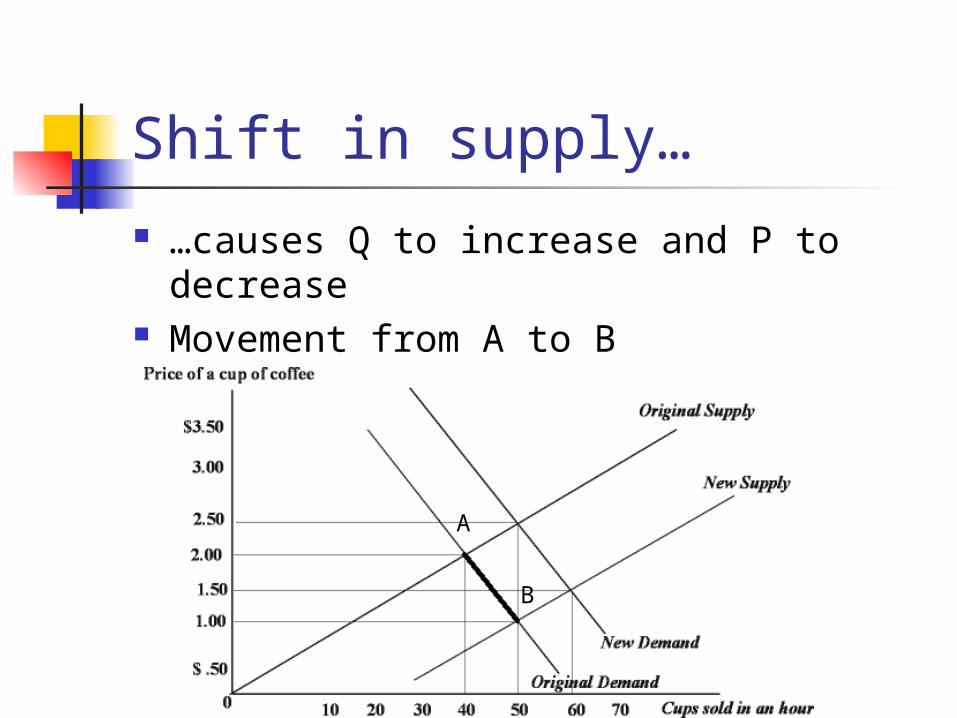
Shift in supply… …causes Q to increase and P to
decrease Movement from A to B
A
B
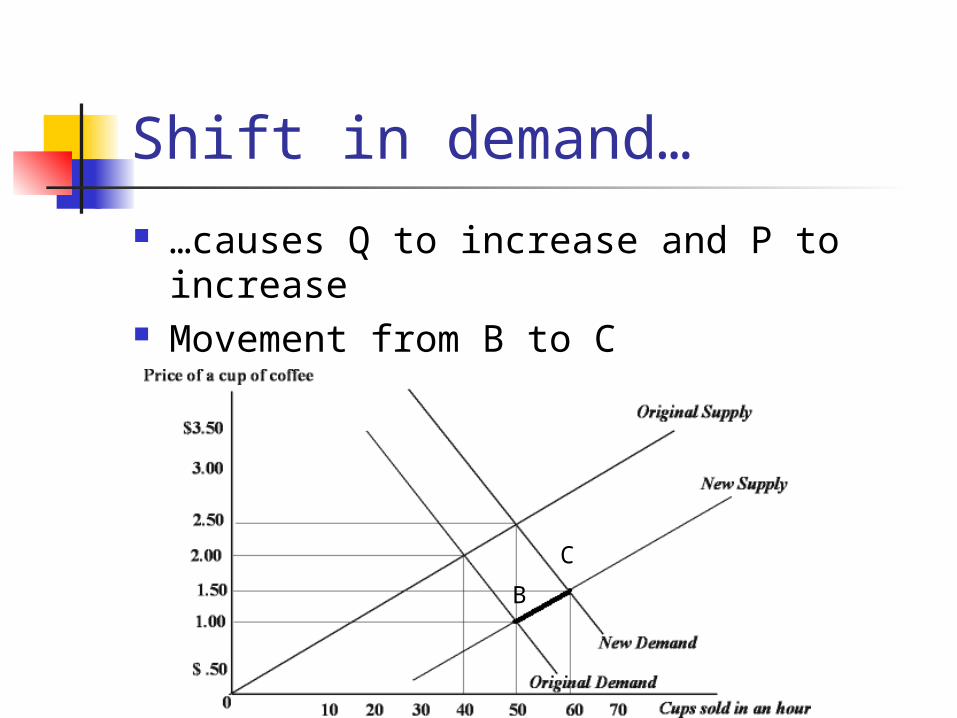
Shift in demand… …causes Q to increase and P to
increase Movement from B to C
B C
What can we conclusively say about changes in Q and P? Change in supply causes Q to
increase and P to decrease Change in demand causes Q to
increase and P to increase The only conclusion when both
supply and demand shift right is that Q increases

Now that we have talked about supply and demand… …let’s talk about bananas How many bananas did our
volunteer eat today? Why not any more? We will talk about what happened
here on Monday
Summary The intersection of demand and supply
curves determines equilibrium Equilibrium is stable Change in S or D causes the curve to shift A movement along the supply curve can
occur when the supply curve does not move Same with demand
Both supply and demand can shift, but be careful of your conclusions