Embed Size (px)
Citation preview
Supply constraints on rebound effects from increases in energy
efficiency: the disinvestment effect
European Conference of the International Association of Energy Economists
7 – 10 September 2009, Vienna, Austria
Karen TurnerESRC Climate Change Leadership Fellow
Department of Economics, University of Strathclyde
Co-authored with Kim Swales and Janine De Fence, Department ofEconomics, University of Strathclyde
ESRC First Grants Programme, Ref: RES-061-25-0010
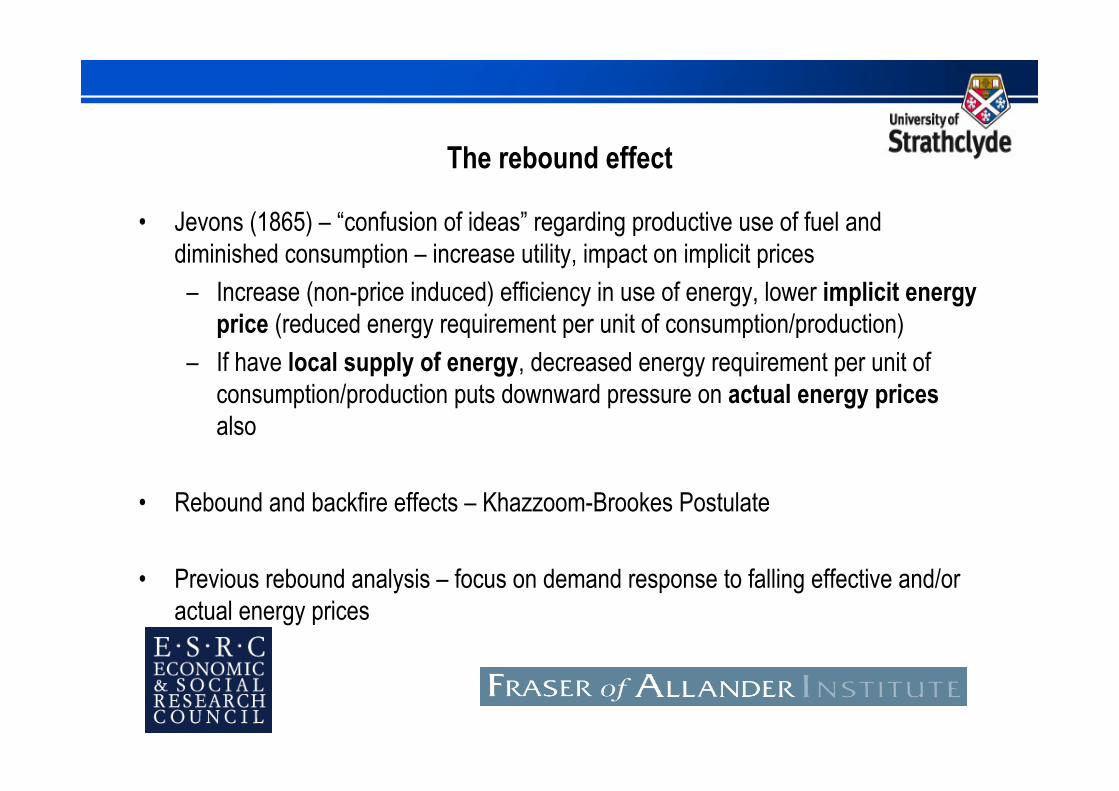
The rebound effect
• Jevons (1865) – “confusion of ideas” regarding productive use of fuel anddiminished consumption – increase utility, impact on implicit prices– Increase (non-price induced) efficiency in use of energy, lower implicit energy
price (reduced energy requirement per unit of consumption/production)– If have local supply of energy, decreased energy requirement per unit of
consumption/production puts downward pressure on actual energy pricesalso
• Rebound and backfire effects – Khazzoom-Brookes Postulate
• Previous rebound analysis – focus on demand response to falling effective and/oractual energy prices
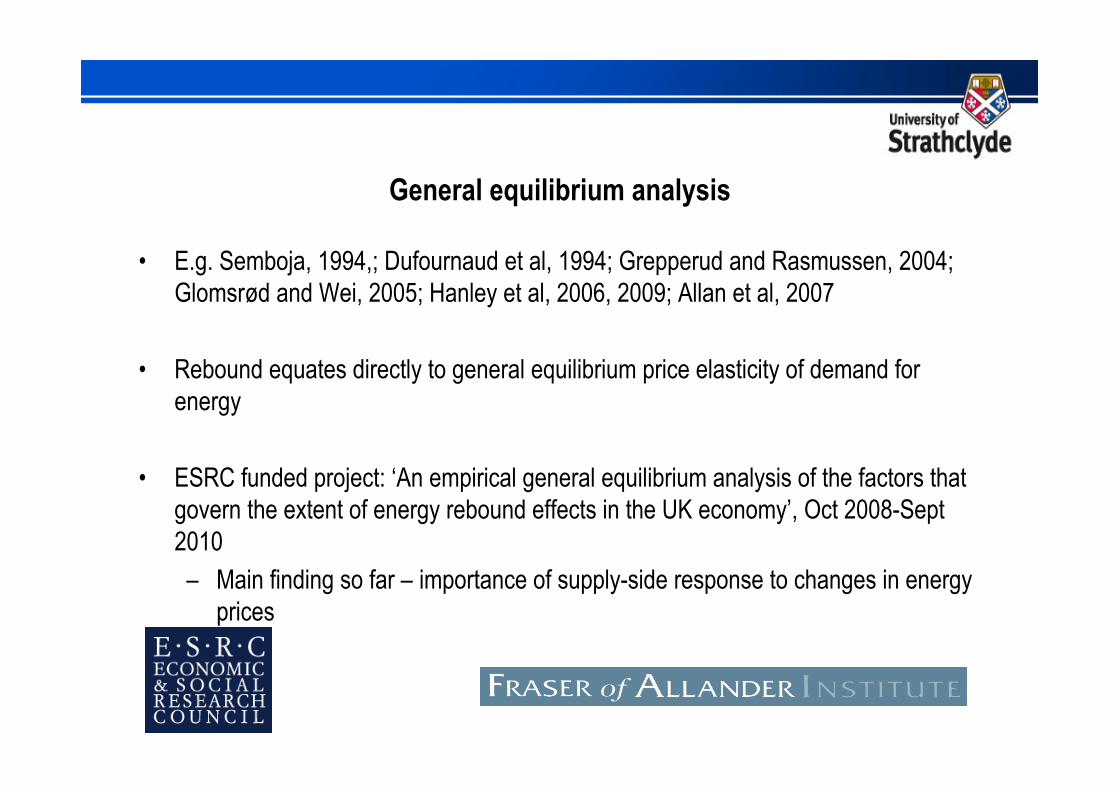
General equilibrium analysis
• E.g. Semboja, 1994,; Dufournaud et al, 1994; Grepperud and Rasmussen, 2004;Glomsrød and Wei, 2005; Hanley et al, 2006, 2009; Allan et al, 2007
• Rebound equates directly to general equilibrium price elasticity of demand forenergy
• ESRC funded project: ‘An empirical general equilibrium analysis of the factors thatgovern the extent of energy rebound effects in the UK economy’, Oct 2008-Sept2010– Main finding so far – importance of supply-side response to changes in energy
prices
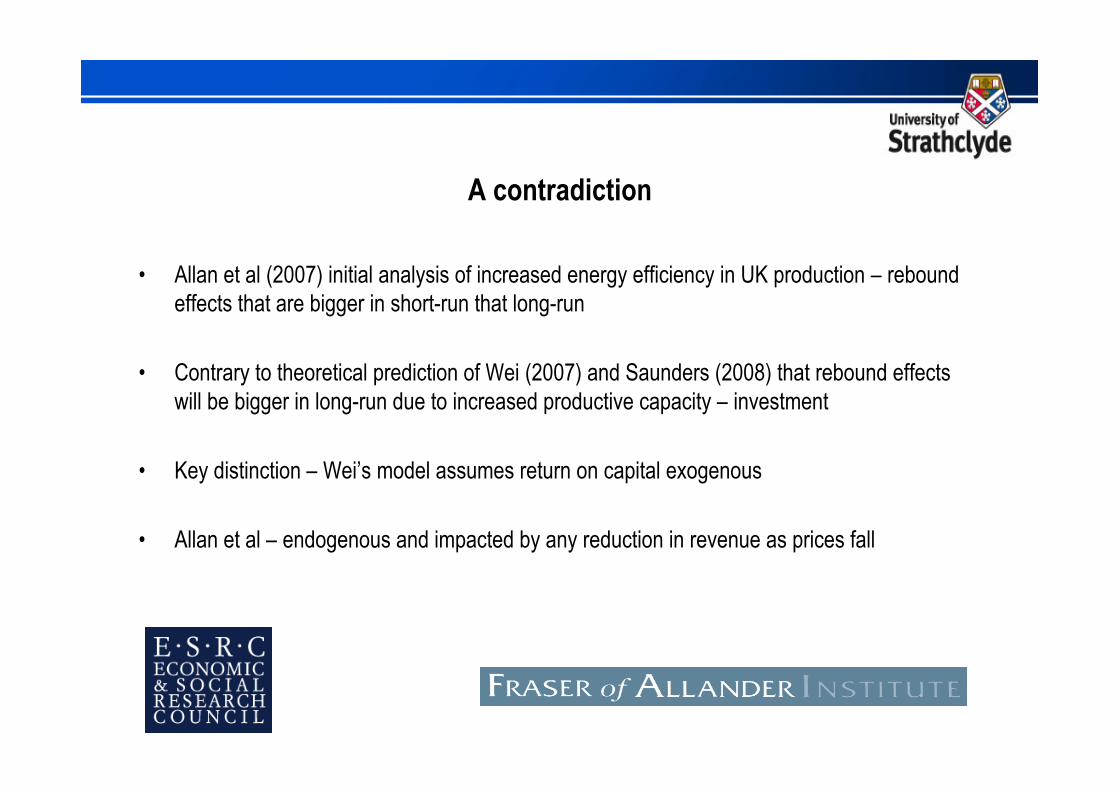
A contradiction
• Allan et al (2007) initial analysis of increased energy efficiency in UK production – reboundeffects that are bigger in short-run that long-run
• Contrary to theoretical prediction of Wei (2007) and Saunders (2008) that rebound effectswill be bigger in long-run due to increased productive capacity – investment
• Key distinction – Wei’s model assumes return on capital exogenous
• Allan et al – endogenous and impacted by any reduction in revenue as prices fall
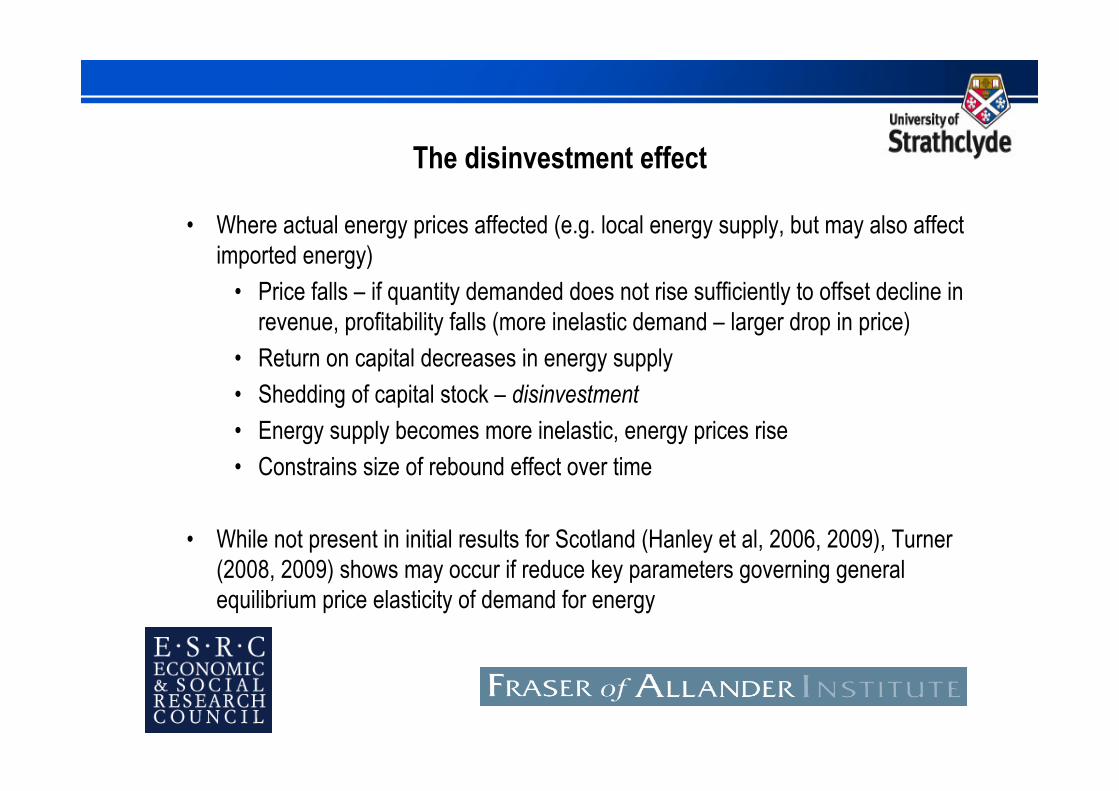
The disinvestment effect
• Where actual energy prices affected (e.g. local energy supply, but may also affectimported energy)
• Price falls – if quantity demanded does not rise sufficiently to offset decline inrevenue, profitability falls (more inelastic demand – larger drop in price)
• Return on capital decreases in energy supply• Shedding of capital stock – disinvestment
• Energy supply becomes more inelastic, energy prices rise• Constrains size of rebound effect over time
• While not present in initial results for Scotland (Hanley et al, 2006, 2009), Turner(2008, 2009) shows may occur if reduce key parameters governing generalequilibrium price elasticity of demand for energy

UKENVI and SCOTENVI
• 3 internal transactor groups (households, firms, government), plus Rest of World (and Restof UK in Scotland)
• 25 commodities/sectors, including 5 energy sectors (coal, refined oil, gas, two electricity)
• Capital – labour – energy – materials (KLEM) production structure using multi-level CESproduction functions. Assumes cost minimisation.
• Calibrated to 2000 UK SAM, 1999 Scottish SAM
• Recursive dynamic – investment = depreciation plus proportion of difference actual anddesired capital stock, where desired capital stock determined on cost minimisation criteriaand reflects changing profitability at sectoral level (if return on capital rises above user cost,investment, and vice versa)
• Labour market – wage bargaining (Scotland: migration in response to changes in relativewage and unemployment rates)
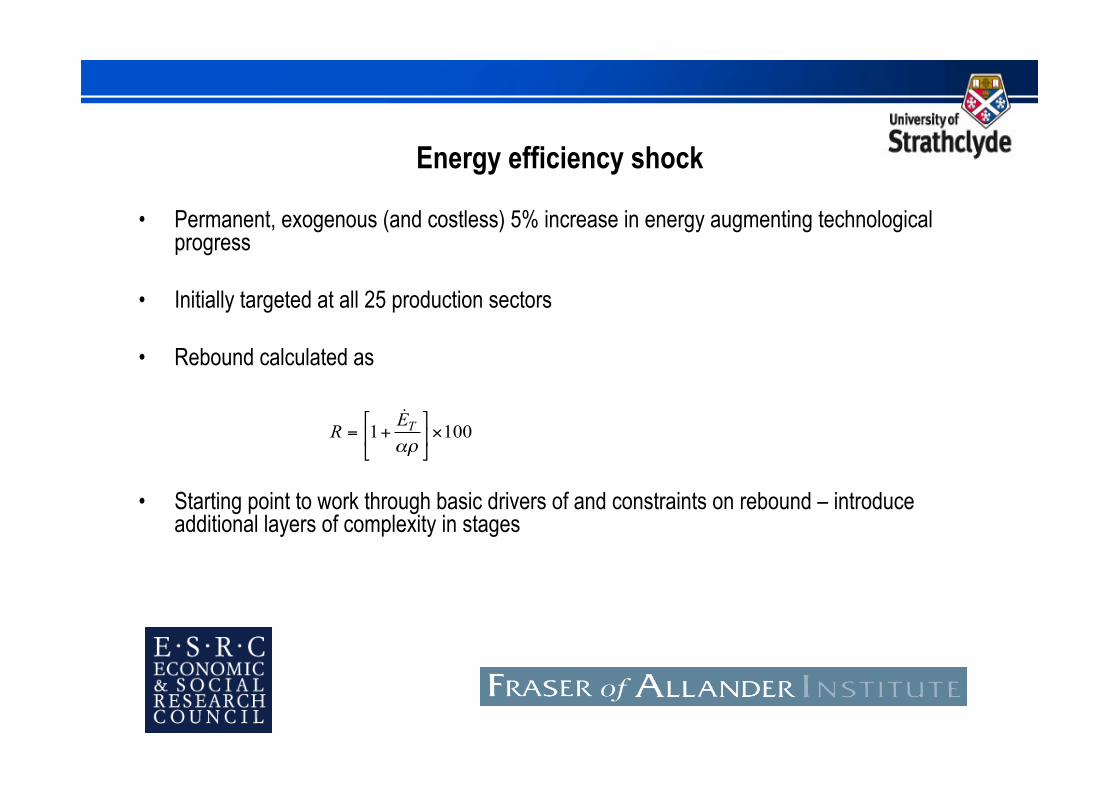
Energy efficiency shock
• Permanent, exogenous (and costless) 5% increase in energy augmenting technologicalprogress
• Initially targeted at all 25 production sectors
• Rebound calculated as
• Starting point to work through basic drivers of and constraints on rebound – introduceadditional layers of complexity in stages
1 100TE
R!"
# $= + %& '( )
&
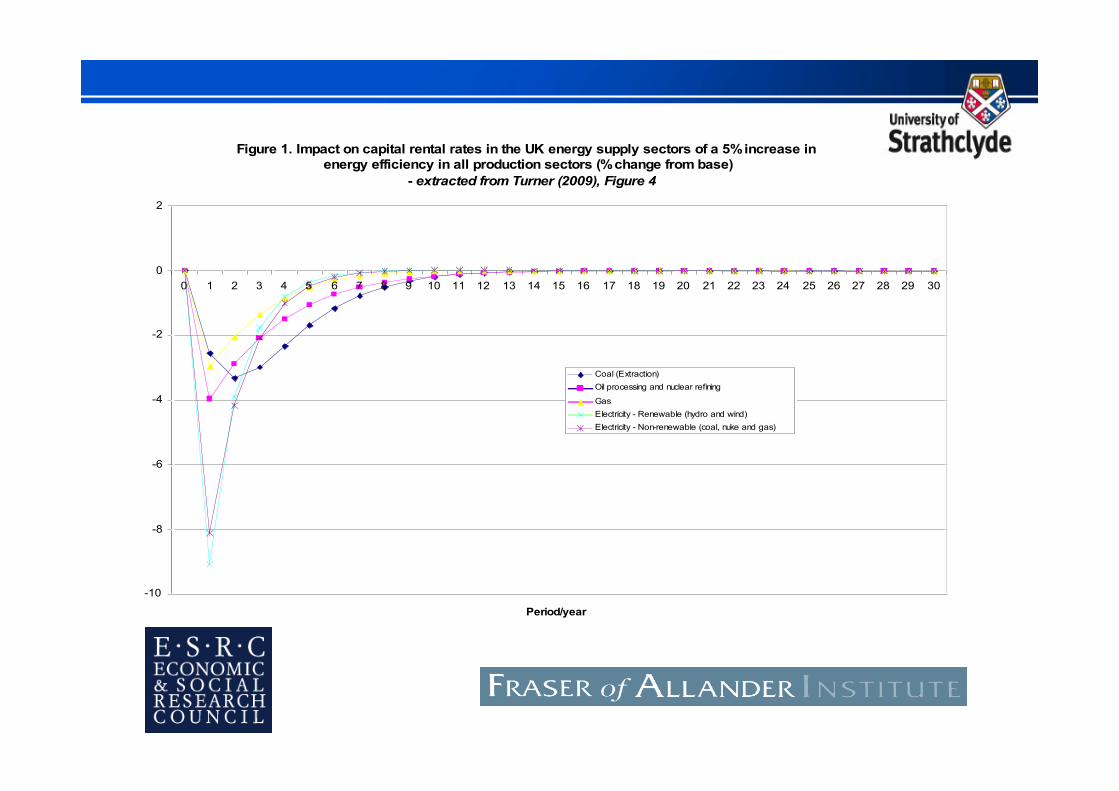
Figure 1. Impact on capital rental rates in the UK energy supply sectors of a 5% increase in
energy efficiency in all production sectors (% change from base)
- extracted from Turner (2009), Figure 4
-10
-8
-6
-4
-2
0
2
0 1 2 3 4 5 6 7 8 9 10 11 12 13 14 15 16 17 18 19 20 21 22 23 24 25 26 27 28 29 30
Period/year
Coal (Extraction)
Oil processing and nuclear refining
Gas
Electricity - Renewable (hydro and wind)
Electricity - Non-renewable (coal, nuke and gas)
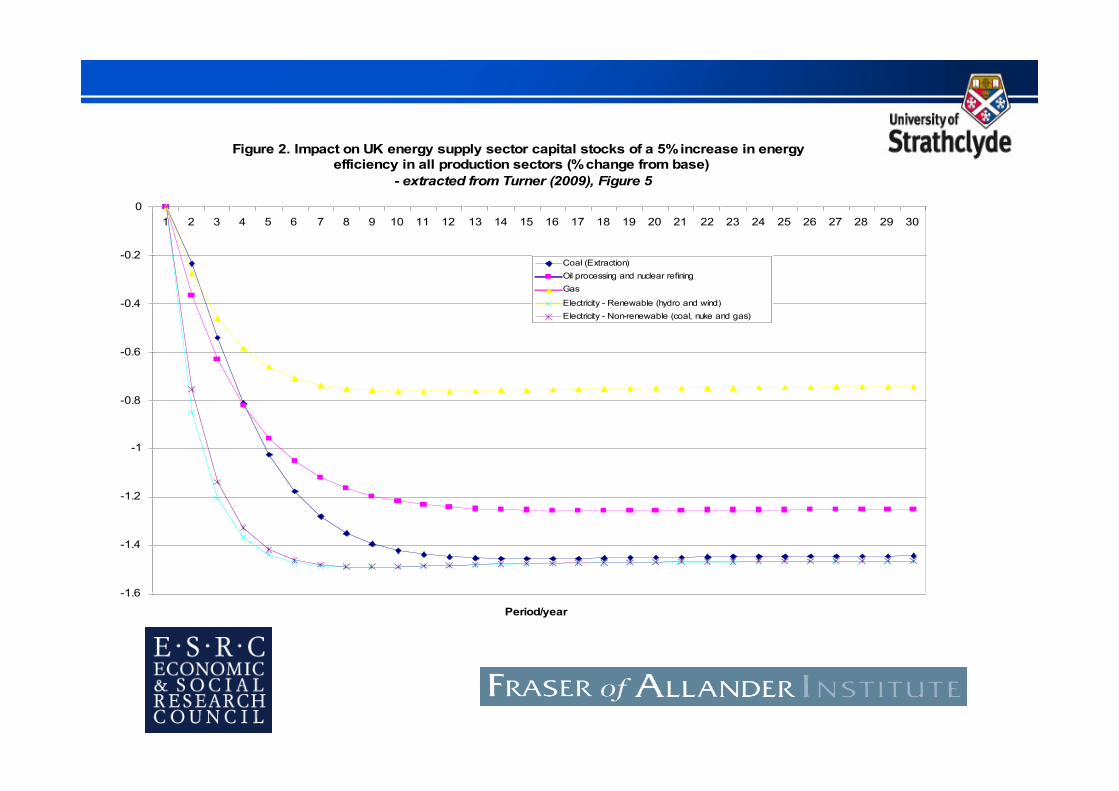
Figure 2. Impact on UK energy supply sector capital stocks of a 5% increase in energy
efficiency in all production sectors (% change from base)
- extracted from Turner (2009), Figure 5
-1.6
-1.4
-1.2
-1
-0.8
-0.6
-0.4
-0.2
0
1 2 3 4 5 6 7 8 9 10 11 12 13 14 15 16 17 18 19 20 21 22 23 24 25 26 27 28 29 30
Period/year
Coal (Extraction)
Oil processing and nuclear refining
Gas
Electricity - Renewable (hydro and wind)
Electricity - Non-renewable (coal, nuke and gas)
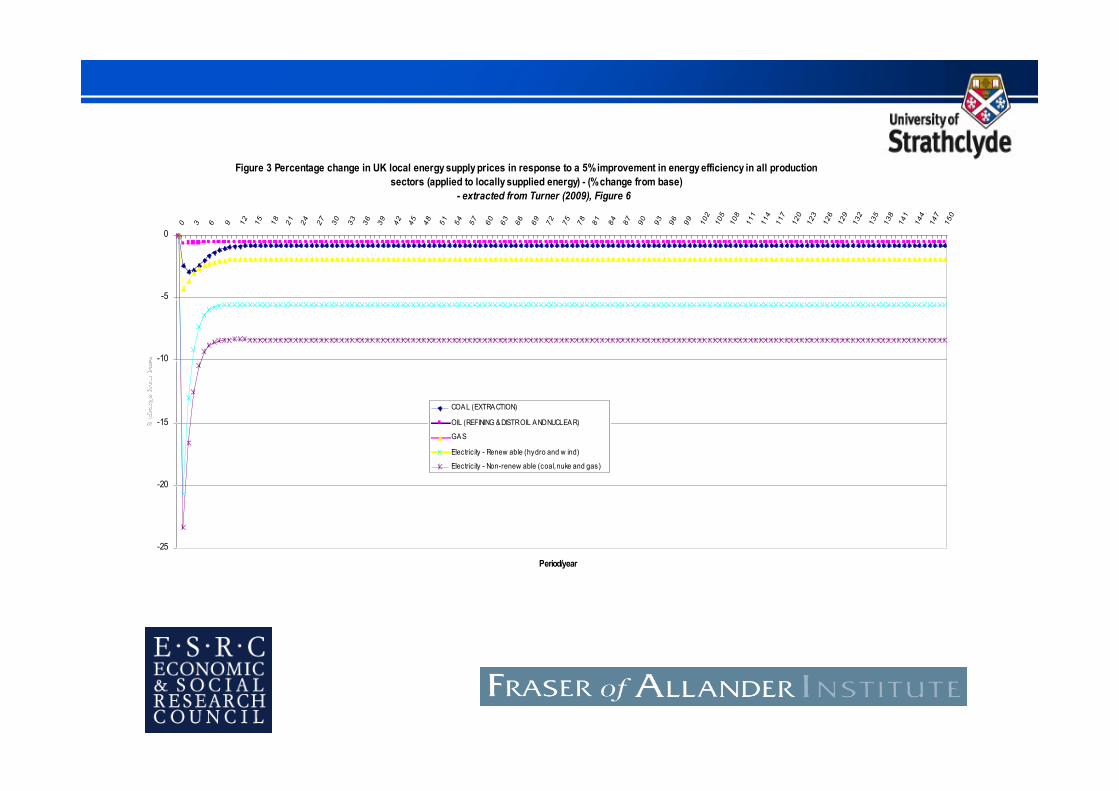
Figure 3 Percentage change in UK local energy supply prices in response to a 5% improvement in energy efficiency in all production sectors (applied to locally supplied energy) - (% change from base)
- extracted from Turner (2009), Figure 6
-25
-20
-15
-10
-5
0
0 3 6 9 12 15 18 21 24 27 30 33 36 39 42 45 48 51 54 57 60 63 66 69 72 75 78 81 84 87 90 93 96 99 102
105
108
111
114
117
120
123
126
129
132
135
138
141
144
147
150
Period/year
COAL (EXTRACTION)
OIL (REFINING & DISTR OIL AND NUCLEAR)
GAS
Electric ity - Renew able (hydro and w ind)
Electric ity - Non-renew able (coal, nuke and gas)
Disinvestment effects
• Wei (2007) and Saunders (2008) – rebound bigger in long run than in short run becausepositive supply shock leads to expansion in set of production possibilities
• Here, true for non-energy supply sectors
• However, if profitability falls as actual energy prices fall, return on capital in energy supplyfalls, leading to contraction in capacity in these sectors (possibly also in external energysupply sectors – where local energy demand impacts on external prices)
• However, if demand is sufficiently elastic, prices can fall without reducing profitability
• Use of UKENVI for analytical work to understand basic drivers of rebound – vary keyassumptions one at a time; here focus on
– elasticities of substitution in production and trade elasticities (imports and exports)
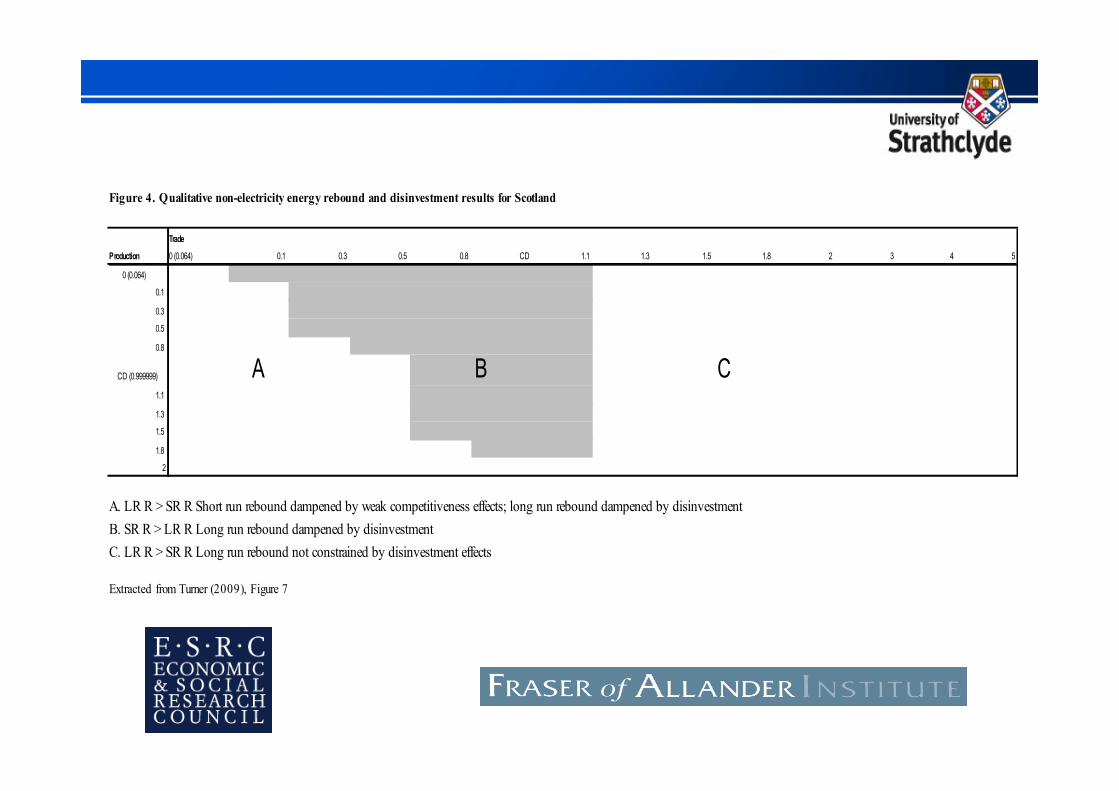
Figure 4. Qualitative non-electricity energy rebound and disinvestment results for Scotland
Trade
Production 0 (0.064) 0.1 0.3 0.5 0.8 CD 1.1 1.3 1.5 1.8 2 3 4 5
0 (0.064)
0.1
0.3
0.5
0.8
CD (0.999999) A B C1.1
1.3
1.5
1.8
2
A. LR R > SR R Short run rebound dampened by weak competitiveness effects; long run rebound dampened by disinvestment
B. SR R > LR R Long run rebound dampened by disinvestment
C. LR R > SR R Long run rebound not constrained by disinvestment effects
Extracted from Turner (2009), Figure 7
Conclusions and ongoing research• Sector specific simulations reflect key questions:
– Will actual energy prices change? (Scottish commercial transport and refined oil)– Will disinvestment adjustment process be smooth or lumpy? (Non-renewable electricity supply and coal)
• More generally, disinvestment results reflect importance of focussing on supply-side issues – Wei (2009)
• Importance of determining key parameters governing general equilibrium price elasticity of demand forenergy
– Current research - econometric estimations of KLEM production function (e.g. Kemfert 1998, Vander Werf 2008)
• Also different production structures – energy as an intermediate or primary input?
• Other issues to focus on in CGE analysis: increased efficiency (total factor productivity) in energyproduction; increased efficiency in other factors of production (e.g. Turner et al, 2009); interregionalanalysis (e.g. Turner and Hanley, 2009); increases in energy efficiency in consumption