Embed Size (px)
Citation preview

Supply Chains
David Levinson

Network Analysis of Economy vs. Economic Analysis of Networks
• The economic analysis is required to understand and speculate about the deployment of advanced technologies, such as road pricing, and how those technologies interact and depend on each other.
• The central idea of a network is connections between links which reinforce each other. These links can be physical (threads, wires, beams, highways, rails, pipes) or socio-economic (kinship, social, or exchange relationships).
• The market on the other hand is a place (real or virtual) where exchange takes place. An economic network may be comprised of multiple markets. A market may sell the right to use, or the ownership of, physical networks.
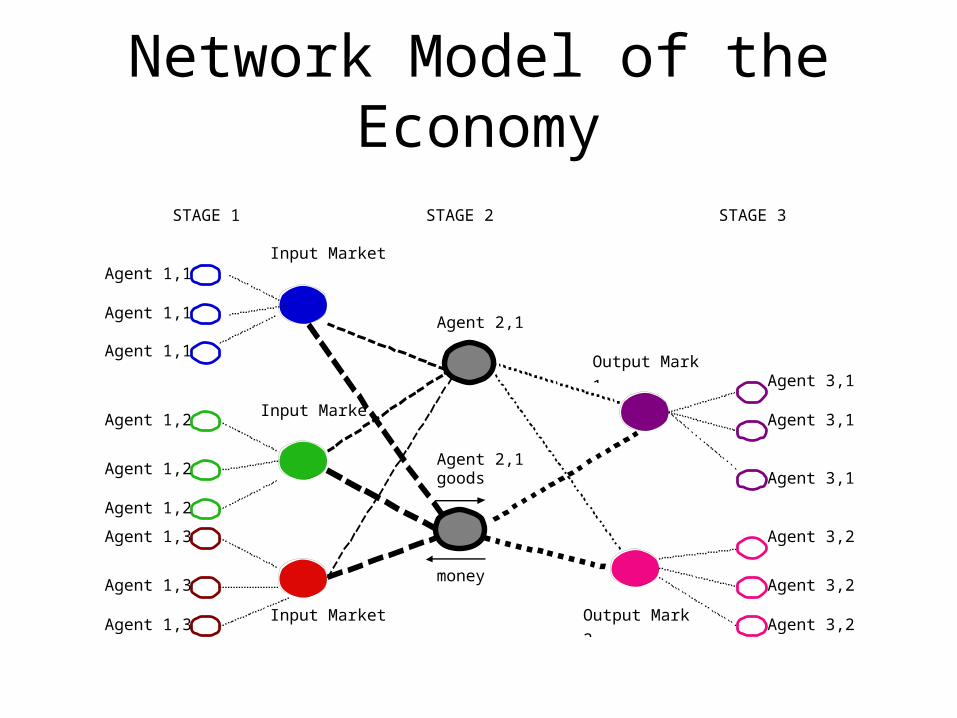
Network Model of the Economy
Agent 3,1,1
Agent 2,1,2
Agent 3,1,2
Agent 3,1,3
money
goods
Input Market 1
Input Market 2
Input Market 3
Output Market
1
Agent 1,1,1
Agent 1,1,2
Agent 1,1,3
Agent 2,1,1
Output Market
2
STAGE 1 STAGE 2 STAGE 3
Agent 1,2,1
Agent 3,2,1
Agent 1,2,2
Agent 1,2,3
Agent 1,3,1
Agent 1,3,2
Agent 1,3,3
Agent 3,2,2
Agent 3,2,3

Nomenclature• Agent: stage s, market m, firm number n• Open or hatched circles indicate
production/consumption agent nodes• Filled circles indicate market or exchange nodes• Lines indicate links connection markets and agents • There are three main elements:
• the site of production/consumption (material transformation),
• the site of exchange (ownership transformation),
• and the connection between the two (spatio-temporal transformation)

Comments• While each of these elements is modeled
as a link or node, it should be remembered that each can be expanded to form a subnetwork of itself if there is a desire to increase the detail or resolution of the analysis.
• A production/consumption agent in an economic network has both suppliers and customers, and can be modeled as an “agent node” on a network. Because production and consumption are two sides of the same coin, they are referred to together, any process consumes inputs to produce outputs. The “exchange nodes” are defined by the convergence of “connection links,” and are analogous to markets.
• The agent nodes are connected to exchange nodes by special “connection links” (shown on Figure 1 as dashed lines). Connection links account for transportation or communication costs in the production system. The flows in one direction are goods that are input into the production process, transformed and output as a refined good(s). The flows in the other direction represent money (or a monetary equivalent) that is paid for the goods.
• In the model represented by Figure 1, an agent (firm or individual) purchases goods in an input market (Stage 1), and may be supplied by any (or all) firms in that input market. The goods are brought to the “factory,” (the term is used loosely) transformed (Stage 2), and sold in the output market to any or all customers (Stage 3). The firm is complementary to any firm in the input market and to its customers, while it is competitive with parallel and unconnected nodes.

Linking Economy with Transportation• Clearly this situation is idealized. Some firms may have different degrees of vertical
integration, that is they may internalize what is represented here as an input market or the output market. However, this figure does reflect that a production process may have economies of scope, so that a single firm produces for more than one output market, as is shown in Figure 1 between Stage 2 and Stage 3. In the illustration, there are three stages (1,2,3 from left to right) several markets in each stage (for instance a market for capital and a market for labor) and multiple firms in each market. Extending the chain far enough to the left and to the right, and incorporating enough of the economy, the markets connect with each other again, as the ultimate final consuming agent is the individual consuming goods and an ultimate input agent is an individual producing labor.
• To compare with a conventional transportation network, a roadway link is a composite of the “agent node” and the “connection link”. For each link on a highway, there is only one input market and one output market, each identified with a single node (an intersection), which makes the graphic representation and analysis simpler as the agent nodes are unnecessary because the transformation is only spatial, not material. While there is “conservation of flow” in the network, flows can be one way, the link moves traffic in one direction with nothing in return. As part of a larger system, the link (more precisely, an agent: Department of Transportation, Turnpike Authority, private firm acting on behalf of the link) receives revenue from government or users, which is used to maintain the link.

Payment• In one sense, the link is selling the right to be traveled on and is paid by users or government
for this right.
• If it is not paid, it deteriorates over time (the payment comes from the link’s own capital stock which is dissipated).
• The more generalized version of a graphed economy subsumes the transportation network as a special case. The use of this framework serves to incorporate, at least conceptually, financing in the standard highway network analysis, and thereby allows us to identify some pertinent issues.
• In particular if we identify links with firms, the issue of payment becomes clear. In order to operate, the link must be subsidized by government, be paid for directly by users, or allow its capital stock to deteriorate. Direct payment from users equal to the marginal cost is clearly more efficient, it does not entail the social loss described in section 2 due to overuse and subsidy, and does not impose deadweight losses inherent in certain taxing structures. Imposing road pricing is a natural conclusion to these problems.
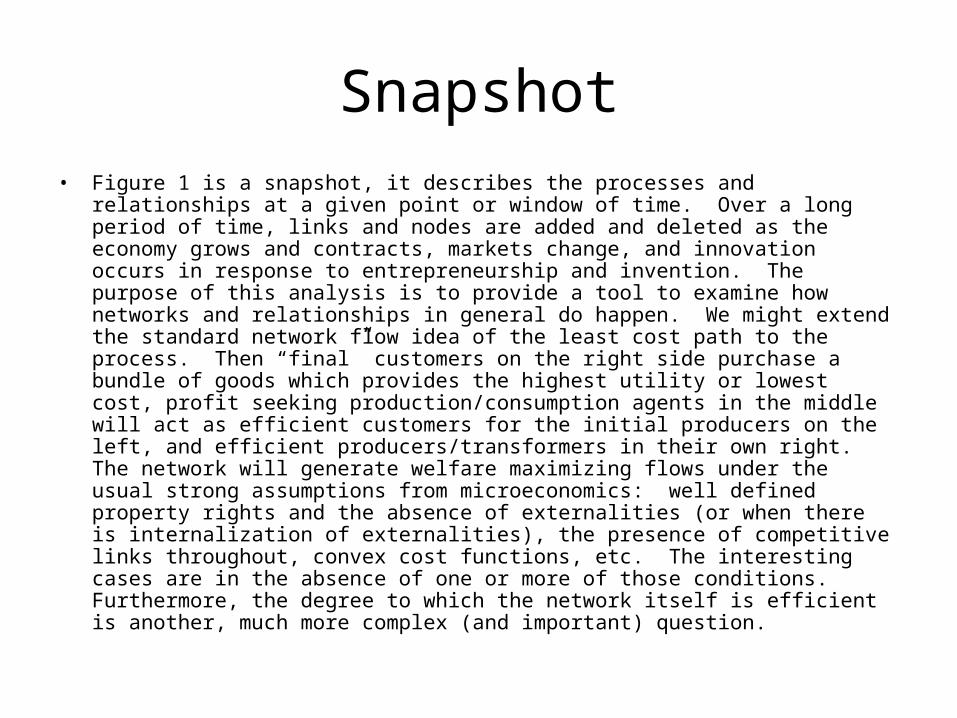
Snapshot• Figure 1 is a snapshot, it describes the processes and relationships at a given point or window
of time. Over a long period of time, links and nodes are added and deleted as the economy grows and contracts, markets change, and innovation occurs in response to entrepreneurship and invention. The purpose of this analysis is to provide a tool to examine how networks and relationships in general do happen. We might extend the standard network flow idea of the least cost path to the process. Then “final” customers on the right side purchase a bundle of goods which provides the highest utility or lowest cost, profit seeking production/consumption agents in the middle will act as efficient customers for the initial producers on the left, and efficient producers/transformers in their own right. The network will generate welfare maximizing flows under the usual strong assumptions from microeconomics: well defined property rights and the absence of externalities (or when there is internalization of externalities), the presence of competitive links throughout, convex cost functions, etc. The interesting cases are in the absence of one or more of those conditions. Furthermore, the degree to which the network itself is efficient is another, much more complex (and important) question.

Supply Chains
• A supply chain is a network of facilities and distribution options that performs the functions of procurement of materials, transformation of these materials into intermediate and finished products, and the distribution of these finished products to customers.
• Supply chains exist in both service and manufacturing organizations, although the complexity of the chain may vary greatly from industry to industry and firm to firm.
- Source: Ram Ganeshan Terry P. Harrison
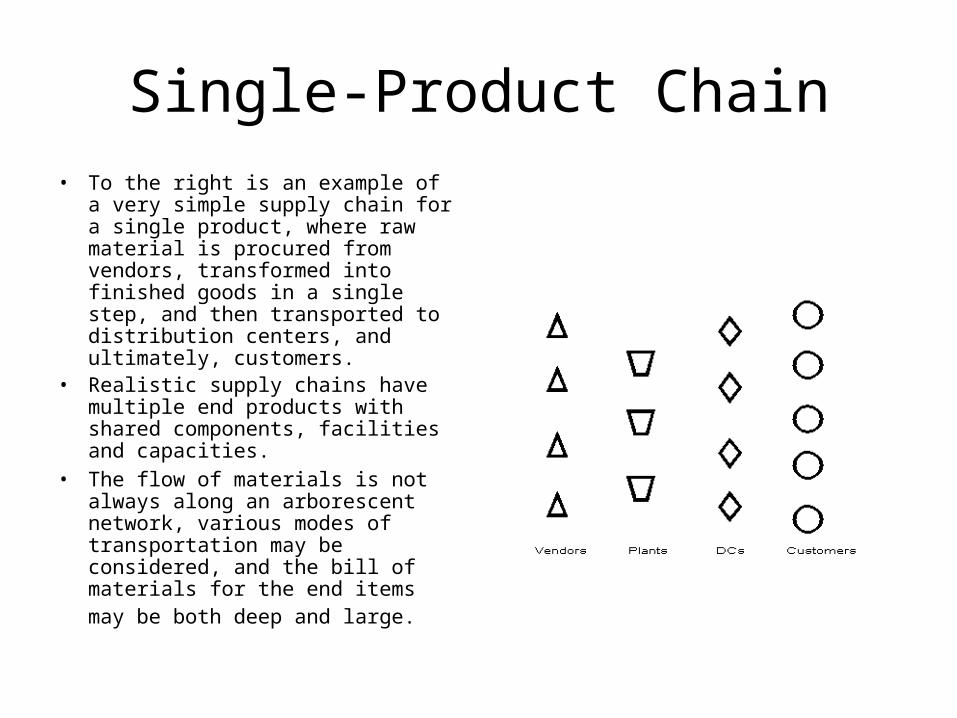
Single-Product Chain• To the right is an example of a very
simple supply chain for a single product, where raw material is procured from vendors, transformed into finished goods in a single step, and then transported to distribution centers, and ultimately, customers.
• Realistic supply chains have multiple end products with shared components, facilities and capacities.
• The flow of materials is not always along an arborescent network, various modes of transportation may be considered, and the bill of materials for the end items may be both deep and large.

Supply Chain Decisions
• We classify the decisions for supply chain management into two broad categories -- strategic and operational.
• Location Decisions • Production Decisions • Inventory Decisions • Transportation Decisions
Modeling Approaches• Network Design methods, for the most part, provide normative models
for the more strategic decisions. Optimization of system.• Inventory Control methods, on the other hand, give guiding policies for
the operational decisions. These models typically assume a "single site" (i.e., ignore the network) and add supply chain characteristics to it, such as explicitly considering the site's relation to the others in the network. These derive from Inventory Control optimization
• Simulation methods are used to evaluate the effectiveness of a pre-specified policy rather than develop new ones. It is the traditional
question of "What If?" versus "What's Best?".

Freight Logistics• Freight Logistics - the process of planning, implementing and
controlling the efficient, effective flow and storage of raw materials, in-process inventory, finished goods, services and related information from point of origin to point of consumption for the purpose of conforming to customer requirements."
• This management is increasingly important as producers move from a inventory based system (push) to a just-in-time system (pull). This is enabled by (and demands) reliable transportation and information technology.
• The process is multi-modal and inter-modal. Most products are loaded and unloaded multiple times at various stages within the logistics cycle.

Statistics
Value (%) Vo lume (%) $/lb Avg Length(mi)
Trucking 72.6 52.6 $0.35 416Railroads, 4.0 12.7 $0.08 794Maritime, 3.9 17.2 $0.06 2300Intermodal 10.4 1.7 $1.61Airplanes, 2.4 0.02 $26.77 1325Pipelines, 2.8 10.8 $0.09 825 crude,
375 otherOther 3.9 5.0 $0.20

Freight Stats
• Freight tons per capita has been increasing slowly (about 0.1% per year), but freight ton-miles has been increasing at more than 1% per year. Things are being shipped farther.
• Railroads - move low value commodities long distances slowly (e.g. coals, chemicals, farm products), as well as large items that can't be easily or efficiently moved by truck (e.g. cars and large machinery).

Freight Stats• Class I - major railroads • Western (east west) Burlington Northern/Santa Fe, Union Pacific, • Eastern (east west) CSX, Norfolk Southern,• Central (north south) Chicago and Northwestern, Illinois Central, Kansas City
Southern, Grand Trunk Western (Canadian National), and Soo Line (Canadian Pacific).
• Class II - regional and short line railroads• Trucks - move higher value products short distances rapidly.• Truckload - one shipment, one truck• Less than Truckload (LTL) - multiple shippers use same truck.• Some owned by manufacturers, some by private trucking firms, some by publicly
held (stock market) trucking firms.
• Small trucks are often used as private vehicles, so truck statistics need to be considered with care. Almost 60,000,000 trucks in United States.

Low Cost Envelope
Distance
Cost
Truck
Rail
Air


Standard Control Loop