Embed Size (px)
Citation preview

Supply Chain Vulnerability in the Automotive Industry
Master thesis within Business Administration
Authors: Jerko Pejicic Panagiotis Xanthopoulos
Tutor: Per Skoglund
Jönköping May 2015

Master Thesis in Business Administration: International Logistics und Supply Chain Management Title: Supply Chain Vulnerability in the Automotive Industry
Authors: Jerko Pejicic, Panagiotis Xanthopoulos
Tutor: Per Skoglund
Date: 2015-05-11
Subject terms: Supply chain risk management, Supply chain vulnerability, Supply chain practices, Risk mitigation, Automotive industry
Abstract Purpose: The purpose of this research study is the empirical analysis of the
elements affecting supply chain vulnerability with a focus on the automotive industry.
Methodology: This research is based on a deductive approach. In order to fulfil the purpose of the study, the authors stated three hypotheses which were tested with help of quantitative data. Moreover, the survey strategy was used while using questioning in order to gather information from subjects. With the help of a web-based ques-tionnaire the data was collected. The collected data was then used for statistical analysis, in particular by using a OLS analysis, Mann-Whitney-U-Test and Spearman correlation. By making use of the statistical results the authors where able to test the stated hypothe-ses.
Research limitations: The research was conducted within only one specific industry, in particular the automotive industry. Furthermore, the relatively low amount of 32 respondents must be mentioned. The last imitation of the research study is the missing consideration of any interde-pendencies between the groups of supply chain practices and sup-ply chain risks.
Theoretical Impl: This research represents a contribution to the existing knowledge in field of supply chain risk management and more precisely to the field of supply chain vulnerability within the automotive industry. As one of the few quantitative research studies that deal with the analysis of elements affecting supply chain vulnerability, this re-search investigates statistically the cause-effect relationships, corre-lations and differences of elements affecting supply chain vulnera-bility.
Managerial: The results of this study contribute greatly to practitioners within the automotive industry. With the help of the comprehensive SCVM and due to the high degree of detail regarding the supply chain practices and their categorization into source, make and deli-ver practices, managers within the various supply chain functions of a company can easily identify their individual need for actions based on the findings of this study.

Acknowledgment Firstly, the authors would like to specially thank the supervisor of this research, Per Skoglund, for his assistance and constructive comments during the period of the thesis, even though the authors were not able to always be present in person.
A special thank also goes to the participants of the survey who enabled the researchers to finally conduct this research. Furthermore, the authors would like to thank all the partici-pants of the master thesis seminar at JIBS University for the productive feedback and in-teresting discussions throughout the master thesis meetings.
Jerko would like to enunciate his gratitude to Andrea Carolina Cevallos Sisa, who continu-ously offered her expertise in statistical analyses to contribute to the success of this re-search. Moreover, he would like to manifest his gratefulness to his mother, who served him as a role model and interminable support throughout his life.
Panagiotis would like to express his appreciation to his family for always fully supporting him throughout a long, exciting and instructive academic path. Furthermore, a special thank goes to Michael Assmann for his valuable support throughout the thesis generation and Michael Stange for several productive discussions regarding the master thesis.

i
Table of Contents 1 Introduction .............................................................................. 1
1.1 Background .............................................................................................................. 1 1.2 Problem Statement ................................................................................................ 2 1.3 Purpose ..................................................................................................................... 3 1.4 Disposition ............................................................................................................... 3
2 Methodology ............................................................................. 5 2.1 Research process ................................................................................................... 5 2.2 Research Approach ............................................................................................... 5 2.3 Research Method ................................................................................................... 6
2.3.1 Research Strategy ..................................................................................... 6 2.3.2 Methodological Choice ........................................................................... 6 2.3.3 Time horizon ............................................................................................. 6 2.3.4 Searching process of selected literature ............................................. 7
2.4 Data collection ........................................................................................................ 7 2.4.1 Questionnaire ............................................................................................ 7 2.4.2 Sample selection ........................................................................................ 7
2.5 Questionnaire design ............................................................................................ 8 2.5.1 Scaling and measurement ........................................................................ 8 2.5.2 Reliability ..................................................................................................... 8 2.5.3 Validity ......................................................................................................... 9
2.6 Data analysis ............................................................................................................ 9
3 Literature review .................................................................... 11 3.1 Key Terminologies .............................................................................................. 11 3.2 Previous research on supply chain vulnerability .......................................... 12 3.3 Elements affecting supply chain vulnerability ................................................ 13
3.3.1 Supply chain practices ........................................................................... 13 3.3.2 Supply chain risk mitigation measures .............................................. 14
3.4 Normal Accident Theory .................................................................................. 15 3.5 SCOR model as a guiding frame ...................................................................... 15 3.6 Common supply chain practices in the automotive industry ................... 17
3.6.1 Source ...................................................................................................... 17 3.6.2 Make ......................................................................................................... 17 3.6.3 Deliver ...................................................................................................... 18
3.7 Supply chain practices and NAT conformity ................................................ 18 3.7.1 Increase in the number of exposure points .................................... 18 3.7.2 Increase in time/distance ...................................................................... 19 3.7.3 Decrease in flexibility ............................................................................ 19 3.7.4 Decrease in redundancy ....................................................................... 20 3.7.5 Supply chain complexity ....................................................................... 20
3.8 Supply chain risk sources .................................................................................. 22 3.8.1 Supply-side risks ..................................................................................... 23 3.8.2 Demand-side risks ................................................................................. 23
3.9 Supply Chain Vulnerability Model .................................................................... 24 3.10 Hypotheses ........................................................................................................... 25
4 Empirical findings ................................................................... 27

ii
4.1 Respondents ......................................................................................................... 27 4.2 Reliability ............................................................................................................... 27 4.3 Descriptive Statistics .......................................................................................... 28
4.3.1 Mean and Standard Deviation ............................................................. 28 4.3.2 Percental distribution of responses ................................................... 31
4.4 Ordinary Least Square Regression .................................................................. 32 4.4.1 Check of underlying assumptions ...................................................... 32 4.4.2 Evaluation of regression models ......................................................... 33 4.4.3 Evaluation of independent variables .................................................. 34
4.5 Mann-Whitney-U-Test ....................................................................................... 36 4.6 Spearman correlation ......................................................................................... 36 4.7 Consolidation of empirical findings with the SCVM ................................... 38 4.8 Hypothesis ............................................................................................................ 38
5 Analysis .................................................................................... 42 5.1 Analysis of relationships regarding hypotheses H1 and H2 ...................... 42
5.1.1 Quality problems of delivered parts ................................................. 42 5.1.2 Poor logistics performance of suppliers ........................................... 42 5.1.3 Production capacity constraints ......................................................... 43 5.1.4 Mismatch projected and actual demand ........................................... 45
5.2 Analysis of correlations regarding hypotheses H3 and H4 ....................... 48 5.3 Analysis of significant differences regarding hypotheses H5 and
H6 ........................................................................................................................... 49
6 Conclusion ............................................................................... 50 6.1 Academic implications ........................................................................................ 50 6.2 Managerial implications ...................................................................................... 50 6.3 Limitations ............................................................................................................ 51 6.4 Future Research .................................................................................................. 51
References
Appendix Appendix 1: OLS regression for quality problems of delivered parts .......................... 59 Appendix 2: OLS regression for poor logistics performance supplier ......................... 60 Appendix 3: OLS regression for poor logistics performance LSP (inbound) ............. 61 Appendix 4: OLS regression for production capacity constraints supplier ................ 62 Appendix 5: OLS regression for mismatch projected and actal demand .................... 63 Appendix 6: OLS regression for poor logistics performance of LSP (outbound) ..... 64 Appendix 7: Mann-Whitney-U test for quality problems of delivered parts .............. 65 Appendix 8: Mann-Whitney-U test for poor logistics performance supplier ............. 65 Appendix 9: Mann-Whitney-U test for poor logistics performance LSP (inbound) . 66 Appendix 10: Mann-Whitney-U test for production capacity constraints supplier .. 66 Appendix 11: Mann-Whitney-U test for mismatch projected and actal demand ...... 67 Appendix 12: Mann-Whitney-U test for poor logistics performance of LSP
(outbound) ................................................................................................................. 67 Appendix 13: Spearman Correlation ................................................................................... 68 Appendix 14: Questionnaire .................................................................................................. 70

iii
Figures Figure 2.1 Research process. .................................................................................................... 5 Figure 3.1 Supply chain management practices and vulnerability causing factors
(Stecke & Kumar, 2009). ......................................................................................... 14 Figure 3.2 Elements affecting supply chain vulnerability. ................................................. 15 Figure 3.3 SCOR-model (adapted from [SCC, 2006]) ..................................................... 16 Figure 3.4 Supply Chain Vulnerability Model. ..................................................................... 24 Figure 4.1 Distribution of all responses divided on each supply chain practice. ........ 31 Figure 4.2 Distribution of all responses divided on each supply chain risk. ................ 32
Tables Table 1.1 Outline of the thesis ................................................................................................. 3 Table 3.1 Definitions of SCOR process elements (adapted from [Poluha, 2014]) ... 16 Table 3.2 SCM practices and vulnerability causing factors (adapted from [Stecke &
Kumar, 2009]) ........................................................................................................... 21 Table 4.1 Interpretation of Cronbach α scores ................................................................ 27 Table 4.2 Cronbach α and Inter-Item correlation scores ............................................... 28 Table 4.3 Mean and Standard Deviation of supply chain practices ............................... 29 Table 4.4 Mean and standard deviation of supply chain risks ......................................... 30 Table 4.5 Model summary and ANOVA test ..................................................................... 33 Table 4.6 Coefficient table of the OLS regression models ............................................. 34 Table 4.7 Mann-Whitney-U test results .............................................................................. 36 Table 4.8 Interpretation of correlation coefficient ........................................................... 37 Table 4.9 Spearman's rank correlation ................................................................................ 37 Table 4.10 Completed SCVM ................................................................................................ 38 Table 4.11 Overview of hypotheses test results ............................................................... 38

1
1 Introduction The first chapter of this research study provides an introduction to the reader about the topic of supply chain vulnerability with a focus on the automotive industry. The problem statement outlines the main problem that the research study intends to address and refers to past studies. Based on these themes, the purpose and re-search of this research study is presented. The chapter will end with the outline of this thesis.
1.1 Background “The car has no future. I’m putting my money on the horse.”
Wilhelm II., (1859-1941) German Emperor and King of Prussia
The prediction of Wilhelm the 2nd, emperor of Germany between 1859 and 1941, did not prove to be true. The number of automobiles sold worldwide in 2013 was around 72.3 mil-lion units (VDA, 2014). Thus, the automotive industry is one of the world's most im-portant economic sectors (Reviews, 2012).
Due to the worldwide increase in the number of produced automobiles, which indicates an oversaturated market and the transition from seller to buyer's market, profound changes are observed in the automotive industry for quite some time (Cosentino, 2009).
Firstly, time to market is decreasing since customers are continuously demanding new products and innovations, so producers need to position new products on the market in much shorter intervals in order to remain competitive (Mehra *, 2005). Due to this fact, companies are required to place higher focus on their core competencies. Activities that are not part of these core competencies are being outsourced to suppliers (Bennett & Klug, 2012). This trend is reflected, amongst others, in the further reduction of components manufactured in-house of the Original Equipment Manufacturers (OEM). Thanks to economies of scale, which can be realized by specialized suppliers, OEMs retrieve more and more from the basic production process. Thus, the concentration in the value chain is increasingly moving to the suppliers’ side. While the value share on OEM side has nearly halved since the beginning of the eighties, in 2012 it was only 20% (Schmidt, 2013). In oth-er words, the OEM’s created only one-fifth of the value of all automobile parts themselves. This implies that the interactions between supply chain partners have to be trustful and close-connected, which can be achieved through a stronger supplier integration (Adhitya, Srinivasan & Karimi, 2009). Moreover, suppliers are developing themselves to become ho-listic service providers, who not only produce basic components but also develop complete modules and deliver material to various customers in a timely manner through sophisticat-ed delivery methods (Harris, Harris & Streeter, 2010). Therefore, suppliers are required to acquire additional skills as e.g. in the areas of production, development and logistics.
Thus, it can be established, that OEMs and their suppliers need to build up an efficient network in which each party focuses on their core competencies. Accordingly, Adhitya et al. (2009) state correctly that nowadays not only firms are competing against each other but also whole supply chain networks. Hence, firms need to draw their attention both to inter-nal and external business processes. The aim must be to successfully synchronize and streamline these supply chain processes.
This is also underlined by the findings of Benn Lawson, Storey, Emberson, Godsell and Harrison (2006), that cooperation is one of the key trends within SCM. Improved techno-logical development is another aspect that has helped supply chains to improve their com-petitiveness and to become more efficient. For instance, Lancioni, Smith and Schau (2003)

2
exemplifies tools, which enable firms to communicate and exchange information more ef-ficiently. According to these researchers, a possible outcome of the proper use of technol-ogies is that less stock inventory is required throughout the chain, which can be considered a major improvement and advantage in comparison to other firms and their supply chains.
According to Childerhouse, Hermiz, Mason-Jones, Popp and Towill (2003) companies try to meet their needs and further trends by implementing several approaches for optimizing supply chain processes. This idea e.g. is integrated in the automotive industry with the help of widely used concepts such as ship-to-line, single and multi sourcing or Vendor Managed Inventory (VMI) in order to generate leaner and more efficient supply chains (Svensson, 2004).
However, albeit all these mentioned trends seem to foster improved supply chain perfor-mance and competitiveness, they also increase the potential probability of supply chain risks. Outsourcing and off-shoring initiatives, for instance, raise the complexity of internal and external supply chains respectively, e.g. due to the increased number of different firms that a product has to pass before it can be delivered to end-consumers (Adhitya et al., 2009). The dependence on technology and its seemingly beneficial impacts on stock inven-tory also fosters supply chain vulnerability with regards to possible technological problems (Lancioni et al., 2003) or out-of-stock situations caused by an unexpected disruption (Adhitya et al., 2009).
Furthermore, single sourcing strategies and the integration of a few key suppliers have the potential to trigger disruptions along the supply chain with severe possible negative effects due to the high dependency among the partners (Adhitya et al., 2009). As Sheffi and Rice (2005) cover in their study, the British car brand Land Rover had issues with producing one of its car models due to financial problems of its only supplier for chassis components that resulted in bankruptcy of that supplier. High losses due to long lasting halts of the produc-tion lines could only be prevented through costly reactive measures. Thus, researchers ade-quately mention that practitioners always have to consider the trade-off between supply chain efficiency and risk (Wagner & Neshat, 2012) or between efficiency and vulnerability (Adhitya et al., 2009).
Therefore, especially in today’s dynamic business environment that requires supply chain managers to take appropriate measures to become efficient and competitive, further re-search within the area of supply chain risk management is of great importance in order to avoid too risky supply chain strategies.
1.2 Problem Statement Elements affecting supply chain vulnerability are supply chain practices and risk mitigation measures (Stecke & Kumar, 2009; Micheli, Mogre & Perego, 2013). According to research-ers, managing these elements is of great importance for the sustainability of firms and their supply chain networks (Wagner & Bode, 2006; Micheli et al., 2013). Recent supply chain failures have demonstrated the importance to take mitigative measures against high expo-sure to risks by serving as examples of how devastating the effects can be if supply chain vulnerability is not considered appropriately (Wagner & Bode, 2006). For that reason, re-searchers have responded to the needs of practitioners to investigate the issue of supply chain vulnerability in order to provide practitioners with new insights and helpful contribu-tions (Craighead, Blackhurst, Rungtusanatham & Handfield, 2007). According to Craighead et al. (2007) literature on identifying driving factors of supply chain vulnerability exists, however, the extent of research in that specific field is not very comprehensive yet.

3
A major drawback of previously conducted research is the qualitative research method that has been used frequently and thus does not allow to draw conclusions about causalities be-tween supply chain practices and supply chain risks but only answers explorative questions without providing any statistical evidence or significance of the findings (Svensson, 2004; Peck, 2005; Stecke & Kumar, 2009).
The few quantitative studies that have been conducted in this field examine supply chain vulnerability practices with statistical explanatory significance, however, the examined sup-ply chain practices do not cover in sufficient detail the most current supply chain practices that are used especially within industries which are very demanding and sophisticated in re-gards to their supply chain structure like the automotive industry (Wagner & Bode, 2006; Craighead et al., 2007; Thun & Hoenig, 2011). For instance, in one of the most recent stud-ies in that field, Thun and Hoenig (2011) name “efficiency” amongst others as one driver of supply chain vulnerability, which constitutes a supply chain driver only in a very broad sense, since there are various supply chain practices or concepts that aim for efficiency such as the elimination of zero value activities (Martínez Sánchez & Pérez Pérez, 2001) or ship-to-line sourcing (Dickmann, 2008). Therefore, not only is there a gap in literature to be filled, but also a gap between literature and practitioners, since current research lacks the necessary in-depth investigation of supply chain practices and thus there is a lack of practi-cability in current research in order to be of use for practitioners. Practitioners who face the challenges of their vulnerable supply chains daily and apparently experience high finan-cial losses because the issue of vulnerability is not treated sufficiently, depend on comple-mentary empirical studies by researchers focussing on currently used supply chain practices (Wagner & Neshat, 2010).
1.3 Purpose The purpose of this research is the analysis of elements affecting supply chain vulnerability, within the automotive industry. In order to achieve this, cause-effect relationships, correlat-ions and differences of the elements affecting supply chain vulnerability are statstically in-vestigated.
1.4 Disposition Table 1.1 presents the outline of this research.
Table 1.1 Outline of the thesis
Content
Chapter 1 Introduction
The first chapter outlines the background on the topic of supply chain vulnerability within the automotive industry and introduces the problem statement and purpose of the study.
Chapter 2 Methodology
The second chapter describes all the choices that the authors made con-cerning the methodology of this research.

4
Chapter 3 Literature
review
In chapter three the literature is reviewed, around which this research is designed. The information stated in this chapter is used as a base for the upcoming chapters and for the formulation of hypotheses.
Chapter 4 Empirical findings
In chapter four, the empirical data is presented which has been derived by quantitative analysis. Moreover, the formulated hypotheses are tested.
Chapter 5 Analysis
In chapter five, the authors analyze the empirical findings, based on test-ed hypotheses and stated literature.
Chapter 6 Conclusion
This research concludes with a chapter summarizing the major findings within this research in regards to managerial and academic implications, limitations and propositions for further research.

5
2 Methodology The following chapter will present the Methodology used in this research study. The reader will be first in-troduced to the overall research process, the research approach and research method. After that information about the data collection and questionnaire will follow before the chapter will end with a detailed overview of how the researchers conduct the quantitative data analysis.
2.1 Research process The research process of this study consists of six blocks (see Figure 2.1): Problem state-ment, methodology choices, literature review, Supply Chain Vulnerability Model (SCVM), empirical study and statistical data analysis. The starting point of the research process con-stitutes the problem statement after a preliminary literature review has been conducted. In this block the authors identify current gaps within the supply chain vulnerability literature and formulate the purpose of the research. Subsequently, appropriate methodology choices are selected in order to achieve the purpose of this research and to test the formulated hy-potheses. In order to obtain a deeper knowledge in the field of supply chain vulnerability an extensive literature review is conducted thereafter. After reviewing literature and under-standing the holistic concept of supply chain vulnerability and its influencing elements, the authors structure and merge major crucial parts of the literature review into the compre-hensive SCVM. Simultaneously the authors initiate the empirical study by using a web based questionnaire. After gathering all the data, a statistical data analysis is performed in order to fulfil the purpose of this study and to test the formulated hypothesis.
Figure 2.1 Research process.
2.2 Research Approach Dealing with the question of research approach, Saunders, Lewis and Thornhill (2009) de-termine three possibilities which are inductive, deductive and abductive. Hence, as this re-search study follows a deductive approach, the authors present a closer overview for this particular approach. Wilson (2014) introduces the deductive approach by dividing it up in two parts. Firstly, to develop hypotheses based on existing theory and in a second step to design a research strategy around the hypotheses in order to test them. Based on a com-prehensive literature review on the topic of supply chain vulnerability the authors identify the main elements affecting supply chain vulnerability and develop six hypotheses, which need to be tested with the help of an appropriate research strategy. Moreover, a deductive research approach has the characteristic of explaining known phenomenon or theory and test during the research study if this stated theory is also valid in other defined circum-stances (Beiske, 2003). The authors consider the Normal Accident Theory (NAT) as basic theory and test with the help of formulated hypotheses, if the main implications of this theory can also be applied in the field of supply chain vulnerability within the automotive industry.

6
2.3 Research Method
2.3.1 Research Strategy
Focusing on research strategies Saunders et al. (2009) give the assumption that the deduc-tive approach, which is present in this research study, is usually connected to a survey strat-egy. Jackson (2011) generalizes the aim of survey strategy as “questioning individuals on a topic or topics and then describing their responses”. Furthermore, by conducting a survey the authors are able to describe the population in terms of different characteristics and also to test rela-tionships and assumptions based on this population (Jackson, 2011). For that purpose ap-propriate survey tools are interviews, questionnaires and document reviews (Robson, 2002; Denscombe, 2014).
Moreover, as this research study aims to establish the causal relationship between several predictor and response variables, the explanatory nature is applied (Saunders et al., 2009). In order to investigate this causal relationship, the authors collect primary data by using a web-based questionnaire, whose data are then used for further statistical analysis.
2.3.2 Methodological Choice
According to Saunders et al. (2009), researchers have the possibility to conduct a research by employing a qualitative, quantitative, or a mixed design by making use of both. A qualitative research normally involves a smaller sample size, employs an unstructured re-search design and focuses at contributing with insight and understanding (Malhotra & Birks, 2007). Saunders et al. (2009) add that non-numerical data analysis and data collection techniques as categorization and interviews are employed in qualitative researches.
Bryman and Bell (2007) state that quantitative research “entails the collection of numerical data and exhibits the view of relationship between theory and research”. Malhotra and Birks (2007) add that statistical analyses need to be employed in quantitative researches in order to be able to see, understand and interpret the numerical input gathered from the population.
The similarities of the above stated definitions with the author’s objectives in this study lead to the decision to adopt the quantitative approach in this study. The research derives from an extensive literature review and forms hypotheses to test the relationship of varia-bles. By means of a survey, firms are asked to rate variables on a scale, which results in data that can be converted into numerical data to be used for statistical testing. The purpose and approach of this research therefore suggest the use of a quantitative research methodology, which allows drawing conclusions regarding causalities among independent and dependent variables.
2.3.3 Time horizon
According to Saunders et al. (2009), the major distinction in deciding on the time horizon of a research study is whether a longitudinal or a cross-sectional study is conducted. Whereas the longitudinal study considers developments and changes of the research sub-ject over a period of time, the cross-sectional study only considers its situation at a certain point of time, which resembles a “snapshot” approach. As Robson (2002) mentions, a cross-sectional study is especially favourable when the survey strategy is used. Since this is the case within this research and moreover the fulfilment of the purpose of this research does not require observations of changes or developments over time, the cross-sectional study is employed.

7
2.3.4 Searching process of selected literature
In order to obtain relevant and up to date data the authors conduct a structured literature search in two ways. Firstly a keyword search is used in the major databases as e.g. EBSCO / Taylor and Francis / Emerald Inside /Science Direct etc. to search for relevant articles within journals related to logistics, operations management, supply chain management, purchasing and alike. The focus has been mainly on the following keywords: supply chain vulnerability, supply chain risk, risk assessment, uncertainty, reliability, and resilience. Fur-thermore, different combinations of key words were comprised in the following search syntax:
("Supply Chain Management" OR Logistic* OR Lieferkette OR Automoti* OR Suppli*) AND (Vulnera*) AND (Liabi* OR Suscepti* OR Flexib* OR Complex*OR Uncertainty OR Reliabi*)
Furthermore, within relevant articles that are found using the structured keyword ap-proach, the authors identify frequently cited authors. These authors are therefore supposed to have conducted respectable research work in their respective field of research and thus enriched this research with knowledge that has been widely accepted.
2.4 Data collection
2.4.1 Questionnaire
As mentioned beforehand, the survey strategy will be used in this research study using a questionnaire for primary data collection. Questionnaires can be undertaken in various ways. The major distinction is made in interviewer-administered questionnaires which in-cludes the means of telephone or in person, or self-administered questionnaires without the researcher being present at the moment of surveying, e.g. through e-mail or online-questionnaires (Saunders et al., 2009). However, common to all the various techniques is that the set of questions asked is predefined for all respondents and thus questionnaires al-low the collection of huge data (Saunders et al., 2009).
For this research, a personal presence of the authors is not intended and the questionnaire is therefore conducted through an online questionnaire. This is due to the wide geograph-ical spread of the respondents of this survey and the rather self-explaining questions posed. Moreover, the size of the required sample in relation to the time designated to the academ-ic course within which this research is conducted, does not allow the authors to employ an interviewer-administered questionnaire. Finally, the respondents aimed for in this survey are holding supply chain management job positions in the middle management, e.g. prod-uct category managers. This implies that their time constraints favour rather a self-administered questionnaire allowing more flexibility regarding the time of answering the questionnaire. Furthermore, Malhotra and Birks (2007) state further advantages of web-based questionnaires with regard to low costs, high degree of standardization, lower time effort and improved data quality due to possibilities of built-in controls.
To conduct the online survey, the authors choose Qualtrics, a provider of web-based sur-vey solutions.
2.4.2 Sample selection
The sample frame of the present research is of extreme size and unclear to define. Basical-ly, all companies worldwide that are involved in supply chain networks of the automotive industry are part of the sample frame. However, it is likely, that some companies have their

8
focus rather in another industry although involved in the automotive industry. It is there-fore not possible to specify the sample frame accurately, which leads to the conclusion that the non-probability sampling has to be applied. This implies that statistical representations from a population cannot be derived in this study (Saunders et al., 2009).
In order to have reliable statistical data for the statistical analysis to be conducted in the further research process, the authors consider the minimum number of responses. Saunders et al. (2009) state that the sample size fairly depends on the research objective, credibility and available resources. For a regression analysis examining relationships be-tween variables for instance, VanVoorhis and Morgan (2007) recommend the amount of at least 50 responses. Moreover, VanVoorhis and Morgan (2007) add a rule of thumb accord-ing to which the number of responses must be increased with larger numbers of independ-ent variables by the amount of independent variables.
The self-selection sampling technique appears to be the most appropriate sampling tech-nique for this research considering that a survey is conducted using an online questionnaire. Depending on the availability of access to corresponding respondents, each respondent will be given the opportunity to participate in the survey. However, in the end data collected will depend on the willingness of the respondents to participate in the survey.
2.5 Questionnaire design
2.5.1 Scaling and measurement
The standardised questions posed in the questionnaires are mainly category questions that demand for behavioural data to practices and happenings in the firm. For that purpose each question allows to range the degree of such practices or happenings in five response categories from “strongly agree” to “strongly disagree” or from “very high” to “very low” (Saunders et al., 2009). The authors of this study aim for a respondent-friendly layout, clear usage of words and sufficient explanation of the purpose of the survey, which is especially important since the authors are not present at the moment the survey is conducted and clarifying questions can therefore not be made.
Furthermore, the standard language used for the questionnaire is English in order to avoid different understandings of the questions due to translations and to keep it uniform. All the contacted companies either operate in an English speaking country or have a spread supply chain network all over the globe and therefore are expected be able to understand the ques-tionnaire.
2.5.2 Reliability
Malhotra and Birks (2007) interpret reliability as the probability that a measure is free from random errors. Mitchel (1996) furthermore suggests the approaches internal consistency and alternative form in order to assess reliability.
The alternative form approach can help to assess reliability of the questionnaire. In this ap-proach two alternative forms of the same questions need to be constructed and then meas-ured at two different sections of the questionnaire by the same respondent (Malhotra & Birks, 2007). Mitchell (1996) adds, that these “check questions” are more suggestive for longer questionnaires. Thus, this approach was considered as inappropriate for the ques-tionnaire designed for this research which included merely seven questions.

9
For this research the internal consistency approach is exerted with the help of the Cronbach’s alpha method. This method uses a correlation in order to measure the con-sistency of responses across the questions of a sub-group of questions or the entire amount of questions (Mitchell, 1996). The usage of this approach was obligatory for this research as it assesses the reliability of the questions within each of the three sub-groups source, make and deliver for supply chain practices and the two sub-groups supply-side and demand-side risks for supply chain risks. Moreover, another possibility of measuring internal consistency is introduced by Briggs & Cheek (1986) who make use of the mean of inter-item correla-tion. Therefore, in order to ensure internal consistency in this research study, the authors apply both methods.
Furthermore, using an online questionnaire is enhancing reliability since personal e-mails are most often replied by the same person (Witmer, Colman & Katzman, 1999). That way it can be further assured that the right person answers the questions, which has a positive effect on the reliability issue.
2.5.3 Validity
Validity regarding questionnaires refers, according to Saunders et al. (2009), to the ability of a questionnaire to measure what is intended to be measured. When referring to validity in combination with questionnaires often the different ideas of criterion validity, content va-lidity and construct validity are mentioned (Malhotra & Birks, 2007).
In order to avoid any incidents with misinterpretations or the possibility of wrong transla-tions, the questionnaire has only been created and distributed in English which can be con-sidered as a common business language. Therefore, the accuracy of expression was assured for each stated question and statement in the questionnaire.
To further ensure validity, the authors also include pilot testing. Bell (2005) advises re-searchers ”however pressed for time you are, do your best to give the questionnaire a trial run“. This statement clearly indicates the importance of conducting a pilot testing before finally send-ing out the questionnaire to gather data. The authors conduct the pilot testing while attend-ing at a summit with four supply chain managers holding a position in the middle manage-ment. The pilot testers have been asked for feedback on the plausibility of the questions, structure, segmentation, design and usability of the questionnaire.
In addition to that, the authors use previous surveys from research studies in the same re-search area (Wagner & Bode, 2006; Thun & Hoenig, 2011) to assimilate their question-naire.
2.6 Data analysis For the purpose of testing the formulated hypotheses the authors use the methods of linear regression, correlation and compare means analysis. The received answers are synchronized into the program IBM SPSS statistics 20, which allows further statistical analysis of the da-ta. With the help of that program, first descriptive tables are created that show the frequen-cies of answers for each variable, as well as coefficient tables, which show how different variables relate to each other in order to establish possible relationships among them.
Pallant (2010) deals with the topic of conducting a regression analysis with SPSS. Regres-sion analyses are used to analyse relationships between a dependent variable and one or more independent variables. Such analyses are primarily used for detecting and explaining relationships between predictor and response variables.

10
The authors use six Ordinary Least Square (OLS) regression models for the linear regres-sion analysis. As the dependent variables (supply-side risks/ demand-side risks) in this re-search are evaluated by using the five-point Likert scale and therefore ordinate in nature, other regression analyses would not be appropriate for further analysis. The models are checked for the underlying assumptions of multicollinearity and autocorrelation. The re-sulting coefficients of the OLS analysis are then used for rejecting or accepting the corre-sponding hypotheses in chapter 3.10.
In addition to that, a correlation analysis is used to search for statistical evidence, if there is a positive or negative correlation between the amount of vulnerability causing factors a practice exhibits and the probability of supply chain risks. In literature, the two most com-monly used correlation analyses are Spearman and Pearson’s correlation (Hauke & Kossowski, 2011). According to Hauke and Kossowski (2011) the nonparametric Spear-man correlation is used to measure direction and strength of the association that exists be-tween two continuous or ordinal scale variables. The Pearson’s correlation on the other hand, measures the linear relationship between two variables of interval scales under the as-sumption of a linear relationship of the two variables. Thus, the authors decide specifically upon the nonparametric Spearman correlation test, which is appropriate regarding the na-ture of the tested variables.
Lastly, a comparison of means is conducted in order to statistically look for a difference of two groups. This is done by using a nonparametric Mann-Whitney-U test. Dancey and Reidy (2007) portray the test method as “equivalent” to the independent t-test, when using ordinal data types. Saunders et al. (2009) emphasize this point by stating that a Mann-Whitney-U test aims to compare the differences between two independent groups, while the dependent variable should be measured on an ordinal level. Thus, by using the Mann-Whitney-U test, the authors are able to asses if the both independent groups who use or do not use preventive mitigation measures for a specific supply chain risk are significantly dif-ferent from each other regarding the probability of the corresponding supply chain risk.

11
3 Literature review This chapter covers the reviewed literature around which the research study is designed. Literature in the field of supply chain risk, supply chain risk sources, supply chain disruption and supply chain vulnerability will be discussed. A chronological overview of past research studies on supply chain vulnerability will be in-troduced and supplemented by the elements driving supply chain vulnerability. The chapter then elaborates the Normal Accident Theory, Supply Chain Operations Reference model which both are used throughout the whole research study. Furthermore an overview of common supply chain practices and supply chain risk sources will be discussed. The chapter will then end with merging stated literature into one comprehensive model, in particular, the Supply Chain Vulnerability Model and the introduction of hypotheses.
3.1 Key Terminologies The field of supply chain risk management encompasses a couple of commonly used key terminologies about which there is still no clear consensus among researchers (Wagner & Bode, 2006). Misinterpretations of these key terminologies can create confusion among the readers and lead to misunderstandings throughout the research. To ensure mutual under-standing of these fundamentals and also in order to set the basis for further explanations, it is necessary to define these terminologies initially. Thus, in the following, four key termi-nologies, which are used frequently throughout the study, are cleared. These are supply chain risk, supply chain disruption, supply chain risk sources, and supply chain vulnerabil-ity.
Supply chain risk:
According to (Wagner & Bode, 2006) risk from a more general perspective is an “elusive con-struct with a variety of meanings, measurements and interpretations depending on the field of research”. They exemplify that risks are not necessarily negative, although this is considered as com-mon sense among many people including high executive managers.
Juttner, Peck and Christopher (2003) are among the only ones who do not attach a negative overtone on supply chain risks by defining it neutrally as a “variation in the distribution of possi-ble supply chain outcomes, their likelihood, and their subjective value”. However, the majority of sup-ply chain researchers considers risk as a negative impact on business performance (Harland, Brenchley & Walker, 2003; Wagner & Bode, 2006; Adhitya et al., 2009; Narasimhan & Talluri, 2009). Since the objective of this research is to investigate the prob-ability of risks with a negative connotation, the term supply chain risk is defined as “the neg-ative deviation from the expected value of a certain performance measure, resulting in negative consequences for the focal firm”, and is thus based strongly on the definition of (Wagner & Bode, 2006).
Supply chain disruption:
A supply chain disruption is caused by an event in- or outside a supply chain that affects a supply chain negatively so that risks actually happen (Kleindorfer & Saad, 2005; Wagner & Bode, 2006; Stecke & Kumar, 2009). Therefore, disruptions are considered as an “unintend-ed, or untoward situation, which leads to supply chain risks” (Wagner & Bode, 2006). Wagner and Bode (2006) further note that different terminologies such as crisis or disturbance might be used to replace the term disruption, depending on the severity of the disruption. In this study however, such distinction is not made.
Supply chain risk sources:

12
By supply chain risk sources, researchers commonly mean the various sources that supply chain disruptions can originate from (Wagner & Bode, 2006). Many different typologies have been used to classify supply chain risk sources (Ceryno, Scavarda & Klingebiel, 2014). For instance, Jüttner (2005) classifies disruptions into the three categories supply, demand, and environmental. According to the applied classification, risks can be named a supply-side risk for example, provided that the negative deviation of the expected performance va-lue was caused by a disruption originating from the supply-side risk source.
Supply chain vulnerability:
As mentioned beforehand, disruptions are causing the occurrence of risks. However, it is not only determined by the disruption how likely and severe the negative consequence on a supply chain is. Here is where the concept of supply chain vulnerability comes into play. Unlike Barros et al. (2013) who add the negative consequences posed by a disruption to the definition of supply chain vulnerability, by stating that “the vulnerability of a company to a disruption in its supply chain is a combination of the disruption probability and its potential consequences”, other researchers do not add this dimension to the definition. Svensson (2004) mentions that “corporate vulnerability is a condition that is caused by time, functional and relational dependencies in a supply chain”, Christopher and Peck (2004) specify it as “an exposure to serious disturbance”, and Wagner & Bode (2006) state that “it is a function of certain supply chain characetristics and that the loss a firm incurs is a result of its supply chain vulnerability to a given supply chain disruption”. Hence, for the purpose of this research the term supply chain vulnerability is a condition of a company within a supply chain that exhibits its exposure to risks. How negatively affected a company is due to a disruption is not part of the supply chain vulnerability definition, since this is only the result of a company’s vulnerability to a certain disruption.
3.2 Previous research on supply chain vulnerability Svensson (2000), as one of the first researchers conducting studies in the field of supply chain vulnerability investigates a conceptual framework for the analysis of inbound logistics vulnerability by exploring the two main dimensions of logistics vulnerability flows - the cat-egories of disturbance and sources of disturbance. The author’s main contribution was to connect the, for that time, new idea of supply chain vulnerability with related concepts as e.g. risk, disruption and uncertainty.
A few years later Peck (2005) constitutes an explanatory research on supply chain vulnera-bility. The findings of the author deal with the relatively undefined understanding of the problem of supply chain vulnerability and the need of analysing this problem from several perspectives. Hence, the limitation of the research is, that Peck focuses more on under-standing the reasons why supply chains are vulnerable to disruptions and not on providing an action plan on how to counteract vulnerability.
Only one year later Peck (2006) then explores a conceptual model. The researcher tries to strengthen the understanding of the connection amongst supply chain management and supply chain vulnerability. The final conclusion of the research is that comparing manageri-al views on supply chain risk and supply chain vulnerability is convenient, though far from being complete. As supply chain management, practitioners and academics should also consider supply chain vulnerability as an integrative and cross-functional discipline.
Neureuther and Kenyon (2009) use an analytical method to develop a risk model in order to assess vulnerability of different supply chain management structures. The research pro-vides guidance for firms that are competing on the basis of cost, quality, flexibility and

13
time. In particular the method identifies cost-effective and risk-reducing improvement tar-gets and generally encourages the awareness of risk for the firm’s supply chain.
In their paper, Wagner and Neshat (2012) try to provide a measurement option for supply chain vulnerability, the so-called Supply Chain Vulnerability Index (SCVI) that is based on survey results from a broad range of German firms of different industries. This SCVI is based on drivers as supply chain performance, firm size (number of employees and sales revenues), production type, logistics importance, supply chain risk planning, and supply chain risk management. The study represents one of the first to develop a measurement of supply chain vulnerability, although the lack of practical applicability must be addressed here, as the usage of more objective and secondary data could have helped to explore more specific and applicable drivers on a deeper level.
A very current contribution to the field of supply chain vulnerability is obtained by Gualandris and Kalchschmidt (2013). The researchers see supply chain risks as the main driver of vulnerability and focus their studies on them. A fragmentation of two main rea-sons for supply chain vulnerability is stated. In particular, the context riskiness and prepar-edness in supply chain risk management. By focusing on these two areas, the authors create and test a conceptual framework in order to obtain an overview on how vulnerable a sup-ply chain is. The main limitation of this framework is that it only focuses on supply chain risk as a type of vulnerability.
3.3 Elements affecting supply chain vulnerability
3.3.1 Supply chain practices
In subsection 3.1 supply chain vulnerability has been defined as a condition of a company within a supply chain that exhibits its exposure to risks. The exhibition of the exposure to risks has to be explored by analyzing the elements affecting supply chain vulnerability. Re-searchers have accounted for supply chain practices as one element driving supply chain vulnerability, although terminologies differ among researchers. Svensson (2004) for in-stance, claims that three types of dependencies drive supply chain vulnerability: time, func-tional and relational dependency. While his classification is rather based on the different dimensions of dependencies, researchers like Barros, Barbosa‐Póvoa and Blanco (2013) cluster vulnerability drivers into a mix of dependencies on supply chain partners and supply chain practices, namely into customer dependence, supplier dependence, supplier consoli-dations, single sourcing, global sourcing, outsourcing and additionally lack of supply chain visibility. Although drivers have been categorized differently, they do not necessarily differ content-wise, since for example global sourcing can result in a time dependence of an OEM towards a supplier due to the long delivery lead time associated with global sourcing (Ruamsook, Russell & Thomchick, 2007).
A similar approach on that issue comes from Wagner and Bode (2006). They state that vulnerability factors, such as interfirm dependence, longer and complex supply chain setups are due to supply chain characteristics, like sourcing-strategies, inventory levels and out-sourcing decisions. This approach has been taken over by Stecke & Kumar (2009), devel-oped further and made visible in quite an easily understandable manner (Figure 3.1).

14
Figure 3.1 Supply chain management practices and vulnerability causing factors (Stecke & Kumar, 2009).
As visible in Figure 3.1, Stecke and Kumar (2009) differentiate between vulnerability caus-ing factors on one axis, such as increase in distance and time, decrease in flexibility, and de-crease in redundancy and supply chain management practices on the other axis, such as globalization, decentralization, and outsourcing. The assumption is that certain supply chain practices comprise certain vulnerability causing factors and therefore increase the vulnerability of a supply chain. Stecke & Kumar (2009) further exemplify that vulnerability causing factors determine the underlying reason why a supply chain practice leads to in-creased vulnerability. Bozarth, Warsing, Flynn and Flynn (2009) identify supply chain com-plexity explicitly as another vulnerability causing factor, which has not been covered by Stecke and Kumar (2009) in that sense. According to Bozarth et al. (2009), this factor is relevant when it comes to the performance of a supply chain and thus needs to be consid-ered.
3.3.2 Supply chain risk mitigation measures
Supply chain practices are not the only element contributing to a supply chain’s degree of vulnerability towards risks. Also risk mitigation measures, if used effectively, can decrease the impact and occurrence of risks on a supply chain (Micheli et al., 2013).
There are preventive and reactive risk mitigation measures. Both need to be initiated by a firm prior to a disruption but only preventive risk mitigation measures reveal their mitigat-ing impact before the disruption occurs, while reactive measures reveal it after the disrup-tion occurs (Thun & Hoenig, 2011). It is therefore, that preventive measures are especially suited to decrease the probability of risks, while reactive measures intend to lower the im-pact of risks that have already occurred (Thun & Hoenig, 2011).
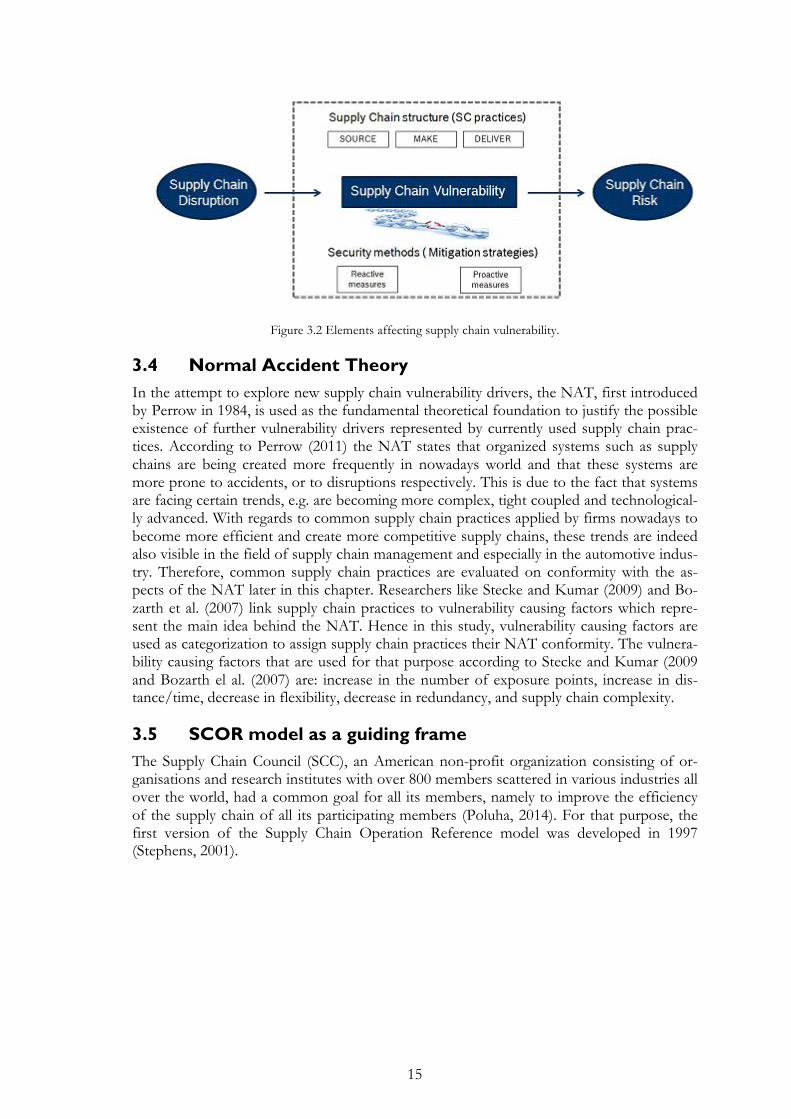
Figure 3.2 shows recapitulatory the construct of supply chain vulnerability as used throughout this study, consisting of the interrelationship between risk mitigations measures and supply chain practices which determine the likelihood and impact of supply chain risks caused by a supply chain disruption.
15
Figure 3.2 Elements affecting supply chain vulnerability.
3.4 Normal Accident Theory In the attempt to explore new supply chain vulnerability drivers, the NAT, first introduced by(Perrow)in 1984, is used as the fundamental theoretical foundation to justify the possible existence of further vulnerability drivers represented by currently used supply chain prac-tices. According to Perrow (2011) the NAT states that organized systems such as supply chains are being created more frequently in nowadays world and that these systems are more prone to accidents, or to disruptions respectively. This is due to the fact that systems are facing certain trends, e.g. are becoming more complex, tight coupled and technological-ly advanced. With regards to common supply chain practices applied by firms nowadays to become more efficient and create more competitive supply chains, these trends are indeed also visible in the field of supply chain management and especially in the automotive indus-try. Therefore, common supply chain practices are evaluated on conformity with the as-pects of the NAT later in this chapter. Researchers like Stecke and Kumar (2009) and Bo-zarth et al. (2007) link supply chain practices to vulnerability causing factors which repre-sent the main idea behind the NAT. Hence in this study, vulnerability causing factors are used as categorization to assign supply chain practices their NAT conformity. The vulnera-bility causing factors that are used for that purpose according to Stecke and Kumar (2009 and Bozarth el al. (2007) are: increase in the number of exposure points, increase in dis-tance/time, decrease in flexibility, decrease in redundancy, and supply chain complexity.
3.5 SCOR model as a guiding frame The Supply Chain Council (SCC), an American non-profit organization consisting of or-ganisations and research institutes with over 800 members scattered in various industries all over the world, had a common goal for all its members, namely to improve the efficiency of the supply chain of all its participating members (Poluha, 2014). For that purpose, the first version of the Supply Chain Operation Reference model was developed in 1997 (Stephens, 2001).

16
Figure 3.3 SCOR-model (adapted from [SCC, 2006])
As seen in Figure 3.3, the SCOR model includes business processes across the entire sup-ply chain and describes the value-added chain from supplier’s supplier up to customer’s customer. In addition, the model describes and shapes the flow of materials, information, products and funding down from raw material suppliers up to the end customers. The model is based on five main management processes: plan, source, make, deliver and return.
Table 3.1 Definitions of SCOR process elements (adapted from [Poluha, 2014])
SCOR pro-cess ele-ments
Definition
PLAN Process that balances aggregate demand and supply to develop a course of ac-tion which best meets sourcing, production and delivery requirements.
SOURCE Process that procures goods and services to meet planned or actual demand.
MAKE Process that transforms a product to a finished state in order to meet the planned or actual demand.
DELIVER Process that provides finished goods and services in order to meet planned or actual demand, typically including order management, transportation manage-ment and distribution management.
RETURN Process which is associated with returning and receiving returned products for any possible reason. These processes extend into post-delivery customer sup-port.
The primary goal of SCOR is to provide a common language for all existing activities alongside the whole value chain and thus a mutual understanding for all participating part-ners. SCOR therefore allows companies to map and standardize their processes along the value chain from their suppliers up to the end users (Poluha, 2014).
As the SCOR model is widely used, discussed and analyzed by several scholars and global companies, the authors apply this model throughout this research as a guiding frame to categorize supply chain practices and supply chain risks.

17
3.6 Common supply chain practices in the automotive industry
3.6.1 Source
As discussed by Heß (2009), sourcing can be interpreted as a generic term for the pro-curement of services, resulting from the combination of individual strategies to a holistic sourcing concept. According to Arnold and Eßig (2000) the sourcing strategies can be con-ceptualized by variations in the number of sources, procurement objects, procurement ar-eas and other parameters. Single sourcing covers the procurement of specific parts for a particular product variant from a single supplier. Ideally the automotive supplier in this case also undertakes the tasks of development, design, manufacturing, assembly and logistics. This creates a tremendous increase in coordination and control tasks of processes for the suppliers (Kinkel & Lay, 2004).
Analogous to single sourcing, multi sourcing strategy refers to sourcing specific parts for a particular product from more than only one supplier (Burke, Carrillo & Vakharia (2007). Commonly applied in the automotive industry is furthermore the concept of modular sourcing that refers to the purchase of prefabricated complex devices or complete systems from so-called modular or systems suppliers (Bennett & Klug, 2012)). Global sourcing deals with the worldwide sourcing of production and non-production materials (Ruamsook et al., 2007). In the course of globalization, it can be assumed that the worldwide purchas-ing activities will be further strengthened. Analogous to global sourcing, the local sourcing strategy refers to national sourcing of production and non-production materials (Eßig & Mohr, 2010).
Further commonly applied practices, which need to be mentioned when dealing with sourcing practices in the automotive industry are the concepts of ship-to-line and ship-to-stock. Both concepts deal with the provision of materials. Dickmann (2008), explains that the ship-to-line approach aims to provide the goods directly to the point of consumption in the assembly line and thus eliminates the necessary internal material flow processes or tem-porarily stored stocks. In contrast, the ship-to-stock concept follows, as the name suggests, an immediate delivery to the customer warehouse (Dickmann, 2008). Terrance and Thomas (2003) introduce the concept of VMI in which the supplier assumes responsibility for the manufacturer’s inventory replenishment on the inbound side to the manufacturing operation. Therefore, the replenishment action is driven by the manufacturer’s production schedule.
3.6.2 Make
Since the management system of lean production became widespread in 1990 (Womack, Jones & Roos, 1990), there have been distinct moves towards adopting the principles on which it is based. Angel Martinez and Manuela Perez (2001) define a lean production checklist according to the most common lean production principles found in the literature. The first principle in this checklist is the elimination of zero value activities. This refers to the elimination of everything that does not add value to the product or service the compa-ny is providing. Another crucial lean production principal in the checklist constitutes the Continuous Improvement Process (CIP). The main objective of it is to search for continu-ous improvements in products and processes (Oakland, 1993). CIP requires not only the involvement of all employees who work in the production but also the support of top management. Both are necessary to create improvement teams and to train employees (Angel Martinez & Manuela Perez, 2001). Another lean principle to mention here is work-

18
ing in multifunctional teams. Working in multifunctional teams greatly facilitates task rota-tion and flexibility to accommodate changes in production levels (Angel Martinez & Manuela Perez, 2001). Lastly, supplier integration must be listed here as it is a feature of lean production that influences several departments like research & development and logis-tics. Dyer (1996) shows that automakers derive high degree of competitiveness out of some specific buyer-supplier relationships with their first-tier suppliers.
Furthermore, Baumgarten (2004) states that the customer should be the final initiator and driving force for the production of its purchase object and thus controls the entire process of added value. This principle is better known as the pull-production. Womack and Jones (1997) also state, that no company should produce any product or service upstream in a supply chain before it is required by the customer downstream. Moreover, according to Liao, Deng and Marsillac (2013) a main principle of lean production must be to create the final variant as late as possible, that is, downstream in the direction of the end user. Only by this late variant formation, OEMs are able to react quickly and flexibly to changing cus-tomer needs nowadays. This principle is also known as postponement (Liao et al. (2013). Postponement is mainly concerned with the decoupling point, which represents the point in the production where the transition from make-to-stock into make-to-order takes place (Ramdas, 2003). Lastly, product variety must be addressed, as MacDuffie, Sethuraman and Fisher (1996) examine in their research that product variety can have limited negative ef-fects on the manufacturing performance in terms of product quality and productivity.
3.6.3 Deliver
Terrance and Thomas (2003) refer to the distributional side of the supply chain while in-troducing the concept of VMI for the outbound side, in which the manufacturer takes over the final responsibility for the customer’s inventory. Thus, the replenishment action is mainly driven by point-of-sale data and not by the production schedule (Terrance & Thomas, 2003). In addition, the concepts of ship-to-line and ship-to-stock can be stated as delivery practices. In this case both concepts deal with the provision of the finished goods towards the customer and not only for the provision of production material which is the case on the source side.
3.7 Supply chain practices and NAT conformity
3.7.1 Increase in the number of exposure points
Various supply chain practices expose supply chains to risks and are thus considered as vulnerability drivers. However, supply chain practices that do so can exhibit different vul-nerability causing factors, which are the underlying reason for a practice constituting a vul-nerability driver (Stecke & Kumar, 2009; Bozarth et al., 2009).
Following Stecke and Kumar (2009), the first identified vulnerability causing factor that conforms with the NAT is the increase in the number of exposure points. Certain supply chain practices therefore, effectuate that supply chains become more extensive by including further links to the supply chain network. When this is the case, disruptions are supposedly more likely to occur.
Having a low in-house production depth, commonly known as outsourcing, is a practice that affects a supply chain in the way that it increases the number of exposure points to possible risks. This becomes evident, seeing that the trend of firms to rely on one’s own core competencies goes along with outsourcing in-house functions to other companies and

19
thus reliance on a wide network of suppliers is inevitable (Hätönen & Eriksson, 2009; Neureuther & Kenyon, 2009). Accordingly, the frequent change of ownership increases the number of critical points where disruptions can occur.
Multi sourcing is another common supply chain practice that exhibits this vulnerability causing factor. By supplying from a multitude of suppliers, the number of exposure points consequently rises as well (Stecke & Kumar, 2009).
When using a global sourcing strategy, a focal firm supplies raw materials and components from all over the world to produce its products. This implies that different modes of trans-ports have to be used in order to get supply to the production plants of the focal firm and various different geographical as well as political areas have to be crossed (Ruamsook et al., 2007). All of that also increases the number of exposure points to possible disruptions throughout the supply chain and thus make a supply chain more vulnerable to risks.
Having an international distribution network is the pendant to global sourcing but on the outbound-side of a supply chain. Just as global sourcing, an international distribution net-work implies that on-time customer demand satisfaction is exposed to a higher failure probability due to the different modes of transport and the crossing of multiple regions of the world (Stecke & Kumar, 2009).
3.7.2 Increase in time/distance
Time and distance, if increased within a supply chain, are two dimensions that increase the probability of supply chain disruptions to occur. The longer it takes for a product to travel, the more likely it can be exposed to an unintended situation resulting in quality or quantity issues for instance (Steven, Dong & Corsi, 2014). The same applies to distance. A shipment of thirty days duration coming from Asia to Europe is more likely to suffer a delayed deliv-ery due to the various possibilities of disruptions than a one-day shipment from a local supplier (Stecke & Kumar, 2009).
A low in-house production depth features the characteristic of an increase in both the time as well as distance dimension due to the distant location of a supplier to his customer, compared to a manufacturer producing required components by himself for instance (Hätönen & Eriksson, 2009).
Furthermore, the supply chain practices global sourcing and international distribution net-work are both naturally associated with long transportation distances and long lead-times and therefore also exhibit the underlying vulnerability causing factor of increased time and distance dimension (Stecke & Kumar, 2009).
3.7.3 Decrease in flexibility
Flexibility within a supply chain refers to the dependency of a focal firm to its suppliers (Stecke & Kumar, 2009). A firm’s sourcing strategy can have a major impact towards the flexibility of a supply chain. When a firm uses a single sourcing strategy it faces quite a sig-nificant possibility to not be able to meet customer demand. For instance, this would be the case if there is a disruption at the supplier’s factory which therefore results in the inabil-ity to deliver the focal firm with required supply (Choi & Krause, 2006) and thus increases its vulnerability. Hence, what makes the single sourcing strategy so risky is that the occur-rence of a single point of failure, which affects the whole supply chain negatively, is much more probable compared to a multi sourcing strategy (Neureuther & Kenyon, 2009).

20
Supplier integration, as another practice that is often applied in the automotive industry, is typically used when the supplier base is very small (Choi & Krause, 2006). Therefore, the previously mentioned probability of a single point of failure, which can have crucial nega-tive impact on the whole supply chain, is also rather high when supplier integration is high. Neureuther and Kenyon (2009) confirm this point by stating that “with increased organization-al integration […] single point of failures could affect all partners within the supply chain”. Kakabadse and Kakabadse (2002) point out further the dependency due to high supplier integration and therefore confirm the high risk of single point of failures. According to them, highly integrated suppliers take over more and more functions of the outsourcing firm and some-times even joint ventures are formed, which leads to the conclusion that risks are shared among each other to a high degree, creating high dependencies.
3.7.4 Decrease in redundancy
It is quite obvious that the ability of a supply chain to meet fluctuating demand decreases with the decrease of inventory stock, which as a result increases the vulnerability of a sup-ply chain especially to demand-side risks. With redundancy, the authors mean exactly this aspect of decreasing buffer in order to conduct a lean strategy, which is frequently con-ducted within the automotive supplier industry (Jayaram, Vickery & Droge, 2008).
Accordingly, all lean supply chain practices that lead to a decrease in redundancy exhibit this vulnerability causing factor (Stecke & Kumar, 2009). The ship-to-line practice is such a sourcing and delivery practice that eliminates internal inventory due to the timely delivery of required goods to the assembly line (Dickmann, 2008). Furthermore the practice of VMI inbound and outbound needs to be mentioned here, as enables suppliers and buyer to align their inventory levels due to a precise, clear and standardized alignment of the demand forecasting process (Saxena, 2009) and thus make the whole supply chain process leaner.
What regards to make practices, the elimination of zero-value activities also exhibits fea-tures of a decrease in redundancies. According to Martínez Sánchez and Pérez Pérez (2001), “Inventories are one of the main sources of inefficiency in industrial companies” and therefore have to be eliminated. Moreover, Martínez Sánchez and Pérez Pérez (2001) also mention that the internal transportation of components to subsequent production areas should be eliminated in order to be able to reduce the amount of goods in process which also results in a decrease in redundancy.
The pull-production principle is a further practice that exhibits the vulnerability causing factor of decrease in redundancy. In comparison to the push-production principle which aims for building up an inventory of finished products prior to specific incoming customer orders, the pull-production effectuates that there is only inventory for specific customer orders and thus there is no buffer intended (Baumgarten, 2004).
3.7.5 Supply chain complexity
In their research study about the impact of supply chain complexity on manufacturing plant performance, Bozarth et al. (2009) investigate how supply chain complexity within the three main management processes source, make and deliver affect plant performance. Bozarth et al. (2009) break down supply chain complexity into detail and dynamic complex-ity, which are influenced by the products, processes and relationships a supply chain mani-fests. More explicitly, detail complexity refers to the idea that a system such as a supply chain gets more complex, the more parts it consists of, while dynamic complexity refers to the idea that the interconnectedness within systems results in much more unpredictable re-actions of the system when few input variables are changed.

21
Inman and Blumenfeld (2014) state ”the more parts in the product, the greater the risk of disrup-tion”. Analogical, a higher product variety implies a higher number of different parts a company has to deal with, which is considered a systemic source of complexity, namely de-tail complexity, by Bozarth et al. (2009).
Supply chain complexity is furthermore driven by the supply chain source practices multi and global sourcing. Multi sourcing clearly indicates an increase in the linkages within a supply chain, which implies that a multitude of relationships, shipments and information have to be managed by the sourcing firm, so detail complexity drives the supply chain complexity in this case (Bozarth et al., 2009). Global sourcing on the other hand indicates increased dynamic complexity due to country-specific regulations such as import and ex-port regulations that come along with global sourcing, different cultures and work habits but also extended and therefore more unreliable lead times which cause difficulties in pro-duction and inventory management planning (Bozarth et al., 2009). Dealing with the supply chain practice VMI, (Pohlen and Goldsby, 2006) emphasize the iportance of high level in-formation technology and trust in relationship between all participating partners in the VMI process. Both aspects can be seen as drivers dynamic complexity as they both covers the interconnectedness through the whole supply chain
An international distribution network has similar dynamic complexity issues as global sourcing. According to Townsend, Yeniyurt and Talay (2008), firms have expanded to in-ternational markets due to globalizing processes and new business opportunities. This means that firms having a high degree of international distribution network also serve a ra-ther high number of customers. Following the reasoning of Bozarth et al. (2009) regarding high number of customers, this assumes that an international distribution network increas-es supply chain complexity through increased detail complexity. Besides that, when firms enter international markets customer needs differ quite a lot (Townsend et al., 2008) which results in an heterogeneity of customer needs. Da Silveira (2005) accounts for heterogeneity of customer needs as a factor increasing supply chain complexity through dynamic com-plexity since certain customers are considered as more important and thus have a preferen-tial status over other customers, which has immediate complicating effects on a firms man-ufacturing planning.
Figure 3.2 is an extract of the SCVM which is introduced later in this chapter. It gives an overview of all supply chain practices and their corresponding vulnerability causing factors.
Table 3.2 SCM practices and vulnerability causing factors (adapted from [Stecke & Kumar, 2009])

22
3.8 Supply chain risk sources Supply chain risks can originate from several sources. There have been several propositions for risk sources, with quite some differences between them regarding elaborateness and completeness (Ceryno et al., 2014). Often, differences among the examined risk sources have to do with the scope of the researchers’ studies (Wagner & Bode, 2006). Chopra and Sodhi (2004) for instance, propose nine risk sources, which are disruptions, delays, systems, forecast, intellectual property, procurement, receivables, inventory, and capacity. Due to the detailed classification, the focus obviously seems to be to observe disruptions on the operative level of supply chains more closely. Christopher and Peck (2004) on the other hand, classify risks into internal and external risk sources, which is a quite broad classifica-tion and thus incorporates further possible sub categories.
External supply chain risk sources can be caused by socio-political, economical, technolog-ical or geographical developments and are thus nearly impossible to control by supply chain managers (Thun & Hoenig, 2011). Thun & Hoenig (2011) further subdivide internal supply chain risks into internal company risks and cross-company-based risks, distinguish-ing between supply chain disruptions that occur within the boundaries of a focal firm and between its own and cooperating firms’ boundaries. Within the field of supply chain man-agement, cross-company-based risks are commonly divided into supply- and demand-side risks (Jüttner, 2005; Wagner & Bode, 2006; Manuj & Mentzer, 2008; Thun & Hoenig, 2011). Supply- and demand-side risks are considered as the major risk sources of interest when it comes to supply chain management and thus create a distinct delimitation to gen-eral business risks (Wagner & Bode, 2006). This research does not attempt to consider all possible risk sources, but only considers manageable supply chain risk sources (cross-company based) that occur outside the boundaries of a focal firm and have an effect on the focal firm. Hence, the risk classification in supply- and demand-side risk sources is further applied. Moreover, Thun & Hoenig (2011) encourage this approach by proving empirically that internal supply chain risks occur more frequently than external supply chain risks. In addition to that, Manuj & Mentzer (2008) state that frequent supply chain risks are of greater importance when it comes to risk mitigation and thus internal supply chain risk sources deserve primary attention.
Multi sourcing X X
Single sourcing X
Global sourcing X X X
Ship-to-line X
VMI with suppliers X X
Elim. of zero value activ. X
Pull-production X
Supplier integration X
Low inhouse prod. depth X X X
Product variety X
VMI X X
Ship-to-line X
Intern. Distr. Netw. X X X
Vulnerability causing factors
SOU
RC
EM
AK
E
Supply chain
complexity
Increase number
of exposure
points
Increase in distance/
time
Decrease in
flexibility
Decrease in re-
dundancy
DE
LIV
ER
SCM Practices

23
The initial purpose of conducting supply chain risk management is to mitigate risks that are jeopardising the objectives of a firm (Narasimhan & Talluri, 2009). As prementioned in chapter 1.1, companies nowadays are facing high competitive pressure and therefore need to ensure an efficient and effective supply chain. Thus, costs-efficiency and quality-assurance are two main supply chain objectives that must be aimed for (Ceryno et al., 2014). Many risks can have direct or indirect consequences on these main objectives. In order for this research to meet its claim of managerial practicability, significant risks associ-ated to cost, quality and customer satisfaction need to be included for both risk sources.
3.8.1 Supply-side risks
Risks on the supply-side are dealing with activities occurring on the upstream of supply chains. They can derive from the supplier and from the supply network (Wagner & Bode, 2006) and affect the “supply chain’s ability to continue operations, [...] or provide critical services to cus-tomers” (Jüttner, 2005). As mentioned in previous chapters, OEMs in the automotive indus-try face a high degree of reliance on suppliers due to the decreasing in-house production activities. Although narrowing down the supplier base is an increasing trend, many supplier networks exhibit even 3-tier suppliers (Bennett & Klug, 2012). Thun and Hoenig (2011) exemplify the magnitude of such supplier relationships by drawing an example of the au-tomotive supplier Robert Bosch, who has delivered an engine module to its customers that contained a defect component supplied by one of Robert Bosch’s suppliers. This incident caused high reparation costs and hence emphasises the importance of mitigating supply-side risks. Quality problems of delivered parts must therefore be incorporated in this re-search study, affecting clearly cost and quality supply chain objectives as well as customer satisfaction if not realized and eliminated in time.
Furthermore, poor logistics performance (delivery reliability) in terms of delayed shipments or divergent amount of planned vs. actual amount of incoming materials can have crucial impact on the continuity of firms’ operations (Kallio, Saarinen, Tinnilä & Vepsäläinen, 2000). It has to be distinguished between poor logistics performance that has occurred due to the supplier or due to the logistics service provider.
An important success factor of supply chains is the ability to adapt to customer demand fluctuations (Zhang, Chen & Ma, 2007). Especially the automotive industry, which is highly lean and thus does not hold high stocks of inventory to balance out demand fluctuations, firms are dependent on suppliers’ sufficient production capacity in high demand situations (Liao et al., 2013). Production capacity constraints is therefore to be included to the supply-side risks in this research study.
3.8.2 Demand-side risks
It is obvious, that the same supply chain objectives that have to be considered when choos-ing significant supply-side risks, also need to find their application within the choice of de-mand-side risks and that the continuity of supply chain operations has to be top priority. Demand-side risks are concerned with activities downstream of the supply chain (Svensson, 2002), including the distribution of finished goods to customers and demand forecast activities which go along with possible disruptions and uncertainties (Bogataj & Bogataj, 2007). In terms of demand forecast activities, managers face the risk to mismatch projected and actual demand which can impact customer satisfaction and cause financial losses either due to lost sales or too high redundant inventory levels (Thun & Hoenig, 2011). Undoubtedly, a forecast error is strongly associated with demand fluctuations that depend on such factors as seasonality, product life cycles and economic situations (Ceryno
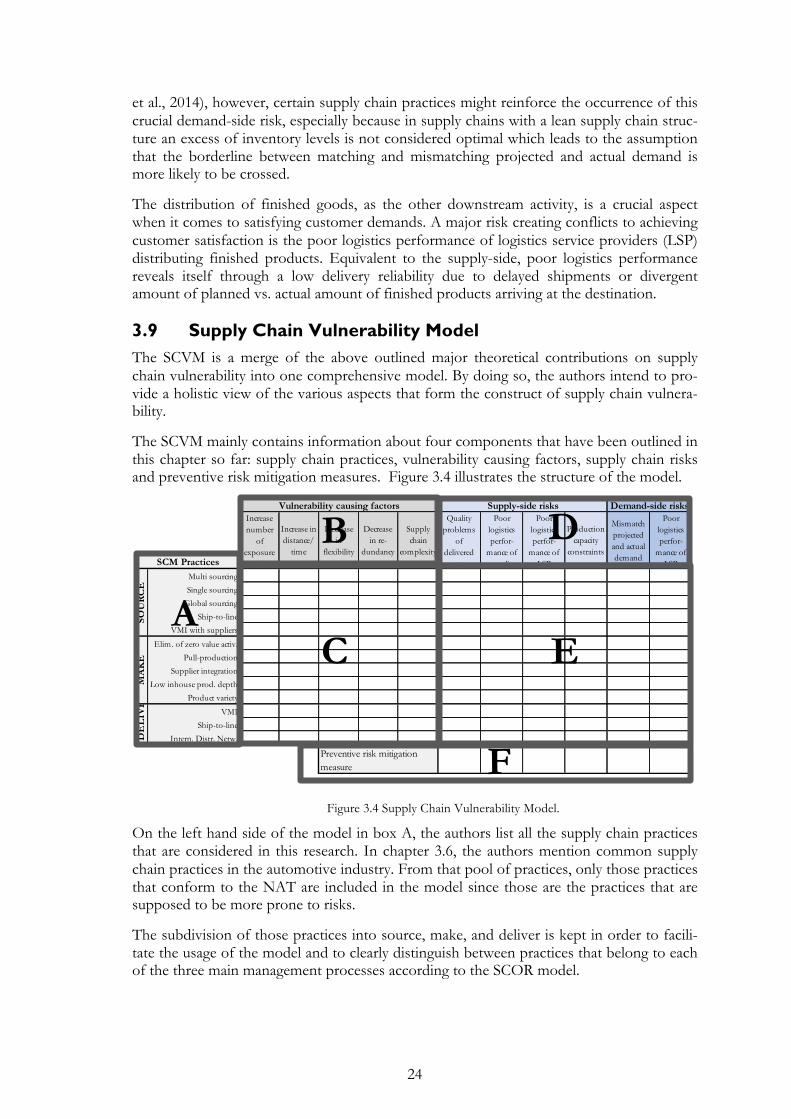
24
et al., 2014), however, certain supply chain practices might reinforce the occurrence of this crucial demand-side risk, especially because in supply chains with a lean supply chain struc-ture an excess of inventory levels is not considered optimal which leads to the assumption that the borderline between matching and mismatching projected and actual demand is more likely to be crossed.
The distribution of finished goods, as the other downstream activity, is a crucial aspect when it comes to satisfying customer demands. A major risk creating conflicts to achieving customer satisfaction is the poor logistics performance of logistics service providers (LSP) distributing finished products. Equivalent to the supply-side, poor logistics performance reveals itself through a low delivery reliability due to delayed shipments or divergent amount of planned vs. actual amount of finished products arriving at the destination.
3.9 Supply Chain Vulnerability Model The SCVM is a merge of the above outlined major theoretical contributions on supply chain vulnerability into one comprehensive model. By doing so, the authors intend to pro-vide a holistic view of the various aspects that form the construct of supply chain vulnera-bility.
The SCVM mainly contains information about four components that have been outlined in this chapter so far: supply chain practices, vulnerability causing factors, supply chain risks and preventive risk mitigation measures. Figure 3.4 illustrates the structure of the model.
Figure 3.4 Supply Chain Vulnerability Model.
On the left hand side of the model in box A, the authors list all the supply chain practices that are considered in this research. In chapter 3.6, the authors mention common supply chain practices in the automotive industry. From that pool of practices, only those practices that conform to the NAT are included in the model since those are the practices that are supposed to be more prone to risks.
The subdivision of those practices into source, make, and deliver is kept in order to facili-tate the usage of the model and to clearly distinguish between practices that belong to each of the three main management processes according to the SCOR model.
Multi sourcing
Single sourcing
Global sourcing
Ship-to-line
VMI with suppliers
Elim. of zero value activ.
Pull-production
Supplier integration
Low inhouse prod. depth
Product variety
VMI
Ship-to-line
Intern. Distr. Netw.
SCM Practices
SOU
RC
EM
AK
ED
EL
IVE
R
Preventive risk mitigation measure
Vulnerability causing factors Supply-side risks Demand-side risksIncrease number
of exposure
points
Increase in distance/
time
Decrease in
flexibility
Decrease in re-
dundancy
Supply chain
complexity
Quality problems
of delivered
parts
Poor logistics perfor-
mance of supplier
Poor logistics perfor-
mance of LSP
Production capacity
constraints
Mismatch projected and actual demand
Poor logistics perfor-
mance of LSP
A
B
C
D
E
F

25
In box of Figure 3.4 the vulnerability causing factors are listed, which identify the practices that exhibit features according to the NAT. In chapter 3.3.1, Stecke and Kumar (2009) are mentioned who identify four vulnerability causing factors that are compatible to the NAT which are therefore included in the comprehensive SCVM. In addition to that, as elaborat-ed by Bozarth et al. (2009), supply chain complexity is also included as a vulnerability caus-ing factor in order to cover all aspects that are suggested by the NAT to increase the proneness to risks.
Box C illustrates in a comprehensible and holistic manner which of the previously men-tioned supply chain practices exhibit which vulnerability causing factors. In a completed model this is depicted by a cross where the practices intersect with each vulnerability caus-ing factor.
In box D, the risk sources and their corresponding risks are listed. As outlined in chapter 3.8, the two risk sources are supply-side risk and demand-side risks.
Boxes E and F become relevant after the statistical tests are conducted, since these fields then show the statistical significance of the various independent variables in regards to eve-ry other dependent variable and the significance of a preventive risk mitigation measure per each risk.
3.10 Hypotheses Based on the preliminary literature review made and the selected theory, this research as-sumes a significant relationship between supply chain practices and supply chain risks.
The NAT implies that supply chains which operate using supply chain practices that exhib-it the incorporation of supply chain vulnerability-causing factors, such as decrease in flexi-bility or decrease in redundancy for instance, must be exposed more likely to the occur-rence of accidents or risks respectively. Thus, in order to accomplish the intended goal of testing the cause-effect relationship between supply chain practices and supply chain risks, the first two hypotheses can be stated:
H1: The higher the degree of a source/make supply chain practice, the higher the probability of a supply-side risk.
H2: The higher the degree of a supply chain practice, the higher the probability of a demand-side risk.
Furthermore, a supply chain practice can exhibit more vulnerability-causing factors than other practices. Thus, it can be assumed that practices which exhibit more vulnerability-causing factors are more prone to risks than other practices. As stated in the purpose, in-vestigating the correlation between elements affecting supply chain vulnerability is an ob-jective of this research. This objective is comprised in the following two hypotheses:
H3: The more vulnerability causing factors a practice exhibits, the higher the probability of supply-side risks.
H4: The more vulnerability causing factors a practice exhibits, the higher the probability of demand-side risks.
As mentioned in chapter 3.3, the vulnerability of a supply chain is also dependent on whether or not it has preventive risk mitigation measures in place. In order to pursue the purpose of this study, the last two hypotheses statistically test if any difference exists be-tween using a preventive mitigation measure or not, in terms of supply chain risks:

26
H5: There is a significant difference between using and not using preventive risk mitigation measures, in terms of the probability of a supply-side risk.
H6: There is a significant difference between using and not using preventive risk mitigation measures, in terms of the probability of a demand-side risk.

27
4 Empirical findings In the following chapter, the reader will be firstly introduced to results of this study in regarding the respond-ents, reliability and descriptive statistics. The further part will cover the statistical analyses that the authors used in order to test the stated analysis. In particular these analysis are the Ordinary Least Square regres-sion, the Mann-Whitney-U-Test and lastly the Spearman correlation. Again, the chapter will end with the Supply Chain Vulnerability Model, this time consolidated with empirical findings, before finally stating the results of the hypotheses.
4.1 Respondents For the present research, a total of 387 questionnaires have been sent out to managers working in a supply chain function within German-based firms of the automotive industry. After seven days, the authors have sent out a reminder e-mail and left the survey active for another four days. In the end, a total of 32 responses could be generated which accounts for a response rate of 8.2 % and is thus somewhat below the expected response rate of ap-proximately 15 %. A possible reason for such a rather low response rate could be assumed due to the time constraints of middle management supply chain managers.
4.2 Reliability In order to test the reliability of scales used in this research, the Cronbachs � and the mean of inter-item correlation was computed. In literature, Cronbachs � is a widely used method to estimate reliability of scales. George and Mallery (2003) provide the following infor-mation regarding the interpretation of reliability (see Table 4.1):
Table 4.1 Interpretation of Cronbach � scores
Cronbachs � Interpretation for reliability
� > .9 Excellent
� > .8 Good
� > .7 Acceptable
� > .6 Questionable
� > .5 Poor
� < .5 Unacceptable
In addition, Briggs and Cheek (1986) make use of the mean of inter-item correlation and state that a figure between .2 and .4 indicates an acceptable level of reliability for a research. The reliability test results by using Cronbachs � and Mean Inter-Item Correlation are con-solidated in Table 4.2.
Taking George and Mallerys’ (2003) interpretation of Cronbachs � scores into considera-tion four out of five scores can be accepted as they all exceed the score of � > .5. Only the supply chain practices (deliver) have a score slightly under .5 (� = .462) and thus cannot be accepted at first. However, as already mentioned, according to Briggs and Cheek (1986) a mean of inter-item correlation over .2 indicates an acceptable reliability level. As the mean

28
inter-item correlation score of supply chain practices (deliver) exceeds � > .2 (� = .206), the authors do accept the two scales items regarding their reliability level.
Table 4.2 Cronbach � and Inter-Item correlation scores
Scales Items Cronbachs �
Mean of in-ter-item cor-
relation Reliability
Supply chain practices (source)
5 .535 .200 Accepted
Supply chain practices (make)
5 .825 .503 Accepted
Supply chain practices (de-liver)
3 .462 .206 Accepted
Demand-side risks 4 .684 .350 Accepted
Supply-side risks 2 .755 .629 Accepted
All scales 19 .886 - Accepted
Finally, the Cronbachs � score of all the 19 items shows the highest score for reliability (� = .886). In general, it can be concluded that all the five scales of this research are identified positively regarding reliability.
Concluding, it can be expected that if the same questionnaire with exactly the same ques-tions would be used once again, the results would be similar and would not differ a lot. By using Cronbachs � in combination with the mean of inter-item correlation, the reliability and consistency of the questionnaire can be accepted even though there is still potential for further improvement for some scales.
4.3 Descriptive Statistics
4.3.1 Mean and Standard Deviation
In the following section, an overview of all relevant descriptive statistics is provided. In Table 4.3 you can see the mean and standard deviation results for each supply chain prac-tice.
What can be derived from Table 4.3 is that certain supply chain practices apply to a greater extent in average among the firms who participated in the survey. Especially the average usage of a high product variety (1.68), global sourcing (1.69) and international distribution network (1.75) have to be pointed out. On the other hand, single sourcing (3.65), ship-to-

29
line both in- and outbound (3.39 / 3.19) and VMI with customers (3.26) are practices that are less applied in average.
Table 4.3 Mean and Standard Deviation of supply chain practices
Supply Chain Practices Mean Std. Devia-
tion
Multi sourcing 2.35 .91
Single sourcing 3.65 .91
Global sourcing 1.69 .59
Ship-to-line (source) 3.39 1.41
VMI with suppli-ers 2.97 1.17
Elim. of zero value activities 3.03 1.20
Pull-Production 2.44 1.05
Supplier integra-tion 2.81 .91
Low in house production depth 2.77 1.38
Product variety 1.68 .94
VMI with cus-tomers 3.26 1.09
Ship-to-line (de-liver) 3.19 1.28
Intern. distribu-tion network 1.75 .95
Thus, Table 4.3 gives a first impression of how the supply chain design of the surveyed companies looks like. Furthermore, it can be concluded that relatively complex and current supply chain practices (as e.g. VMI and ship-to-line concepts) have not yet been fully im-plemented in the supply chain process of the organizations of the respondents, whereas supply chain practices such as global sourcing, product variety and international distribu-tion network, suggest the opposite. These practices coincide with the ongoing process of increasingly preceding internationalization, cost pressure and ever more product choices for the end user (Christopher, 2012).
When referring to standard deviation, researchers talk about a number, which measures the concentration of the data around the mean. With other words, the more concentrated the data is around the mean, the smaller is the standard deviation ratio (Samuels, Witmer &

30
Schaffner, 2012). There is no “right or wrong” or “good or bad” standard deviation. The interpretation of the ratios depends more on the research design that is applied and on the research questions and/or hypotheses that are tested (Samuels et al., 2012). As the aim of this study does not focus on a special high or low ratio on standard deviation, the standard deviation results are only observations and recording of data which reflects, that in the sample that has been tested, a larger amount of variation was obtained for certain supply chain practices in comparison to other practices.
Table 4.4 shows a quite balanced average regarding the estimated probability of risks. However, a rather extreme tendency can be seen for the demand-side risks, where mis-match of projected and actual demand is perceived as rather probable and poor logistics performance of LSP as rather unlikely in comparison to the average perception of proba-bility of the other risks.
Table 4.4 Mean and standard deviation of supply chain risks
Supply Chain Risks Mean Std. Devia-
tion
Quality prob-lems of deliv-ered parts
2.58 .81
Poor logistics performance of supplier
2.42 .85
Poor logistics performance of LSP (inbound)
2.74 .93
Production ca-pacity con-straints
2.35 .75
Mismatch pro-jected and actu-al demand
2.2 .85
Poor logistics performance of LSP (outbound)
3.17 .65
Furthermore, in comparison to supply chain practices, the mean values do not fluctuate so much among the different items. Seeing also that the standard deviation values for supply chain risks are more balanced and do not vary extremely between the individual supply chain practices, it can be concluded that there is not a big discrepancy in how likely a risk might occur, but a big discrepancy regarding to the degree of usage of supply chain practic-es.

31
4.3.2 Percental distribution of responses
In order to visualize the data outcomes of our questionnaire an 100% aggregated stacked bar is created for supply chain practices and supply chain risks.
Figure 4.1 Distribution of all responses divided on each supply chain practice.
In Figure 4.1 a detailed percentile breakdown of all responses in terms of their rating scale preference is visible. It can be seen that the use of the supply chain practices global sourc-ing (38 %), product variety (55 %) and international distribution network (50 %) were often rated with ”strongly agree”. This information reinforces the relatively low mean scores of these three practices (see Table 4.3).
The strongest ratings that are visible is “Agree” for global sourcing (56 %), followed by “Agree” for multi sourcing (55 %), “Disagree” for single sourcing (55 %), and “Strongly agree” for product variety.
Lastly, some supply chain practices have not been rated with ”strongly disagree” at all by any of the respondents. That was the case for multi sourcing, global sourcing, supplier in-tegration and product variety.
13%
0%
38%
16%
13%
6%
13%
6%
26%
55%
6%
13%
50%
55%
16%
56%
13%
23%
32%
53%
32%
16%
32%
19%
19%
34%
16%
16%
6%
10%
26%
29%
19%
35%
26%
3%
26%
16%
6%
16%
55%
0%
39%
32%
16%
9%
26%
19%
10%
39%
39%
9%
0%
13%
0%
23%
6%
16%
6%
0%
13%
0%
10%
13%
0%
0% 20% 40% 60% 80% 100%
Multi sourcing
Single sourcing
Global sourcing
Ship to line (source)
VMI with suppliers
Elimination of zero value activities
Pull-production
Supplier integration
Low in house producion depth
Product variety
VMI with customers
Ship-to-line (deliver)
Intern. Distibution network
Strongly Agree Agree Neither Agree nor Disagree Disagree Strongly Disagree

32
Figure 4.2 Distribution of all responses divided on each supply chain risk.
Figure 4.2 shows the frequencies for the rating of supply chain risks which are rated from very high to very low. It can be seen that the three risks poor logistics performance of sup-plier (55 %), production capacity constraints (62 %), and mismatch projected and actual demand (67 %) were estimated as high or very high by more than 50 %, while, for instance, poor logistics performance LSP (outbound) was only rated high or very low by 5 %. How-ever, still the mean average is quite similar among these risks as Table 4.4 has shown.
Respondents estimated by far the probability of facing the risk of poor logistics perfor-mance of LSP (outbound) on the poorest level, with scores of moderate (67%) and low (27%). It is quite remarkable though, that no respondent has estimated the probability of any risk with very low, which implies a rather sceptical attitude towards the resilience of the firms towards risks in general.
4.4 Ordinary Least Square Regression
4.4.1 Check of underlying assumptions
In order to allow suggestions about dependencies among independent and dependent vari-ables, the authors use a total of six OLS linear regression models, one per each dependent variable.
Beforehand, the assumptions underlying the OLS regression are tested to ensure the ap-plicability of that regression method. For that purpose, the authors test the models for mul-ticollinearity and autocorrelation.
In order for the model to negate multicollinearity, the value of the variance inflation factor (VIF) must be below ten (Mela & Kopalle, 2002). The authors observe that the value of VIF for the practices “pull-production” (20.5) and “product variety” (12.3) are above the norm. Unaltered, this leads to wrong conclusions in regards to the predictability of the oth-er independent variables on the dependent variable. A way to mitigate that issue is to mean-center the variables that show high collinearity (Mela & Kopalle, 2002). However, this does not show an alleviating impact on the models of this study. As a consequence both varia-
6%
13%
10%
10%
20%
3%
42%
42%
29%
52%
47%
3%
39%
35%
39%
32%
27%
67%
13%
10%
23%
6%
7%
27%
0% 20% 40% 60% 80% 100%
Quality problems of delivered parts
Poor logistics performance of supplier
Poor logistics performance of LSP (inbound)
Production capacity constraints
Mismatch projected and actual demand
Poor logistics performance LSP (outbound)
Very High High Moderate Low Very Low
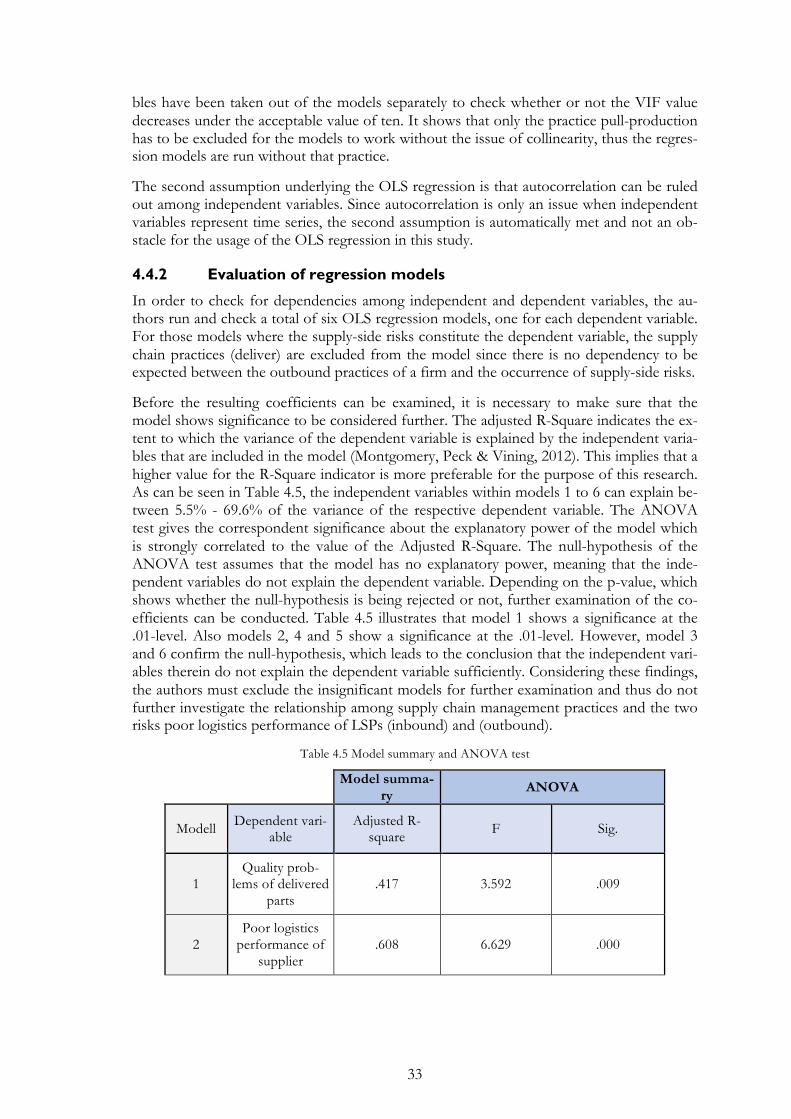
33
bles have been taken out of the models separately to check whether or not the VIF value decreases under the acceptable value of ten. It shows that only the practice pull-production has to be excluded for the models to work without the issue of collinearity, thus the regres-sion models are run without that practice.
The second assumption underlying the OLS regression is that autocorrelation can be ruled out among independent variables. Since autocorrelation is only an issue when independent variables represent time series, the second assumption is automatically met and not an ob-stacle for the usage of the OLS regression in this study.
4.4.2 Evaluation of regression models
In order to check for dependencies among independent and dependent variables, the au-thors run and check a total of six OLS regression models, one for each dependent variable. For those models where the supply-side risks constitute the dependent variable, the supply chain practices (deliver) are excluded from the model since there is no dependency to be expected between the outbound practices of a firm and the occurrence of supply-side risks.
Before the resulting coefficients can be examined, it is necessary to make sure that the model shows significance to be considered further. The adjusted R-Square indicates the ex-tent to which the variance of the dependent variable is explained by the independent varia-bles that are included in the model (Montgomery, Peck & Vining, 2012). This implies that a higher value for the R-Square indicator is more preferable for the purpose of this research. As can be seen in Table 4.5, the independent variables within models 1 to 6 can explain be-tween 5.5% - 69.6% of the variance of the respective dependent variable. The ANOVA test gives the correspondent significance about the explanatory power of the model which is strongly correlated to the value of the Adjusted R-Square. The null-hypothesis of the ANOVA test assumes that the model has no explanatory power, meaning that the inde-pendent variables do not explain the dependent variable. Depending on the p-value, which shows whether the null-hypothesis is being rejected or not, further examination of the co-efficients can be conducted. Table 4.5 illustrates that model 1 shows a significance at the .01-level. Also models 2, 4 and 5 show a significance at the .01-level. However, model 3 and 6 confirm the null-hypothesis, which leads to the conclusion that the independent vari-ables therein do not explain the dependent variable sufficiently. Considering these findings, the authors must exclude the insignificant models for further examination and thus do not further investigate the relationship among supply chain management practices and the two risks poor logistics performance of LSPs (inbound) and (outbound).
Table 4.5 Model summary and ANOVA test
Model summa-ry ANOVA
Modell Dependent vari-able
Adjusted R-square F Sig.
1 Quality prob-
lems of delivered parts
.417 3.592 .009
2 Poor logistics
performance of supplier
.608 6.629 .000

34
3 Poor logistics
performance of LSP
.055 1.212 .340
4 Production
capacity cons-traints
.456 3.592 .009
5 Mismatch pro-
jected and actual demand
.696 6.819 .000
6 Poor logistics
performance of LSP
.222 1.726 .151
4.4.3 Evaluation of independent variables
After checking the explanatory power of each model, the OLS regression’s coefficient table can be examined for the significant models. Table 4.6 shows a simplified and summarised coefficient table for all six models which outlines relevant coefficients between all independent variables and dependent variables. The two models which have proved to be insignificant are concealed with a grey background color of the cells and do not have to be regarded.
Table 4.6 Coefficient table of the OLS regression models
Risk 1 Risk 2 Risk 3 Risk 4 Risk 5 Risk 6
B Sig. B Sig. B Sig. B Sig. B Sig. B Sig.
Multi sourcing .193 .207 .203 .126 .348 .122 .340 .014 .489 .003 .021 .902
Single sourcing -.193 -.207 -.203 -.126 -.348 -.122 -.340 -.014 -.489 -.003 -.021 -.902
Global sourcing -.316 .191 .540 .014 .035 .920 .454 .034 .036 .861 .181 .461
Ship-to-line (source)
.401 .037 .355 .033 -.017 .948 .242 .134 .545 .003 .407 .048
VMI with suppliers
.105 .529 .030 .833 .194 .428 -.045 .756 -.239 .073 -.282 .077
Elim. ze-ro value act.
.232 .272 -.168 .353 -.092 .764 .412 .030 .408 .023 -.082 .680
Pull-produc-tion
- - - - - - - - - - - -
Supplier integra-tion
-.532 .058 .310 .188 .260 .510 -.482 .046 -1.166 . -.177 .533

35
Low in house prod. depth
-.195 .101 -.350 .002 .073 .666 -.109 .279 -.061 .556 -.010 .933
Product variety .291 .195 .215 .264 -.113 .725 .094 .620 -.921 .001 -.149 .608
VMI with cus-tomers
- - - - - - - - -.141 .390 -.070 .717
Ship-to-line (de-liver)
- - - - - - - - -.225 .059 -.080 .553
Intern. distr. network
- - - - - - - - .499 .027 .095 .704
When looking at the first model, one can see that ship-to-line (source) is the only predictor variable that predicts quality problems with delivered parts as the response variable at a significance level of .05. This is shown by the p-value that rejects the null hypothesis if the p-value is below .05. For the practice ship-to-line (source) the p-value is .037 and therefore rejects the null hypothesis, which assumes that the predictor variable has no effect on the response variable. The unstandardized beta coefficient indicates whether the independent and the dependent variable have a positive or negative relationship, depending on the sign. The beta coefficient in this case is -.401 negative, meaning that there is a negative relation-ship of the two variables, i.e. when the degree, to which a firm uses ship-to-line (source) as a practice, increases, the probability of quality problems of delivered parts decreases.
Model 2 shows the predictive ability of the practices global sourcing (p-value = .014), ship-to-line (source) (p-value = .033) and in-house production depth (p-value = .002) in regards to the response variable poor logistic performance supplier at a significance level of .05. Moreover, the beta coefficient reveals a positive relationship among all three predictor vari-ables and the response variable.
Model 4 illustrates a dependency among the four predictor variables multi sourcing (p-value = .014), single sourcing (p-value = .014), global sourcing (p-value = .034), elimination of zero value activities (p-value = .030), and supplier integration (p-value = .046) in regards to the response variable production capacity constraints. According to the beta coefficient, the relationship therein is positive in all relationships besides for single sourcing and pro-duction capacity constraints where the relationship is negative, i.e. when the degree of sin-gle sourcing increases, the probability of production capacity constraints decreases.
In model five one can see a multitude of variables with predictive ability towards the re-sponse variable mismatch of projected and actual demand. The predictor variables that show a significant relationship at a significance level of .05 are: multi sourcing (p-value = .003), single sourcing (p-value = .003), ship-to-line (p-value = .003), elimination of zero value activities (p-value = .023), supplier integration (p-value = .000), product variety (p-value = .001), and international distribution network (p-value = .027). It is quite remarkable that five out of those seven variables even show a very strong relationship at a significance level of .01. The beta coefficients indicate quite a mix of positive and negative relation-ships. Multi sourcing, ship-to-line (source), elimination of zero value activities, and interna-tional distribution network show a positive relationship towards mismatch of projected and

36
actual demand while single sourcing, supplier integration, and product variety have a nega-tive relationship.
4.5 Mann-Whitney-U-Test By conducting the Mann-Whitney-U Test the authors test if the mean of two independent groups are statistically different from each other. As our hypotheses H5 and H6 aim to test the difference of using a preventive mitigation measure for a risks, this statistical test is ap-propriate.
Table 4.7 Mann-Whitney-U test results
Quality problems of deliv-
ered parts
Poor logis-tics per-
formance of supplier
Poor logis-tics perfor-mance of LSP (in-bound)
Production capacity
constraints
Mismatch projected and actual demand
Poor logis-tics per-
formance LSP (out-bound)
Mean Rank
YES 15.82 19.10 13.10 19.89 16.71 18.75
NO 16.21 9.50 17.38 11.66 13.4 13.57
Z -.128 -2.929 -1.287 -2.793 -1.130 -1.751
Asymp. Sig. (2-tailed) ,898 ,003 ,198 ,005 ,258 ,080
Exact Sig. [2*(1-tailed
Sig.)] ,922 ,005 ,233 ,009 ,310 ,153
The exact statistical significance value show the p-value for this test. In addition to that, the critical value of z for two-tailed tests when using a 95% confidence interval (p = .05) is be-tween -1.96 and 1.96 (Kirk, 2007). In this case, the risk poor logistic performance of sup-plier and production capacity constraints has a value of p < 0.05. With other words a p-value of .005 means that if the test would be redone 1000 times, there would show a false rate of .005. Thus, based on the reported results from Table 4.7, a statistically significant group difference of using vs. not using a preventive mitigation strategy can be seen for the risk poor logistic performance of suppler (z = -2.929, p =.005, sig ≤ .05 ) and production capacity constraints ( z = -2.793, p = .009, sig ≤ .05 ). The division of the mean rank in yes and no stand for using preventive mitigation measures and not using preventive mitigation measures for the corresponding supply chain risk. A higher mean rank of yes implies, that respondents who do use a mitigation measure, estimate the probability of the occurrence of a risk lower than respondents who do not have a risk mitigation measure in place for that risk.
The remaining four risks show no significant difference when taking into account whether or not a preventive risk mitigation measure is used.
4.6 Spearman correlation By using the Spearman Correlation analysis, the authors are able to statistically show the strength of the connection between two variables in a single figure (correlation coefficient). The correlation coefficient is always between -1 and +1 (Kirk, 2007). A negative correlation coefficient exhibits a negative relationship between two variables (the higher the degree of

37
practice A, the lower the probability of risk A). Exhibiting a positive correlation coefficient would be interpreted in the opposite way (the higher the degree of practice A, the higher the probability of risk A) (Kirk, 2007).
Hinkle, Wiersma and Jurs (2003) interpret the size of the correlations coefficient as follows:
Table 4.8 Interpretation of correlation coefficient
Size of correlation Interpretation
.90 to 1.00 (-.90 to -1.00) Very high positive (negative) correlation
.70 to .90 (-.70 to -.90) High positive (negative) cor-relation
.50 to .70 (-.50 to -.70) Moderate positive (negative) correlation
.30 to .50 (-.30 to -.50) Low positive (negative) cor-relation
.00 to .30 (-.00 to -.30) Negligible correlation
For hypotheses testing of H3 and H4, three summated composites are calculated on the side of supply chain practices. The three composites are divided in supply chain practices that exhibit three, two and one vulnerability causing factor(s) based on Table 3.2. The re-sults of the Spearman’s correlation analysis in Table 4.9 show that there is no significant correlation between the supply chain practices which exhibit three vulnerability causing fac-tors and any of the supply chain risks. Supply chain practices that exhibit two vulnerability causing factors show a positive correlation (r = .538, p = .002) with supply-side risks and a negative correlation (r = -.655, p = .000) with demand-side risks. Lastly, supply chain prac-tices which only exhibit one vulnerability causing factor are also correlated positively (r = .680, p = .000) with supply-side risks and negatively correlated (r = -.589, p = .001) with demand-side risks. Regarding the strength of our calculated correlation coefficients the au-thors can conclude that there is a correlation visible with moderate strength.
Table 4.9 Spearman's rank correlation
Supply-side
Risks Demand-side
Risks
Supply chain practices with 3 vul. causing fac-tors
Correlation Co-efficient .234 -.174
Sig. (2-tailed) .213 .365
N 30 29
Supply chain practices with 2 vul. causing fac-tors
Correlation Co-efficient .538** -.655**
Sig. (2-tailed) .002 .000

38
N 30 29
Supply chain practices with 1 vul. causing fac-tors
Correlation Co-efficient .680** -.589**
Sig. (2-tailed) .000 .001
N 30 29
4.7 Consolidation of empirical findings with the SCVM Subsequently, the SCVM is illustrated in Table 4.10 extended with the main empirical find-ings. Thus, the SCVM provides relevant information in a summarized manner which is used for further analysis by the authors.
Table 4.10 Completed SCVM
4.8 Hypothesis Table 4.11 compiles the test results of the posed hypotheses based on the performed statis-tical analyses.
Table 4.11 Overview of hypotheses test results
Multi sourcing X X .207 .126 - .014 (+) .003 (+) -Single sourcing X .207 .126 - .014 (-) .003 (-) -
Global sourcing X X X .191 .014 (+) - .034 (+) .861 -Ship-to-line X .037 (-) .033 (+) - .134 .003 (+) -
VMI with suppliers X X .529 .833 - .756 .073 -Elim. of zero value activ. X .272 .353 - .030 (+) .023 (+) -
Pull-production X - - - - - -Supplier integration X .058 .188 - .046 (-) .000 (-) -
Low inhouse prod. depth X X X .101 .002 (-) - .279 .556 -Product variety X .195 .264 - .620 .001 (-) -
VMI X X - - - - .390 -Ship-to-line X - - - - .059 -
Intern. Distr. Netw. X X X - - - - .027 (+) -
.922 .005 .233 .009 .31 .153
Vulnerability causing factors Supply-side risks Demand-side risks
SOU
RC
EM
AK
E
Supply chain
complexity
Quality problems
of delivered
parts
Poor logistics perfor-
mance of supplier
Poor logistics perfor-
mance of LSP
Production capacity
constraints
Mismatch projected and actual demand
Increase number
of exposure
points
Increase in distance/
time
Decrease in
flexibility
Decrease in re-
dundancy
DE
LIV
ER
SCM Practices
Poor logistics perfor-
mance of LSP
Preventive risk mitigation measure
Quality problems of delivered parts
Poor logistics performance of
suppliers
Poor logistics performance of LSP (inbound)
Production capacity
constraints
Mismatch projected and actual demand
Poor logistic performance of LSP (outbound)
H1 Rejected Accepted Rejected AcceptedH2 Accepted RejectedH3H4H5 Rejected Accepted Rejected AcceptedH6 Rejected Rejected
--
CONCLUSIONSupply-Side-Risks Demand-Side-Risks
-
Rejected -- Rejected
-

39
In the following the formulated hypotheses H1 to H6 are accepted and/or rejected:
H1: The higher the degree of a source/make supply chain practice, the higher the probability of a supply-side risk.
Hypothesis H1 must be rejected for the two supply-side risks quality problems of delivered parts and poor logistics performance of LSP, since there is no positive significant relation-ship between the degree of a supply chain practice and neither one of these two supply-side risks.
As hypothesis H1 is referring only to positive relationships between the variables, the sig-nificant negative relationship with the supply chain practice ship-to-line (source) (b = -.401, p = .037) towards the supply-side risk quality problems of delivered parts cannot be ac-cepted.
The following supply chain practices confirm hypothesis H1 for the supply-side risks poor logistics performance of suppliers and production capacity constraints of supplier:
Poor logistics performance of suppliers:
Regarding the supply-side risk poor logistics performance of suppliers, a significant positive relationship is visible with the supply chain source practices global sourcing (b = .540, p = .014) and ship-to-line (source) (b = .355, p = .033). Therefore, regarding the risk of poor logistics performance of suppliers, hypothesis H1 can be accepted for the supply chain practices global sourcing and ship-to-line (source).
As hypothesis H1 is referring only to positive relationships between the variables, the sig-nificant negative relationship with the supply chain practice low in-house production depth (b = -.350, p = .002) towards the supply-side risk poor logistics performance of suppliers cannot be accepted.
Production capacity constraints:
Regarding the supply-side risk production capacity constraints, a significant positive rela-tionship with multi sourcing (b = .340, p = .014), global sourcing (b = .454, p = .034) and elimination of zero value activities (b = .412, p = .030) is visible. Therefore, hypothesis H1 can be accepted for the supply chain practices multi sourcing, global sourcing and elimina-tion of zero value activities towards the supply-side risk of production capacity constraints.
As hypothesis H1 is referring only to positive relationships between the variables, the sig-nificant negative relationship with the supply chain practices single sourcing (b = -.340, p = .014) and supplier integration (b = -.482, p = .046) towards the supply-side risk production capacity constraints cannot be accepted.
H2: The higher the degree of a supply chain practice, the higher the probability of a demand-side risk.
Hypothesis H2 must be rejected for the demand-side risk poor logistics performance of LSP, since there is no positive statistical significance between the degree of a supply chain practice and that demand-side risk. The following supply chain practices confirm hypothe-sis H1 for the demand-side risk mismatch projected and actual demand:

40
Mismatch projected and actual demand:
The demand-side risk mismatch projected and actual demand shows a significant positive relationship to the supply chain practices multi sourcing (b = .489, p = .003), ship-to-line (source) (b = .545, p = .003), elimination of zero value activities (b = .408, p = .023) and international distribution network (b = .499, p = .027). Thus, hypothesis H2 can be accept-ed for the supply chain practices multi sourcing, ship-to-line (source), elimination of zero value activities and international distribution network towards the demand-side risk mis-match projected and actual demand.
As hypothesis H2 is referring only to positive relationships between variables, the signifi-cant negative relationship between the supply chain practices single sourcing (b = -.489, p = .003), product variety (b = -.921, p = .001) and supplier integration (b = -1.166, p = .000) towards the demand-side risk mismatch projected and actual demand cannot be ac-cepted.
H3: The more vulnerability causing factors a practice exhibits, the higher the probability of supply-side risks.
The authors found no support for hypothesis H3. The spearman correlation statistically shows that there is no significant correlation between supply chain practices which exhibit three vulnerability causing factors and the probability of supply-side risks (r = .234, p = .213). Regarding supply chain practices that exhibit two vulnerability causing factors, a sig-nificant positive correlation (r = .657, p = .000) is visible. Also supply chain practices which exhibit only one vulnerability causing factor show a significant positive correlation (r = .676, p = .000) which is even somewhat stronger than the correlation for supply chain practices that exhibit two vulnerability causing factors. Hence, there is no stronger correla-tion visible for supply chain practices that exhibit more vulnerability causing factors than those that exhibit less, therefore, hypothesis H3 is rejected.
H4: The more vulnerability causing factors a practice exhibits, the higher the probability of demand-side risks.
The authors found no support for hypothesis H4. The spearman correlation statistically shows that there is no significant correlation between supply chain practices which exhibit three vulnerability causing factors and the probability of demand-side risks (r = -.174, p = .365). Regarding supply chain practices that exhibit two vulnerability causing factors, a sig-nificant negative correlation (r = -.623, p = .000) is visible. Also supply chain practices which exhibit only one vulnerability causing factor show a significant negative correlation (r = -.580, p = .001). Hence, there is no stronger correlation visible for supply chain practices that exhibit more vulnerability causing factors than those that exhibit less, therefore, hy-pothesis H4 is rejected.
H5: There is a significant difference between using and not using preventive risk mitigation measures, in terms of the probability of a supply-side risk.
Quality problems of delivered parts:

41
A significance level of p = .922 resulting from the Mann-Whitney-U test reveals that there is no significant difference between using and not using preventive risk mitigation measures, in terms of the probability of quality problems of delivered parts. Thus, H5 must be rejected for supply-side risk quality problem of delivered parts.
Poor logistics performance of suppliers:
Regarding the risk poor logistics performance of suppliers, the significance level of p = .005 reveals that there is a significant difference between using and not using preventive risk mitigation measures in terms of the probability of poor logistics performance of sup-pliers. Thus, H5 can be accepted for supply-side risk poor logistics performance of suppli-ers. Poor logistics performance of LSP (inbound):
The significance level of p = .233 shows that there is no significant difference between us-ing and not using preventive risk mitigation measures in terms of the probability of poor logistics performance of LSP (inbound). Thus, H5 must be rejected for supply-side risk poor logistic performance of LSP (inbound). Production capacity constraints:
For the last supply side risk, a significance level of p = .009 demonstrates that there is a significant difference between using and not using preventive risk mitigation measures in terms of the probability of production capacity constraints. Thus, H5 can be accepted for supply-side risk production capacity constraints. H6: There is a significant difference between using and not using preventive risk mitigation measures, in terms of the probability of a demand-side risk.
Mismatch projected and actual demand:
Dealing with demand side risks, the significance level of p = .310 of the Mann-Whitney-U test statistically shows, that there is no significant difference between using and not using preventive risk mitigation measures in terms of the probability of mismatch projected and actual demand. Thus, H6 must be rejected for the demand-side risk mismatch projected and actual demand.
Poor logistics performance of LSP (outbound):
Lastly, the significance level of p = .153 indicates that there is no significant difference be-tween using and not using preventive risk mitigation measures in terms of the probability of poor logistics performance of LSP (outbound). Thus, H6 must be rejected for supply-side risk poor logistics performance of LSP (outbound).

42
5 Analysis In the following, all supply chain practices that exhibit a strong relationship to a supply-side or demand-side risk are further examined in subsection 5.1. In subsection 5.2 a discussion regarding the findings regarding the hypotheses H3 and H4 is conducted, followed by a discussion of the findings regarding the statistical dif-ference when using or not using preventive risk mitigation measures.
5.1 Analysis of relationships regarding hypotheses H1 and H2
5.1.1 Quality problems of delivered parts
Ship-to-line (source):
The supply chain practice ship-to-line (source) shows a significant negative relationship to-wards the supply-side risk of facing quality problems of delivered parts (p = .037), meaning that a higher degree of ship-to-line results in a lower probability of having quality problems of delivered parts. This finding does not conform to the expected outcome based on the NAT, however, there are indications in the corresponding supply chain literature that con-form to that finding. Accordingly, the usage of ship-to-line requires a strong focus on con-tinuous improvement processes, which includes improvements in product quality amongst others, in order to guarantee direct assembly of the components into the product (Kannan & Tan, 2005). Thus, ship-to-line tackles the quality issue on the operative level, which con-sequently leads to the conclusion that a strong relationship between this supply chain prac-tice and the risk of facing quality problems of delivered parts is justified.
5.1.2 Poor logistics performance of suppliers
Global sourcing:
According to the findings, global sourcing has a significant positive relationship to facing the supply-side risk of poor logistics performance of suppliers (p = .014). According to lit-erature on that subject this constitutes quite an expectable outcome. Global sourcing is commonly initiated due to the result of increased competitive cost pressure that firms face nowadays (Ruamsook et al., 2007). It is furthermore especially pursued from low-cost countries (LCC) in the Asian regions (Ruamsook et al., 2007). Ruamsook, Russell and Thomchick (2009) have investigated in their study that cost reductions through global sourcing go along with lower delivery reliability performance, especially due to poor on-time delivery and cycle-time variations. This conforms with the fact that global sourcing exhibits increased time and distance dimensions which is considered a vulnerability causing factor of global sourcing and which suggests that it is more likely for a shipment to be ex-posed to an unintended situation the longer and farther it travels (Stecke & Kumar, 2009).
Ship-to-line (source):
Furthermore, findings reveal that there is a significant positive relationship between the supply chain practice ship-to-line (source) and the risk of poor logistics performance of suppliers (p = .033), meaning that a higher degree of ship-to-line results in a higher proba-bility of poor logistics performance of suppliers. This conforms to previous expectations. Ship-to-line is a delivery method that places high demands on a timely delivery within a short time frame (Kannan & Tan, 2005). Therefore, the tolerance to meet the agreed deliv-ery reliability is much smaller than for delivery methods, which allow a longer time frame to receive goods within the agreed terms. Since logistics performance is measured whether or not a supplier delivers within the specified time frame and place (Kallio et al., 2000), even

43
disruptions that seem insignificant and only lead to a small deviation from the standard procedure within the delivery process can cause the occurrence of poor logistics perfor-mance of suppliers. Furthermore, De Toni and Nassimbeni (2000), demonstrate that there is a connection between the degree of logistics performance and the use of ship-to-line practice in combination with supplier development measures which can be categorized un-der preventive risk mitigation measures (Hartley & Choi, 1996). The findings of the present study also show that preventive measures for the risk of poor logistics performance of suppliers have a statistical significance which reinforces the relationship that could be es-tablished between ship-to-line (source) and the risk of poor logistics performance of sup-pliers.
Low in-house production depth:
Empirical findings have furthermore shown a significant negative relationship between a lower in-house production depth and decrease in the risk of facing poor logistics perfor-mance of suppliers (p = .002), meaning that suppliers perform better when the degree of in-house production is low. According to the idea of NAT, this was not to be expected, however, a potential explanation for that dependency is the current trend within companies in the automotive industry that have a low degree of in-house production depth, namely the consolidation of suppliers (Mayne, 2008). Accordingly, firms narrow down the number of suppliers they partner with. When pursuing such a consolidation of the supplier base, it is naturally in the interest of a firm to maintain the partnership with its most reliable sup-pliers and to disregard bad performing suppliers (Vagn Freytag, Holmen, Pedersen & Jansen, 2007). Therefore, this results in a small and well performing supplier base, which execute a multitude of functions and that apparently can lead to a lower possibility to face poor logistics performance of suppliers.
5.1.3 Production capacity constraints
Multi Sourcing:
According to the findings, multi sourcing has a significant positive relationship to the sup-ply-side risk of production capacity constraints on the supplier side (p = .014). This finding conforms to the expectations according to the NAT. However, contradictory to that find-ing, Burke et al. (2007) argue that “multiple-sourcing provides […] greater upside volume flexibility due to the diversification of the firm’s total requirements”. It makes clearly sense that the total de-mand of a firm can be better satisfied through multi sourcing since more suppliers will usu-ally provide sufficient capacity. However, the statement of Burke et al. (2007) also implies that when using multi sourcing, the production capacity of one supplier is more often ex-hausted and therefore extra suppliers need to be available.
Furthermore, the fact that multi sourcing can be conducted for particular components sug-gests that the suppliers producing those components face a competitive business environ-ment that usually places high focus on cost aspects. This is due to the fact that buyers hold the dominant position within negotiations when suppliers can be substituted easily (Cox, 2001). The consequence for suppliers of such components is that costs have to be de-creased as good as possible throughout the whole firm which includes high average utiliza-tion of the available production capacity. When utilizing high average production capacity throughout regular demand periods, high volatile demand fluctuations cannot be satisfied. This circumstance may therefore be the underlying reason why multi sourcing significantly relates with production capacity constraints of suppliers.
Single Sourcing:

44
On the other hand, single sourcing shows a significant negative statistical relationship to production capacity constraints of suppliers (p = .014), which means that a higher degree of single sourcing results in a lower probability of capacity constraints on the supplier side. Although this militates against the expectations according to the NAT, the literature on sourcing strategies gives indication that supports that finding. Choi and Krause (2006) cor-rectly point out that single sourcing entails that the buying firm is increasingly dependent on the supplier. However, Choi and Krause (2006) further argue that companies are aware of that issue and therefore undertake drastic supplier development practices like promoting “…the consolidation of several smaller groups into one large, integrated supplier with higher production ca-pacity and added capability…”. Hence, it seems that the awareness of the issue with produc-tion capacity constraints of suppliers in combination with single sourcing is present to firms as Szwejczewski, Goffin, Lemke, Pfeiffer and Lohmuller (2001) have already pointed out in the early years of the 21st century. Consequently, we can assume that companies fol-low the conclusion of Burke et al. (2007) that “…the industry practice of single sourcing is only op-timal when supplier capacities are relatively large as compared to product demand” and that therefore we can see a strong negative relationship between single sourcing and the risk of facing production capacity constraints of suppliers.
Global Sourcing:
Global sourcing exhibits a positive significant relationship to the risk of facing production capacity constraints on the supplier side (p = .034) and therefore meets the expectations.. Similar to multi sourcing, Ruamsook et al., (2009) point out that the only benefit of global sourcing from low-cost countries is the aspect of reduced purchasing costs. However, Ruamsook et al. (2009) continue stating that the main issue with sourcing from low cost countries is their production capability. An explanation that finding is the fact that firms nowadays use the so called “base-surge strategy” (Fredriksson, Jonsson & Medbo, 2010), which means that the demand for components is supplied first from rather cheap LCCs as long as there is sufficient production capacity and then is switched to rather expensive local in-house supply. Thus, the frequent discrepancy in the amount of required to actual exist-ing production capacity might be perceived as frequent by the corresponding managers.
Supplier integration:
Supplier integration shows a significant negative relationship to the risk of facing produc-tion capacity constraints with the supplier (p = .046), which means that a higher degree of supplier integration results in a lower probability of production capacity constraints. This militates against the expectations according to the NAT, however, Neureuther and Kenyon (2009) state that “with increased organizational integration […] single point of failures could affect all partners within the supply chain”, which indicates that the dependency of buyers to their suppli-ers is quite high. At the same time, supplier integration is commonly practiced with only a few key suppliers Choi and Krause (2006), which augments the issue of dependency to-wards suppliers. Similarly to single sourcing, researchers like Szwejczewski et al. (2001) or Choi and Krause (2006) demonstrate that firms have recognized the risk of facing capacity constraints when employing only a low number of suppliers and therefore take preventive measures such as supplier development (Choi & Krause, 2006), which mitigates the risk of facing the risk of production capacity constraints. Findings of the present study, confirm that indeed these preventive measures employed by the respondents have an impact on the probability of facing the risk of production capacity constraints with suppliers as can be seen in subsection 4.5.

45
Elimination of zero value activities:
The elimination of zero value activities has shown a significant positive relationship to the risk of facing production capacity constraints at the supplier (p = .030) and therefore con-forms to the expectations. The corresponding literature provides justified suggestions to why this is the case. According to Martínez Sánchez and Pérez Pérez (2001), one of the greatest redundancies are idle stock inventories which do not add any value and therefore need to be eliminated. Apparently, the degree of eliminating such zero value activities pre-dicts well how prone a firm becomes in regards to facing the risk of production capacity constraints at the supplier. When eliminating stock inventory a firm is more dependent on their suppliers to make up for demand fluctuations (Modarress, Ansari & Willis, 2000). It can therefore be concluded that suppliers seem to not be able to cope with customer de-mand volumes, which can fluctuate more when inventories are not being held to mitigate demand fluctuations.
5.1.4 Mismatch projected and actual demand
An interesting outcome of the findings is that mismatch projected and actual demand is in-fluenced significantly by seven supply chain practices, which is the highest number of influ-encers for the risks that have been considered within this research study. This is a reasona-ble finding considering that meeting customer demand is the ultimate goal of any business and that all practices beforehand only serve the purpose of finally meeting customer de-mand and therefore can be crucial to its success (Gupta & Maranas, 2003).
Multi Sourcing:
A significant positive relationship could be determined between multi sourcing and the demand-side risk of not matching the final customer demand (p = .003) and therefore con-forms to the expectations.
The challenge of sourcing strategies is to ensure component availability whilst keeping in-ventories on a minimum (Costantino & Pellegrino, 2010). Therefore, the identified rela-tionship among multi sourcing and not matching customer demand must derive from a low component availability which subsequently leads to the inability to meet the demand. Con-trary to the empirical findings, the literature on sourcing strategies largely recommends to use multi sourcing in order to assure component availability in case of a supplier default for instance, which can have devastating effects on the buying firm (Costantino & Pellegrino, 2010; Burke et al., 2007).
However, order-splitting within multi sourcing increases the probability that one supplier is not able to deliver in time, which increases the probability of not meeting demand in time considering the current ongoing trends within the automotive industry. Zhang et al. (2007) point out that build-to-order production has gained tremendous significance within the au-tomotive industry, since rapidly changing demands and competitive pressure have forced this development. Zhang et al., (2007) further exemplify that the automaker Volvo was able to decrease its order-to-delivery time from six weeks to 14 days within a few years’ time, which shows that supply chain processes need to be coordinated perfectly and even a delay of one single day can have a negative impact on demand satisfaction. Thus, in such a tight production schedule the timely arrival of all components needs to be ensured, which is not the case when multi sourcing is employed and one of the suppliers does not deliver as agreed upon.

46
Single Sourcing:
The supply chain practice single sourcing shows a significant negative relationship with the risk of mismatching actual demand (p = .003), meaning that a higher degree of single sourcing results in a lower probability of that risk, which is contrary to the expected find-ings according to the NAT.
The positive contribution of a source practice like single sourcing to customer demand sat-isfaction can only arise from ensuring sufficient component availability for subsequent downstream processes (Burke et al., 2007). As mentioned in subsection 5.1.3, firms are aware of production capacity constraints when conducting single sourcing and therefore take preventive measures to prevent short shipments. Due to that, component availability can be ensured on high level, disregarding other possibilities of component shortages, which can derive from long transport lead times for instance. Thus, the relationship be-tween single sourcing and the risk of mismatching actual demand finds support from the literature.
Ship-to-line:
Ship-to-line (source) reveals a significant positive relationship towards the demand-side risk mismatch of actual demand (p = .003), which conforms to the expectations. As a source practice ship-to-line can influence demand satisfaction through component availability, which is required for further downstream processes. As mentioned in subsection 5.1.2, achieving agreed delivery terms can only be accomplished when very strict delivery condi-tions are met (Kannan & Tan, 2005). In such lean manufacturing environments, every pro-cess from the beginning till the end needs to function flawlessly in order to achieve the fi-nal goal of timely demand satisfaction. Hence, it should not be surprising that the ultimate goal of demand satisfaction is harder to achieve than any previous operative goal when process steps are so tight coupled as in a lean manufacturing environment. Therefore, the significant relationship between ship-to-line (source) and mismatching actual demand can be traced back to the lack of prompt component availability which also conforms the im-portance of the underlying vulnerability causing factor “decrease in redundancy”.
Elimination of zero value activities:
For the supply chain practice elimination of zero value activities there is a significant posi-tive relationship visible with the risk of mismatching actual demand (p = .023). The find-ings conform to the assumptions that could have been made beforehand based on the NAT. According to Martínez Sánchez and Pérez Pérez (2001), the elimination of zero val-ue activities primarily focuses on the elimination of redundant inventory. Having that in mind, not being able to meet actual demand suggests itself since one of the functions of an inventory is to cover demand volatility (Adegoke, 2003). Besides that eliminating zero value activities presumes that flows and machines work flawlessly, so having a low degree of zero value activities does not allow great tolerances or differences regarding the target-performance comparison, which includes issues as time disruptions of incoming goods for instance or a delay within any of the processing stages (Martínez Sánchez and Pérez Pérez (2001).
Supplier integration:

47
The supply chain practice supplier integration shows a significant negative relationship to-wards the risk of mismatching actual demand (p = .000), which means that a high degree of supplier integration results in a lower probability of mismatching actual demand. This mili-tates against the expected findings. However, according to Bennett and Klug (2012), from a resource-based view, supplier integration constitutes a relevant resource that is required to be profitable and competitive, especially within the automotive industry. Bennett and Klug (2012) further identify that from a logistics perspective, proximity is an indicator of the de-gree of supplier integration. An extreme example of high supplier integration is presented in their study where a company acts as a full modular consortium, meaning that the suppli-er does the complete assembly operations of the final vehicle, whereas the OEM focuses on its key competences in regards to planning, coordination and administration amongst others. Although this is only an extreme example, it shows that a higher degree of supplier integration allows the OEM to focus on planning processes while the supplier takes over responsibility for more operative processes which has a diminishing effect on complexity and interdependencies and can therefore result in a lower probability of mismatching actual demand.
Product variety:
Product variety shows a significant negative relationship to mismatching actual demand (p = .001), meaning that a high product variety has a positive effect on mismatching actual demand, in the sense that this risk is less likely to occur. This is against the findings that had to be expected according to the NAT. Current literature on that topic shows though, that ongoing trends within the automotive industry are the implementation of common module platforms that allow the usage of less components for a multitude of different products and the postponement of production steps for customer specific products (Liao et al., 2013). According to Bozarth et al. (2009) these trends lead to a decrease in supply chain complexity through a decrease in detail complexity which is the only vulnerability causing factor in regards to product variety. In addition to that, a late postponement point means that there are less production activities do be conducted from the point of order un-til the point of delivery which further decreases the possibility of disruptions that would af-fect demand satisfaction (Li, Ragu-Nathan, Ragu-Nathan & Subba Rao, 2006).
The question that remains is, why a lower product variety then concludes a higher mis-match of the actual demand. The reason for that can be justified by arguing that firms who do not have a high product variety do not engage in practices as postponement or module platform creation, since the implementation of these practices are dependent on require-ments regarding product, market demand and manufacturing structure that have to be met by firms in order to be viable (Li et al., 2006). Thus, companies with a low product variety are not able to benefit from the advantages that late postponement and module platform creation bring about and thus rather face the risk of mismatching actual demand.
International distribution network:
Finally, the outcome of the statistical analysis has shown a significant positive relationship between having a highly international distribution network and facing the risk of mismatch-ing actual demand (p = .027) and therefore conforms to the expectations. Among the vul-nerability causing factors that an international distribution network exhibits are the increase of exposure points due to the use of various means of transportation and the associated handling movements of the goods, an increase in the time and distance dimensions and an increased supply chain complexity due to the number of different customers and their het-erogeneity. Considering all of these aspects, it is not surprising that this practice has a

48
strong relationship to that demand-side risk, since the vulnerability causing factors imply the challenges of delivery reliability (exposure points and time and distance dimension) and forecasting errors (supply chain complexity). The literature also recognizes that relation-ship. For instance, it is widely accepted that longer lead times influence the delivery reliabil-ity due to inconsistent cycle times and the various possibilities for disruptions (Bozarth et al., 2009; Stecke & Kumar, 2009). Also, the prioritization of more important customers over less important customers is more likely to occur within a high degree of international distribution network because of the heterogeneity of customers (da Silveira, 2005).
5.2 Analysis of correlations regarding hypotheses H3 and H4 As the findings reveal, hypotheses H3 and H4 find no support within this research, mean-ing that supply chain practices that exhibit more vulnerability causing factors do not corre-late stronger with the probability of supply-side nor demand-side risks than supply chain practices which exhibit less vulnerability causing factors. Thus, the assumption that has been derived based on the NAT finds no evidence.
The conclusion is that merely the amount of vulnerability causing factors a supply chain practice exhibits is not enough to make assumptions about the probability of risks. Hence, it seems likely that focusing only on the quantitative aspect of vulnerability causing factors is not depicting the whole picture of the issue. What is missing is the qualitative aspect of the vulnerability causing factors. The question that has to be raised is, whether or not cer-tain vulnerability causing factors have a greater impact to the probability of risks than other factors. Although one practice might exhibit only one vulnerability causing factor, this one factor might be of greater cruciality to the probability of risks than three other vulnerability causing factors of another supply chain practice combined. Moreover, even if two supply chain practices might exhibit the same vulnerability causing factor, the extent to which a vulnerability causing factor is exhibited by one supply chain practice compared to another might differ as well. Furthermore, Wagner and Bode (2006) suggests that the extent to which a supply chain practice increases supply chain vulnerability might depend on the mix of supply chain practices that is employed within a supply chain by stating that supply chain vulnerability ”is a function of certain supply chain characetristics”, which ultimately also affects the qualitative aspect of the vulnerability causing factor(s) that a supply chain practice exhibits, since the impact of a supply chain practice depends on the holistic composition of a supply chain structure.
Seeing that the qualitative aspect of vulnerability causing factors might differ for each sup-ply chain practice and depend on the supply chain design as a whole, it must be questioned whether it is even viable to determine the probability of supply chain risks through the consideration of vulnerability causing factors that a supply chain practice exhibits. Compar-ing supply chain practices directly to one another in order to determine the probability of risks can give much more accurate answers than determining it vaguely through vulnerabil-ity causing factors. Nonetheless, even if the mere amount of vulnerability causing factors seems to not help determining the probability of risks and the qualitative distinction seems to be hard to obtain, vulnerability causing factors still enhance understanding the underly-ing reason why supply chain practices actually increase supply chain vulnerability and should therefore never be disregarded.

49
5.3 Analysis of significant differences regarding hypotheses H5 and H6
In contrary to what has been expected based on the literature review, the use of preventive risk mitigation measures has shown only a statistical difference for the two supply-side risks poor logistics performance of supplier and production capacity constraints.
As for the risk of quality problems of delivered parts, it can be assumed that further dis-tinction among the firms within this study might have shown perhaps a statistical differ-ence. Bozarth et al. (2009) argue that the component complexity supplied by a supplier plays a crucial role in the frequency of experienced quality problems, which has not been considered in the present study.
Furthermore, Tse & Tan (2012) argue that a decreasing visibility is one of the factors lead-ing to increased quality problems. Visibility is especially decreasing significantly when firms interact globally as it is the case in the present study, which is shown in Table 4.3, seeing that global sourcing is the supply chain practice that is being performed to the highest de-gree in average.
Regarding poor logistics performance of supplier and production capacity constraints, a significant difference could be established, which has been expected. Furthermore, mitigat-ing the risk of production capacity constraints with suppliers preventively can also positive-ly affect the logistics performance of suppliers at the same time, since the productions ca-pacity constraints can be excluded as the underlying reason for poor logistics performance. This finding thus supports that preventive measures for these two supply-side risks can in-deed decrease the probability of the respective risks.
Poor logistics performance of LSPs for both in- and outbound do not show any statistical difference whether or not preventive risk mitigation measures are being used. It can be as-sumed that risk mitigation measures do not have a great impact on LSPs since their logis-tics performance is basically depending on timely transports. Especially long distance transports however, face disruptions that are caused by external factors which are not easy to be counteracted (Ruamsook et al., 2007). Moreover, the fact that 21 out of 31 respond-ents do not have any preventive risk mitigating measures with their LSPs leads to the as-sumption that such risk mitigation measures are not very effective, underlining the previous assumption.
Finally, for the demand-side risk mismatch projected and actual demand there is no statisti-cal difference visible whether or not a preventive risk mitigation measure is employed. See-ing that various supply chain practices have a significant relationship towards that demand-side risk, it is strongly assumable that risk mitigation measures do not have the ability to mitigate the influencing effect of such a multitude of supply chain practices that have an impact on the probability of that risk.

50
6 Conclusion The last chapter of this research focuses on concluding the results of this research in terms of academic and managerial implications. Furthermore, limitations of the research study will be discussed before concluding the research with suggestions concerning future research possibilities.
6.1 Academic implications This research represents a contribution to the existing knowledge in field of supply chain risk management and more precisely to the field of supply chain vulnerability within the automotive industry. As one of the few quantitative research studies that deal with the ana-lysis of elements affecting supply chain vulnerability, this research investigates statistically the cause-effect relationships, correlations and differences of elements affecting supply chain vulnerability.
Moreover, this research approaches the topic of supply chain vulnerability with a much higher degree of detail, completeness and timeliness than other studies so far, by exmining a multitude of supply chain practices that are highly up-to-date and are mostly employed on an operational level. Thus, it covers the supply chain practices multi sourcing, single sour-cing, global sourcing, ship-to-line (deliver), VMI with suppliers, elimination of zero value activities, pull-production, supplier integration, low in-house production depth, product va-riety, VMI with customers, ship-to-line (deliver) and international distribution network.
6.2 Managerial implications The results of this study contribute greatly to practitioners within the automotive industry. With the help of the comprehensive SCVM and due to the high degree of detail regarding the supply chain practices and their categorization into source, make and deliver practices, managers within the various supply chain functions of a company can easily identify their individual need for actions based on the findings of this study.
For practitioners, this study suggests that supply chain source practices have to be taken into consideration more closely since high dependencies could be observed between these practices and the probability of demand- and supply-side risks respectively. Especially, the risks production capacity constraints on the supply-side and mismatch of actual demand on the demand-side seem to be highly dependent on supply chain source practices. Ho-wever, against the expectations according to the NAT, a high degree of some of these practices can also have a mitigating impact on the probability of supply- and demand-side risks. Furthermore, results show that the demand-side risk mismatch of actual demand, which should be of greatest interest since this directly affects customers, is highly in-fluenced by a multitude of supply chain practices throuhgout all three main processes source, make and deliver. Therefore, practitioners are well advised to always consider the supply chain structure as a whole and to not single out single supply chain practices. The categorization of supply chain practices into vulnerability causing factors should also be conducted in order to assure understanding of the underlying reasons why practices cause supply chain vulnerability, however, no assumptions should be made in regards to the ab-solute amount of vulnerability causing factors a practices exhibits since this can lead to wrong conclusions.
Finally, risk mitigation measures do not seem to make a crucial difference for most of the risks observed, however, results give reason to assume great mitigating potential when im-plementing risk mitigation measures for the supply-side risk production capacity

51
constraints, since this seems to also decrease the probability of poor logistics performance of suppliers.
6.3 Limitations The research was conducted within only one specific industry, in particular the automotive industry. In addition, the final amount of 32 respondents must be mentioned as a research limitation, as stated by VanVoorhis and Morgan (2007) a minimum amount of approxi-mately 50 respondents must be available for research studies, which focus on investigating cause-relationship effects with regression analyses. The last imitation is the missing consid-eration of any interdependencies between the groups of supply chain practices and supply chain risks.
6.4 Future Research The present study also provides suggestions for further research related to the findings. Seeing that many supply chain practices revealed a negative statistical significance for hy-potheses H1 and H2, it can be suggested that when using general theories, such as the NAT which do not make a distinction between risks that are more likely to occur but only state generally that systems are more prone to risks, it is necessary to find precise support from literature for why certain risks are more likely to occur than others, considering the chosen supply chain practices, instead of choosing risks based on importance for the con-tinuity of the business. Therefore, further research could investigate whether further signi-ficant relationships can be established between other crucial supply chain risks and the supply chain practices examined in this study.
Moreover, findings of this study suggest that the number of vulnerability causing factors a supply chain practice exhibits, do not allow making assumptions about the impact a supply chain practices has on the probability of a supply chain risk. This implies that vulnerability causing factors have a qualitative dimension which might be quantifiable, if interdependen-cies among supply chain practices are understood better. This calls for further qualitative research aiming at exploring the interdependencies among supply chain practices. This would allow to easier assess the impact a supply chain practice has on the vulnerability of a supply chain as a whole.
Finally, risk mitigation measures for the supply-side risks production capacity constraints and poor logistics performance of suppliers have shown a statstical difference, however, no causality can be derived from that finding and therefore a closer investigation of the second element affecting supply chain vulnerability, namely both preventive as well as reative risk mitigation measures, could close that gap, considering that reactive risk mitigation measures have been completely disregarded in this research.

52
List of references ADEGOKE, O. (2003). You may not use inventory levels to fill orders ify: Evidence from
a survey of UK manufacturing plants. Int. J. Production Economics
ADHITYA, A., SRINIVASAN, R. & KARIMI, I. A. (2009). Supply chain risk identification using a HAZOP-based approach. AIChE Journal, 55, 1447-1463.
ANGEL MARTINEZ, S. & MANUELA PEREZ, P. (2001). Lean indicators and manufacturing strategies. International Journal of Operations & Production Management, 21, 1433-1451.
ARNOLD, U. & ESSI, M. (2000). Sourcing-Konzepte als Grundelemente der Beschaffungsstrategie. Wirtschaftswissenschaftliches Studium : WiSt ; Zeitschrift für Studium und Forschung, 29, 122-128.
BARROS, A. C., BARBOSA‐PÓVOA, A. P. & BLANCO, E. E. (2013). Selection of tailored practices for supply chain management. International Journal of Operations & Production Management, 33, 1040-1074.
BAUMGARTEN, H. (2004). Trends in der Logistik. In: BAUMGARTEN, H., DARKOW, I.-L. & ZADEK, H. (eds.) Supply Chain Steuerung und Services. Springer Berlin Heidelberg.
BEISKE, B. (2002). Research methods. Uses and limitations of questionnaires, interviews, and case studies.
BELL, J. (2005). Doing Your Research Project, McGraw-Hill International (UK) Limited.
BENN LAWSON, P. D., STOREY, J., EMBERSON, C., GODSELL, J. & HARRISON, A. (2006). Supply chain management: theory, practice and future challenges. International Journal of Operations & Production Management, 26, 754-774.
BENNETT, D. & KLUG, F. (2012). Logistics supplier integration in the automotive industry. International Journal of Operations & Production Management, 32, 1281-1305.
BOGATAJ, D. & BOGATAJ, M. (2007). Measuring the supply chain risk and vulnerability in frequency space. International Journal of Production Economics, 108, 291-301.
BOZARTH, C. C., WARSING, D. P., FLYNN, B. B. & FLYNN, E. J. (2009). The impact of supply chain complexity on manufacturing plant performance. Journal of Operations Management, 27, 78-93.
BRIGGS, S. R. & CHEEK, J. M. (1986). The role of factor analysis in the development and evaluation of personality scales. Journal of Personality, 54, 106.
BRYMAN, A. & BELL, E. (2007). Business Research Methods, Oxford University Press.
BURKE, G. J., CARRILLO, J. E. & VAKHARIA, A. J. (2007). Single versus multiple supplier sourcing strategies. European Journal of Operational Research, 182, 95-112.

53
CERYNO, P. S., SCAVARDA, L. F. & KLINGEBIEL, K. (2014). Supply chain risk: empirical research in the automotive industry. Journal of Risk Research, 1-20.
CHILDERHOUSE, P., HERMIZ, R., MASON-JONES, R., POPP, A. & TOWILL, D. R. (2003). Information flow in automotive supply chains--identifying and learning to overcome barriers to change. Industrial Management + Data Systems, 103, 491-502.
CHOI, T. Y. & KRAUSE, D. R. (2006). The supply base and its complexity: Implications for transaction costs, risks, responsiveness, and innovation. Journal of Operations Management, 24, 637-652.
CHOPRA, S. & SODHI, M. S. (2004). Managing Risk to Avoid Supply-Chain Breakdown. MIT Sloan Management Review, 46, 53-61.
CHRISTOPHER, M. (2012). Logistics and supply chain management, Pearson UK.
CHRISTOPHER, M. & PECK, H. (2004). Building the Resilient Supply Chain. International Journal of Logistics Management, 15, 1-14.
COSENTINO, C. (2009). Political and Economic Change in the Automobile Industry: Strategic options taking the example Maserati, Diplom.de.
COSTANTINO, N. & PELLEGRINO, R. (2010). Choosing between single and multiple sourcing based on supplier default risk: A real options approach. Journal of Purchasing and Supply Management, 16, 27-40.
COX, A. (2001). Managing with power: strategies for improving value appropriation from supply relationships. Journal of Supply Chain Management, 37, 42-47.
CRAIGHEAD, C. W., BLACKHURST, J., RUNGTUSANATHAM, M. J. & HANDFIELD, R. B. (2007). The Severity of Supply Chain Disruptions: Design Characteristics and Mitigation Capabilities. Decision Sciences, 38, 131-156.
DA SILVEIRA, G. J. C. (2005). Market priorities, manufacturing configuration, and business performance: an empirical analysis of the order-winners framework. Journal of Operations Management, 23, 662-675.
DANCEY, C. P. & REIDY, J. (2007). Statistics Without Maths for Psychology, Pearson/Prentice Hall.
DE TONI, A. & NASSIMBENI, G. (2000). Just in time purchasing - an empirical study of operational practices, supplier development and performance.pdf>. Omega - The international Journal of management schience, 28, 631-651.
DENSCOMBE, M. (2014). The Good Research Guide: For Small-Scale Social Research Projects, McGraw-Hill Education.
DIANE F. WITMER, ROBERT W. COLMAN & KATZMAN, S. L. (1999). From Paper-and-Pencil to Screen-and-Keyboard: Toward a Methodology for Survey Research on the Internet. Doing Internet Research: Critical Issues and Methods for Examining the Net. SAGE Publications, Inc, Thousand Oaks, CA, SAGE Publications, Inc.

54
DICKMANN, P. (2008). Schlanker Materialfluss: mit Lean Production, Kanban und Innovationen, Springer.
DYER, J. H. (1996). Specialized supplier networks as a source of competitive advantage; Evidence from the auto industry. Strategic Management Journal, 17, 271-291.
ESSI, P. D. M. & MOHR, G. (2010). Supply Chain Sourcing: Konzeption und Gestaltung von Synergien durch mehrstufiges Beschaffungsmanagement, Gabler Verlag.
FREDRIKSSON, A., JONSSON, P. & MEDBO, P. (2010). Utilising the potential of combining local and global supply chains. International Journal of Logistics Research and Applications, 13, 313-326.
GEORGE, D. & MALLERY, P. (2003). SPSS for Windows Step by Step: A Simple Guide and Reference 11.0 Update, Allyn & Bacon/Pearson.
GUALANDRIS, J. & KALCHSCHMIDT, M. (2013). A model to evaluate upstream vulnerability. International Journal of Logistics Research and Applications, 17, 249-268.
GUPTA, A. & MARANAS, C. D. (2003). Managing demand uncertainty in supply chain planning. Computers & Chemical Engineering, 27, 1219-1227.
HARLAND, C., BRENCHLEY, R. & WALKER, H. (2003). Risk in supply networks. Journal of Purchasing and Supply Management, 9, 51-62.
HARRIS, C., HARRIS, R. & STREETER, C. (2010). Lean Supplier Development: Establishing Partnerships and True Costs Throughout the Supply Chain, Taylor & Francis.
HARTLEY, J. L. & CHOI, T. Y. (1996). Supplier development: customers as a catalyst of process change. Business Horizons, 39, 37-44.
HÄTÖNEN, J. & ERIKSSON, T. (2009). 30+ years of research and practice of outsourcing – Exploring the past and anticipating the future. Journal of International Management, 15, 142-155.
HAUKE, J. & KOSSOWSKI, T. 2011. Comparison of Values of Pearson's and Spearman's Correlation Coefficients on the Same Sets of Data. Quaestiones Geographicae.
HES, G. (2009). Supply-Strategien in Einkauf und Beschaffung: Systematischer Ansatz und Praxisfälle, Gabler Verlag.
HINKLE, D. E., WIERSMA, W. & JURS, S. G. (2003). Applied statistics for the behavioral sciences.
JACKSON, S. (2015). Research methods and statistics: A critical thinking approach, Cengage Learning.
JAYARAM, J., VICKERY, S. & DROGE, C. (2008). Relationship building, lean strategy and firm performance: an exploratory study in the automotive supplier industry. International Journal of Production Research, 46, 5633-5649.

55
JÜTTNER, U. (2005). Supply chain risk management. The International Journal of Logistics Management, 16, 120-141.
JUTTNER, U., PECK, H. & CHRISTOPHER, M. (2003). Supply chain risk management: outlining an agenda for future research. International Journal of Logistics Research and Applications, 6, 197-210.
KAKABADSE, A. & KAKABADSE, N. (2002). Trends in Outsourcing - Contrasting USA and Europe. European Management Journal 20, 189-198.
KALLIO, J., SAARINEN, T., TINNILÄ, M. & VEPSÄLÄINEN, A. P. J. (2000). Measuring delivery process performance. The International Journal of Logistics Management, 11, 75-88.
KANNAN, V. & TAN, K. (2005). Just in time, total quality management, and supply chain management: understanding their linkages and impact on business performance. Omega, 33, 153-162.
KINKEL, S. & LAY, G. (2004). Automobilzulieferer in der Klemme: vom Spagat zwischen strategischer Ausrichtung und Auslandsorientierung, ISI.
KIRK, R. (2007). Statistics: An Introduction, Cengage Learning.
KLEINDORFER, P. R. & SAAD, G. H. (2005). Managing Disruption Risks in Supply Chains. Production and Operations Management, 14, 53-68.
LANCIONI, R. A., SMITH, M. F. & SCHAU, H. J. (2003). Strategic Internet application trends in supply chain management. Industrial Marketing Management, 32, 211-217.
LI, S., RAGU-NATHAN, B., RAGU-NATHAN, T. S. & SUBBA RAO, S. (2006). The impact of supply chain management practices on competitive advantage and organizational performance. Omega, 34, 107-124.
LIAO, K., DENG, X. & MARSILLAC, E. (2013). Factors that influence Chinese automotive suppliers’ mass customization capabilities. International Journal of Production Economics, 146, 25-36.
MACDUFFIE, J. P., SETHURAMAN, K. & FISHER, M. L. (1996). Product variety and manufacturing performance: Evidence from the International Automotive Assembly Plant Study. Management Science, 42, 350.
MALHOTRA, N. & BIRKS, D. (2007). Marketing Research: An Applied Approach 3rd European Edition, Financial Times Press.
MANUJ, I. & MENTZER, J. T. (2008). Global supply chain risk management strategies. International Journal of Physical Distribution & Logistics Management, 38, 192-223.
MARTÍNEZ SÁNCHEZ, A. & PÉREZ PÉREZ, M. (2001). Lean indicators and manufacturing strategies. International Journal of Operations & Production Management, 21, 1433-1452.

56
MAYNE, E. (2008). Ford Embraces Same.Supplier Strategy for C-Cars. Ward's Auto World, 44, 10.
MEHRA *, S. (2005). Current issues and emerging trends in supply chain management: an editorial perspective. International Journal of Production Research, 43, 3299-3302.
MELA, C. F. & KOPALLE, P. K. (2002). The impact of collinearity on regression analysis: the asymmetric effect of negative and positive correlations. Applied Economics, 34, 667-677.
MICHELI, G. J. L., MOGRE, R. & PEREGO, A. (2013). How to choose mitigation measures for supply chain risks. International Journal of Production Research, 52, 117-129.
MITCHELL, V. (1996). Assesing the reliability and validity of questionnaires: an empirical example. Journal of Applied Management Studies, 5, 199-207.
MONTGOMERY, D. C., PECK, E. A. & VINING, G. G. (2012). Introduction to linear regression analysis, John Wiley & Sons.
NARASIMHAN, R. & TALLURI, S. (2009). Perspectives on risk management in supply chains. Journal of Operations Management, 27, 114-118.
NEUREUTHER, B. D. & KENYON, G. (2009). Mitigating Supply Chain Vulnerability. Journal of Marketing Channels, 16, 245-263.
OAKLAND, J. S. (1993). Total quality management : the route to improving performance / John S. Oakland, Oxford, Butterworth-Heinemann.
PALLANT, J. (2010). SPSS Survival Manual: A step by step guide to data analysis using SPSS, Allen & Unwin Australia.
PECK, H. (2005). Drivers of supply chain vulnerability: an integrated framework. International Journal of Physical Distribution & Logistics Management, 35, 210-232.
PECK, H. (2006). Reconciling supply chain vulnerability, risk and supply chain management. International Journal of Logistics Research and Applications, 9, 127-142.
PERROW, C. (1984). Normal accidents: living with high-risk technologies, Basic Books.
PERROW, C. (2011). Normal Accidents: Living with High Risk Technologies, Princeton University Press.
POHLEN, T., L. & GOLDSBY, T., J. (2003). VMI and SMI programs. International Journal of Physical Distribution & Logistics Management, 33, 565-581.
POLUHA, R. G. (2014). Anwendung des SCOR-Modells zur Analyse der Supply Chain, Josef Eul Verlag GmbH.
RAMDAS, K. (2003). Managing product variety: An integrative review and research directions. Production and Operations Management, 12, 79-101.

57
REVIEWS, C. T. (2012). e-Study Guide for: Logistics Management and Strategy : Competing Through The Supply Chain by Alan Harrison, ISBN 9780273712763, Cram101.
ROBSON, C. (2002). Real World Research: A Resource for Social Scientists and Practitioner-Researchers, Wiley.
RUAMSOOK, K., RUSSELL, D. & THOMCHICK, E. (2007). U.S. Sourcing from Low-Cost Countries: A Comparative Analysis of Supplier Performance. Journal of Supply Chain Management, 43, 16-30.
RUAMSOOK, K., RUSSELL, D. M. & THOMCHICK, E. A. (2009). Sourcing from low‐cost countries. The International Journal of Logistics Management, 20, 79-96.
SAMUELS, M. L., WITMER, J. A. & SCHAFFNER, A. (2012). Statistics for the life sciences, Pearson education.
SAUNDERS, M., LEWIS, P. & THORNHILL, A. (2009). Research Methods for Business Students, Financial Times Prentice Hall.
SAXENA, R. S. (2009). Inventory Management: Controlling in a Fluctuating Demand Environment, Global India Publications.
SCHMIDT, P. D. G. (2013). Globalisierungstendenzen als Herausforderung für die Automobilindustrie, epubli GmbH.
SHEFFI, Y. & RICE, J. B. J. (2005). A Supply Chain View of the Resilient Enterprise. MIT Sloan Management Review, 47, 41-48.
STECKE, K. E. & KUMAR, S. (2009). Sources of Supply Chain Disruptions, Factors That Breed Vulnerability, and Mitigating Strategies. Journal of Marketing Channels, 16, 193-226.
STEPHENS, S. (2001). Supply Chain Operations Reference Model Version 5.0: A New Tool to Improve Supply Chain Efficiency and Achieve Best Practice. Information Systems Frontiers, 3, 471-476.
STEVEN, A. B., DONG, Y. & CORSI, T. (2014). Global sourcing and quality recalls: An empirical study of outsourcing-supplier concentration-product recalls linkages. Journal of Operations Management, 32, 241-253.
SVENSSON, G. (2000). A conceptual framework for the analysis of vulnerability in supply chains. International Journal of Physical Distribution & Logistics Management, 30, 731-750.
SVENSSON, G. (2002). A conceptual framework of vulnerability in firms' inbound and outbound logistics flows. International Journal of Physical Distribution & Logistics Management, 32, 110-134.
SVENSSON, G. (2004). Key areas, causes and contingency planning of corporate vulnerability in supply chains: A qualitative approach. International Journal of Physical Distribution & Logistics Management, 34, 728-748.
58
SZWEJCZEWSKI, M., GOFFIN, K., LEMKE, F., PFEIFFER, R. & LOHMULLER, B. (2001). Supplier management in German manufacturing companies. International Journal of Physical Distribution & Logistics Management, 31, 354-373.
THUN, J.-H. & HOENIG, D. (2011). An empirical analysis of supply chain risk management in the German automotive industry. International Journal of Production Economics, 131, 242-249.
VAGN FREYTAG, P., HOLMEN, E., PEDERSEN, A. C. & JANSEN, N. (2007). Supply network initiatives – a means to reorganise the supply base? Journal of Business & Industrial Marketing, 22, 178-186.
VANVOORHIS, C. R. W. & MORGAN, B. L. (2007). Understanding Power and Rules of Thumb for Determining Sample Sizes.
VDA (2014). VDA Annual Report 2014.
WAGNER, S. M. & BODE, C. (2006). An empirical investigation into supply chain vulnerability. Journal of Purchasing and Supply Management, 12, 301-312.
WAGNER, S. M. & NESHAT, N. (2010). Assessing the vulnerability of supply chains using graph theory. International Journal of Production Economics, 126, 121-129.
WAGNER, S. M. & NESHAT, N. (2012). A comparison of supply chain vulnerability indices for different categories of firms. International Journal of Production Research, 50, 2877-2891.
WILSON, J. (2014). Essentials of business research: A guide to doing your research project, Sage.
WOMACK, J. P. & JONES, D. T. (1997). Auf dem Weg zum perfekten Unternehmen: (Lean thinking), Campus-Verlag.
WOMACK, J. P., JONES, D. T. & ROOS, D. (1990). Machine that Changed the World, Scribner.
ZHANG, X., CHEN, R. & MA, Y. (2007). An empirical examination of response time, product variety and firm performance. International Journal of Production Research, 45, 3135-3150.
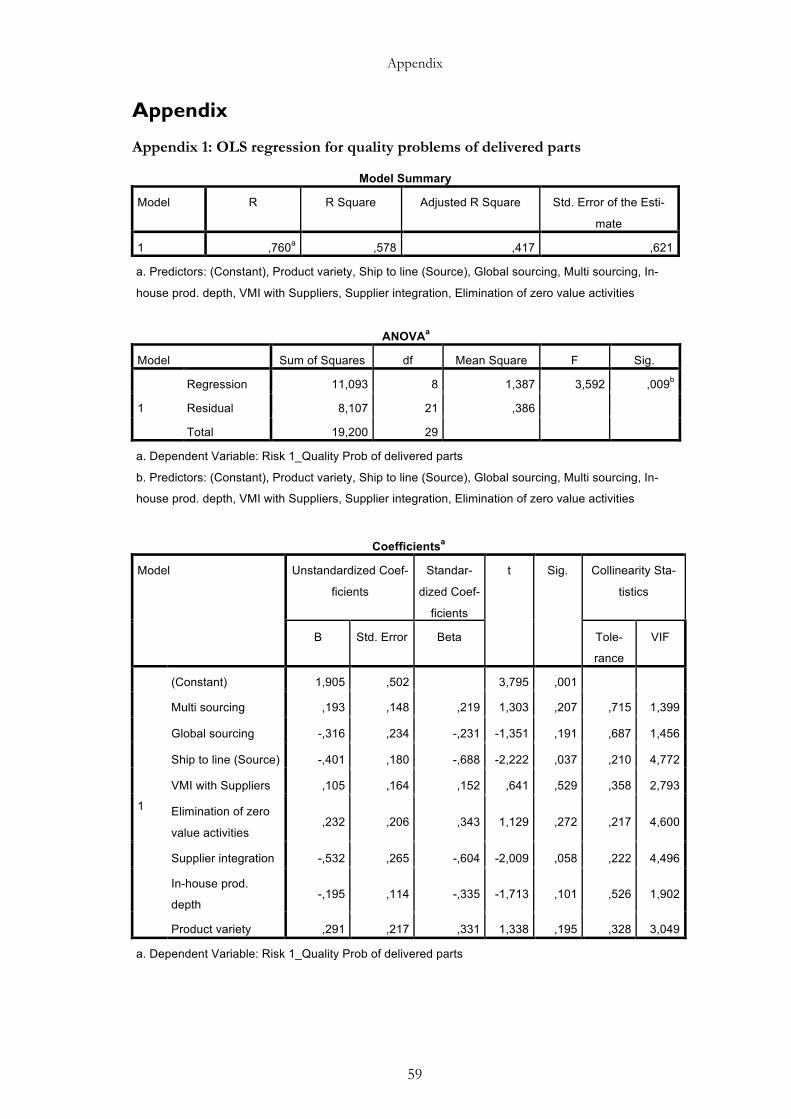
Appendix
59
Appendix
Appendix 1: OLS regression for quality problems of delivered parts
Model Summary
Model R R Square Adjusted R Square Std. Error of the Esti-
mate
1 ,760a ,578 ,417 ,621
a. Predictors: (Constant), Product variety, Ship to line (Source), Global sourcing, Multi sourcing, In-
house prod. depth, VMI with Suppliers, Supplier integration, Elimination of zero value activities
ANOVAa
Model Sum of Squares df Mean Square F Sig.
1
Regression 11,093 8 1,387 3,592 ,009b
Residual 8,107 21 ,386
Total 19,200 29
a. Dependent Variable: Risk 1_Quality Prob of delivered parts
b. Predictors: (Constant), Product variety, Ship to line (Source), Global sourcing, Multi sourcing, In-
house prod. depth, VMI with Suppliers, Supplier integration, Elimination of zero value activities
Coefficientsa
Model Unstandardized Coef-
ficients
Standar-
dized Coef-
ficients
t Sig. Collinearity Sta-
tistics
B Std. Error Beta Tole-
rance
VIF
1
(Constant) 1,905 ,502 3,795 ,001
Multi sourcing ,193 ,148 ,219 1,303 ,207 ,715 1,399
Global sourcing -,316 ,234 -,231 -1,351 ,191 ,687 1,456
Ship to line (Source) -,401 ,180 -,688 -2,222 ,037 ,210 4,772
VMI with Suppliers ,105 ,164 ,152 ,641 ,529 ,358 2,793
Elimination of zero
value activities ,232 ,206 ,343 1,129 ,272 ,217 4,600
Supplier integration -,532 ,265 -,604 -2,009 ,058 ,222 4,496
In-house prod.
depth -,195 ,114 -,335 -1,713 ,101 ,526 1,902
Product variety ,291 ,217 ,331 1,338 ,195 ,328 3,049
a. Dependent Variable: Risk 1_Quality Prob of delivered parts

Appendix
60
Appendix 2: OLS regression for poor logistics performance supplier
Model Summary
Model R R Square Adjusted R Square Std. Error of the Esti-
mate
1 ,846a ,716 ,608 ,535
a. Predictors: (Constant), Product variety, Ship to line (Source), Global sourcing, Multi sourcing, In-
house prod. depth, VMI with Suppliers, Supplier integration, Elimination of zero value activities
ANOVAa
Model Sum of Squares df Mean Square F Sig.
1
Regression 15,187 8 1,898 6,629 ,000b
Residual 6,013 21 ,286
Total 21,200 29
a. Dependent Variable: Risk 2_Poor log. perf. of supplier
b. Predictors: (Constant), Product variety, Ship to line (Source), Global sourcing, Multi sourcing, In-
house prod. depth, VMI with Suppliers, Supplier integration, Elimination of zero value activities
Coefficientsa
Model Unstandardized Coef-
ficients
Standar-
dized Co-
efficients
t Sig. Collinearity Sta-
tistics
B Std. Error Beta Tole-
rance
VIF
1
(Constant) ,003 ,432 ,007 ,995
Multi sourcing ,203 ,127 ,219 1,592 ,126 ,715 1,399
Global sourcing ,540 ,201 ,377 2,685 ,014 ,687 1,456
Ship to line
(Source) ,355 ,155 ,581 2,287 ,033 ,210 4,772
VMI with Suppliers ,030 ,142 ,042 ,214 ,833 ,358 2,793
Elimination of zero
value activities -,168 ,177 -,237 -,950 ,353 ,217 4,600
Supplier integration ,310 ,228 ,335 1,359 ,188 ,222 4,496
In-house prod.
depth -,350 ,098 -,573 -3,574 ,002 ,526 1,902
Product variety ,215 ,187 ,233 1,148 ,264 ,328 3,049
a. Dependent Variable: Risk 2_Poor log. perf. of supplier

Appendix
61
Appendix 3: OLS regression for poor logistics performance LSP (inbound)
Model Summary
Model R R Square Adjusted R Square Std. Error of the Esti-
mate
1 ,562a ,316 ,055 ,909
a. Predictors: (Constant), Product variety, Ship to line (Source), Global sourcing, Multi sourcing, In-
house prod. depth, VMI with Suppliers, Supplier integration, Elimination of zero value activities
ANOVAa
Model Sum of Squares df Mean Square F Sig.
1
Regression 8,011 8 1,001 1,212 ,340b
Residual 17,356 21 ,826
Total 25,367 29
a. Dependent Variable: Risk 3_Poor log. perf. of LSP (inbound)
b. Predictors: (Constant), Product variety, Ship to line (Source), Global sourcing, Multi sourcing, In-
house prod. depth, VMI with Suppliers, Supplier integration, Elimination of zero value activities
Coefficientsa
Model Unstandardized Co-
efficients
Standar-
dized Co-
efficients
t Sig. Collinearity Sta-
tistics
B Std. Error Beta Tole-
rance
VIF
1
(Constant) ,912 ,735 1,241 ,228
Multi sourcing ,348 ,217 ,344 1,610 ,122 ,715 1,399
Global sourcing ,035 ,342 ,022 ,101 ,920 ,687 1,456
Ship to line
(Source) -,017 ,264 -,026 -,066 ,948 ,210 4,772
VMI with Suppliers ,194 ,241 ,244 ,807 ,428 ,358 2,793
Elimination of zero
value activities -,092 ,301 -,118 -,304 ,764 ,217 4,600
Supplier integration ,260 ,387 ,257 ,671 ,510 ,222 4,496
In-house prod.
depth ,073 ,166 ,109 ,438 ,666 ,526 1,902
Product variety -,113 ,318 -,113 -,357 ,725 ,328 3,049
a. Dependent Variable: Risk 3_Poor log. perf. of LSP (inbound)

Appendix
62
Appendix 4: OLS regression for production capacity constraints supplier
Model Summary
Model R R Square Adjusted R Square Std. Error of the Esti-
mate
1 ,778a ,606 ,456 ,534
a. Predictors: (Constant), Product variety, Ship to line (Source), Global sourcing, Multi sourcing, In-
house prod. depth, VMI with Suppliers, Supplier integration, Elimination of zero value activities
ANOVAa
Model Sum of Squares df Mean Square F Sig.
1
Regression 9,208 8 1,151 4,034 ,005b
Residual 5,992 21 ,285
Total 15,200 29
a. Dependent Variable: Risk 4_Production capacity constraints on supply market
b. Predictors: (Constant), Product variety, Ship to line (Source), Global sourcing, Multi sourcing, In-
house prod. depth, VMI with Suppliers, Supplier integration, Elimination of zero value activities
Coefficientsa
Model Unstandardized Co-
efficients
Standar-
dized Co-
efficients
t Sig. Collinearity Sta-
tistics
B Std. Error Beta Tole-
rance
VIF
1
(Constant) ,422 ,432 ,978 ,339
Multi sourcing ,340 ,127 ,433 2,675 ,014 ,715 1,399
Global sourcing ,454 ,201 ,374 2,262 ,034 ,687 1,456
Ship to line
(Source) ,242 ,155 ,467 1,560 ,134 ,210 4,772
VMI with Suppliers -,045 ,141 -,072 -,315 ,756 ,358 2,793
Elimination of zero
value activities ,412 ,177 ,685 2,332 ,030 ,217 4,600
Supplier integration -,482 ,227 -,616 -2,120 ,046 ,222 4,496
In-house prod.
depth -,109 ,098 -,210 -1,110 ,279 ,526 1,902
Product variety ,094 ,187 ,120 ,503 ,620 ,328 3,049
a. Dependent Variable: Risk 4_Production capacity constraints on supply market

Appendix
63
Appendix 5: OLS regression for mismatch projected and actal demand
Model Summary
Model R R Square Adjusted R Square Std. Error of the Esti-
mate
1 ,903a ,815 ,696 ,458
a. Predictors: (Constant), International distr. network, Multi sourcing, Ship to line (Source), Global
sourcing, Ship to line (Deliver), Elimination of zero value activities, VMI with customers, In-house
prod. depth, VMI with Suppliers, Supplier integration, Product variety
ANOVAa
Model Sum of Squares df Mean Square F Sig.
1
Regression 15,743 11 1,431 6,819 ,000b
Residual 3,568 17 ,210
Total 19,310 28
a. Dependent Variable: Risk 5_Missmatch projected/actual demand
b. Predictors: (Constant), International distr. network, Multi sourcing, Ship to line (Source), Global
sourcing, Ship to line (Deliver), Elimination of zero value activities, VMI with customers, In-house
prod. depth, VMI with Suppliers, Supplier integration, Product variety
Coefficientsa
Model Unstandardized Coef-
ficients
Standar-
dized Co-
efficients
t Sig. Collinearity Sta-
tistics
B Std. Error Beta Tole-
rance
VIF
1
(Constant) 3,988 ,583 6,843 ,000
Multi sourcing ,489 ,143 ,531 3,422 ,003 ,451 2,218
Global sourcing ,036 ,201 ,025 ,178 ,861 ,532 1,881
Ship to line
(Source) ,545 ,161 ,887 3,398 ,003 ,160 6,265
VMI with Suppliers -,239 ,125 -,327 -1,908 ,073 ,370 2,700
Elimination of zero
value activities ,408 ,163 ,572 2,499 ,023 ,208 4,817
Supplier integration -1,166 ,233 -1,229 -5,004 ,000 ,180 5,548
In-house prod.
depth -,061 ,102 -,102 -,601 ,556 ,377 2,654
Product variety -,921 ,238 -1,039 -3,862 ,001 ,150 6,653
VMI with customers -,141 ,160 -,169 -,882 ,390 ,296 3,378
Ship to line (Deli-
ver) -,225 ,111 -,337 -2,027 ,059 ,393 2,548

Appendix
64
International distr.
network ,499 ,205 ,577 2,429 ,027 ,193 5,189
a. Dependent Variable: Risk 5_Missmatch projected/actual demand
Appendix 6: OLS regression for poor logistics performance of LSP (outbound)
Model Summary
Model R R Square Adjusted R Square Std. Error of the Esti-
mate
1 ,726a ,528 ,222 ,547
a. Predictors: (Constant), International distr. network, Multi sourcing, Ship to line (Source), Global
sourcing, Ship to line (Deliver), Elimination of zero value activities, VMI with customers, In-house
prod. depth, VMI with Suppliers, Supplier integration, Product variety
ANOVAa
Model Sum of Squares df Mean Square F Sig.
1
Regression 5,676 11 ,516 1,726 ,151b
Residual 5,083 17 ,299
Total 10,759 28
a. Dependent Variable: Risk 6_Poor log. perf. LSP (outbound)
b. Predictors: (Constant), International distr. network, Multi sourcing, Ship to line (Source), Global
sourcing, Ship to line (Deliver), Elimination of zero value activities, VMI with customers, In-house
prod. depth, VMI with Suppliers, Supplier integration, Product variety
Coefficientsa
Model Unstandardized Coef-
ficients
Standar-
dized Co-
efficients
t Sig. Collinearity Sta-
tistics
B Std. Error Beta Tole-
rance
VIF
1
(Constant) 3,661 ,696 5,263 ,000
Multi sourcing ,021 ,170 ,031 ,125 ,902 ,451 2,218
Global sourcing ,181 ,240 ,173 ,755 ,461 ,532 1,881
Ship to line
(Source) ,407 ,192 ,887 2,127 ,048 ,160 6,265
VMI with Suppliers -,282 ,150 -,516 -1,883 ,077 ,370 2,700
Elimination of zero
value activities -,082 ,195 -,154 -,420 ,680 ,208 4,817
Supplier integration -,177 ,278 -,250 -,637 ,533 ,180 5,548
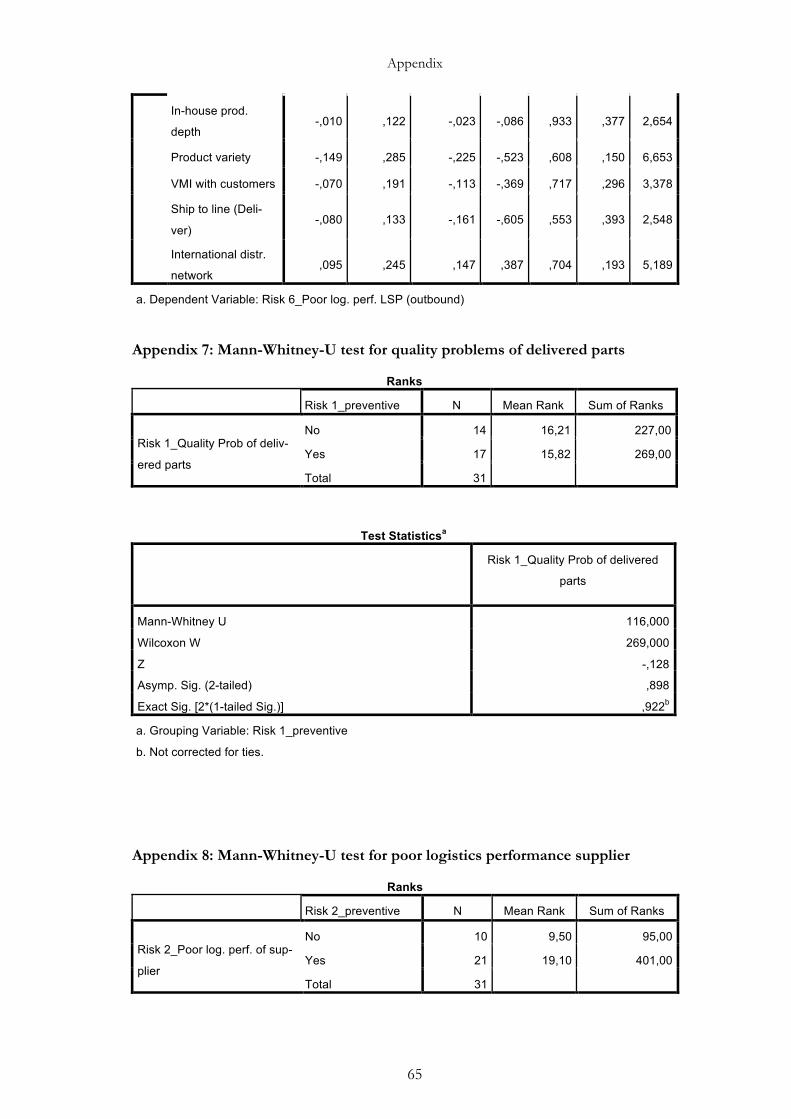
Appendix
65
In-house prod.
depth -,010 ,122 -,023 -,086 ,933 ,377 2,654
Product variety -,149 ,285 -,225 -,523 ,608 ,150 6,653
VMI with customers -,070 ,191 -,113 -,369 ,717 ,296 3,378
Ship to line (Deli-
ver) -,080 ,133 -,161 -,605 ,553 ,393 2,548
International distr.
network ,095 ,245 ,147 ,387 ,704 ,193 5,189
a. Dependent Variable: Risk 6_Poor log. perf. LSP (outbound)
Appendix 7: Mann-Whitney-U test for quality problems of delivered parts
Ranks
Risk 1_preventive N Mean Rank Sum of Ranks
Risk 1_Quality Prob of deliv-
ered parts
No 14 16,21 227,00
Yes 17 15,82 269,00
Total 31
Test Statisticsa
Risk 1_Quality Prob of delivered
parts
Mann-Whitney U 116,000
Wilcoxon W 269,000
Z -,128
Asymp. Sig. (2-tailed) ,898
Exact Sig. [2*(1-tailed Sig.)] ,922b
a. Grouping Variable: Risk 1_preventive
b. Not corrected for ties.
Appendix 8: Mann-Whitney-U test for poor logistics performance supplier
Ranks
Risk 2_preventive N Mean Rank Sum of Ranks
Risk 2_Poor log. perf. of sup-
plier
No 10 9,50 95,00
Yes 21 19,10 401,00
Total 31

Appendix
66
Test Statisticsa
Risk 2_Poor log. perf. of supplier
Mann-Whitney U 40,000
Wilcoxon W 95,000
Z -2,929
Asymp. Sig. (2-tailed) ,003
Exact Sig. [2*(1-tailed Sig.)] ,005b
a. Grouping Variable: Risk 2_preventive
b. Not corrected for ties.
Appendix 9: Mann-Whitney-U test for poor logistics performance LSP (inbound)
Ranks
Risk 3_preventive N Mean Rank Sum of Ranks
Risk 3_Poor log. perf. of LSP
(inbound)
No 21 17,38 365,00
Yes 10 13,10 131,00
Total 31
Test Statisticsa
Risk 3_Poor log. perf. of LSP (in-
bound)
Mann-Whitney U 76,000
Wilcoxon W 131,000
Z -1,287
Asymp. Sig. (2-tailed) ,198
Exact Sig. [2*(1-tailed Sig.)] ,233b
a. Grouping Variable: Risk 3_preventive
b. Not corrected for ties.
Appendix 10: Mann-Whitney-U test for production capacity constraints supplier
Ranks
Risk 4_preventive N Mean Rank Sum of Ranks
Risk 4_Production capacity
constraints supplier
No 16 11,66 186,50
Yes 14 19,89 278,50
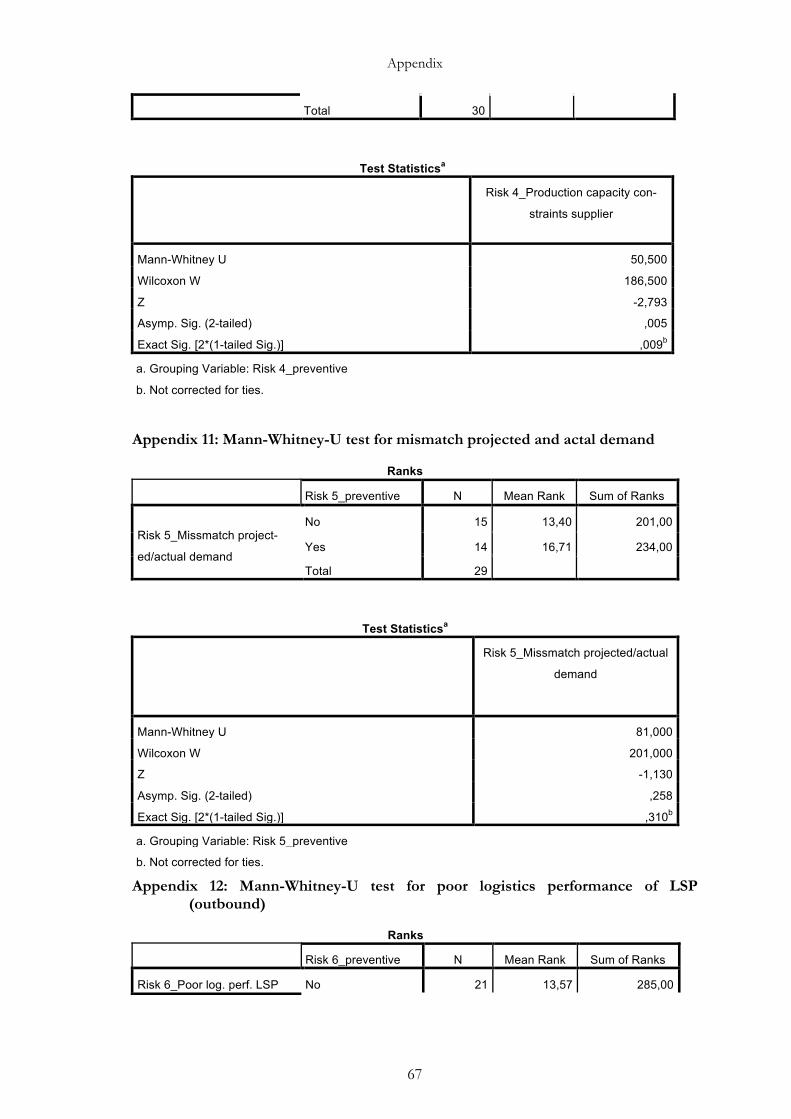
Appendix
67
Total 30
Test Statisticsa
Risk 4_Production capacity con-
straints supplier
Mann-Whitney U 50,500
Wilcoxon W 186,500
Z -2,793
Asymp. Sig. (2-tailed) ,005
Exact Sig. [2*(1-tailed Sig.)] ,009b
a. Grouping Variable: Risk 4_preventive
b. Not corrected for ties.
Appendix 11: Mann-Whitney-U test for mismatch projected and actal demand
Ranks
Risk 5_preventive N Mean Rank Sum of Ranks
Risk 5_Missmatch project-
ed/actual demand
No 15 13,40 201,00
Yes 14 16,71 234,00
Total 29
Test Statisticsa
Risk 5_Missmatch projected/actual
demand
Mann-Whitney U 81,000
Wilcoxon W 201,000
Z -1,130
Asymp. Sig. (2-tailed) ,258
Exact Sig. [2*(1-tailed Sig.)] ,310b
a. Grouping Variable: Risk 5_preventive
b. Not corrected for ties.
Appendix 12: Mann-Whitney-U test for poor logistics performance of LSP (outbound)
Ranks
Risk 6_preventive N Mean Rank Sum of Ranks
Risk 6_Poor log. perf. LSP No 21 13,57 285,00

Appendix
68
(outbound) Yes 8 18,75 150,00
Total 29
Test Statisticsa
Risk 6_Poor log. perf. LSP (out-
bound)
Mann-Whitney U 54,000
Wilcoxon W 285,000
Z -1,751
Asymp. Sig. (2-tailed) ,080
Exact Sig. [2*(1-tailed Sig.)] ,153b
a. Grouping Variable: Risk 6_preventive
b. Not corrected for ties.
Appendix 13: Spearman Correlation
Correlations
sum_3
x
sum_2
x
sum_1
x
sum_Risk
s_supply
sum_Risk
s_demand
Spearman's
rho
sum_3x
Correlation Co-
efficient 1,000 ,268 ,359* ,234 -,174
Sig. (2-tailed) . ,144 ,047 ,213 ,365
N 31 31 31 30 29
sum_2x
Correlation Co-
efficient ,268 1,000 ,799** ,538** -,655**
Sig. (2-tailed) ,144 . ,000 ,002 ,000
N 31 31 31 30 29
sum_1x
Correlation Co-
efficient ,359* ,799** 1,000 ,680** -,589**
Sig. (2-tailed) ,047 ,000 . ,000 ,001
N 31 31 31 30 29
sum_Risks_sup
ply
Correlation Co-
efficient ,234 ,538** ,680** 1,000 -,061
Sig. (2-tailed) ,213 ,002 ,000 . ,748
N 30 30 30 31 30
sum_Risks_de
mand
Correlation Co-
efficient -,174 -,655** -,589** -,061 1,000
Sig. (2-tailed) ,365 ,000 ,001 ,748 .
N 29 29 29 30 30

Appendix
69
*. Correlation is significant at the 0.05 level (2-tailed).
**. Correlation is significant at the 0.01 level (2-tailed).

Appendix
70
Appendix 14: Questionnaire

Appendix
71