Embed Size (px)
Citation preview
SUPPLY CHAIN RESILIENCEAs supply chains become more fragile, global companies must shift from reacting to disruptions to predicting themP26
IHS QUARTERLY Q1-2014
FACING THE WATER CHALLENGE in the unconventional oil and gas sector
P46
WHAT’S AHEAD FOR THE BRICs as growth slows and demographics shift?
P14
CONNECTING THE DOTS from resins to mobile phones
P18
MANAGING THE INFORMATION TSUNAMI as the workforce ages
P34
WHY OPERATIONAL METRICS MATTER to management and investors
P41

Your source for comprehensive insight, information and expertise on key topics shaping today’s global business landscape.
We invite you to continue the conversation...
Visit and subscribe: ihs.com/IHSQ11
Contact: [email protected]
Join the conversation: @IHS
Engage: #IHSQuarterly
IHS QUARTERLY Q1-2014
main red
PMS 1795CC0 M96 Y90 K2
YOUTUBE LOGO SPECS
PRINTgradient bottom
PMS 1815CC13 M96 Y81 K54
on dark backgroundson light backgrounds
standard
no gradients
watermark
stacked logo (for sharing only)
standard
no gradients
watermark
stacked logo (for sharing only)
white
WHITEC0 M0 Y0 K0
black
BLACKC100 M100 Y100 K100

IHS Quarterly | Q1-2014 | 3
IHS Quarterly Q1-2014
FeatureS
MappIng tHe plaStIcS value cHaIn FroM reSInS to rIngtoneS Chemical and electronics companies that want to stay ahead of the competition need new insight into innovation, change, and disruption across the extended value chainBy Don Bari and Jagdish Rebello
p 18
Cover Story Supply cHaIn reSIlIency: FroM InSIgHt to ForeSIgHt Sustaining shareholder value by hardening the enterprise against external risksBy Gene Long
p 26
So MucH InForMatIon, and all oF It Hard to FInd Industry turns to technical knowledge management to harness crucial, hard-to-find informationBy Chad Hawkinson
p 34
tHe new IndIcatorS oF FInancIal SucceSS The demand for non-financial performance and sustainability information is a business imperative and an opportunity to forge a smarter, more competitive corporationBy J Scott Lockhart
p 41
water ManageMent: a new paradIgM For tHe oIl and gaS Sector Unconventional oil and gas exploration and production involves vast amounts of water, elevating effective water management to a key strategic concernBy Marcus Oliver Gay and Andrew Slaughter
p 46
connectIng tHe dotSIHS Quarterly articles span a diversity of industries. That’s because IHS spans a diversity of industries and, more importantly, so do our readers: from aerospace & defense to automotive, chemical, energy, maritime, and technology. Companies in all of these sectors are constantly reinventing themselves. Every decision matters. The mission of IHS Quarterly is to provide our readers with content that not only provides industry-specific insight but connects the dots to reveal the interdependencies between these sectors and their end markets. It’s at these connection points where the greatest risks and opportunities await.
4 | IHS Quarterly | Q1-2014
IHS Inc.
Scott KeyPresident & Chief Executive Officer
Stephanie BuscemiSenior Vice President & Chief Marketing Officer
Jonathan GearSenior Vice President – Industrials
Anurag GuptaExecutive Vice President – Strategy, Products & Operations
Sean MenkeExecutive Vice President – Resources
IHS Quarterly
Sheri RhodineVice President, Integrated Marketing
John WardSenior Director, Thought Leadership
Bruce RaynerEditorial Director, IHS Quarterly
Jonathan CassellSenior Manager, Content Creation
Thomas GoodfellowSenior Manager, Thought Leadership
Greg HathawaySenior Manager, Thought Leadership
John SimpsonManager, Content Creation
Peter BeddowCreative Director, IHS Quarterly
IHS Global Editing, Design and Production Team
IHS Quarterly editorial council
Tim ArmstrongVice President, IHS Automotive
Atul AryaSenior Vice President, IHS Energy
Nariman BehraveshChief Economist, IHS
Mark EramoVice President, IHS Chemical
Dale FordVice President, IHS Technology
Scott LockhartSenior Vice President, IHS Operational Excellence & Risk Management
Zbyszko TabernackiVice President, IHS Economics & Country Risk
eXpertISetranSItIon tIMe For tHe BrIcs By Nariman Behraveshp 14
analytIcS a tale oF two eMergIng econoMIeS By Chris G Christopher, Jrp 16
vISIonwHere tHe eXpertS connect tHe dotS By Scott Keyp 5
InSIgHtSenergy – Germany faces a crucial energy choice p 6
autoMotIve – Market share numbers: Now carmakers can get ’em while they’re hotp 7
deFenSe – A transformed market challenges Western defense producersp 8
tecHnology – The Internet of Things explodesp 9
MarItIMe – Shipowners must wait for Arctic exploitationp 10
HealtHcare – Worldwide healthcare spending: Nowhere to go but upp 11
tecHnology – Wearable electronics: The next must-have fashion accessoryp 12
cHeMIcal – Tight oil boom gives edge to US petchems and refiningp 13
nuMBerS6 nuMBerS – cHIna, cIvIl unreSt, MIcroSoFt, reSInS, SHIppIng & waterp 53
SpotlIgHtacceleratIng tHe auto InduStry’S drIve to BIg data By Edouard Tavernierp 54
IHS Quarterly Q1-2014 IHS Quarterly
COPYRIGHT NOTICE AND LEGAL DISCLAIMER© 2014 IHS No portion of this publication may be reproduced, reused, or otherwise distributed in any form without prior written consent of IHS. Content reproduced or redistributed with IHS’s permission must display IHS legal notices and attributions of authorship. The information contained herein is from sources considered reliable but its accuracy and completeness are not warranted, nor are the opinions and analyses which are based upon it, and to the extent permitted by law, IHS shall not be liable for any errors or omissions or any loss, damage or expense incurred by reliance on information or any statement contained herein. For more information, contact IHS at [email protected], +1 800 IHS CARE (from North American locations), or +44 (0) 1344 328 300 (from outside North America). TRADEMARKSIHS Quarterly and the IHS globe design are trademarks of IHS. Other trademarks appearing in this publication are the property of IHS or their respective owners.
#IHSQuarterly

IHS Quarterly | Q1-2014 | 5
VISION
Where the experts connect the dots
Welcome to the debut issue of IHS Quarterly. In the pages that follow and in the issues to come, we will explore some of the most significant challenges that global corporations face today—and will face in the future. In every issue, we will offer in-depth feature articles as well as a collection of concise examinations, interviews and viewpoints that will prepare you for what lies over the horizon.
In IHS Quarterly, we bring to bear our information, analytics, and deep industry and subject matter expertise to provide insights and perspectives that we believe will enhance decision making and stimulate action. Action that identifies market opportunities, advances competitive position, mitigates risks, boosts operational efficiency, and ultimately leads to improved financial performance.
A case in point is our first cover feature, which analyzes the issue of resilient supply chains. Executives across the business spectrum tell us that both the magnitude and frequency of supply chain disruptions are on the rise. Be it a historic typhoon, a terrorist attack, or an operational failure at a key supplier, disruptions have the potential to significantly impact both the bottom line and share price. What’s needed, says author and supply chain expert Gene Long, is a fundamental shift in mindset and management process that begins to harness fundamental supply chain analytics and surface key dependencies and risks so we can move from reacting to supply chain disruptions to predicting them. It’s a tough challenge that requires both vision and leadership. In the long run, companies that become more resilient will gain a distinct advantage.
Or consider our feature on page 18, which maps the chemical value chain for consumer electronics, stretching from petrochemical feedstocks to the specialty plastics that will define the next generation of mobile phones. Understanding the complexity of this chain provides chemical companies and electronics manufacturers, and indeed everyone in between, with more visibility. Greater visibility means more opportunities to grow revenue.
Setting the tone of the topics covered in IHS Quarterly is the job of our Editorial Council (a list of Council members is on the facing page). The Council represents the IHS community and reflects the breadth and depth of the company. Council members Nariman Behravesh, IHS chief economist, and Scott Lockhart, leader of our operational excellence and risk management practice, both have articles in this issue.
Connecting the dots, revealing risk, identifying business opportunities, rethinking business practices, delivering the diligence that goes into decisions of any scale is the mission of IHS—and of IHS Quarterly.
Scott Key President and Chief Executive Officer IHS
6 | IHS Quarterly | Q1-2014
InsIghts
germany faces a crucial energy choice
It is difficult to overestimate the importance of the German economic engine to Europe and the world. When Germany faced a rigid labor market a decade ago, policymakers, corporate leaders, and labor organizations cooperated to address the problem, setting the stage for the nation’s formidable export performance in subsequent years. That performance sustained the European Union through the ruinous global financial crisis of 2008 and its lingering aftermath.
Now, however, Germany faces another decision with significant implications for its own economic future, as well as Europe’s. It must determine how to provide energy at competitive costs while also addressing a strong mandate to reduce carbon-dioxide emissions. An analysis of the linkages between Germany’s energy costs and economic performance in the context of its greenhouse gas policy and projections reveals that a steady but modulated overhaul of energy supplies, especially renewables, would enable the nation to change “achieve key energy policy goals” to “continue to reduce emissions” while not undermining its vital export economy.
Germany’s energy problem is basic. Rising electricity costs are threatening the health of the nation’s export economy, which accounts for about half of the nation’s GDP. The German export economy is also highly sensitive to any changes in its competitive position relative to that of rival economies.
Rising electricity prices in Germany, combined with flat North American energy prices, are making German products less competitive and forcing companies to relocate operations to other countries. Across the board, German industrial giants, and in particular energy-intensive companies, have begun moving abroad, gradually weakening the industrial base.
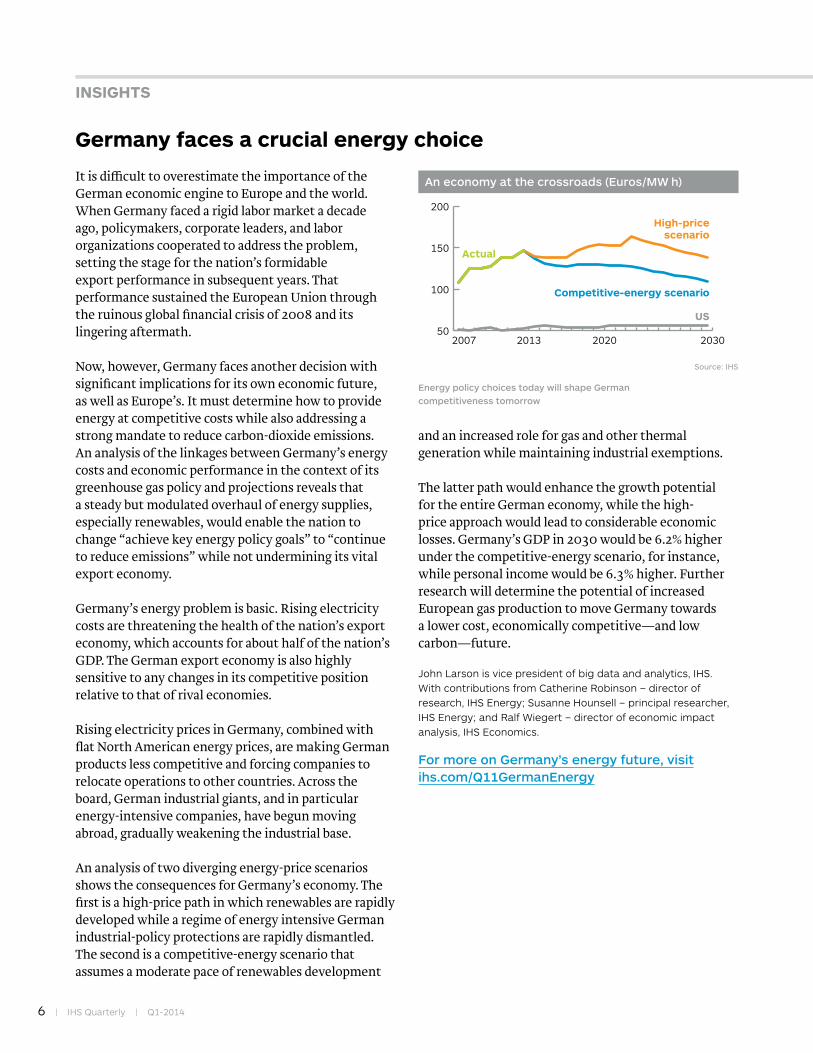
An analysis of two diverging energy-price scenarios shows the consequences for Germany’s economy. The first is a high-price path in which renewables are rapidly developed while a regime of energy intensive German industrial-policy protections are rapidly dismantled. The second is a competitive-energy scenario that assumes a moderate pace of renewables development
and an increased role for gas and other thermal generation while maintaining industrial exemptions.
The latter path would enhance the growth potential for the entire German economy, while the high-price approach would lead to considerable economic losses. Germany’s GDP in 2030 would be 6.2% higher under the competitive-energy scenario, for instance, while personal income would be 6.3% higher. Further research will determine the potential of increased European gas production to move Germany towards a lower cost, economically competitive—and low carbon—future.
John Larson is vice president of big data and analytics, IHS. With contributions from Catherine Robinson – director of research, IHS Energy; Susanne Hounsell – principal researcher, IHS Energy; and Ralf Wiegert – director of economic impact analysis, IHS Economics.
For more on Germany’s energy future, visit ihs.com/Q11GermanEnergy
An economy at the crossroads (Euros/MW h)
50
100
150
200
2030202020132007
Actual
US
Source: IHS
Competitive-energy scenario
High-price scenario
Energy policy choices today will shape German competitiveness tomorrow

IHS Quarterly | Q1-2014 | 7
Market share numbers: now carmakers can get ’em while they’re hotThe global automotive industry is humming, but potholes still abound. India’s Tata Motors badly overestimated demand for its $2,000 Nano minicar in its high-growth native market, for instance, while Volkswagen has been unable to avoid a leveling-off in sales, even in a market as well understood as the US.
Such missteps underscore the still-glaring need for global automotive companies to embrace the potential of Big Data, not only to avoid planning mistakes but to gain competitive advantages at both the tactical and the strategic levels.
One tactical Big Data blind spot for carmakers has been access to timely monthly market-share data. They rely on this data to plan their advertising and incentive campaigns. For instance, if one car company sees its market share for midsize cars slipping in one region in one month, it can mount an ad campaign the next month to try to win that share back. Advertising spend globally for autos in 2013 will be roughly $31 billion, according to Nielsen. Incentive spend in the United States alone is expected to be more than $30 billion, the National Automobile Dealers Association has stated.
In the United States, market-share information for every zip code in the country has been generated from auto registrations reported within the 50 states and compiled by R.L. Polk & Co. Polk has been the source of record for registration data in the United States for almost 100 years and is now part of IHS Automotive. (See Spotlight on page 54 for more details on the acquisition and its implications.)
Historically, some of the states would take 30 to 40 days to release the monthly registration data. Of course,
this delay negatively impacted automakers’ ability to mount effective ad campaigns.
This is where Big Data analytics come in. Today, IHS is blending the monthly vehicle registration data with transactional and navigational data from a variety of sources, including online car shopping sites. Using sophisticated data analytics—along with insight from IHS Automotive analysts—it is now possible to provide weekly market-share estimates within 48 hours of the previous week’s results. This is a 20-fold improvement in the timeliness of the data that enables automakers and dealers to target their ad campaigns to ideal audiences with razor-sharp precision.
From Anchorage, Alaska, to Zachary, Louisiana, auto dealerships can now spend their precious marketing dollars with more confidence and effectiveness.
John Brennan is senior director of strategy and product management, IHS Automotive.
For more on trends in automotive, visit ihs.com/Q11AutoBigData
Using sophisticated data analytics, it is now possible to provide weekly market-share estimates for auto sales within 48 hours of the previous week’s results—that’s a 20-fold improvement
8 | IHS Quarterly | Q1-2014
InsIghts
A transformed market challenges Western defense producers
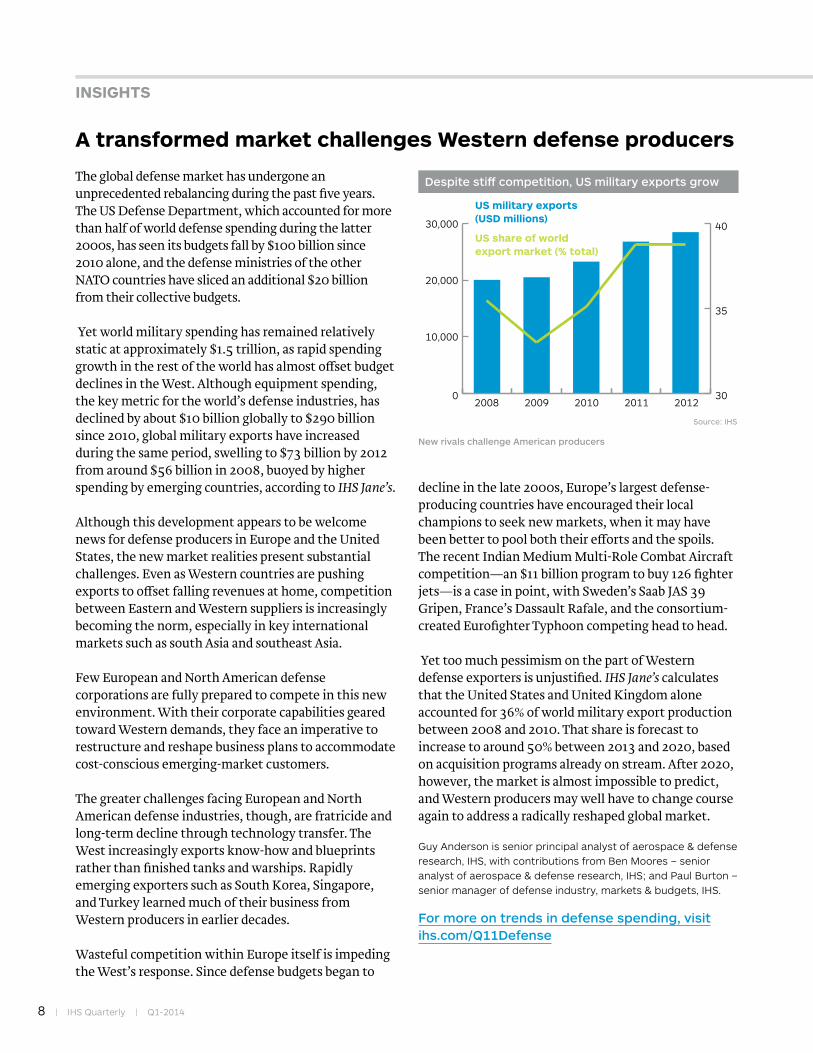
The global defense market has undergone an unprecedented rebalancing during the past five years. The US Defense Department, which accounted for more than half of world defense spending during the latter 2000s, has seen its budgets fall by $100 billion since 2010 alone, and the defense ministries of the other NATO countries have sliced an additional $20 billion from their collective budgets.
Yet world military spending has remained relatively static at approximately $1.5 trillion, as rapid spending growth in the rest of the world has almost offset budget declines in the West. Although equipment spending, the key metric for the world’s defense industries, has declined by about $10 billion globally to $290 billion since 2010, global military exports have increased during the same period, swelling to $73 billion by 2012 from around $56 billion in 2008, buoyed by higher spending by emerging countries, according to IHS Jane’s.
Although this development appears to be welcome news for defense producers in Europe and the United States, the new market realities present substantial challenges. Even as Western countries are pushing exports to offset falling revenues at home, competition between Eastern and Western suppliers is increasingly becoming the norm, especially in key international markets such as south Asia and southeast Asia.
Few European and North American defense corporations are fully prepared to compete in this new environment. With their corporate capabilities geared toward Western demands, they face an imperative to restructure and reshape business plans to accommodate cost-conscious emerging-market customers.
The greater challenges facing European and North American defense industries, though, are fratricide and long-term decline through technology transfer. The West increasingly exports know-how and blueprints rather than finished tanks and warships. Rapidly emerging exporters such as South Korea, Singapore, and Turkey learned much of their business from Western producers in earlier decades.
Wasteful competition within Europe itself is impeding the West’s response. Since defense budgets began to
decline in the late 2000s, Europe’s largest defense-producing countries have encouraged their local champions to seek new markets, when it may have been better to pool both their efforts and the spoils. The recent Indian Medium Multi-Role Combat Aircraft competition—an $11 billion program to buy 126 fighter jets—is a case in point, with Sweden’s Saab JAS 39 Gripen, France’s Dassault Rafale, and the consortium-created Eurofighter Typhoon competing head to head.
Yet too much pessimism on the part of Western defense exporters is unjustified. IHS Jane’s calculates that the United States and United Kingdom alone accounted for 36% of world military export production between 2008 and 2010. That share is forecast to increase to around 50% between 2013 and 2020, based on acquisition programs already on stream. After 2020, however, the market is almost impossible to predict, and Western producers may well have to change course again to address a radically reshaped global market.
Guy Anderson is senior principal analyst of aerospace & defense research, IHS, with contributions from Ben Moores – senior analyst of aerospace & defense research, IHS; and Paul Burton – senior manager of defense industry, markets & budgets, IHS.
For more on trends in defense spending, visit ihs.com/Q11Defense
Despite sti� competition, US military exports grow
0
10,000
20,000
30,000
2008 2009 2010 2011 2012
US military exports(USD millions)
Source: IHS
US share of worldexport market (% total)
30
35
40
New rivals challenge American producers

the Internet of things explodes
It has been a long time since anyone has built a genuinely better mousetrap. But with the ubiquity of connectivity these days, it is now possible for the janitorial staff in a commercial warehouse to be notified by smartphone when a mouse has been vanquished in some dank corner of the building—and when it is time to set another trap. Nothing could be more efficient in that particular pursuit.
That is just one example of how quickly the ‘Internet of Things’ is evolving into the ‘Internet of Everything’. A recent IHS report chronicles this quick-moving arena and gauges its explosive growth. The installed base for internet-connected devices reached an estimated 12.1 billion in 2013, a number that is expected to more than quadruple to nearly 50 billion by 2025. Shipments of IP-addressable devices reached 4.3 billion in 2012 and will grow to 13.7 billion by 2025.
The range of connected devices is also expanding. In 2013, more than 87% of internet-enabled devices were found in fixed and mobile communications, computers, and consumer electronics. That percentage will decline precipitously, to about 59% of the installed base, during the next 12 years as the Internet of Things penetrates the industrial market. Indeed, the manufacturing, medical, automotive, and military/aerospace sectors are among those that will see the greatest increase in connectivity, with non-consumer sectors accounting for 35% of the installed base by 2025, IHS predicts. Many of the new nodes in the Internet of Things will be mundane items such as streetlights, parking meters, and—yes—networked mousetraps.
The increasingly digital nature of social interactions is driving the growth of the Internet of Things, enabled by near-ubiquitous connectivity, inexpensive processing and sensor solutions, and the ability to use the internet to facilitate and expand communications between electronic devices. But the Internet of Things is expected to face some challenges, including a lack of appropriate business models for some subsectors, an absence of standards to enable interdevice communication, and expected resistance by consumers in some areas.
Still, the potential for creative uses of internet-
connected objects are virtually endless, ranging from cellular-equipped tractors monitoring fertilizer and seed distribution to Bluetooth-enabled teddy bears with built-in medical sensors to enable more child-friendly health monitoring. The possibilities are limited only by the human imagination.
Bill Morelli is manager of M2M & Internet of Things research, IHS Technology.
For more on the Internet of Things, visit ihs.com/Q11IoT
IHS Quarterly | Q1-2014 | 9
On beyond consumers: Where the Internet of Things is headed (billions of connected devices)
Source: IHS
2011 2012 2013 2016 2017 2022 20250
10
20
30
40
50
Communications Fixed
Communications Mobile
Computers
Consumer
Industrial
Military & Aerospace
World market for internet-connected devices; installed base and new shipments
Nonconsumer sectors will account for the majority of connected devices by 2025
10 | IHS Quarterly | Q1-2014
InsIghts
shipowners must wait for Arctic exploitation
In September 2013, a Russian oil tanker was damaged by ice while attempting to traverse the Arctic Ocean. It took five days for the first icebreakers to arrive on the scene to rescue the ship and another two days for a second tanker to come alongside to transfer the troubled vessel’s cargo.
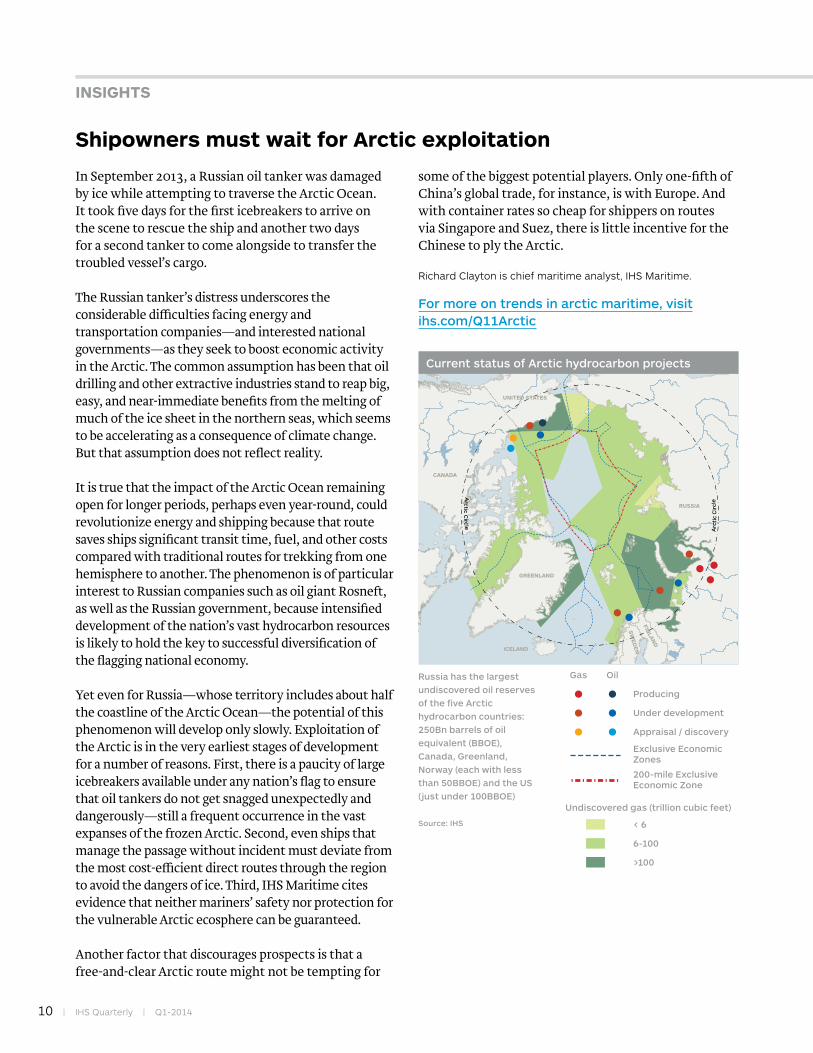
The Russian tanker’s distress underscores the considerable difficulties facing energy and transportation companies—and interested national governments—as they seek to boost economic activity in the Arctic. The common assumption has been that oil drilling and other extractive industries stand to reap big, easy, and near-immediate benefits from the melting of much of the ice sheet in the northern seas, which seems to be accelerating as a consequence of climate change. But that assumption does not reflect reality.
It is true that the impact of the Arctic Ocean remaining open for longer periods, perhaps even year-round, could revolutionize energy and shipping because that route saves ships significant transit time, fuel, and other costs compared with traditional routes for trekking from one hemisphere to another. The phenomenon is of particular interest to Russian companies such as oil giant Rosneft, as well as the Russian government, because intensified development of the nation’s vast hydrocarbon resources is likely to hold the key to successful diversification of the flagging national economy.
Yet even for Russia—whose territory includes about half the coastline of the Arctic Ocean—the potential of this phenomenon will develop only slowly. Exploitation of the Arctic is in the very earliest stages of development for a number of reasons. First, there is a paucity of large icebreakers available under any nation’s flag to ensure that oil tankers do not get snagged unexpectedly and dangerously—still a frequent occurrence in the vast expanses of the frozen Arctic. Second, even ships that manage the passage without incident must deviate from the most cost-efficient direct routes through the region to avoid the dangers of ice. Third, IHS Maritime cites evidence that neither mariners’ safety nor protection for the vulnerable Arctic ecosphere can be guaranteed.
Another factor that discourages prospects is that a free-and-clear Arctic route might not be tempting for
some of the biggest potential players. Only one-fifth of China’s global trade, for instance, is with Europe. And with container rates so cheap for shippers on routes via Singapore and Suez, there is little incentive for the Chinese to ply the Arctic.
Richard Clayton is chief maritime analyst, IHS Maritime.
For more on trends in arctic maritime, visit ihs.com/Q11Arctic
Arc
tic
Cir
cle
Arctic C
ircle
UNITED STATES
CANADA
GREENLAND
ICELAND
RUSSIA
FINLA
ND
SW
ED
EN
NO
RW
AYRussia has the largest
undiscovered oil reserves of the five Arctic hydrocarbon countries: 250Bn barrels of oil equivalent (BBOE), Canada, Greenland, Norway (each with less than 50BBOE) and the US (just under 100BBOE)
Source: IHS
Current status of Arctic hydrocarbon projects
Gas Oil
Producing
Under development
Appraisal / discovery
Exclusive Economic Zones
200-mile Exclusive Economic Zone
Undiscovered gas (trillion cubic feet)
< 6
6-100
>100

IHS Quarterly | Q1-2014 | 11
Worldwide healthcare spending: nowhere to go but up
Healthcare is a recession-proof industry, or so the theory goes, and new IHS research confirms it. By 2015, overall healthcare spending in the top global markets is likely to be three times what it was in 1995, despite only moderate increases in the past three years. Several forces underpin the IHS forecast, ranging from the leveling-off of the number of new breakthrough pharmaceuticals to the greater—and more expensive—segmentation of treatment populations by thousands rather than millions, thanks to the rise of personalized medicine.
Those trends are mild breezes, however, compared with the gale-force power of the major driver of worldwide healthcare spending: demographics. The global population is graying, even in some emerging markets. As a result, a whole host of lifestyle and age-related diseases are becoming increasingly prevalent. Healthcare costs must rise sharply just to keep up with the needs of an ageing population.
Although overall healthcare spending continues to grow, several factors are converging to make the current and expected economic environment more challenging for operators. In the United States, for example, the implementation of the Affordable Care Act has introduced a whole new layer of financial and regulatory uncertainty to the healthcare marketplace. And in the next 5–10 years, governments from Indonesia to Russia are expected to increase their roles as primary actors in the healthcare industry, creating ever-greater uncertainties and risks for private players.
A second set of uncertainties revolves around pharmaceutical companies, which dominated a generation of healthcare spending through everything from the blockbuster drugs they developed to the companies’ effectiveness at direct-to-consumer advertising. Now, though, R&D investments are beginning to yield diminishing returns—at least to an extent. It is more difficult to improve on what pharmaceutical companies already introduced, and the innovative new drugs that do make it to market face stiffer standards for reimbursement by insurers and governments.
Although the genomic revolution enables effective, highly targeted—and more expensive—therapies,
producers of those therapies must spread their development costs over ever-smaller patient populations. The confluence of these trends will extend the ongoing leveling of differences in healthcare costs and practices among nations and populations, and even between the developed world and emerging markets. Although medical expenditures are all but certain to continue their steady rise, these trends will create significant obstacles for healthcare players—including doctors, hospitals, insurers, and pharmaceutical companies—as they attempt to match their strategies, product and service portfolios, and resources to rapidly changing global needs.
The good news is that the industry continues to produce dramatic scientific breakthroughs that revolutionize treatment paradigms—the standards of care in age-related eye disease, rheumatoid arthritis, viral diseases, and various cancers have recorded some truly astonishing advances during the past few years. As long as those breakthroughs keep coming, the demand will always be there.
Gustav Ando is director of life sciences research, IHS.
For more on global healthcare trends, visit ihs.com/Q11Healthcare
The world is on a health kick (US$ billions)
0
3,000
9,000
15,000
202020131996
Aggregate healthcare spending
Source: IHS

12 | IHS Quarterly | Q1-2014
InsIghts
Wearable electronics: the next must-have fashion accessory
Smart watches and Google Glass have created speculation about a boom market in wearable electronics. While high-profile consumer products are expected to be a significant driver, IHS research suggests that medical and industrial applications will play an equally important role in driving the global wearables market to top $30 billion by 2018, up from $10 billion today.
Wearables moved from comic-book fantasy to mundane reality in the past decade thanks to multisensor combination packages and the low-power wireless chips that support them. The convergence of these technologies has sparked the creativity of product developers, who have raced to market with performance monitors such as wrist-worn sports computers, heart-rate monitors, hearing aids, insulin-pump governors, and Bluetooth headsets.
The array of mobile-focused wearables will continue to expand as Nike and other top names in the existing sector push the boundaries of technological feasibility and fashion. Wearables have become an integral part of the lives of millions of users, enabling them to use their smartphones to do everything from tracking running distances to recording strength-training sessions to monitor heart rates. An IHS consumer survey reveals strong interest from respondents in purchasing wearable sports hardware that enhances the functionality of their software.
In the medium term, though, the real action in wearables will take place far from the social, gaming, and infotainment realms. A raft of health, wellness, and medical applications will be coming online soon—expanding the healthcare market beyond hearing
aids and pacemakers to controllable medication disbursement—that promise to cut treatment side effects and boost patient outcomes. Other soon-to-come medical applications will include implantable microsystems and the further miniaturization of displays, which will enable, for example, contact lenses that generate images while treating glaucoma or improving eyesight.
And that is just a taste of things to come. Within the next few years, expect a range of wearables with business applications; for example, large companies could use enterprise wearables to network dozens, hundreds, or even thousands of employees.
Shane Walker is associate director of digital health research, IHS Technology.
For more on wearables and digital health, visit ihs.com/Q11Wearables
Wearables: Not just for jogging anymore ($billion USD)
Source: IHS
0
10
20
30
20182017201620152014201320122011
Healthcare, Medical, Fitness & Wellness
Infotainment
Industrial & Military
Business, medical, and military applications will power the next wave of development
IHS Quarterly | Q1-2014 | 13
tight oil boom gives edge to Us petchems and refining
Horizontal drilling and hydraulic fracturing have ushered in an energy revolution in North America enabling producers to access so-called tight oil—light crude held in low-permeability underground rock formations. But the story of how this relatively newfound, highly cost-competitive energy source is transforming the US refining and petrochemicals industries is just beginning to be told. The revolution’s impact on production and global pricing mechanisms has significant implications for capital investment in the downstream refining and petrochemicals sectors that will reshape the industry for years to come.
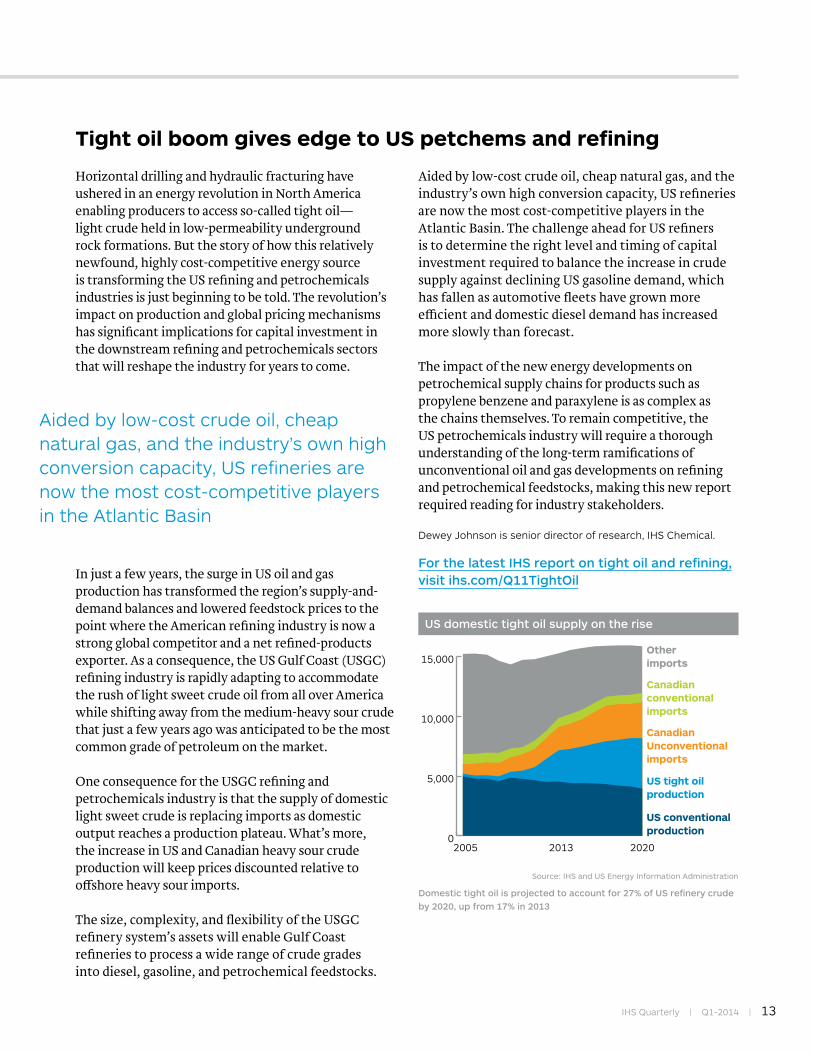
In just a few years, the surge in US oil and gas production has transformed the region’s supply-and-demand balances and lowered feedstock prices to the point where the American refining industry is now a strong global competitor and a net refined-products exporter. As a consequence, the US Gulf Coast (USGC) refining industry is rapidly adapting to accommodate the rush of light sweet crude oil from all over America while shifting away from the medium-heavy sour crude that just a few years ago was anticipated to be the most common grade of petroleum on the market.
One consequence for the USGC refining and petrochemicals industry is that the supply of domestic light sweet crude is replacing imports as domestic output reaches a production plateau. What’s more, the increase in US and Canadian heavy sour crude production will keep prices discounted relative to offshore heavy sour imports.
The size, complexity, and flexibility of the USGC refinery system’s assets will enable Gulf Coast refineries to process a wide range of crude grades into diesel, gasoline, and petrochemical feedstocks.
Aided by low-cost crude oil, cheap natural gas, and the industry’s own high conversion capacity, US refineries are now the most cost-competitive players in the Atlantic Basin. The challenge ahead for US refiners is to determine the right level and timing of capital investment required to balance the increase in crude supply against declining US gasoline demand, which has fallen as automotive fleets have grown more efficient and domestic diesel demand has increased more slowly than forecast.
The impact of the new energy developments on petrochemical supply chains for products such as propylene benzene and paraxylene is as complex as the chains themselves. To remain competitive, the US petrochemicals industry will require a thorough understanding of the long-term ramifications of unconventional oil and gas developments on refining and petrochemical feedstocks, making this new report required reading for industry stakeholders.
Dewey Johnson is senior director of research, IHS Chemical.
For the latest IHS report on tight oil and refining, visit ihs.com/Q11TightOil
Aided by low-cost crude oil, cheap natural gas, and the industry’s own high conversion capacity, US refineries are now the most cost-competitive players in the Atlantic Basin
US domestic tight oil supply on the rise
Source: IHS and US Energy Information Administration
0
5,000
10,000
15,000
Canadian conventional imports
Otherimports
Canadian Unconventional imports
US tight oilproduction
US conventionalproduction
202020132005
Domestic tight oil is projected to account for 27% of US refinery crude by 2020, up from 17% in 2013

14 | IHS Quarterly | Q1-2014
expertise
transition time for the BriCsIHS Quarterly sat down with IHS Chief Economist
Nariman Behravesh to discuss the outlook for the big
four emerging economies: Brazil, Russia, India and China.
As economic growth has slowed for these nations, the
responses required to adapt are quite different
China, India, Brazil, and Russia have all enjoyed rapid growth in the past decade—for three primary reasons.
First, they had access to a lot of credit at fairly cheap rates and they used that for a variety of purposes, such as financing infrastructure. Second, there was a sharp run up of commodity prices—what some call the commodity “super cycle.” Third was the “hyperglobalization” during the 2000s, when a lot of companies shifted manufacturing and sourcing overseas.
All three of these forces have slowed. Those strong tailwinds which had been pushing the economies of these emerging markets have died down.
During the boom years, these economies failed to put a lot of the structural reforms in place that would enable them to adapt to a slower pace of growth—for example, getting rid of some of the inefficient state-owned enterprises and removing subsidies. Now the economic tide has fallen in the global economy and these countries are sitting on rocks.
China: A new plan for reformChina is trying to reorient itself, but that process takes time. The country enjoyed the hyperglobalization boom and, partly because of its own policies, had a huge increase in the level of credit.
You see this today in the elevated level of debt the country is carrying. Chinese leaders know they cannot go on like this, so there has been some attempt to pull back on liquidity. The leadership is also attempting to
build up their domestic economy, so the economy is not so dependent on exports.
The Third Communist Party Plenum, which took place in November 2013, made it clear that the party wants to go down the road of reform—reforms that include allowing market forces to allocate resources and leveling the playing field for private enterprises and foreign investors alike. China has a way of doing what it says it is going to do, but it is not always easy and it may take longer than the leadership would like it to take.
One of the risks China faces is that it will not move fast enough down the road of reform. The powerful entrenched business interests that are so focused on exports do not want to give up that power. The other big risk is that China’s population is ageing rapidly, so they have to deal with that at the same time.
india: stubbornly slow to actIndia has some serious challenges. It has a debt bubble, especially in the corporate sector. It has a serious public deficit and debt problem, which China does not have. It also has an inflation problem, which China does not have. So their policy response has to be different. They have to be tightening at a time when China does not need to tighten.
The biggest disappointment in India recently has been that while politicians understand they have to reform the economy, they are not acting.
India has to open up its economy to competition.

IHS Quarterly | Q1-2014 | 15
For example, it should let in companies such as Walmart that can make the retail sector much more efficient. Whatever you think of Walmart, it is an exceptionally efficient retailer; whereas India’s retailers are extremely inefficient. But there are road blocks everywhere to this type of competition. And there has been investor disappointment in India’s unwillingness to open up the Indian economy. Nevertheless, our view is that India will get its act together to implement some structural reforms.
Brazil: tackle the dysfunctionBrazil had been enjoying rapid growth—until recently. While it enjoyed the ride, the government became complacent and did little to reform the economy.
The big issues within Brazil are huge inefficiencies and extremely high costs. There is a phrase people use about Brazil: the “Brazil Cost”—some of it is high wages, relative to productivity, some of it is high taxation. Brazil has a dysfunctional political fiscal system. The bureaucracy is onerous; and by some estimates, at least half the government workforce does not work. A country cannot develop under those circumstances.
As with so many of the emerging economies, Brazil has to allow more competition, become much more efficient, and get costs down.
russia: No change without political changeRussia’s problem is twofold. First, it has not been particularly encouraging to foreign investment, even though it needs the capital. Second, there is a lot of corruption in Russia, and the government has failed to use its oil money to diversify the economy. Russia’s oligarchy has benefited hugely from the political system, and they are not about to give up those benefits or support radically new policies.
Recently, Russia became part of the World Trade Organization. Normally, when countries join the WTO the government agrees to certain economic reforms, such as reduced trade barriers. But the Russians have asked for a lot of exceptions. Unlike China, which joined the WTO about 10 years ago, Russia has not implemented the changes and reforms countries typically undertake when they join. So while we may see some policy changes from Russia, they will be fairly minor.
Nariman Behravesh is Chief Economist at IHS.
For the video of the complete interview, visit ihs.com/Q11Expertise
www.ihs.com/experts/Nariman-Behravesh.aspx
www.linkedin.com/in/narimanbehravesh
slower growth ahead for the BriCs (% annual real GDp growth)
2010 2011 2012 2013 2014 2015
China 10.5% 9.3% 7.7% 7.8% 8.0% 8.2%
India 10.5% 6.3% 3.2% 4.6% 5.6% 6.5%
Brazil 7.5% 2.7% 1.0% 2.2% 2.9% 3.7%
Russia 4.5% 4.3% 3.4% 1.7% 2.7% 3.9%Source: IHS

ANALYTICS
16 | IHS Quarterly | Q1-2014
A tale of two emerging economies
What a difference a few decades make, especially when it comes to comparing China and India, the two largest emerging market economies in the world. In 1990, China’s population was 30% larger than India’s. Fast forward to 2026, this is when India is expected to overtake China as the world’s most populous nation. China’s past fears of overpopulation are starting to give way to fears of a shrinking population by 2031—and, more importantly, a shrinking workforce as the population ages—thanks in large part to the one-child policy the country introduced in 1979. In 2013, China’s average household size is estimated at only 2.9 people, compared with India’s 4.8.
China’s population plateau will boost worker incomes
1980 2000 2020 2040
China
India
Source: IHS
millions of persons
500
1000
1500
2000
China’s looming labor shortages will create upward pressure on wages
IHS Quarterly | Q1-2014 | 17
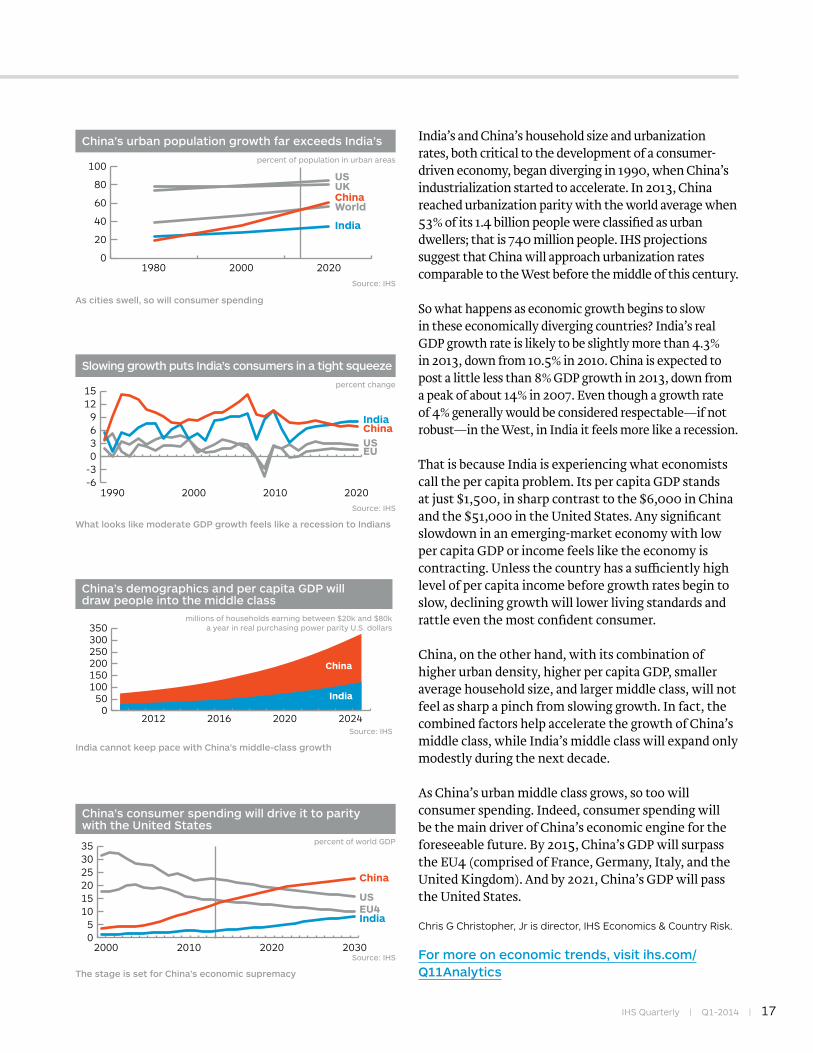
India’s and China’s household size and urbanization rates, both critical to the development of a consumer-driven economy, began diverging in 1990, when China’s industrialization started to accelerate. In 2013, China reached urbanization parity with the world average when 53% of its 1.4 billion people were classified as urban dwellers; that is 740 million people. IHS projections suggest that China will approach urbanization rates comparable to the West before the middle of this century.
So what happens as economic growth begins to slow in these economically diverging countries? India’s real GDP growth rate is likely to be slightly more than 4.3% in 2013, down from 10.5% in 2010. China is expected to post a little less than 8% GDP growth in 2013, down from a peak of about 14% in 2007. Even though a growth rate of 4% generally would be considered respectable—if not robust—in the West, in India it feels more like a recession.
That is because India is experiencing what economists call the per capita problem. Its per capita GDP stands at just $1,500, in sharp contrast to the $6,000 in China and the $51,000 in the United States. Any significant slowdown in an emerging-market economy with low per capita GDP or income feels like the economy is contracting. Unless the country has a sufficiently high level of per capita income before growth rates begin to slow, declining growth will lower living standards and rattle even the most confident consumer.
China, on the other hand, with its combination of higher urban density, higher per capita GDP, smaller average household size, and larger middle class, will not feel as sharp a pinch from slowing growth. In fact, the combined factors help accelerate the growth of China’s middle class, while India’s middle class will expand only modestly during the next decade.
As China’s urban middle class grows, so too will consumer spending. Indeed, consumer spending will be the main driver of China’s economic engine for the foreseeable future. By 2015, China’s GDP will surpass the EU4 (comprised of France, Germany, Italy, and the United Kingdom). And by 2021, China’s GDP will pass the United States.
Chris G Christopher, Jr is director, IHS Economics & Country Risk.
For more on economic trends, visit ihs.com/Q11Analytics
As cities swell, so will consumer spending
China’s urban population growth far exceeds India’s
1980 2000 2020
ChinaWorld
India
USUK
0
20
40
60
80
100percent of population in urban areas
Source: IHS
What looks like moderate GDP growth feels like a recession to Indians
Slowing growth puts India’s consumers in a tight squeeze
1990 2000 2010 2020
ChinaIndia
USEU
-6-30369
1215
percent change
Source: IHS
India cannot keep pace with China’s middle-class growth
China’s demographics and per capita GDP will draw people into the middle class
2012 2016 2020 20240
50100150200250300350
China
India
millions of households earning between $20k and $80ka year in real purchasing power parity U.S. dollars
Source: IHS
The stage is set for China’s economic supremacy
China’s consumer spending will drive it to parity with the United States
2000 203020202010
China
India
USEU4
05
101520253035 percent of world GDP
Source: IHS

18 | IHS Quarterly | Q1-2014
Mapping the plastics value chain from resins to ringtonesChemical and electronics companies that want to stay ahead of the competition need new insight into innovation, change, and disruption across the extended value chainBy Don Bari and Jagdish Rebello
IHS Quarterly | Q1-2014 | 19
In the market for a new flat-screen television? Hold off on that purchase a little longer. A new generation of televisions with organic light-
emitting diodes (OLEDs) is about to come to market that will deliver clearer images in thinner, lighter displays. Using innovative polymers to replace light-emitting diode (LED) backlights and liquid-crystal displays (LCDs), the electronics industry—which includes electrical equipment—has collaborated with the chemical industry to deliver a more satisfying home entertainment experience.
This synergistic coupling of two industries is good news for consumers, but for chemical and electronics and electrical equipment companies that bet on obsolescent LCD technology, the impact on the bottom line is distinctly less favorable. Chemical companies that committed to manufacture resins such as polymethyl methacrylate (PMMA), used for backlighting in today’s LCDs, are no better off. Executives and corporate analysts who lacked insight into both the electronics and chemical market may have missed this opportunity—or, worse yet, made supply-chain commitments that will force them to produce last-generation products which consumers will overlook.
To meet the demands of a rapidly changing market, chemical and electronics companies need a holistic
view of their complete value chain as well as the competitive and technology dynamics of their end markets. Tools and strategies that were previously used to gather insight are no longer sufficient to understand the dynamics of these markets or to innovate to meet market demand. Upstream or downstream partners need visibility into how change—not just in their own industry but in those of their value-chain partners—affects their businesses.
How can companies connect the dots between conditions in the specialty chemical and engineering plastics markets and the electronics market? What steps should executives take to gain insights that will help them stay ahead of changing industry conditions and trends? And can those insights help them mitigate risk, participate in the higher value-chain nodes, and enhance operational performance?
Challenges shape opportunities
Manufacturing and procurement managers typically develop a clear line of sight into their corporate supply chains, from suppliers to customers. Yet for companies in the chemical and electronics industries, having a view only of their own supply chain creates a limited perspective. Because these industries are deeply entwined, and their successes and failures are interreliant, executives need to make decisions based
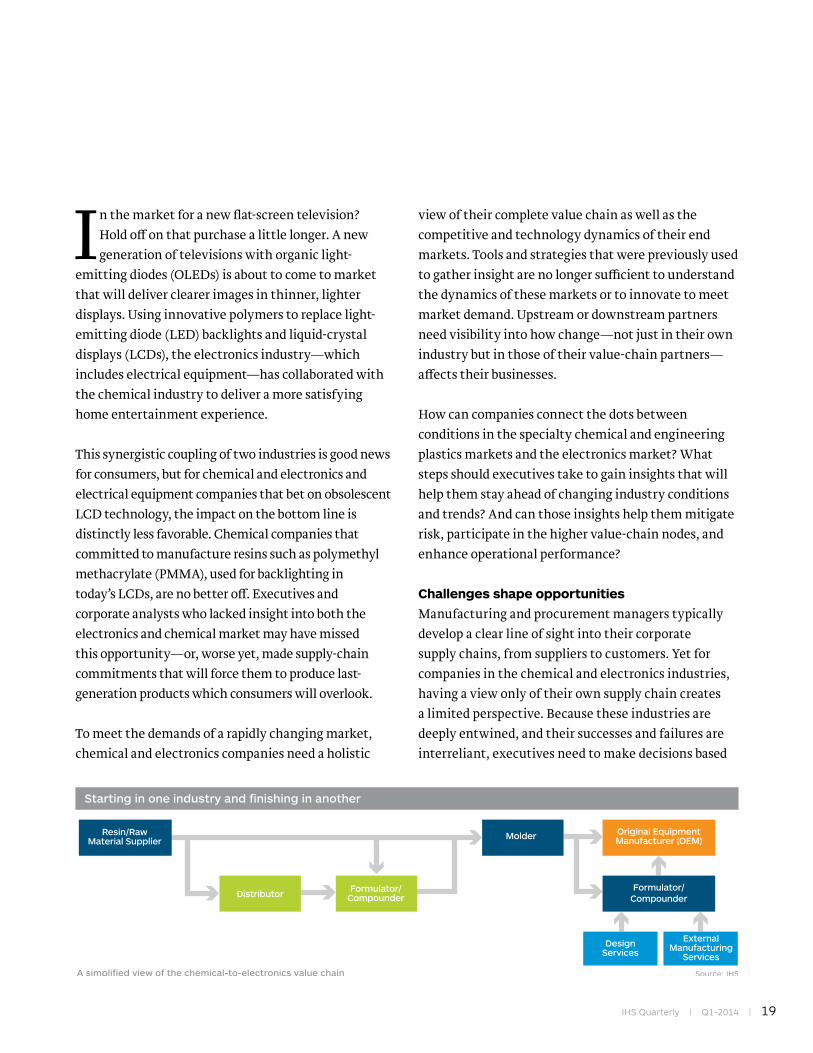
Starting in one industry and finishing in another
A simplified view of the chemical-to-electronics value chain Source: IHS
Molder
Distributor Formulator/Compounder
Formulator/Compounder
Resin/Raw Material Supplier
Original EquipmentManufacturer (OEM)
ExternalManufacturing
ServicesDesign
Services
20 | IHS Quarterly | Q1-2014
on events occurring across the full value chain, from the raw materials provided by the chemical- and plastics-related companies to the equipment manufacturer that assembles the final goods and the consumers who buy them (see chart on page 19). Each player in this extensive value chain has a critical role to play as well as essential insight and information to share (see box on page 23).
Not only do constantly changing conditions and market dynamics in the electronics and chemical industries bring unique challenges to the value chain, but these two industries move at different paces. For example, when a chemical or plastics industry manufacturer decides to add capacity, five years or more can elapse between initial planning and start-up. Yet electronics materials demand obsolescence can happen within five years or less. This uneven pace creates an inherent supply-demand discontinuity that can be very costly for resin decision makers.
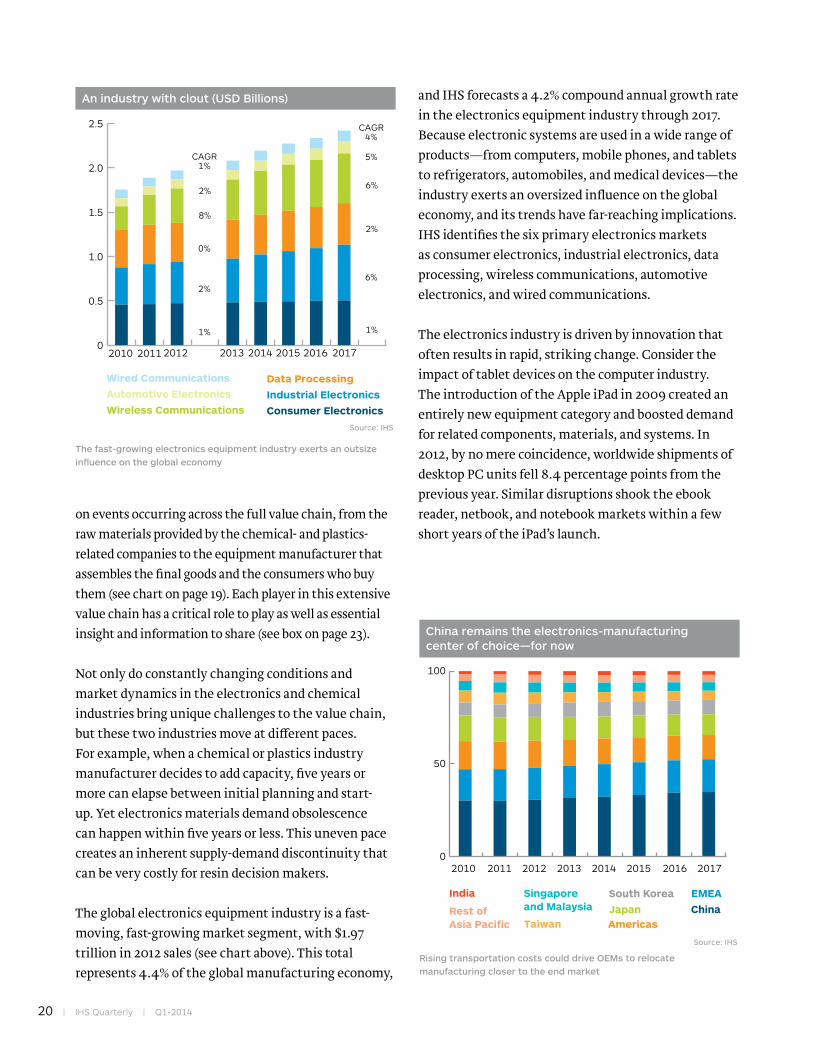
The global electronics equipment industry is a fast-moving, fast-growing market segment, with $1.97 trillion in 2012 sales (see chart above). This total represents 4.4% of the global manufacturing economy,
and IHS forecasts a 4.2% compound annual growth rate in the electronics equipment industry through 2017. Because electronic systems are used in a wide range of products—from computers, mobile phones, and tablets to refrigerators, automobiles, and medical devices—the industry exerts an oversized influence on the global economy, and its trends have far-reaching implications. IHS identifies the six primary electronics markets as consumer electronics, industrial electronics, data processing, wireless communications, automotive electronics, and wired communications.
The electronics industry is driven by innovation that often results in rapid, striking change. Consider the impact of tablet devices on the computer industry. The introduction of the Apple iPad in 2009 created an entirely new equipment category and boosted demand for related components, materials, and systems. In 2012, by no mere coincidence, worldwide shipments of desktop PC units fell 8.4 percentage points from the previous year. Similar disruptions shook the ebook reader, netbook, and notebook markets within a few short years of the iPad’s launch.
Rising transportation costs could drive OEMs to relocate manufacturing closer to the end market
China remains the electronics-manufacturing center of choice—for now
Source: IHS
0
50
100
India
Rest of Asia Pacific
Singapore and Malaysia
Taiwan
South KoreaJapanAmericas
EMEAChina
20172016201520142013201220112010
The fast-growing electronics equipment industry exerts an outsize influence on the global economy
An industry with clout (USD Billions)
Source: IHS
20112010 2012 2013 2014 2015 2016 20170
0.5
1.0
1.5
2.0
2.5
CAGR 1%
0%
1%
2%
2%
8%
5%
CAGR 4%
6%
1%
6%
2%
Wired Communications
Automotive Electronics
Wireless Communications
Data Processing
Industrial Electronics
Consumer Electronics

Tactical supply-chain issues can also impact manufacturing processes and profitability. For example, although many electronics companies have opened facilities in China, rising transportation costs for semifinished and finished products are encouraging manufacturers to consider assembling products closer to the locations of their end users. As consumer demand grows in emerging markets and commodity prices continue to fall, manufacturers are expected to shift from a China-centric build strategy to one that is globally distributed, with manufacturing locations that serve different target regions (see chart below). To reach this goal, manufacturers need to work with suppliers that can support global sourcing practices.
Looking ahead, innovations such as cloud computing, Big Data, social-networking sites, data analytics, machine-to-machine communications, and the Internet of Things are certain to leave their imprint on both consumers’ digital lifestyles and the way businesses interact with each other and their customers. For this reason, players in the electronics value chain need insight into consumer demand and the competitive landscape as well as the evolving market dynamics and evolutions in their supply chains. To stay ahead of the competition, manufacturers also need the flexibility to quickly move into new markets—or to leave less profitable ones—when it becomes clear that the technology or business landscape has changed.
The chemical industry’s value chains are equally complex. Multiple products, industry pressures, and the rapid pace of change make it difficult for companies to accurately anticipate challenges.
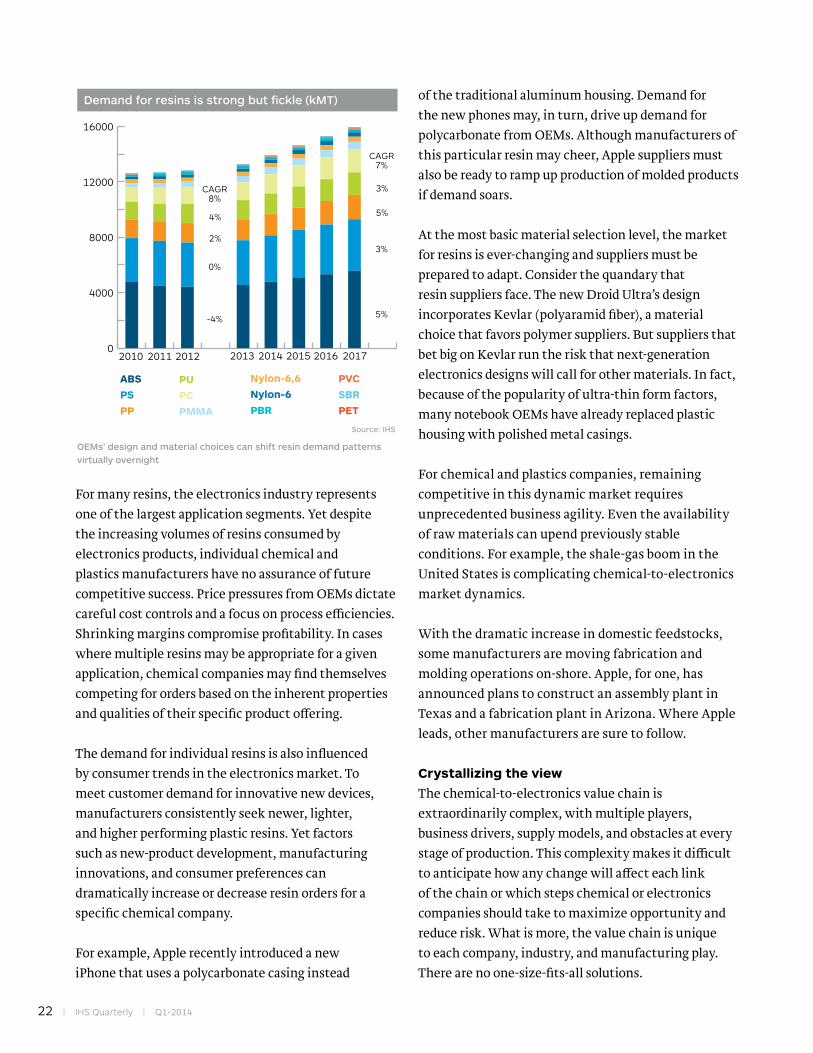
Manufacturers use a wide variety of engineered and specialized resins to create electronics products (see chart above). Each resin has its own properties and characteristics that make it well-suited to certain applications. To meet demanding product requirements, compounders can modify and tailor the properties of base resins by adding suitable fillers and additives. In 2012, the industry consumed 12.8 million metric tonnes of plastic resins. By 2017, that total is expected to rise to nearly 16 million metric tonnes.
IHS Quarterly | Q1-2014 | 21
22 | IHS Quarterly | Q1-2014
For many resins, the electronics industry represents one of the largest application segments. Yet despite the increasing volumes of resins consumed by electronics products, individual chemical and plastics manufacturers have no assurance of future competitive success. Price pressures from OEMs dictate careful cost controls and a focus on process efficiencies. Shrinking margins compromise profitability. In cases where multiple resins may be appropriate for a given application, chemical companies may find themselves competing for orders based on the inherent properties and qualities of their specific product offering.
The demand for individual resins is also influenced by consumer trends in the electronics market. To meet customer demand for innovative new devices, manufacturers consistently seek newer, lighter, and higher performing plastic resins. Yet factors such as new-product development, manufacturing innovations, and consumer preferences can dramatically increase or decrease resin orders for a specific chemical company.
For example, Apple recently introduced a new iPhone that uses a polycarbonate casing instead
of the traditional aluminum housing. Demand for the new phones may, in turn, drive up demand for polycarbonate from OEMs. Although manufacturers of this particular resin may cheer, Apple suppliers must also be ready to ramp up production of molded products if demand soars.
At the most basic material selection level, the market for resins is ever-changing and suppliers must be prepared to adapt. Consider the quandary that resin suppliers face. The new Droid Ultra’s design incorporates Kevlar (polyaramid fiber), a material choice that favors polymer suppliers. But suppliers that bet big on Kevlar run the risk that next-generation electronics designs will call for other materials. In fact, because of the popularity of ultra-thin form factors, many notebook OEMs have already replaced plastic housing with polished metal casings.
For chemical and plastics companies, remaining competitive in this dynamic market requires unprecedented business agility. Even the availability of raw materials can upend previously stable conditions. For example, the shale-gas boom in the United States is complicating chemical-to-electronics market dynamics.
With the dramatic increase in domestic feedstocks, some manufacturers are moving fabrication and molding operations on-shore. Apple, for one, has announced plans to construct an assembly plant in Texas and a fabrication plant in Arizona. Where Apple leads, other manufacturers are sure to follow.
Crystallizing the view
The chemical-to-electronics value chain is extraordinarily complex, with multiple players, business drivers, supply models, and obstacles at every stage of production. This complexity makes it difficult to anticipate how any change will affect each link of the chain or which steps chemical or electronics companies should take to maximize opportunity and reduce risk. What is more, the value chain is unique to each company, industry, and manufacturing play. There are no one-size-fits-all solutions.
OEMs’ design and material choices can shift resin demand patterns virtually overnight
Demand for resins is strong but fickle (kMT)
Source: IHS
20112010 2012 2013 2014 2015 2016 20170
4000
8000
12000
16000
CAGR 8%
0%
-4%
4%
2%
CAGR7%
3%
5%
3%
5%
PVC
SBR
PET
Nylon-6,6
Nylon-6
PBR
PU
PC
PMMA
ABS
PS
PP

IHS Quarterly | Q1-2014 | 23
The value chain from chemical to plastics is becoming increasing complex, from the design of products and the specification of components to the selection of suppliers and the manufacture of products. Not all partners participate in every phase of the manufacturing process, but most value chains include many of the partners described below.
Resin suppliers provide the raw materials for the plastic components used in the electronics industry. When volumes are large or OEMs are influential, the resin suppliers work closely (and often directly) with molders, contract manufacturers, and OEMs. By building close working relationships with these partners, resin suppliers develop a clear understanding of current product requirements and future road maps. They may even create customized resins to meet unique product specifications.
Distributors are responsible (in some value chains) for ensuring that resins from multiple suppliers make their way to customers. As companies try to drive costs from their supply-chain operations, the role of distributors is shrinking. Many distributors work with smaller OEMs and molders, adding value through just-in-time deliveries, smaller order quantities, and service responsiveness.
Compounders tailor material properties to the specifications required by certain products. Very often a compounder’s additive package will enhance the resin performance properties to enable this lower cost resin to compete with higher performance, more expensive engineering resins. Working with materials from multiple resin suppliers, compounders create custom-formulated plastics designed to be, for example, flame-retardant, mechanically toughened, or
weather-resistant. In the electronics and application subsegments of the electronics market, compounders play an important role: Approximately 75% to 80% of resins go through compounding. As a result, compounders must develop close relationships not only with resin suppliers but with the design, research and development, manufacturing, and procurement teams of target OEMs.
Molders procure raw materials from resin suppliers, compounders, or distributors and then create finished plastic products, which are designed to be used in OEM products. Although most molders are independent players, some OEM or contract manufacturers have their own molding operations. Molders can mass-produce simple or complex plastic products, or they can create custom products to meet OEM specifications. To minimize transportation costs, most molders situate themselves close to the final assembly locations of their target customers. Developing extensive manufacturing knowledge is essential, as is building close relationships with OEMs and contract manufacturers.
OEMs may have a variety of relationships with members of the value chain. OEMs may sell their product to consumers through a network of distributors and retailers or, in some cases, through a network of service providers. Some OEMs rely on outsourced manufacturers, including external manufacturing and design services. Others prefer to be vertically integrated and keep all manufacturing in-house. Most OEMs retain some in-house manufacturing capabilities but contract with external manufacturing partners to create specialized products or commodity parts.
Partners in the plastics component value chain

Executives in the electronics and chemical industries—and many other industries, as well—need a bird’s-eye view of the end-to-end value chain that provides insight into both potential opportunities and disruptive forces (see box on left).
Because few companies have either the internal expertise or the budget to develop this comprehensive view, many rely on outside organizations to contribute tools, data, and knowledge. With the insight that only an expansive view of the entire value chain can deliver, decision makers can gain the insight needed to innovate effectively and take appropriate steps when change occurs.
How can enterprises develop a holistic view of the value chain? We recommend that organizations begin by analyzing the segments of the industries in which they may want to participate. Using industry-specific databases to mine rich information and industry expertise to understand existing and developing market conditions, companies can analyze potential opportunities and build realistic strategies for entering the market or new parts of the market.
Using demand-side expertise, chemical companies can determine which segments of the expansive electronics industry are attractive targets for their business. For example, chemical executives should develop a comprehensive understanding of the electronics value chain and industry, including related business models across various segments and subsegments of the market. It is also essential to understand where in the value chain key decisions are made regarding product design and manufacturing. This information can help executives decide the role in which their company should enter a given market—for example, as a plastics resin manufacturer or a compounder—and in what country.
Powerful, multivariate analyses can help companies determine the likely sources of future business growth as well as the types of resins expected to be in high demand. Business leaders can then decide which chemical or plastic resins they should produce
From nylon to Nike
Understanding the value chain from chemical-based raw materials to finished products is not only valuable for electronics companies. Consumer products companies such as Nike rely on a complete view of the supply chain to understand how market conditions for nylon and polyester fiber impact the design of its sportswear. Nike procurement professionals routinely assess the current and forecast costs for nylon and polyethylene terephthalate (PET) materials, as well as their primary feedstock and intermediate chemical building blocks, used in athletic and sportswear fabric and trim. By projecting nylon and PET costs two years before a garment is delivered to market, Nike creates insight into intermaterials costs and availability. The company can then adjust product designs, choosing materials that minimize costs or reduce supply-chain risk.
24 | IHS Quarterly | Q1-2014
IHS Quarterly | Q1-2014 | 25
and whether to expand on existing product lines or manufacturing agreements or into additional markets. By basing decisions on extensive, detailed insight into consumer demand in the electronics market, chemical executives are better equipped to anticipate trends, respond quickly and effectively to change, and make the decisions that help them produce the right resins, in the right amounts, at the right time.
Electronics industry decision makers likewise need insight into the chemical industry to optimize the manufacturing process. Using deep research on the skill sets and expertise possessed by specific chemical companies, OEMs can select partners who can enhance innovation, support product strategies, and minimize costs for their products. They can choose the resins most likely to maximize profitability and reduce risk for each finished product. Comprehensive industry analyses can help OEMs identify and prioritize the business opportunities likely to deliver maximum value.
Market positioning is unique to each organization and product. For example, companies such as LG Electronics and Samsung own their entire value chains, from polymers to consumer products. Visibility into demand patterns helps inform product design decisions, and end-to-end control of the value chain enables early insight into the need for future feedstocks.
Apple, on the other hand, typically outsources all activities after product design, leaving its value-chain partners to identify the products with the widest margins and the highest profit potential, as well as the likely competitive dynamics and potential barriers.
Spotlighting opportunity
Returning to OLED televisions, it has only been a few years since analysts were projecting rapid growth in PMMA use, the resin used to create guide lights on the back of TVs. Now as TV manufacturers transition from edge-lit LEDs to low-cost direct-lit LCDs and, ultimately, to OLED TVs, the market for PMMA is shrinking while demand for low-cost polycarbonate
grows. This is not nice-to-know information; it is need-to-know, critical decision-support data that can impact a company’s profitability for years. Market disruptions occur at a much faster pace than most companies anticipate.
With increasingly rapid development lifecycles and shrinking product lifecycles, companies cannot afford to depend on previous success or assume past is prologue when it comes to the value chain. Organizations need to be innovative, take calculated risks, and be unafraid to enter a new space when the timing and chemistry are right.
But executives can only do this when they have a complete picture of the market. Few have the time to develop this knowledge through trial and error. Instead, business leaders are turning to experts who can help them recognize market disruptors early on. In the chemical and electronics industries, staying ahead of the market is the only way to keep up.
Don Bari is senior director and head of technology & analytics for IHS Chemical.ihs.com/experts/don-bari.aspx
Jagdish Rebello is senior director of consumer and communications research for IHS Technology.ihs.com/experts/jagdish-rebello.aspx
For more on the chemical and electronics value chain, visit ihs.com/Q11Chemicals
26 | IHS Quarterly | Q1-2014
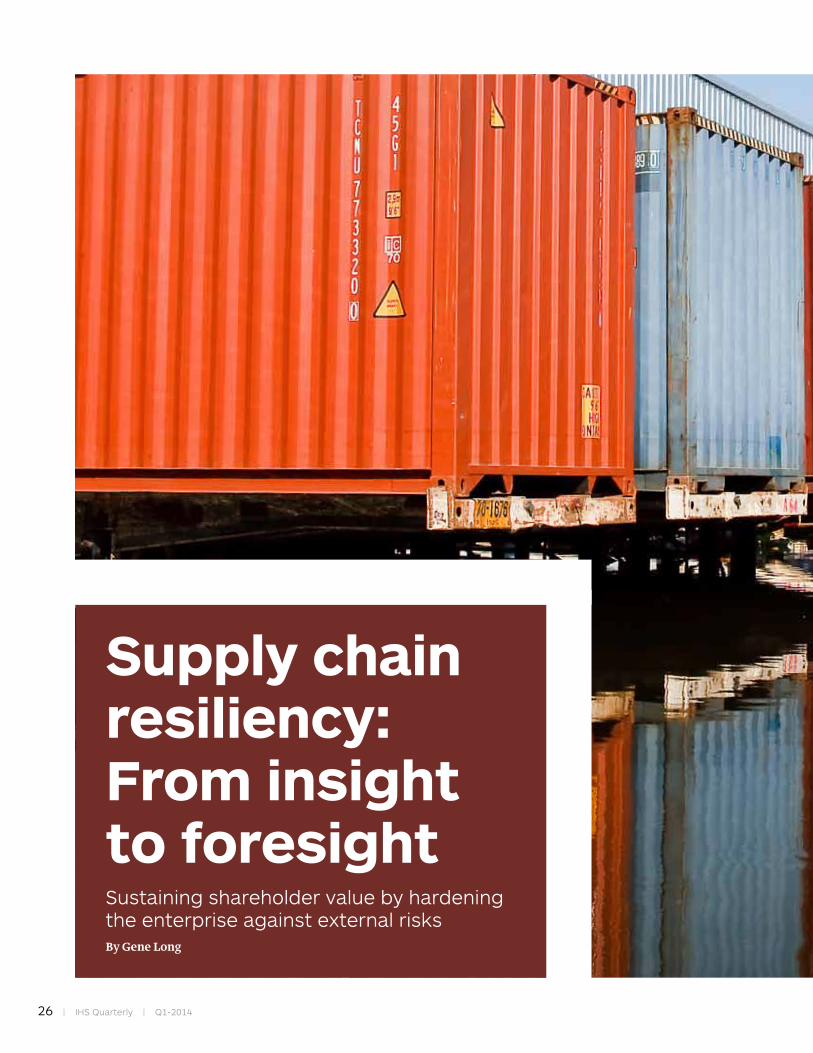
Supply chain resiliency: From insight to foresight Sustaining shareholder value by hardening the enterprise against external risksBy Gene Long

IHS Quarterly | Q1-2014 | 27
Major flooding in Thailand in October 2011 disabled electronics component manufacturers for months and disrupted
worldwide supply chains across the electronics industry. The havoc caused consumer product shortages during the holiday season, and the financial impact lasted for most of 2012. The damage to shareholder value, customer loyalty, and brand value are harder to calculate, but are likely to still be ongoing for some OEMs.
Natural and manmade external disruptions to supply chains—as well as the ensuing long-term financial consequences—are spurring supply chain professionals, senior executives, and corporate boards to rethink their approach to risk. After two decades of pursuing more efficient supply chains with risk-mitigation strategies aimed at swift disaster recovery, companies are pivoting toward more proactive and adaptive supply chains.
This shift has come as supply chain executives—and investors in their companies—have learned just how much external disruptions can degrade corporate performance. As incidents such as the Thailand floods increase in frequency, the risk grows that they will destroy shareholder value and customer loyalty, which took years to build. In one seminal study, companies that suffered supply chain disruptions experienced as much as 40% lower stock returns and took two years to fully recover from the shock. Faced with such consequences, corporate boards are starting to realize that the supply chains they have built are as fragile as they are efficient, and that being great at disaster recovery is not good enough.
Today’s supply chains are well prepared with contingency plans to recover fairly quickly from some disruptions. But fairly quickly no longer satisfies shareholders and customers. Supply chains and the enterprises they serve need to become resilient—that is, better at sensing and responding to threats before they cause acute, sustained, and possibly catastrophic financial consequences.
The art and science of anticipation requires new types of information and analysis. To manage efficient supply
28 | IHS Quarterly | Q1-2014
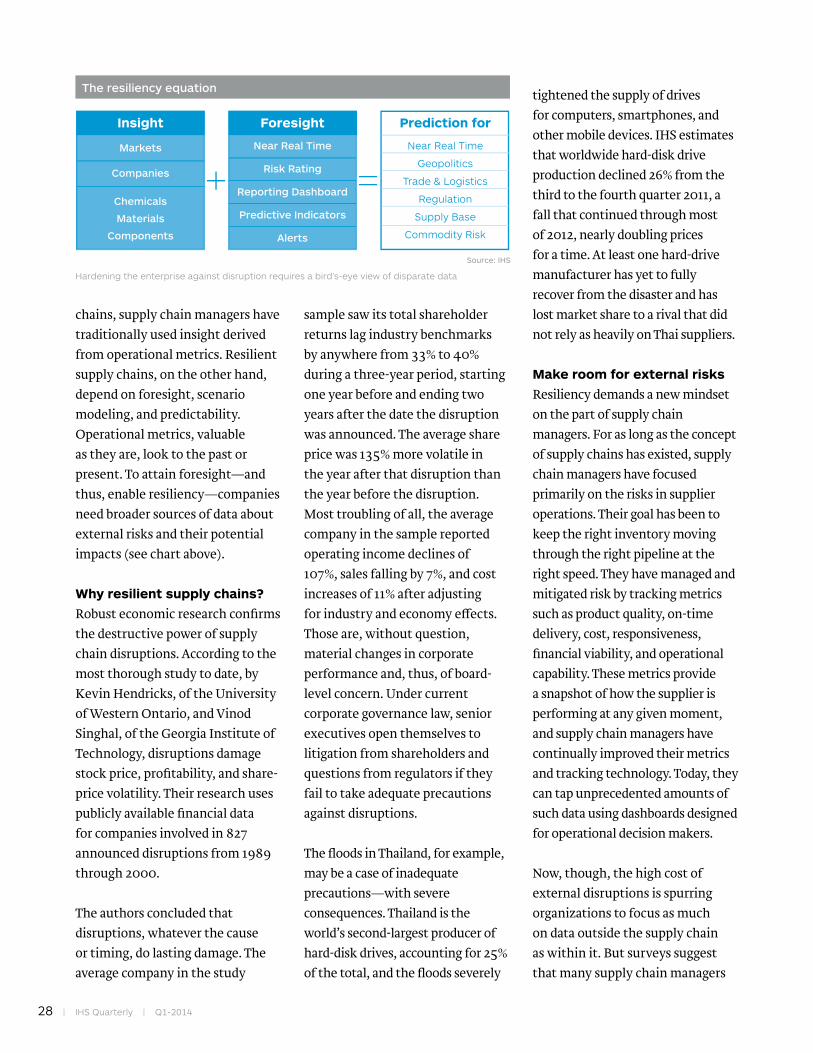
chains, supply chain managers have traditionally used insight derived from operational metrics. Resilient supply chains, on the other hand, depend on foresight, scenario modeling, and predictability. Operational metrics, valuable as they are, look to the past or present. To attain foresight—and thus, enable resiliency—companies need broader sources of data about external risks and their potential impacts (see chart above).
Why resilient supply chains?
Robust economic research confirms the destructive power of supply chain disruptions. According to the most thorough study to date, by Kevin Hendricks, of the University of Western Ontario, and Vinod Singhal, of the Georgia Institute of Technology, disruptions damage stock price, profitability, and share-price volatility. Their research uses publicly available financial data for companies involved in 827 announced disruptions from 1989 through 2000.
The authors concluded that disruptions, whatever the cause or timing, do lasting damage. The average company in the study
sample saw its total shareholder returns lag industry benchmarks by anywhere from 33% to 40% during a three-year period, starting one year before and ending two years after the date the disruption was announced. The average share price was 135% more volatile in the year after that disruption than the year before the disruption. Most troubling of all, the average company in the sample reported operating income declines of 107%, sales falling by 7%, and cost increases of 11% after adjusting for industry and economy effects. Those are, without question, material changes in corporate performance and, thus, of board-level concern. Under current corporate governance law, senior executives open themselves to litigation from shareholders and questions from regulators if they fail to take adequate precautions against disruptions.
The floods in Thailand, for example, may be a case of inadequate precautions—with severe consequences. Thailand is the world’s second-largest producer of hard-disk drives, accounting for 25% of the total, and the floods severely
tightened the supply of drives for computers, smartphones, and other mobile devices. IHS estimates that worldwide hard-disk drive production declined 26% from the third to the fourth quarter 2011, a fall that continued through most of 2012, nearly doubling prices for a time. At least one hard-drive manufacturer has yet to fully recover from the disaster and has lost market share to a rival that did not rely as heavily on Thai suppliers.
Make room for external risks
Resiliency demands a new mindset on the part of supply chain managers. For as long as the concept of supply chains has existed, supply chain managers have focused primarily on the risks in supplier operations. Their goal has been to keep the right inventory moving through the right pipeline at the right speed. They have managed and mitigated risk by tracking metrics such as product quality, on-time delivery, cost, responsiveness, financial viability, and operational capability. These metrics provide a snapshot of how the supplier is performing at any given moment, and supply chain managers have continually improved their metrics and tracking technology. Today, they can tap unprecedented amounts of such data using dashboards designed for operational decision makers.
Now, though, the high cost of external disruptions is spurring organizations to focus as much on data outside the supply chain as within it. But surveys suggest that many supply chain managers
The resiliency equation
Source: IHS
Insight Foresight Prediction for
Markets
Companies
Chemicals
Materials
Components
Near Real Time
Risk Rating
Reporting Dashboard
Predictive Indicators
Alerts
Near Real Time
Geopolitics
Trade & Logistics
Regulation
Supply Base
Commodity Risk
Hardening the enterprise against disruption requires a bird’s-eye view of disparate data

IHS Quarterly | Q1-2014 | 29
have been slow to broaden their information horizons. As a result, they are overlooking or minimizing significant risks (see sidebar: ‘The wide variety of external risks’ on page 32).
Supply & Demand Chain Executive magazine recently conducted its 2013 Global Outsourcing & Supply Chain Risk survey of 220 supply chain professionals. Nearly one-third of respondents—65%—said the financial impact of supply chain disruptions of all types is increasing. In the same survey, more than 86% said their supply chains had experienced disruptions within the past two years that had material impacts on business continuity.
The survey asked respondents to identify levels of concern for various supply chain disruptions. The most concern surrounded supplier viability/failure, followed by natural disaster/weather. The category of least concern was manmade disasters (see chart below).
The results indicate that supply chain managers may place insufficient weight on external disruptions, especially manmade disasters, labor disputes, and geopolitical instability. Perhaps organizations feel they are immune to these risks, or they have not analyzed the ripple effects on suppliers. Perhaps the relative lack of concern for labor and wage disruption exists because today’s supply chain managers have grown accustomed to operating in a buyer’s labor market.
Whatever the reasons for lack of concern, the idea behind foresight-driven resilient supply chain management is not to discard or downplay supplier viability. The idea is that supply chain managers have achieved a high degree of mitigation for operational risks and now need to broaden their focus and consider external risks and vulnerabilities stemming from interdependencies within the entire global operating environment. To do so, they need to develop new sources of information about those risks and predictive models that incorporate them.
Very concernedNot concernedSource: IHS and Supply & Demand Chain Executive
0 20 40 60 80 100
Supplier viability/failure
Natural disaster/weather
Commodity volatility
Supply chain security threat
Geopolitical disruption
Labor/wage disturbance
Manmade disasters
Underestimating the risk of manmade disruptions?
Respondents were asked to rate their level of concern at the possibility of various 2014 global scenarios disrupting their supply chains, according to a 2013 survey of 220 supply chain professionals
30 | IHS Quarterly | Q1-2014
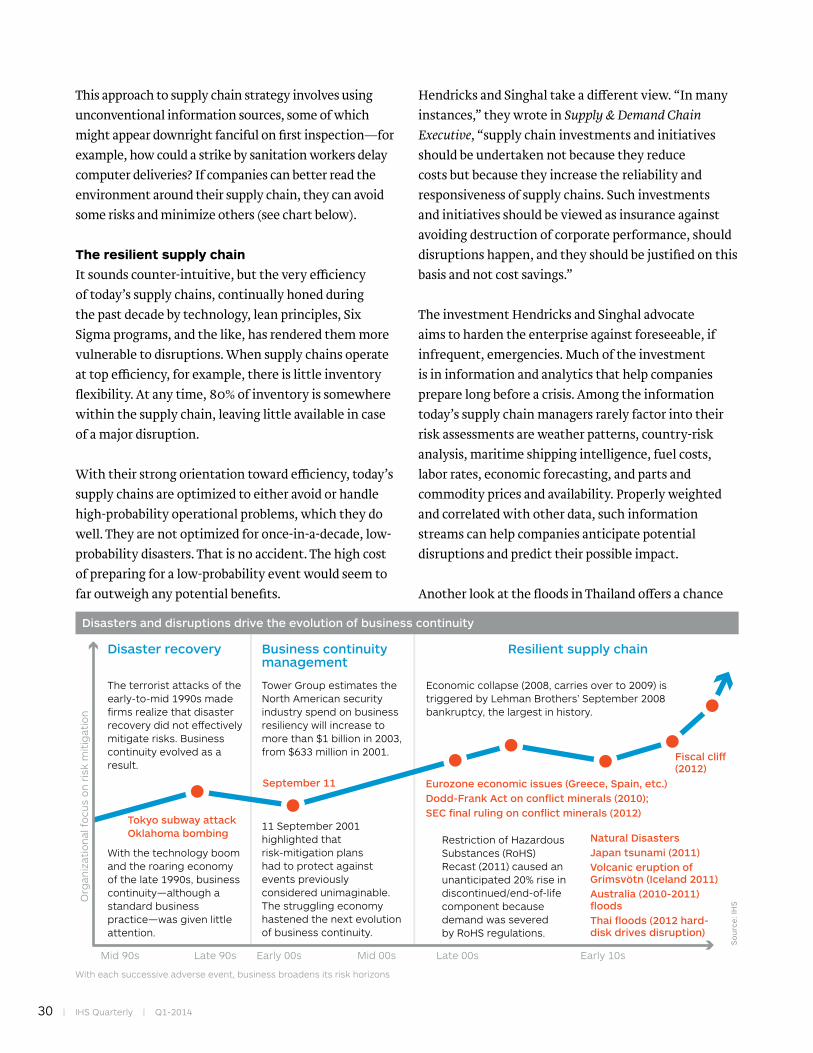
This approach to supply chain strategy involves using unconventional information sources, some of which might appear downright fanciful on first inspection—for example, how could a strike by sanitation workers delay computer deliveries? If companies can better read the environment around their supply chain, they can avoid some risks and minimize others (see chart below).
The resilient supply chain
It sounds counter-intuitive, but the very efficiency of today’s supply chains, continually honed during the past decade by technology, lean principles, Six Sigma programs, and the like, has rendered them more vulnerable to disruptions. When supply chains operate at top efficiency, for example, there is little inventory flexibility. At any time, 80% of inventory is somewhere within the supply chain, leaving little available in case of a major disruption.
With their strong orientation toward efficiency, today’s supply chains are optimized to either avoid or handle high-probability operational problems, which they do well. They are not optimized for once-in-a-decade, low-probability disasters. That is no accident. The high cost of preparing for a low-probability event would seem to far outweigh any potential benefits.
Hendricks and Singhal take a different view. “In many instances,” they wrote in Supply & Demand Chain Executive, “supply chain investments and initiatives should be undertaken not because they reduce costs but because they increase the reliability and responsiveness of supply chains. Such investments and initiatives should be viewed as insurance against avoiding destruction of corporate performance, should disruptions happen, and they should be justified on this basis and not cost savings.”
The investment Hendricks and Singhal advocate aims to harden the enterprise against foreseeable, if infrequent, emergencies. Much of the investment is in information and analytics that help companies prepare long before a crisis. Among the information today’s supply chain managers rarely factor into their risk assessments are weather patterns, country-risk analysis, maritime shipping intelligence, fuel costs, labor rates, economic forecasting, and parts and commodity prices and availability. Properly weighted and correlated with other data, such information streams can help companies anticipate potential disruptions and predict their possible impact.
Another look at the floods in Thailand offers a chance
Disasters and disruptions drive the evolution of business continuity
Org
aniz
atio
nal f
ocus
on
risk
mit
igat
ion
Mid 90s Late 90s Early 00s Mid 00s Late 00s Early 10s
So
urc
e: IH
S
The terrorist attacks of the early-to-mid 1990s made firms realize that disaster recovery did not e�ectively mitigate risks. Business continuity evolved as a result.
With the technology boom and the roaring economy of the late 1990s, business continuity—although a standard business practice—was given little attention.
Tower Group estimates the North American security industry spend on business resiliency will increase to more than $1 billion in 2003, from $633 million in 2001.
Tokyo subway attack Oklahoma bombing
Economic collapse (2008, carries over to 2009) is triggered by Lehman Brothers’ September 2008 bankruptcy, the largest in history.
Restriction of Hazardous Substances (RoHS) Recast (2011) caused an unanticipated 20% rise in discontinued/end-of-life component because demand was severed by RoHS regulations.
Eurozone economic issues (Greece, Spain, etc.)Dodd-Frank Act on conflict minerals (2010);SEC final ruling on conflict minerals (2012)
September 11
Resilient supply chainBusiness continuity management
Disaster recovery
Fiscal cli� (2012)
Natural DisastersJapan tsunami (2011)Volcanic eruption of Grímsvötn (Iceland 2011)Australia (2010-2011) floods Thai floods (2012 hard-disk drives disruption)
11 September 2001 highlighted that risk-mitigation plans had to protect against events previously considered unimaginable. The struggling economy hastened the next evolution of business continuity.
With each successive adverse event, business broadens its risk horizons
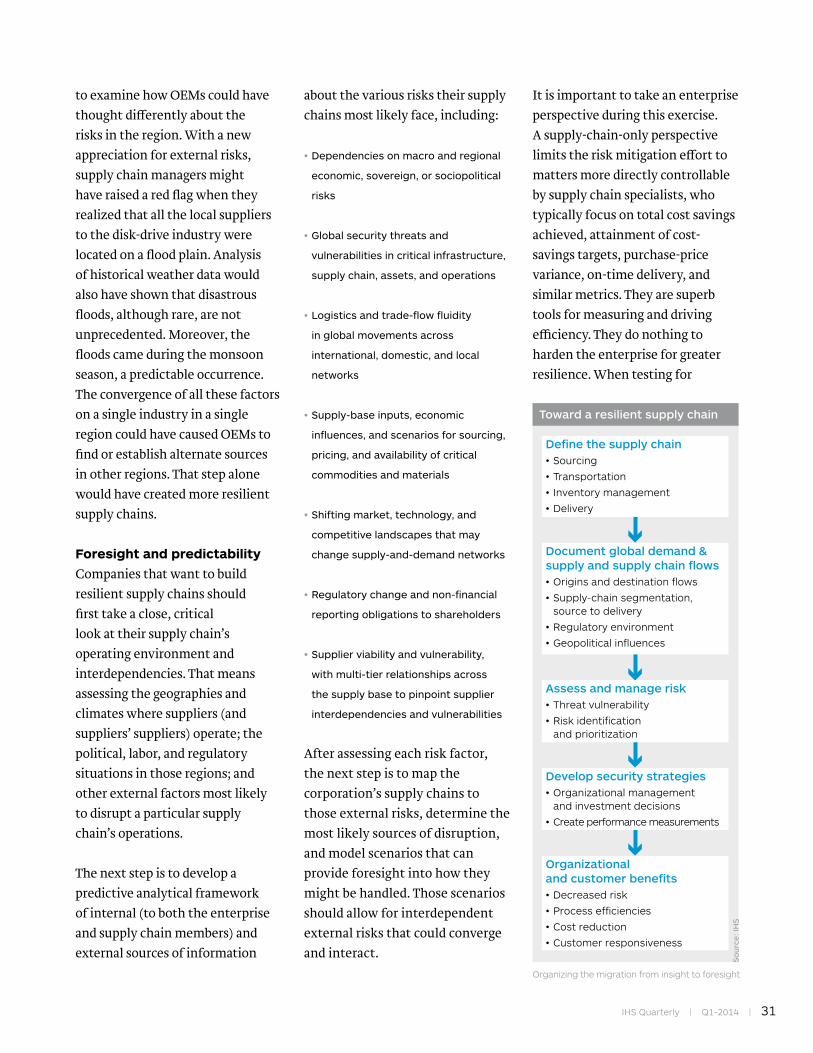
IHS Quarterly | Q1-2014 | 31
to examine how OEMs could have thought differently about the risks in the region. With a new appreciation for external risks, supply chain managers might have raised a red flag when they realized that all the local suppliers to the disk-drive industry were located on a flood plain. Analysis of historical weather data would also have shown that disastrous floods, although rare, are not unprecedented. Moreover, the floods came during the monsoon season, a predictable occurrence. The convergence of all these factors on a single industry in a single region could have caused OEMs to find or establish alternate sources in other regions. That step alone would have created more resilient supply chains.
Foresight and predictability
Companies that want to build resilient supply chains should first take a close, critical look at their supply chain’s operating environment and interdependencies. That means assessing the geographies and climates where suppliers (and suppliers’ suppliers) operate; the political, labor, and regulatory situations in those regions; and other external factors most likely to disrupt a particular supply chain’s operations.
The next step is to develop a predictive analytical framework of internal (to both the enterprise and supply chain members) and external sources of information
about the various risks their supply chains most likely face, including:
•Dependenciesonmacroandregional
economic,sovereign,orsociopolitical
risks
•Globalsecuritythreatsand
vulnerabilitiesincriticalinfrastructure,
supplychain,assets,andoperations
•Logisticsandtrade-flowfluidity
inglobalmovementsacross
international,domestic,andlocal
networks
•Supply-baseinputs,economic
influences,andscenariosforsourcing,
pricing,andavailabilityofcritical
commoditiesandmaterials
•Shiftingmarket,technology,and
competitivelandscapesthatmay
changesupply-and-demandnetworks
•Regulatorychangeandnon-financial
reportingobligationstoshareholders
•Supplierviabilityandvulnerability,
withmulti-tierrelationshipsacross
thesupplybasetopinpointsupplier
interdependenciesandvulnerabilities
After assessing each risk factor, the next step is to map the corporation’s supply chains to those external risks, determine the most likely sources of disruption, and model scenarios that can provide foresight into how they might be handled. Those scenarios should allow for interdependent external risks that could converge and interact.
It is important to take an enterprise perspective during this exercise. A supply-chain-only perspective limits the risk mitigation effort to matters more directly controllable by supply chain specialists, who typically focus on total cost savings achieved, attainment of cost-savings targets, purchase-price variance, on-time delivery, and similar metrics. They are superb tools for measuring and driving efficiency. They do nothing to harden the enterprise for greater resilience. When testing for
Toward a resilient supply chain
Define the supply chain• Sourcing
• Transportation
• Inventory management
• Delivery
Document global demand & supply and supply chain flows• Origins and destination flows
• Supply-chain segmentation, source to delivery
• Regulatory environment
• Geopolitical influences
Assess and manage risk• Threat vulnerability
• Risk identification and prioritization
Develop security strategies• Organizational management and investment decisions
• Create performance measurements
Organizational and customer benefits• Decreased risk
• Process efficiencies
• Cost reduction
• Customer responsiveness
So
urc
e: IH
S
Organizing the migration from insight to foresight

32 | IHS Quarterly | Q1-2014
The wide variety of external risks
Anydiscussionofexternalrisksshouldbeginwithnaturaldisasters.Inrecentyears,wehavelearnedrepeatedlythatsuchrisksaremoredisruptivethananythingshortofnuclearwar.In2011,theyearwasmarkedbytwonotoriousnaturaldisastersthatreverberatedthroughsupplychainsworldwide:Theearthquake-bredtsunamithatstrucknorthernJapaninMarchandthefloodsinThailand.
Justasthefloodstookahugetollondisk-driveproduction,thetsunamihadasevereeffectonproductionofatypeofhybridmemoryusedinhigh-endmanufacturingprocesses.Mostoftheplantsthatmakethememorywerelocatedwithin15kmoftheareashithardestbythetsunami.Theirrecoveryfromtheseveredamagecausedbytheensuingheavyfloodswashamperedbythedestructionoftransportationnetworksthatfeedintotheregion.
Bothincidentsunderscoretherisksinherentinthegeographicalconcentrationofsuppliers.Notonlyaretheyvulnerabletonaturaldisaster,theirconcentrationexposesthemtomanmadedisruptionssuchaspoliticalorlaborstrife.Geographicaldiversification,therefore,canmitigaterisk.
Thislessoncanbeappliedtootherregions,suchastheKoreanpeninsula.About80%ofmemorychipsforelectronicsoriginatefrommanufacturersinSouthKorea.AwarwithNorthKoreawould,obviously,disruptfarmorethanmemoryproduction.Allthesame,wherewouldOEMsturnformemory?Whataretheydoingtomakesureawarorotherdisasteronthepeninsuladoesnotstopproductionofvirtuallyeveryelectronicsproduct?Althoughthecostofmemorymanufacturingmightbemoreexpensiveelsewhere,theelectronicssupplychaincouldbenefitfrommemoryproductiondiffusion—justincase.
Laborandwagedisputesareanothermanmaderisk.Supplychainprofessionalstypicallyconsiderthewagestructureoftheirsuppliersasanaspectofcost,butitisalsoimportantforthemtoconsidertherippleeffectsoflabordisputesoutsidetheirindustry.Severalyearsago,forexample,personalcomputerdeliveriestosouthernFrancewerehaltedbecauseofastrikebygarbagehandlersinParis.Thatstrikehadnothingtodowithcomputermakersorsuppliers,exceptthattheirtransportroutesledthroughthecity,thestreetsofwhichwereimpassablebecauseofthepilesofgarbage.
Regulatorychangesareanotherexternalforcetoconsider.TheSECisrollingoutconflictmineralsregulationsmandatedundertheDodd-FrankAct.Conflictminerals—tin,tantalum,tungsten,andgold(knowncolloquiallyasthe3Ts)—arethoseminedinconditionsofarmedconflictandhuman-rightsabusesbyarmedrebelsintheDemocraticRepublicoftheCongo(amongotherplaces)tofundtheirinsurgencies.Theysellthemineralsthroughintermediariestoelectronicscompanies.Dodd-Frankrequiresaudittrailsanddisclosureofmineralorigins;similarbuttougherrulesareunderconsiderationbytheEuropeanUnion.Howwillthisnewregulatoryregimeimpactcrucialsupplies?
Hereisanotherissuetoconsider.Hydraulicfracturingtoextractoilandgastakesenormousamountsofwater.SupplychainprofessionalsshouldfactorinthepossibilityofwatershortagesormuchhigherwatercostsasaresultofdemandfromthehydraulicfracturingindustryinNorthAmerica.
Hydraulicfracturingalsoillustratesanothertypeofrisk—theriskstooneindustryduetoasurgeofnewdemandfromemergingindustries.Hydraulicfracturingwilldriveconsumptionofhigh-pressurepumpsthatmovewater.Thosepumpscontainhigh-speedprecisionballbearings.Asdemandrisesforthesepumps,industriessuchasaerospaceandheavy-vehiclemanufacturingthatalsousethebearingscouldseesuppliestightenandcostsrise.
Inshort,itisabigworldfullofrisk.Itistimetogivethatrisktheattentionitdeserves.
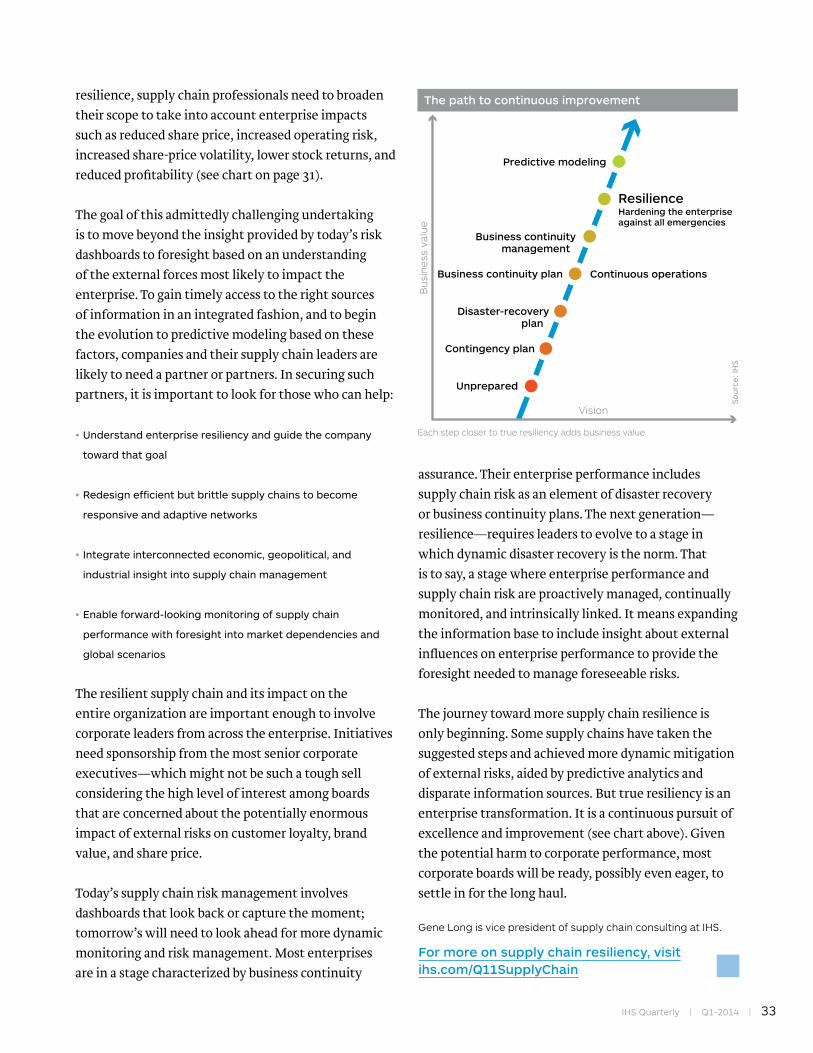
IHS Quarterly | Q1-2014 | 33
resilience, supply chain professionals need to broaden their scope to take into account enterprise impacts such as reduced share price, increased operating risk, increased share-price volatility, lower stock returns, and reduced profitability (see chart on page 31).
The goal of this admittedly challenging undertaking is to move beyond the insight provided by today’s risk dashboards to foresight based on an understanding of the external forces most likely to impact the enterprise. To gain timely access to the right sources of information in an integrated fashion, and to begin the evolution to predictive modeling based on these factors, companies and their supply chain leaders are likely to need a partner or partners. In securing such partners, it is important to look for those who can help:
•Understandenterpriseresiliencyandguidethecompany
towardthatgoal
•Redesignefficientbutbrittlesupplychainstobecome
responsiveandadaptivenetworks
•Integrateinterconnectedeconomic,geopolitical,and
industrialinsightintosupplychainmanagement
•Enableforward-lookingmonitoringofsupplychain
performancewithforesightintomarketdependenciesand
globalscenarios
The resilient supply chain and its impact on the entire organization are important enough to involve corporate leaders from across the enterprise. Initiatives need sponsorship from the most senior corporate executives—which might not be such a tough sell considering the high level of interest among boards that are concerned about the potentially enormous impact of external risks on customer loyalty, brand value, and share price.
Today’s supply chain risk management involves dashboards that look back or capture the moment; tomorrow’s will need to look ahead for more dynamic monitoring and risk management. Most enterprises are in a stage characterized by business continuity
assurance. Their enterprise performance includes supply chain risk as an element of disaster recovery or business continuity plans. The next generation—resilience—requires leaders to evolve to a stage in which dynamic disaster recovery is the norm. That is to say, a stage where enterprise performance and supply chain risk are proactively managed, continually monitored, and intrinsically linked. It means expanding the information base to include insight about external influences on enterprise performance to provide the foresight needed to manage foreseeable risks.
The journey toward more supply chain resilience is only beginning. Some supply chains have taken the suggested steps and achieved more dynamic mitigation of external risks, aided by predictive analytics and disparate information sources. But true resiliency is an enterprise transformation. It is a continuous pursuit of excellence and improvement (see chart above). Given the potential harm to corporate performance, most corporate boards will be ready, possibly even eager, to settle in for the long haul.
Gene Long is vice president of supply chain consulting at IHS.
For more on supply chain resiliency, visit ihs.com/Q11SupplyChain
Each step closer to true resiliency adds business value
The path to continuous improvement
Bus
ines
s va
lue
So
urc
e: IH
S
Vision
Continuous operations
ResilienceHardening the enterprise against all emergencies
Unprepared
Contingency plan
Disaster-recoveryplan
Business continuity plan
Business continuitymanagement
Predictive modeling
34 | IHS Quarterly | Q1-2014
So much information, and all of it hard to find
Recently, a European manufacturer was part-way through an expensive certification process required to sell a high-end piece of electrical
equipment in the United States when it discovered that the company’s American unit had already carried out the certification work two years earlier. Another company, a manufacturer of industrial cleaning products, discovered the solution to a tricky engineering challenge lay outside its own four walls, buried in supplier patents.
These two examples illustrate the two sides of the knowledge-management conundrum looming over companies today: The opposite but equal challenges of harnessing internal and external technical knowledge. Within organizations, information is locked inside email servers, individual hard drives, or discrete internal systems for product lifecycle management, document management, or other activities. Likewise, engineers are unaware of both innovations outside their own organization as well as relevant best practices from other industries and technical disciplines. They are
Industry turns to technical knowledge management to harness crucial, hard-to-find informationBy Chad Hawkinson

IHS Quarterly | Q1-2014 | 35
also unable to tap into the industry knowledge to be found in a vast array of technical reference resources.
But these examples also demonstrate that companies can address such challenges by implementing a technical knowledge-management strategy providing a “one-stop-shop” for engineering answers built on a foundation of content, technology, research tools, and process. As our two manufacturers discovered, this approach to addressing technical knowledge management can be a significant driver of both top- and bottom-line business results.
Too much information
The growing difficulties associated with accessing and leveraging technical knowledge are rooted in several ongoing trends. Start with demographics: About half the North American and European engineers in oil and gas, aerospace, defense, and other heavy industries are expected to retire during the next 10 years.
This exodus poses a recruiting and training challenge, but it is also a knowledge-management challenge. With veteran staff leaving the workforce, the remaining engineers can no longer rely on the experience of their senior colleagues to resolve recurring problems. The challenge for organizations in these “graying industries” is to ensure the remaining engineers and incoming generation of technical workers have access to all the information they require, so they can avoid repeating lessons already learned. Accessing
that information is time-consuming and tedious because traditional search technologies are ill-suited for research across the ocean of unstructured data that makes up the vast majority of R&D content.
At the same time, the technical world is awash in content that is in near-constant flux because of the pace of innovation. Standards, industry publications, technical journals, handbooks, conference proceedings, patents, websites, social media, and many other sources form a tsunami of information that threatens to overwhelm engineers who need specific answers to specific technical questions (see chart below) Finding the answer to just one engineering challenge can require information across a dozen different sources.
Although most critical technical content is now available on the internet, it is curated, managed, and published by a myriad of information providers and vendors,
each with its own user interface and often without adequate search tools to help users quickly find pertinent, accurate information. The best technical information is often protected by subscription log-ins that popular search engines cannot “see” and, as a result, engineers and other technical professionals waste countless hours logging into multiple content platforms and repeatedly entering their search strings, only to be forced to comb through long lists of links to documents that may or may not be relevant to the problem at hand. What they really need are precise answers to their specific problems.
It is little wonder that, according to a study by Outsell Inc., a leading information industry research and advisory firm, engineers in all fields spend 13% more time searching for information today than they did in 2002. And yet they still fail to find what they need. A 2011 study by consulting, software, and research company Infocentric concluded that
Searching when they should be innovating
Source: Outsell, Inc.
0 10 20 30 40 50
Engineers must wade through reams of disparate external data
to do their jobs, according to an industry survey
Standards & Specifications
Engineering Drawings
Scholarly Journals
Manufacturers' Parts Data
Other STM Information Sources
Books, Monographs & Reference Works
Chemical Information & Properties
Cartographic, Geophysical, Seismic Data
Databases
Conference Proceedings
Technical Reports & White Papers

36 | IHS Quarterly | Q1-2014
54% of engineering decisions are based on incomplete, inconsistent, and inadequate information, and according to a 2012 study by market research, analysis, and advisory firm IDC, 60% of manufacturers said they lacked the informed decision-making capabilities necessary to innovate. The financial impacts can be significant. From 1% to 2.5% of revenues are lost because of decreased productivity during the learning curve for new hires, according to investment management and investment services company BNY Mellon. In some industries, such as oil and gas, those lost revenues are higher because new engineers take several years to get up to speed, and their mistakes are costly (see sidebar on left).
As these data points suggest, corporations are struggling to connect R&D staff, engineers, and product teams to the information they need, and corporate performance is suffering as a result. Ultimately, without a solution to the knowledge management challenge, engineers will continue to waste valuable time and resources, to the detriment of company revenues and profits.
One-stop-shop for knowledge management
Fortunately, companies are learning to capture the value of information residing inside and outside their organizations by embracing a knowledge-management framework. The goal of this type of framework is to enable technical professionals to reduce time spent searching for information and increase the amount of time they spend actually using information. Such a framework comprises a mix of content, technology, research tools, and process (see chart opposite). Let us look at each of these components in turn.
On the content side, companies must ensure their knowledge workers have access to a broad, deep library of technical information, including the tribal knowledge accumulated within the company. After all, an engineer’s most trusted source of information is other engineers.
In terms of external knowledge, a comprehensive collection should include the typical handbooks and manuals one might find on an engineer’s desk, plus industry standards, technical journals, scholarly articles, and patents—all kept up to date. Engineers
Any industry in North America or Europe heavily staffed with Baby Boomers is about to encounter a brain drain. But according to T+D magazine, 44% of organizations have no knowledge transfer process in place and no plans to create one.
Without efforts to capture what senior engineers and other technical professionals know before they retire, these companies will find themselves repeating lessons learned but not recorded for future use.
A closer look at the oil and gas industry illustrates the brain drain challenges all these industries face. It is focused on recruiting, training, and developing a new generation of petro-technical professionals, and it has made capturing the knowledge of senior professionals a priority. It is also focused on the relatively younger engineering workforce in Asia and on bringing them up to speed. The Baby Boom brain drain is mainly a problem in North America and Europe. But what a problem it is.
By 2015, about 50% of American oil and gas engineers will be eligible to retire. In that year, the flow of younger petro-technical professionals into the industry will reach about 17,000, compared with about 22,000 leaving, according to Schlumberger Business Consulting (SBC). Petro-technical professionals include geologists, geophysicists, petro-physicists, and petroleum engineers with expertise in reservoirs, drilling, completion, and production.
On average, it takes a new engineer 8.2 years to gain sufficient experience to make nonstandard, original technical decisions, according to SBC’s 2012 human resources benchmark study for the oil and gas industry.
“The Value of Competent People”—by J Ford Brett, managing director of oil and gas training company PetroSkills—documents typical costly mistakes by novice engineers: Perforated wells with reduced production; increased nonproductive time in drilling operations; and less success with exploratory wells. Some of these mistakes can cost up to $500,000 each, Brett estimates.
The big crew change
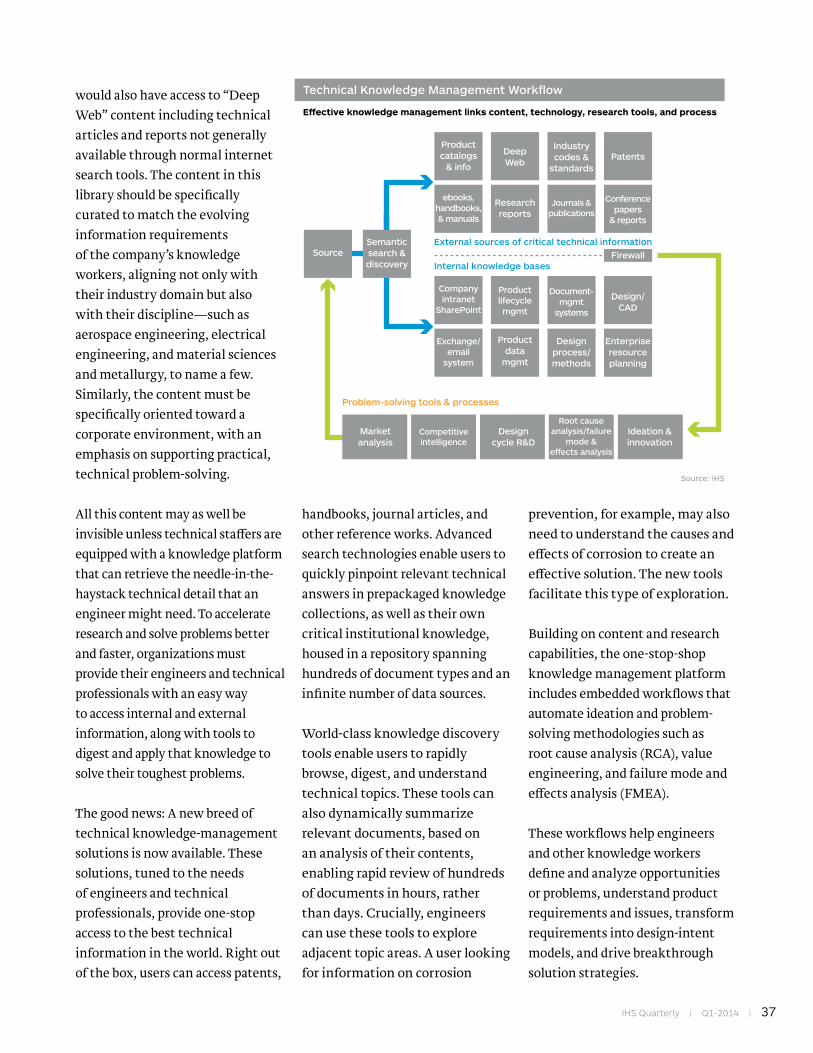
IHS Quarterly | Q1-2014 | 37
Technical Knowledge Management Workflow
E�ective knowledge management links content, technology, research tools, and process
Semanticsearch &discovery
External sources of critical technical information
Internal knowledge bases
Problem-solving tools & processes
Source
Productcatalogs
& info
ebooks,handbooks,& manuals
DeepWeb
Researchreports
Industrycodes &
standards
Journals &publications
Patents
Firewall
Conferencepapers
& reports
Companyintranet
SharePoint
Exchange/email
system
Marketanalysis
Competitiveintelligence
Designcycle R&D
Root causeanalysis/failure
mode &e�ects analysis
Ideation &innovation
Productlifecyclemgmt
Productdata
mgmt
Document-mgmt
systems
Designprocess/methods
Design/CAD
Enterpriseresourceplanning
Source: IHS
would also have access to “Deep Web” content including technical articles and reports not generally available through normal internet search tools. The content in this library should be specifically curated to match the evolving information requirements of the company’s knowledge workers, aligning not only with their industry domain but also with their discipline—such as aerospace engineering, electrical engineering, and material sciences and metallurgy, to name a few. Similarly, the content must be specifically oriented toward a corporate environment, with an emphasis on supporting practical, technical problem-solving.
All this content may as well be invisible unless technical staffers are equipped with a knowledge platform that can retrieve the needle-in-the-haystack technical detail that an engineer might need. To accelerate research and solve problems better and faster, organizations must provide their engineers and technical professionals with an easy way to access internal and external information, along with tools to digest and apply that knowledge to solve their toughest problems.
The good news: A new breed of technical knowledge-management solutions is now available. These solutions, tuned to the needs of engineers and technical professionals, provide one-stop access to the best technical information in the world. Right out of the box, users can access patents,
handbooks, journal articles, and other reference works. Advanced search technologies enable users to quickly pinpoint relevant technical answers in prepackaged knowledge collections, as well as their own critical institutional knowledge, housed in a repository spanning hundreds of document types and an infinite number of data sources.
World-class knowledge discovery tools enable users to rapidly browse, digest, and understand technical topics. These tools can also dynamically summarize relevant documents, based on an analysis of their contents, enabling rapid review of hundreds of documents in hours, rather than days. Crucially, engineers can use these tools to explore adjacent topic areas. A user looking for information on corrosion
prevention, for example, may also need to understand the causes and effects of corrosion to create an effective solution. The new tools facilitate this type of exploration.
Building on content and research capabilities, the one-stop-shop knowledge management platform includes embedded workflows that automate ideation and problem-solving methodologies such as root cause analysis (RCA), value engineering, and failure mode and effects analysis (FMEA).
These workflows help engineers and other knowledge workers define and analyze opportunities or problems, understand product requirements and issues, transform requirements into design-intent models, and drive breakthrough solution strategies.
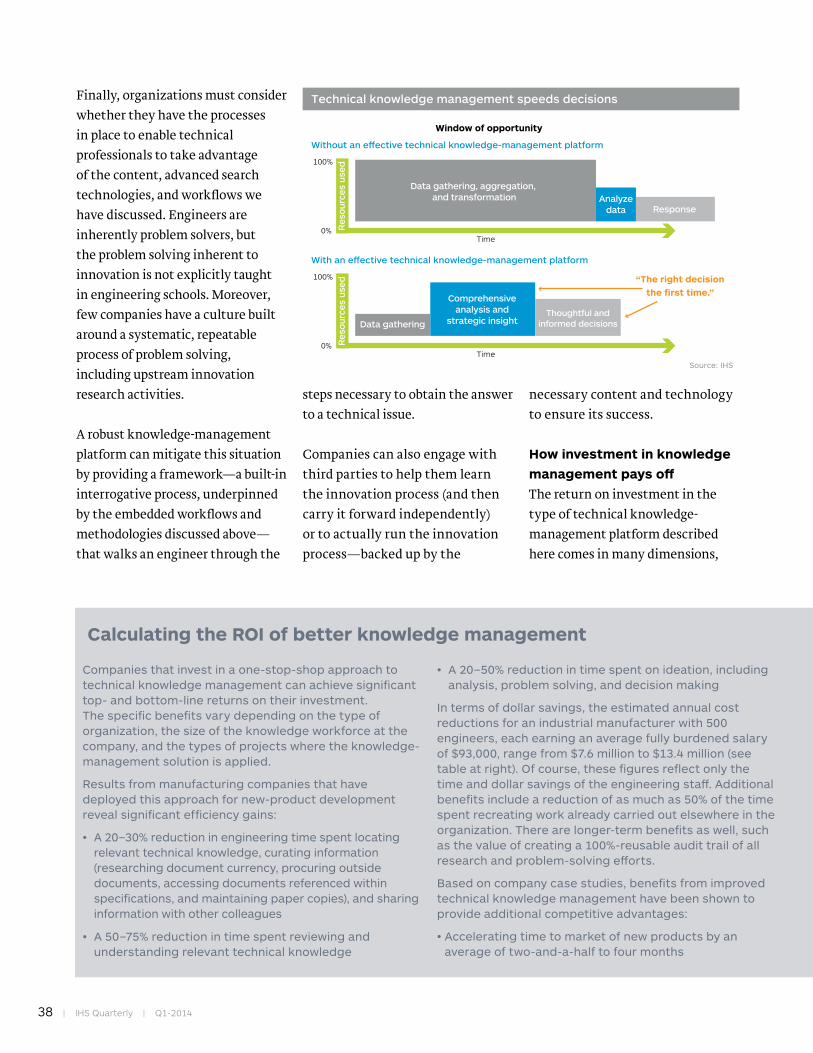
38 | IHS Quarterly | Q1-2014
Finally, organizations must consider whether they have the processes in place to enable technical professionals to take advantage of the content, advanced search technologies, and workflows we have discussed. Engineers are inherently problem solvers, but the problem solving inherent to innovation is not explicitly taught in engineering schools. Moreover, few companies have a culture built around a systematic, repeatable process of problem solving, including upstream innovation research activities.
A robust knowledge-management platform can mitigate this situation by providing a framework—a built-in interrogative process, underpinned by the embedded workflows and methodologies discussed above—that walks an engineer through the
steps necessary to obtain the answer to a technical issue.
Companies can also engage with third parties to help them learn the innovation process (and then carry it forward independently) or to actually run the innovation process—backed up by the
necessary content and technology to ensure its success.
How investment in knowledge
management pays off
The return on investment in the type of technical knowledge-management platform described here comes in many dimensions,
Technical knowledge management speeds decisions
Source: IHS
Time
Without an e�ective technical knowledge-management platform
Window of opportunity
“The right decisionthe first time.”
Analyzedata Response
Data gathering, aggregation, and transformation
100%
0% Res
ourc
es u
sed
Time
With an e�ective technical knowledge-management platform
Data gatheringThoughtful and
informed decisions
Comprehensiveanalysis and
strategic insight
100%
0% Res
ourc
es u
sed
Companies that invest in a one-stop-shop approach to technical knowledge management can achieve significant top- and bottom-line returns on their investment. The specific benefits vary depending on the type of organization, the size of the knowledge workforce at the company, and the types of projects where the knowledge-management solution is applied.
Results from manufacturing companies that have deployed this approach for new-product development reveal significant efficiency gains:
• A 20–30% reduction in engineering time spent locating relevant technical knowledge, curating information (researching document currency, procuring outside documents, accessing documents referenced within specifications, and maintaining paper copies), and sharing information with other colleagues
• A 50–75% reduction in time spent reviewing and understanding relevant technical knowledge
• A 20–50% reduction in time spent on ideation, including analysis, problem solving, and decision making
In terms of dollar savings, the estimated annual cost reductions for an industrial manufacturer with 500 engineers, each earning an average fully burdened salary of $93,000, range from $7.6 million to $13.4 million (see table at right). Of course, these figures reflect only the time and dollar savings of the engineering staff. Additional benefits include a reduction of as much as 50% of the time spent recreating work already carried out elsewhere in the organization. There are longer-term benefits as well, such as the value of creating a 100%-reusable audit trail of all research and problem-solving efforts.
Based on company case studies, benefits from improved technical knowledge management have been shown to provide additional competitive advantages:
•Acceleratingtimetomarketofnewproductsbyanaverage of two-and-a-half to four months
Calculating the ROI of better knowledge management

IHS Quarterly | Q1-2014 | 39
A costly paper chase Baseline projected savings Stretch target savings (engineers)
Activity % time spent
Hrs/wk Reduction with KMP*
Total hrs
Total/yr Reduction with KMP*
Total hrs/wk saved
Total saved p/yr for all
A 25% 10 20% 1,000 $2,325,000 30% 1,500 $3,487,500
B 15% 6 50% 1,500 $3,487,500 75% 2,250 $5,231,250
C 20% 8 20% 800 $1,860,000 50% 2,000 $4,650,000
Total 60% 24 3,300 $7,672,500 5,750 $13,368,750
A Researching, finding, curating, and providing relevant technical knowledge B Reviewing and understanding relevant technical documentsC Ideation (analysis, problem solving, and decision making)
KMP knowledge-management platform
Source: IHS
Analysis of total potential savings from deployment of a technical knowledge-management platform at an industrial manufacturer employing 500 engineers
ranging from consolidated research spending to productivity gains by engineers, to faster new product introductions to increased use of information, greater insights into market trends, and reduced risk (see the box below).
In terms of spend consolidation, a single source and price for all outside technical information reduces the cost of administering supplier relationships and eliminates the greater cost of buying information piecemeal. The right single source will also ensure every staff member has access to the latest version of standards, regulations, handbooks, and other critical technical reference works.
Reducing disparate sources of information—each with a different log-in and interface—
to one, or even a few, cuts total search time. Giving users a single source with one log-in, one entry point, one user interface, one search protocol, and one training routine—then leveraging it across dozens or hundreds of engineers—can shrink the time engineers spend looking for answers to their technical problems and increase the time they spend applying the knowledge they have acquired. The effect is to shorten design cycles, enabling companies to bring new or revised products to market faster, win more business by responding to bids quicker, and reduce iterations and unneeded redesigns ( see chart opposite).
A single source for internal and external aggregated technical information leads to higher adoption and more use of sources.
Improved access can expand the knowledge base for the entire company, giving engineers better awareness of industry trends, best practices, innovations, and cutting-edge technologies. Increased use also contributes to reducing rework and the number of design iterations. It means consistency throughout the company because engineers work with the same source of truth.
Measurable benefits also include insights into market and technology trends, an understanding of the competitive landscape, and consumer sentiment as expressed in social media and on the web. With these insights, engineers and product managers can find new markets and make smarter product roadmap decisions. Finally, closer adherence to regulatory requirements reduces liability
• A 1–5% improvement in manufacturing yield
• A two- to five-fold reduction in product/process defects and failures
• A 5–10% reduction in manufacturing costs, including materials savings, energy savings, and process improvements
• A 5–10% increase in intellectual property royalties
• Intelligence around competitors, consumer sentiment, industry and patent trends, technology trends, and more
• Better capability to strategically develop product road maps
40 | IHS Quarterly | Q1-2014
and warranty costs as well as non-compliance fines. Improved quality and compliance reduce plant or asset downtime, maintenance costs, and lost revenues or fines caused by a failure to meet supply contracts or the inability to get products to market in time.
Seizing the challenge
The factors outlined above provide a framework for how senior executives can think about the return on investment in a technical knowledge-management platform. Simply measuring the amount that any single information source has been used, as a corporate librarian might do, will fail to fully capture the value this type of platform can deliver. The fact is, a technical and engineering knowledge system will contribute to revenue, profit, and market share.
Consider the European manufacturer of big electrical equipment mentioned earlier. When it decided to enter the US market with one of its premier products, it had to certify that the equipment met various US regulatory and other standards. This required shipping two of the expensive units to the United States for testing. The company envisioned a six-month timeframe with a $5 million price tag, written off as the cost of entering a new market.
At the time it began the certification, the company installed a knowledge platform with advanced search capabilities. Once it was plugged into all enterprise sources, the European team
discovered that its US business unit had taken the electrical equipment through the certification process two years earlier. The discovery saved a few million dollars and valuable months.
Following this episode, the company embarked on an effort to roll out and use the knowledge platform broadly throughout the company to better manage knowledge-capture and use, to identify and create cross-company communities of expertise, and to create a new culture of knowledge capture and sharing.
Capturing innovations already achieved outside the company is yet another challenge. The manufacturer of industrial cleaning products mentioned earlier was overhauling its commercial detergent and sanitizer dispensers to improve performance, safety, and ease of use, and to reduce packaging waste in landfills. The manufacturer’s engineers were stymied by the dispenser’s check-valve element, which was collapsing at high back pressures. Pressed to find a solution quickly, the engineers needed to know if one existed outside the company. Using a knowledge-management platform with advanced search capabilities and problem-solving workflows, the team was able to understand the contextual aspects of the problem they were trying to solve and then research suppliers’ patents. Eventually, the engineers identified a promising check-valve technology, which led to a licensing agreement.
The company launched the industry’s first maintenance-free dispenser, which reduces user costs as much as 80% and is 100% recyclable. The dispenser has generated tens of millions of dollars in incremental revenue in its first five years on the market.
As these examples illustrate, today’s technical information and knowledge-management challenges can be turned into opportunities if companies set themselves the goal of doing so. The overall goal of knowledge management in this engineering context is to compile authoritative content that brings all the relevant industry knowledge and best practices to users’ desktops; to use advanced research capabilities to pinpoint answers within oceans of internal and external data; and to apply problem-solving tools such as RCA and FMEA to speed answers to the toughest problems in key workflows. All these efforts must be built upon a sound knowledge-management framework. Only with a solid foundation in place can companies expect to survive—and thrive—in the midst of today’s information tsunami.
Chad Hawkinson is vice president of Product Design at IHS.
For more on knowledge management and product design, visit ihs.com/Q11ProductDesign

IHS Quarterly | Q1-2014 | 41
For years, companies have been under pressure—first from regulators and sustainability-minded nongovernmental organizations and more
recently from investors, customers, and employees—to disclose ever-increasing amounts of information about their operations. What were once indices and rankings created by special-interest groups are now detailed operational reports that can serve as a bell-wether of a company’s future financial performance.
The vast majority of the largest companies in the world publicly report business sustainability information: from how much water their operations consume to supply chain stability, greenhouse gas emissions, personal- and process-safety performance, and reliability of assets. All of these non-financial data can be used as leading indicators of mid- to long-term financial performance.
A long-term investor in an asset-intensive business (a business that requires a large amount of capital to operate) would be well advised to research a company’s asset reliability, environmental performance, risk management and safe operations processes, not simply its price-to-earnings ratio and earnings per share. Downtime, accidents, and regulatory violations all threaten business productivity and impact revenue, earnings, and shareholder value.
For instance, a company’s heavy greenhouse gas emissions compared with its peers could be a sign of an organization with potential for pollution reduction. It could also signal an organization that has significant cost-reduction potential via a more concerted management focus on projects to reduce energy consumption in the long term. Unplanned downtime, whether caused by safety issues, mechanical failures, or poor supply chain planning, is likely to signal that a company will incur costly facility disruptions and expense. A concerted plan to reduce unplanned downtime holds the potential for lowering cost and boosting productivity.
Lack of such a plan can degrade enterprise value. Consider the impact on a company’s market value
The new indicators of financial successThe demand for non-financial
performance and sustainability
information is a business
imperative and an opportunity
to forge a smarter, more
competitive corporation
By J Scott Lockhart
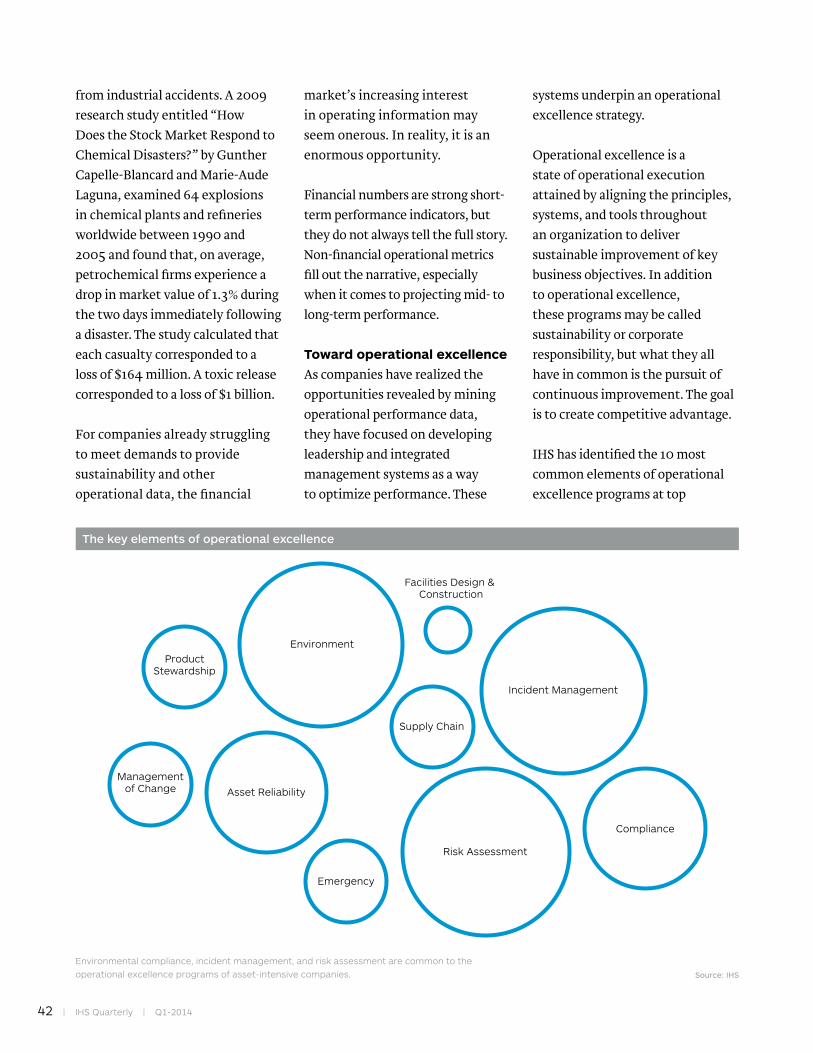
42 | IHS Quarterly | Q1-2014
from industrial accidents. A 2009 research study entitled “How Does the Stock Market Respond to Chemical Disasters?” by Gunther Capelle-Blancard and Marie-Aude Laguna, examined 64 explosions in chemical plants and refineries worldwide between 1990 and 2005 and found that, on average, petrochemical firms experience a drop in market value of 1.3% during the two days immediately following a disaster. The study calculated that each casualty corresponded to a loss of $164 million. A toxic release corresponded to a loss of $1 billion.
For companies already struggling to meet demands to provide sustainability and other operational data, the financial
market’s increasing interest in operating information may seem onerous. In reality, it is an enormous opportunity.
Financial numbers are strong short-term performance indicators, but they do not always tell the full story. Non-financial operational metrics fill out the narrative, especially when it comes to projecting mid- to long-term performance.
Toward operational excellence
As companies have realized the opportunities revealed by mining operational performance data, they have focused on developing leadership and integrated management systems as a way to optimize performance. These
systems underpin an operational excellence strategy.
Operational excellence is a state of operational execution attained by aligning the principles, systems, and tools throughout an organization to deliver sustainable improvement of key business objectives. In addition to operational excellence, these programs may be called sustainability or corporate responsibility, but what they all have in common is the pursuit of continuous improvement. The goal is to create competitive advantage.
IHS has identified the 10 most common elements of operational excellence programs at top
EnvironmentProduct
Stewardship
Managementof Change Asset Reliability
Emergency
Risk Assessment
Compliance
Incident Management
Supply Chain
Facilities Design & Construction
The key elements of operational excellence
Environmental compliance, incident management, and risk assessment are common to the operational excellence programs of asset-intensive companies. Source: IHS
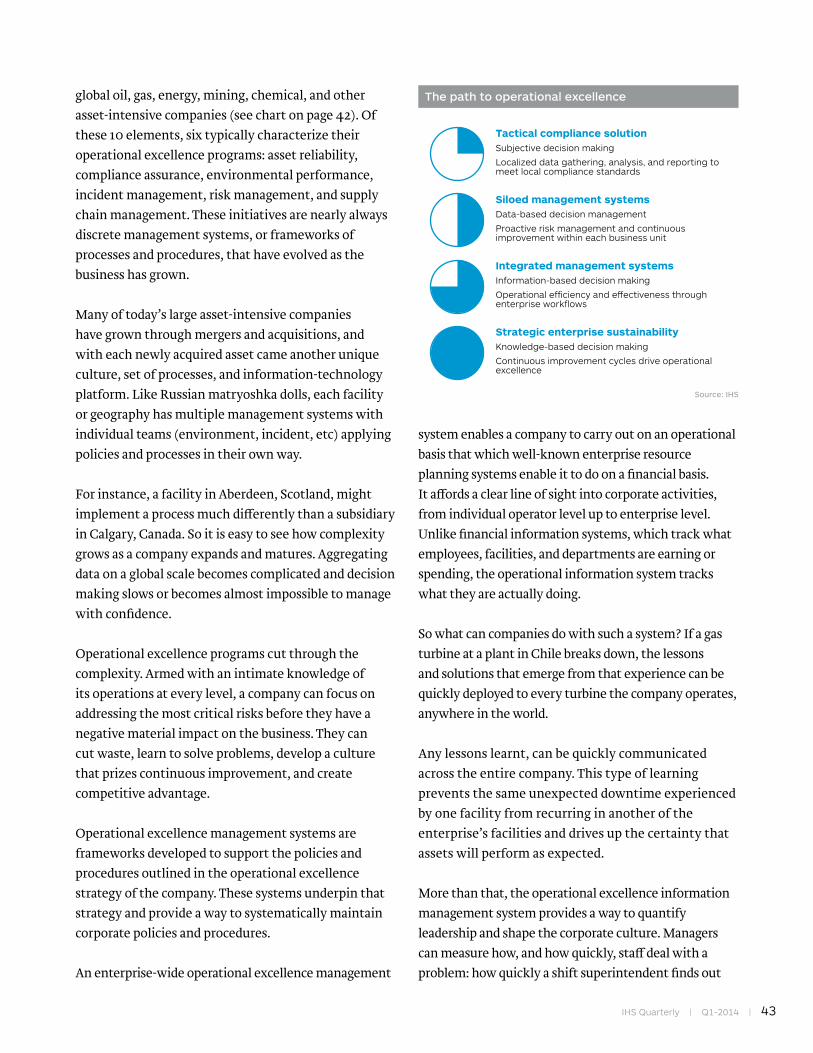
IHS Quarterly | Q1-2014 | 43
global oil, gas, energy, mining, chemical, and other asset-intensive companies (see chart on page 42). Of these 10 elements, six typically characterize their operational excellence programs: asset reliability, compliance assurance, environmental performance, incident management, risk management, and supply chain management. These initiatives are nearly always discrete management systems, or frameworks of processes and procedures, that have evolved as the business has grown.
Many of today’s large asset-intensive companies have grown through mergers and acquisitions, and with each newly acquired asset came another unique culture, set of processes, and information-technology platform. Like Russian matryoshka dolls, each facility or geography has multiple management systems with individual teams (environment, incident, etc) applying policies and processes in their own way.
For instance, a facility in Aberdeen, Scotland, might implement a process much differently than a subsidiary in Calgary, Canada. So it is easy to see how complexity grows as a company expands and matures. Aggregating data on a global scale becomes complicated and decision making slows or becomes almost impossible to manage with confidence.
Operational excellence programs cut through the complexity. Armed with an intimate knowledge of its operations at every level, a company can focus on addressing the most critical risks before they have a negative material impact on the business. They can cut waste, learn to solve problems, develop a culture that prizes continuous improvement, and create competitive advantage.
Operational excellence management systems are frameworks developed to support the policies and procedures outlined in the operational excellence strategy of the company. These systems underpin that strategy and provide a way to systematically maintain corporate policies and procedures.
An enterprise-wide operational excellence management
system enables a company to carry out on an operational basis that which well-known enterprise resource planning systems enable it to do on a financial basis. It affords a clear line of sight into corporate activities, from individual operator level up to enterprise level. Unlike financial information systems, which track what employees, facilities, and departments are earning or spending, the operational information system tracks what they are actually doing.
So what can companies do with such a system? If a gas turbine at a plant in Chile breaks down, the lessons and solutions that emerge from that experience can be quickly deployed to every turbine the company operates, anywhere in the world.
Any lessons learnt, can be quickly communicated across the entire company. This type of learning prevents the same unexpected downtime experienced by one facility from recurring in another of the enterprise’s facilities and drives up the certainty that assets will perform as expected.
More than that, the operational excellence information management system provides a way to quantify leadership and shape the corporate culture. Managers can measure how, and how quickly, staff deal with a problem: how quickly a shift superintendent finds out
The path to operational excellence
Source: IHS
Tactical compliance solutionSubjective decision making
Localized data gathering, analysis, and reporting to meet local compliance standards
Siloed management systemsData-based decision management
Proactive risk management and continuous improvement within each business unit
Integrated management systemsInformation-based decision making
Operational efficiency and e�ectiveness through enterprise workflows
Strategic enterprise sustainabilityKnowledge-based decision making
Continuous improvement cycles drive operational excellence
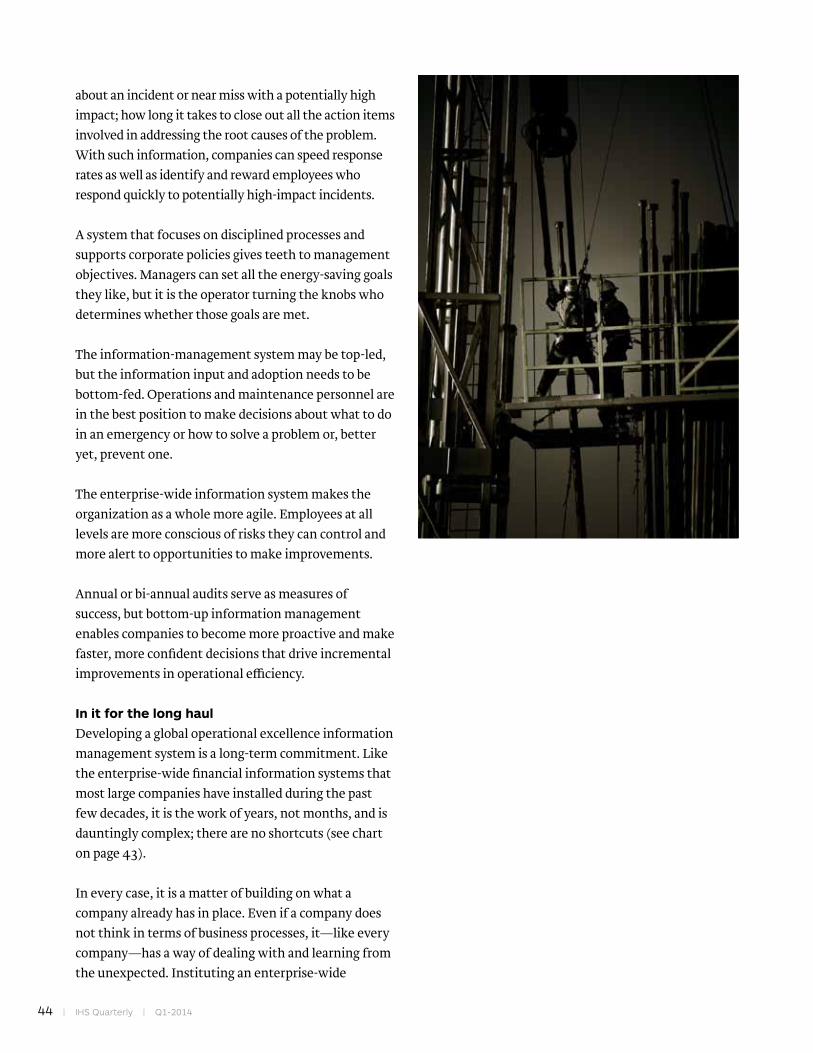
44 | IHS Quarterly | Q1-2014
about an incident or near miss with a potentially high impact; how long it takes to close out all the action items involved in addressing the root causes of the problem. With such information, companies can speed response rates as well as identify and reward employees who respond quickly to potentially high-impact incidents.
A system that focuses on disciplined processes and supports corporate policies gives teeth to management objectives. Managers can set all the energy-saving goals they like, but it is the operator turning the knobs who determines whether those goals are met.
The information-management system may be top-led, but the information input and adoption needs to be bottom-fed. Operations and maintenance personnel are in the best position to make decisions about what to do in an emergency or how to solve a problem or, better yet, prevent one.
The enterprise-wide information system makes the organization as a whole more agile. Employees at all levels are more conscious of risks they can control and more alert to opportunities to make improvements.
Annual or bi-annual audits serve as measures of success, but bottom-up information management enables companies to become more proactive and make faster, more confident decisions that drive incremental improvements in operational efficiency.
In it for the long haul
Developing a global operational excellence information management system is a long-term commitment. Like the enterprise-wide financial information systems that most large companies have installed during the past few decades, it is the work of years, not months, and is dauntingly complex; there are no shortcuts (see chart on page 43).
In every case, it is a matter of building on what a company already has in place. Even if a company does not think in terms of business processes, it—like every company—has a way of dealing with and learning from the unexpected. Instituting an enterprise-wide
IHS Quarterly | Q1-2014 | 45
information management system means expanding that effort to a global scale. Where a company starts depends on the maturity of its existing system. Most asset-intensive companies have developed information systems as management system standards have emerged: environmental performance management systems follow the ISO 14000 standard, quality follows ISO 9000, energy management follows ISO 50001, and risk management follows ISO 31000.
Although guidelines from the International Organization for Standardization and other bodies have allowed companies to standardize procedures, many information management systems have evolved from a collection of simple word-processing documents and spreadsheets that remain static and offer little insight for strategic decision making.
These tactical compliance solutions worked well when decision making was limited to one area of operations and one facility. But as sustainable operational performance improvements became more important to communicate business success to investors and customers, so did the need for a strategic enterprise-wide approach to global decision making.
As management systems evolved, companies started analyzing the aggregated data compiled across operations within each siloed operating unit—for environmental, equipment reliability, incident, supply chain, and risk assessment information—which provided management with more insight for decision making. Goal setting and investment decisions, however, were still made based on the strength of the leaders who managed the silos.
Today, companies are beginning to aggregate information and data from across multiple silos to create integrated management systems. Although corporate executives and their boards of directors are now able to compare operational performance across a variety of operational metrics, they are not yet able to prioritize the information. They may be seeing all the risks involved in the supply chain, process safety or environmental performance, but they do not yet
have the insight to determine if the supply chain, process safety or environmental performance is being managed within established tolerances across the entire enterprise. That insight requires standardization, information convergence, and data analytics to create knowledge-based systems so that management can prioritize risks and make the right investment decisions that maximize the benefit for the corporation.
A case in point is Brazil-headquartered Vale, one of the world’s largest metals and mining companies. Vale developed a comprehensive knowledge-based system for enterprise risk management that gave it a broader view of its risk profile. Its operational risk framework was designed to provide standardized policies, procedures, and guidelines for operational risk governance. Vale developed tools and techniques to translate rules into action by measuring risks, making decisions, and assigning and tracking tasks. Today, Vale’s senior executives use the risk framework to integrate and prioritize risks from across the company’s global operations. Environmental, health and safety, regulatory, social, legal, and financial risk information all converge so that Vale decision makers can focus on what is most important.
Implementing and sustaining a knowledge-based management system is the job of everyone in the corporation, from the CEO to the operator on the facility floor. Everyone must follow the same standards and use the same metrics. And everyone must share responsibility for making the system work. The demand for non-financial performance information is not going to slow. Integrated management systems are here to stay. And the companies that take advantage of such systems with the greatest discipline stand to capitalize on strategic opportunities, increased share price, customer and employee satisfaction, and accelerated growth. Getting there may be a challenge, but the payoff can be significant.
J Scott Lockhart is senior vice president of Operational Excellence and Risk Management at IHS.
For more on sustainability and operational excellence, visit ihs.com/Q11OE

46 | IHS Quarterly | Q1-2014
Water management: A new paradigm for the oil and gas sector Unconventional oil and gas exploration and production involves vast amounts of water, elevating effective water management to a key strategic concern By Marcus Oliver Gay and Andrew Slaughter
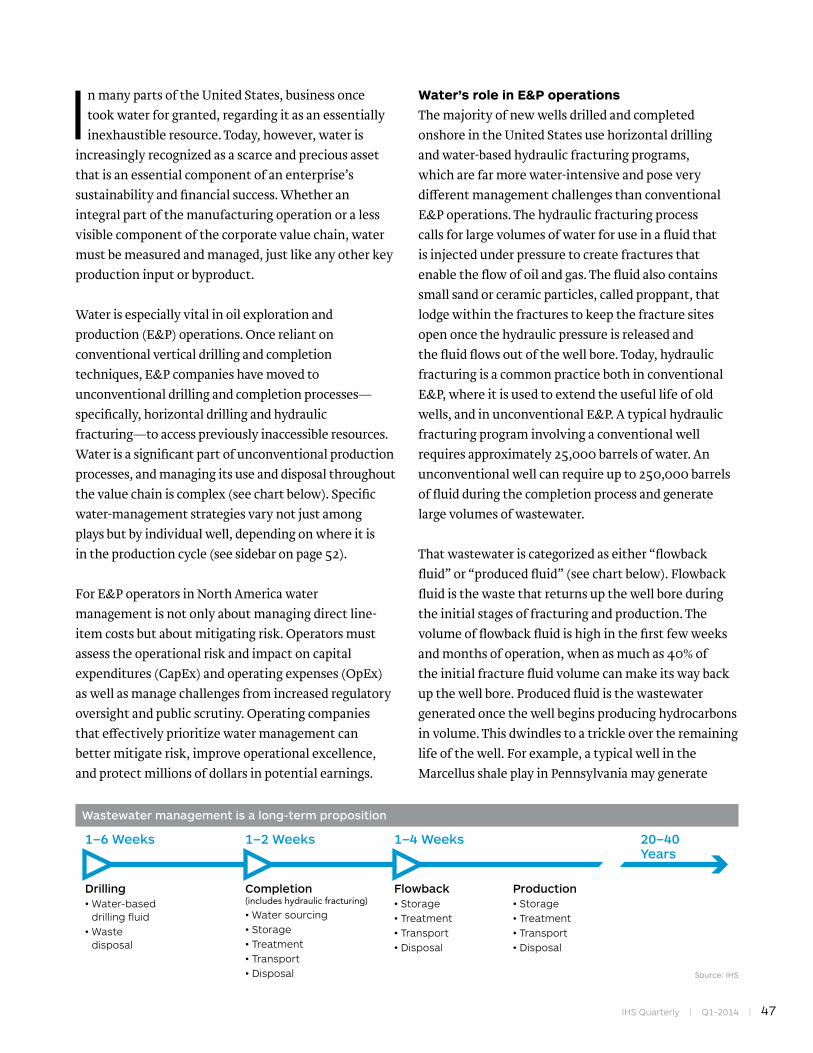
IHS Quarterly | Q1-2014 | 47
In many parts of the United States, business once took water for granted, regarding it as an essentially inexhaustible resource. Today, however, water is
increasingly recognized as a scarce and precious asset that is an essential component of an enterprise’s sustainability and financial success. Whether an integral part of the manufacturing operation or a less visible component of the corporate value chain, water must be measured and managed, just like any other key production input or byproduct.
Water is especially vital in oil exploration and production (E&P) operations. Once reliant on conventional vertical drilling and completion techniques, E&P companies have moved to unconventional drilling and completion processes—specifically, horizontal drilling and hydraulic fracturing—to access previously inaccessible resources. Water is a significant part of unconventional production processes, and managing its use and disposal throughout the value chain is complex (see chart below). Specific water-management strategies vary not just among plays but by individual well, depending on where it is in the production cycle (see sidebar on page 52).
For E&P operators in North America water management is not only about managing direct line-item costs but about mitigating risk. Operators must assess the operational risk and impact on capital expenditures (CapEx) and operating expenses (OpEx) as well as manage challenges from increased regulatory oversight and public scrutiny. Operating companies that effectively prioritize water management can better mitigate risk, improve operational excellence, and protect millions of dollars in potential earnings.
Water’s role in E&P operations
The majority of new wells drilled and completed onshore in the United States use horizontal drilling and water-based hydraulic fracturing programs, which are far more water-intensive and pose very different management challenges than conventional E&P operations. The hydraulic fracturing process calls for large volumes of water for use in a fluid that is injected under pressure to create fractures that enable the flow of oil and gas. The fluid also contains small sand or ceramic particles, called proppant, that lodge within the fractures to keep the fracture sites open once the hydraulic pressure is released and the fluid flows out of the well bore. Today, hydraulic fracturing is a common practice both in conventional E&P, where it is used to extend the useful life of old wells, and in unconventional E&P. A typical hydraulic fracturing program involving a conventional well requires approximately 25,000 barrels of water. An unconventional well can require up to 250,000 barrels of fluid during the completion process and generate large volumes of wastewater.
That wastewater is categorized as either “flowback fluid” or “produced fluid” (see chart below). Flowback fluid is the waste that returns up the well bore during the initial stages of fracturing and production. The volume of flowback fluid is high in the first few weeks and months of operation, when as much as 40% of the initial fracture fluid volume can make its way back up the well bore. Produced fluid is the wastewater generated once the well begins producing hydrocarbons in volume. This dwindles to a trickle over the remaining life of the well. For example, a typical well in the Marcellus shale play in Pennsylvania may generate
Wastewater management is a long-term proposition
20–40Years
Production• Storage• Treatment• Transport• Disposal
1–2 Weeks
Completion(includes hydraulic fracturing)• Water sourcing• Storage• Treatment• Transport• Disposal
1–4 Weeks
Flowback• Storage• Treatment• Transport• Disposal
1–6 Weeks
Drilling• Water-based
drilling fluid• Waste
disposal
Source: IHS
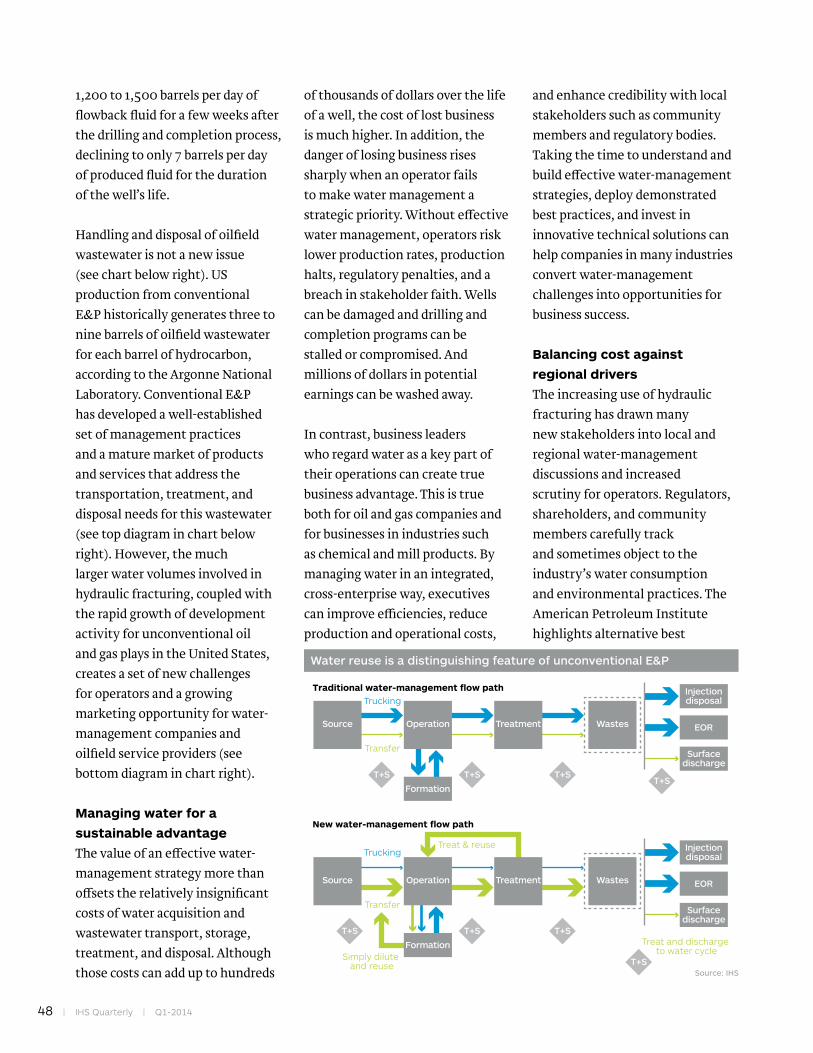
48 | IHS Quarterly | Q1-2014
1,200 to 1,500 barrels per day of flowback fluid for a few weeks after the drilling and completion process, declining to only 7 barrels per day of produced fluid for the duration of the well’s life.
Handling and disposal of oilfield wastewater is not a new issue (see chart below right). US production from conventional E&P historically generates three to nine barrels of oilfield wastewater for each barrel of hydrocarbon, according to the Argonne National Laboratory. Conventional E&P has developed a well-established set of management practices and a mature market of products and services that address the transportation, treatment, and disposal needs for this wastewater (see top diagram in chart below right). However, the much larger water volumes involved in hydraulic fracturing, coupled with the rapid growth of development activity for unconventional oil and gas plays in the United States, creates a set of new challenges for operators and a growing marketing opportunity for water-management companies and oilfield service providers (see bottom diagram in chart right).
Managing water for a
sustainable advantage
The value of an effective water-management strategy more than offsets the relatively insignificant costs of water acquisition and wastewater transport, storage, treatment, and disposal. Although those costs can add up to hundreds
of thousands of dollars over the life of a well, the cost of lost business is much higher. In addition, the danger of losing business rises sharply when an operator fails to make water management a strategic priority. Without effective water management, operators risk lower production rates, production halts, regulatory penalties, and a breach in stakeholder faith. Wells can be damaged and drilling and completion programs can be stalled or compromised. And millions of dollars in potential earnings can be washed away.
In contrast, business leaders who regard water as a key part of their operations can create true business advantage. This is true both for oil and gas companies and for businesses in industries such as chemical and mill products. By managing water in an integrated, cross-enterprise way, executives can improve efficiencies, reduce production and operational costs,
and enhance credibility with local stakeholders such as community members and regulatory bodies. Taking the time to understand and build effective water-management strategies, deploy demonstrated best practices, and invest in innovative technical solutions can help companies in many industries convert water-management challenges into opportunities for business success.
Balancing cost against
regional drivers
The increasing use of hydraulic fracturing has drawn many new stakeholders into local and regional water-management discussions and increased scrutiny for operators. Regulators, shareholders, and community members carefully track and sometimes object to the industry’s water consumption and environmental practices. The American Petroleum Institute highlights alternative best
Water reuse is a distinguishing feature of unconventional E&P
TruckingTraditional water-management flow path
New water-management flow path
Transfer
Source
Injectiondisposal
Surfacedischarge
EOR
Formation
T+S T+S T+ST+S
Operation Treatment Wastes
Trucking
Transfer
Simply dilute and reuse
Treat and discharge to water cycle
Treat & reuse
Source
Injectiondisposal
Surfacedischarge
EOR
Formation
T+S T+S T+S
T+S
Operation Treatment Wastes
Source: IHS
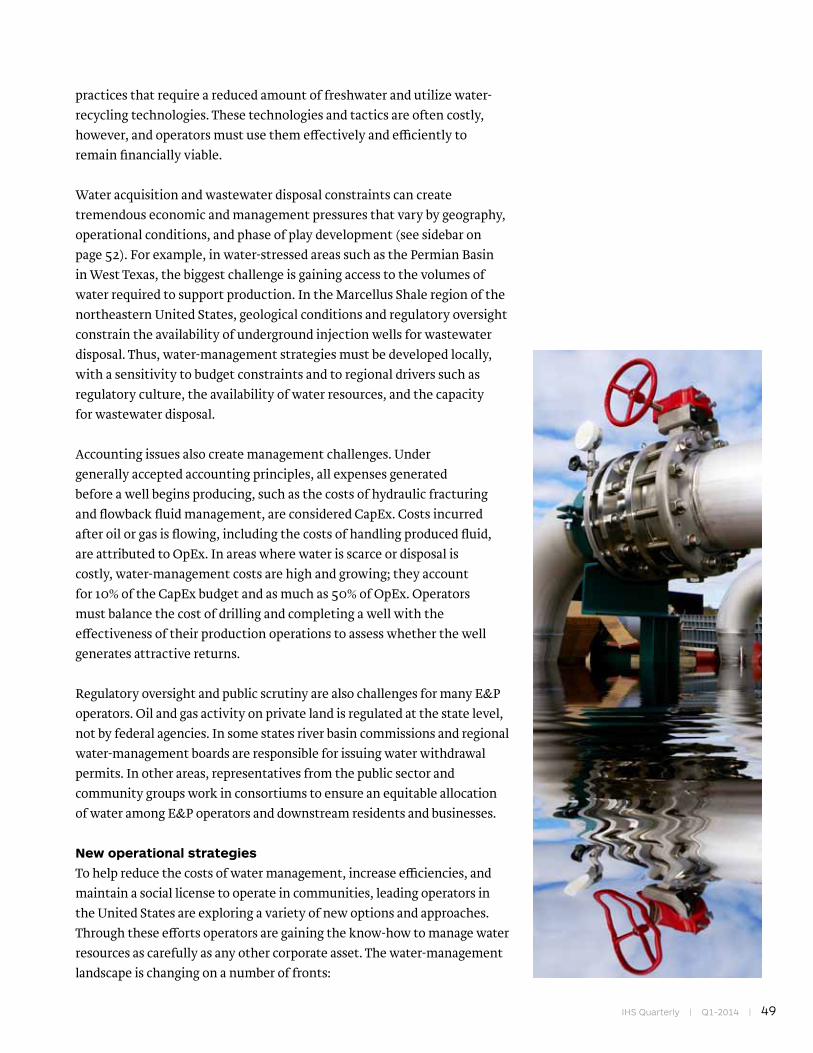
IHS Quarterly | Q1-2014 | 49
practices that require a reduced amount of freshwater and utilize water-recycling technologies. These technologies and tactics are often costly, however, and operators must use them effectively and efficiently to remain financially viable.
Water acquisition and wastewater disposal constraints can create tremendous economic and management pressures that vary by geography, operational conditions, and phase of play development (see sidebar on page 52). For example, in water-stressed areas such as the Permian Basin in West Texas, the biggest challenge is gaining access to the volumes of water required to support production. In the Marcellus Shale region of the northeastern United States, geological conditions and regulatory oversight constrain the availability of underground injection wells for wastewater disposal. Thus, water-management strategies must be developed locally, with a sensitivity to budget constraints and to regional drivers such as regulatory culture, the availability of water resources, and the capacity for wastewater disposal.
Accounting issues also create management challenges. Under generally accepted accounting principles, all expenses generated before a well begins producing, such as the costs of hydraulic fracturing and flowback fluid management, are considered CapEx. Costs incurred after oil or gas is flowing, including the costs of handling produced fluid, are attributed to OpEx. In areas where water is scarce or disposal is costly, water-management costs are high and growing; they account for 10% of the CapEx budget and as much as 50% of OpEx. Operators must balance the cost of drilling and completing a well with the effectiveness of their production operations to assess whether the well generates attractive returns.
Regulatory oversight and public scrutiny are also challenges for many E&P operators. Oil and gas activity on private land is regulated at the state level, not by federal agencies. In some states river basin commissions and regional water-management boards are responsible for issuing water withdrawal permits. In other areas, representatives from the public sector and community groups work in consortiums to ensure an equitable allocation of water among E&P operators and downstream residents and businesses.
New operational strategies
To help reduce the costs of water management, increase efficiencies, and maintain a social license to operate in communities, leading operators in the United States are exploring a variety of new options and approaches. Through these efforts operators are gaining the know-how to manage water resources as carefully as any other corporate asset. The water-management landscape is changing on a number of fronts:
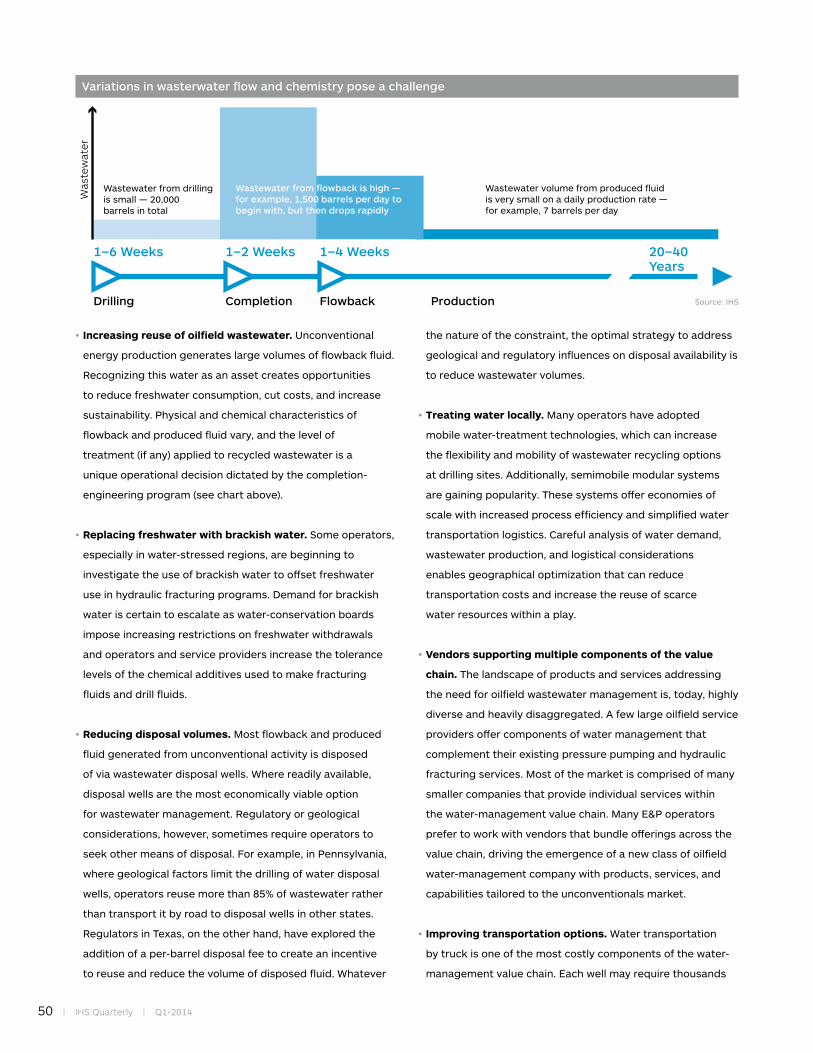
50 | IHS Quarterly | Q1-2014
•Increasing reuse of oilfield wastewater.Unconventional
energyproductiongenerateslargevolumesofflowbackfluid.
Recognizingthiswaterasanassetcreatesopportunities
toreducefreshwaterconsumption,cutcosts,andincrease
sustainability.Physicalandchemicalcharacteristicsof
flowbackandproducedfluidvary,andthelevelof
treatment(ifany)appliedtorecycledwastewaterisa
uniqueoperationaldecisiondictatedbythecompletion-
engineeringprogram(seechartabove).
•Replacing freshwater with brackish water.Someoperators,
especiallyinwater-stressedregions,arebeginningto
investigatetheuseofbrackishwatertooffsetfreshwater
useinhydraulicfracturingprograms.Demandforbrackish
wateriscertaintoescalateaswater-conservationboards
imposeincreasingrestrictionsonfreshwaterwithdrawals
andoperatorsandserviceprovidersincreasethetolerance
levelsofthechemicaladditivesusedtomakefracturing
fluidsanddrillfluids.
•Reducing disposal volumes.Mostflowbackandproduced
fluidgeneratedfromunconventionalactivityisdisposed
ofviawastewaterdisposalwells.Wherereadilyavailable,
disposalwellsarethemosteconomicallyviableoption
forwastewatermanagement.Regulatoryorgeological
considerations,however,sometimesrequireoperatorsto
seekothermeansofdisposal.Forexample,inPennsylvania,
wheregeologicalfactorslimitthedrillingofwaterdisposal
wells,operatorsreusemorethan85%ofwastewaterrather
thantransportitbyroadtodisposalwellsinotherstates.
RegulatorsinTexas,ontheotherhand,haveexploredthe
additionofaper-barreldisposalfeetocreateanincentive
toreuseandreducethevolumeofdisposedfluid.Whatever
thenatureoftheconstraint,theoptimalstrategytoaddress
geologicalandregulatoryinfluencesondisposalavailabilityis
toreducewastewatervolumes.
•Treating water locally.Manyoperatorshaveadopted
mobilewater-treatmenttechnologies,whichcanincrease
theflexibilityandmobilityofwastewaterrecyclingoptions
atdrillingsites.Additionally,semimobilemodularsystems
aregainingpopularity.Thesesystemsoffereconomiesof
scalewithincreasedprocessefficiencyandsimplifiedwater
transportationlogistics.Carefulanalysisofwaterdemand,
wastewaterproduction,andlogisticalconsiderations
enablesgeographicaloptimizationthatcanreduce
transportationcostsandincreasethereuseofscarce
waterresourceswithinaplay.
•Vendors supporting multiple components of the value
chain.Thelandscapeofproductsandservicesaddressing
theneedforoilfieldwastewatermanagementis,today,highly
diverseandheavilydisaggregated.Afewlargeoilfieldservice
providersoffercomponentsofwatermanagementthat
complementtheirexistingpressurepumpingandhydraulic
fracturingservices.Mostofthemarketiscomprisedofmany
smallercompaniesthatprovideindividualserviceswithin
thewater-managementvaluechain.ManyE&Poperators
prefertoworkwithvendorsthatbundleofferingsacrossthe
valuechain,drivingtheemergenceofanewclassofoilfield
water-managementcompanywithproducts,services,and
capabilitiestailoredtotheunconventionalsmarket.
•Improving transportation options.Watertransportation
bytruckisoneofthemostcostlycomponentsofthewater-
managementvaluechain.Eachwellmayrequirethousands
Variations in wasterwater flow and chemistry pose a challenge
20–40Years
Production
1–2 Weeks
Completion
1–4 Weeks
Flowback
1–6 Weeks
Drilling
Was
tew
ater
Source: IHS
Wastewater from drilling is small — 20,000 barrels in total
Wastewater volume from produced fluid is very small on a daily production rate —for example, 7 barrels per day
Wastewater from flowback is high — for example, 1,500 barrels per day to begin with, but then drops rapidly
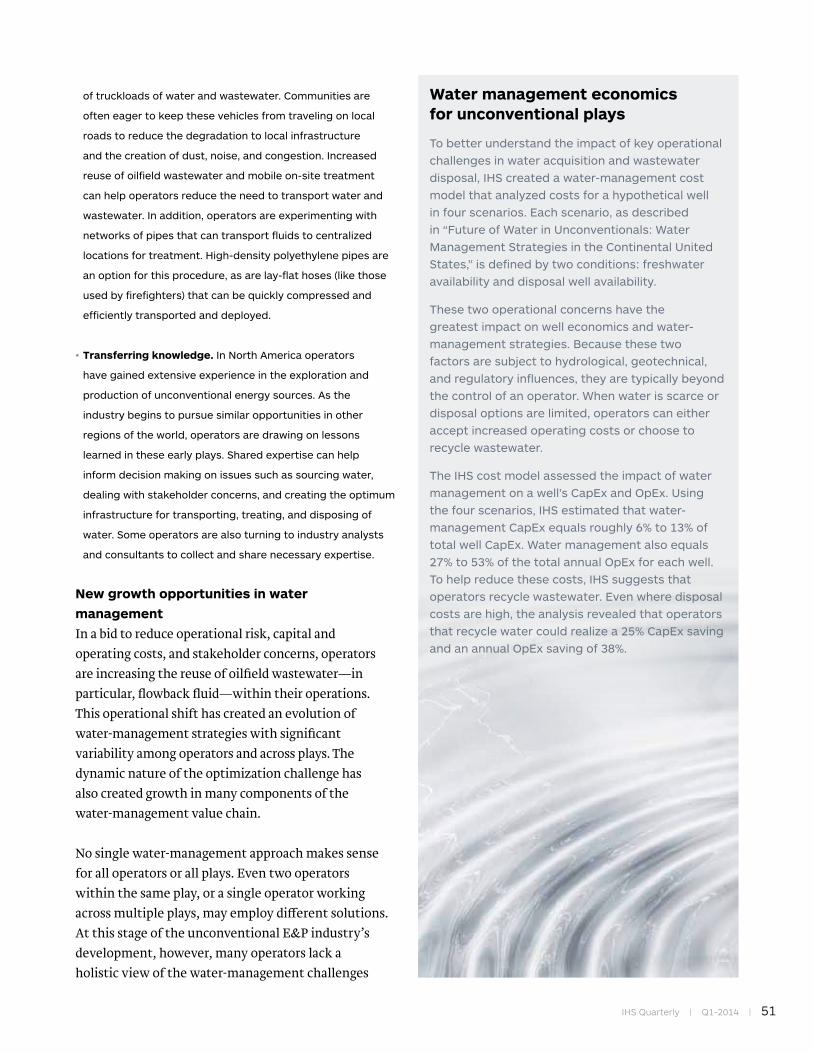
IHS Quarterly | Q1-2014 | 51
oftruckloadsofwaterandwastewater.Communitiesare
ofteneagertokeepthesevehiclesfromtravelingonlocal
roadstoreducethedegradationtolocalinfrastructure
andthecreationofdust,noise,andcongestion.Increased
reuseofoilfieldwastewaterandmobileon-sitetreatment
canhelpoperatorsreducetheneedtotransportwaterand
wastewater.Inaddition,operatorsareexperimentingwith
networksofpipesthatcantransportfluidstocentralized
locationsfortreatment.High-densitypolyethylenepipesare
anoptionforthisprocedure,asarelay-flathoses(likethose
usedbyfirefighters)thatcanbequicklycompressedand
efficientlytransportedanddeployed.
•Transferring knowledge.InNorthAmericaoperators
havegainedextensiveexperienceintheexplorationand
productionofunconventionalenergysources.Asthe
industrybeginstopursuesimilaropportunitiesinother
regionsoftheworld,operatorsaredrawingonlessons
learnedintheseearlyplays.Sharedexpertisecanhelp
informdecisionmakingonissuessuchassourcingwater,
dealingwithstakeholderconcerns,andcreatingtheoptimum
infrastructurefortransporting,treating,anddisposingof
water.Someoperatorsarealsoturningtoindustryanalysts
andconsultantstocollectandsharenecessaryexpertise.
New growth opportunities in water
management
In a bid to reduce operational risk, capital and operating costs, and stakeholder concerns, operators are increasing the reuse of oilfield wastewater—in particular, flowback fluid—within their operations. This operational shift has created an evolution of water-management strategies with significant variability among operators and across plays. The dynamic nature of the optimization challenge has also created growth in many components of the water-management value chain.
No single water-management approach makes sense for all operators or all plays. Even two operators within the same play, or a single operator working across multiple plays, may employ different solutions. At this stage of the unconventional E&P industry’s development, however, many operators lack a holistic view of the water-management challenges
Water management economics for unconventional plays
Tobetterunderstandtheimpactofkeyoperationalchallengesinwateracquisitionandwastewaterdisposal,IHScreatedawater-managementcostmodelthatanalyzedcostsforahypotheticalwellinfourscenarios.Eachscenario,asdescribedin“FutureofWaterinUnconventionals:WaterManagementStrategiesintheContinentalUnitedStates,”isdefinedbytwoconditions:freshwateravailabilityanddisposalwellavailability.
Thesetwooperationalconcernshavethegreatestimpactonwelleconomicsandwater-managementstrategies.Becausethesetwofactorsaresubjecttohydrological,geotechnical,andregulatoryinfluences,theyaretypicallybeyondthecontrolofanoperator.Whenwaterisscarceordisposaloptionsarelimited,operatorscaneitheracceptincreasedoperatingcostsorchoosetorecyclewastewater.
TheIHScostmodelassessedtheimpactofwatermanagementonawell’sCapExandOpEx.Usingthefourscenarios,IHSestimatedthatwater-managementCapExequalsroughly6%to13%oftotalwellCapEx.Watermanagementalsoequals27%to53%ofthetotalannualOpExforeachwell.Tohelpreducethesecosts,IHSsuggeststhatoperatorsrecyclewastewater.Evenwheredisposalcostsarehigh,theanalysisrevealedthatoperatorsthatrecyclewatercouldrealizea25%CapExsavingandanannualOpExsavingof38%.
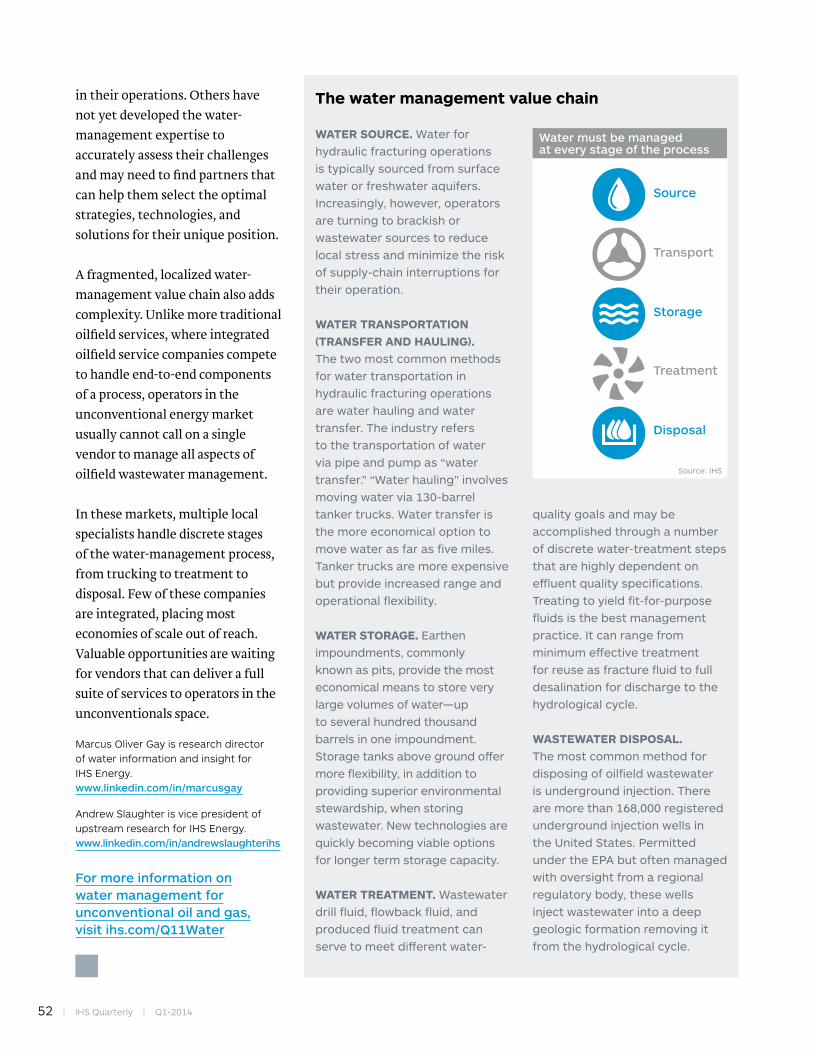
52 | IHS Quarterly | Q1-2014
in their operations. Others have not yet developed the water-management expertise to accurately assess their challenges and may need to find partners that can help them select the optimal strategies, technologies, and solutions for their unique position.
A fragmented, localized water-management value chain also adds complexity. Unlike more traditional oilfield services, where integrated oilfield service companies compete to handle end-to-end components of a process, operators in the unconventional energy market usually cannot call on a single vendor to manage all aspects of oilfield wastewater management.
In these markets, multiple local specialists handle discrete stages of the water-management process, from trucking to treatment to disposal. Few of these companies are integrated, placing most economies of scale out of reach. Valuable opportunities are waiting for vendors that can deliver a full suite of services to operators in the unconventionals space.
Marcus Oliver Gay is research director of water information and insight for IHS Energy. www.linkedin.com/in/marcusgay
Andrew Slaughter is vice president of upstream research for IHS Energy. www.linkedin.com/in/andrewslaughterihs
For more information on water management for unconventional oil and gas, visit ihs.com/Q11Water
The water management value chain
WATER souRcE.Waterforhydraulicfracturingoperationsistypicallysourcedfromsurfacewaterorfreshwateraquifers.Increasingly,however,operatorsareturningtobrackishorwastewatersourcestoreducelocalstressandminimizetheriskofsupply-chaininterruptionsfortheiroperation.
WATER TRANsPoRTATIoN (TRANsfER ANd hAulINg). Thetwomostcommonmethodsforwatertransportationinhydraulicfracturingoperationsarewaterhaulingandwatertransfer.Theindustryreferstothetransportationofwaterviapipeandpumpas“watertransfer.”“Waterhauling”involvesmovingwatervia130-barreltankertrucks.Watertransferisthemoreeconomicaloptiontomovewaterasfarasfivemiles.Tankertrucksaremoreexpensivebutprovideincreasedrangeandoperationalflexibility.
WATER sToRAgE. Earthenimpoundments,commonlyknownaspits,providethemosteconomicalmeanstostoreverylargevolumesofwater—uptoseveralhundredthousandbarrelsinoneimpoundment.Storagetanksabovegroundoffermoreflexibility,inadditiontoprovidingsuperiorenvironmentalstewardship,whenstoringwastewater.Newtechnologiesarequicklybecomingviableoptionsforlongertermstoragecapacity.
WATER TREATMENT. Wastewaterdrillfluid,flowbackfluid,andproducedfluidtreatmentcanservetomeetdifferentwater-
qualitygoalsandmaybeaccomplishedthroughanumberofdiscretewater-treatmentstepsthatarehighlydependentoneffluentqualityspecifications.Treatingtoyieldfit-for-purposefluidsisthebestmanagementpractice.Itcanrangefromminimumeffectivetreatmentforreuseasfracturefluidtofulldesalinationfordischargetothehydrologicalcycle.
WAsTEWATER dIsPosAl.Themostcommonmethodfordisposingofoilfieldwastewaterisundergroundinjection.Therearemorethan168,000registeredundergroundinjectionwellsintheUnitedStates.PermittedundertheEPAbutoftenmanagedwithoversightfromaregionalregulatorybody,thesewellsinjectwastewaterintoadeepgeologicformationremovingitfromthehydrologicalcycle.
Water must be managed at every stage of the process
Source
Transport
Disposal
Treatment
Storage
Source: IHS

IHS Quarterly | Q1-2014 | 53
numbers
No. 8
16,000,000
72.5%
metric tons of plastic resin that will be used in the electronics industry in 2017
Increase in the average number of civil unrest events within 5 km of Algerian oil and gas fields between 2012 and 2013
microsoft is expected to become the eighth-largest semiconductor buyer in 2014
2XChina’s nominal GDP will increase by $18 trillion between 2012 and 2022, which is double the $8.7 trillion projected for us GDP growth and nearly double the $9.5 trillion projected for the eu
$38BillionThe size of the projected continental
us oil field water management market in 2022
90%Amount of the world’s goods that are transported by sea
Sour
ce: I
HS

54 | IHS Quarterly | Q1-2014
spotlight
Accelerating the auto industry’s drive to Big DataSix months ago, IHS acquired R.L. Polk & Co., a worldwide leader in automotive information and analytics. It was the largest acquisition to date for IHS, which is saying something, considering the more than 30 acquisitions across a variety of industry sectors that we have made in the past four years alone.
Polk is the only source of record for vehicle registration and ownership in every major global market. Car shoppers may be more familiar with Polk’s sister company, CARFAX, which provides the vehicle history of every car in operation in the United States.
Polk is now part of IHS Automotive, which includes more than 800 automotive experts around the world as well as a vast repository of vehicle design, production, sales, and ownership data. Our analysts know what every major automaker and its suppliers are designing and will be producing during the next 5–10 years. The team is supported by the IHS Big Data & Analytics group, that includes dozens of data scientists and developers focused on developing and managing the analytical tools required to make sense of the Big Data that the industry produces every day.
With the addition of Polk, IHS Automotive is now able to connect the dots between the manufacturer’s decisions about a vehicle, from design to production to sale, and the consumer’s relationship with a vehicle, from evaluating to buying to servicing and disposing of the vehicle.
Ultimately, success in the automotive industry boils down to understanding consumer preferences over a period of years. That means sifting through mountains of complex and often unstructured data compiled from hundreds of millions of consumers and households about what car they will buy next and why, along with when and where they will buy it. That means the auto industry must forecast consumer preferences five or more years out so they align with the vehicles that are being planned today. This demands a deep and nuanced understanding of consumer behavior.
The historical cycles and trajectories of consumer automotive preferences captured in the Polk household database provide insight into consumer behaviors over many years. Connecting Polk data with more ephemeral data on consumer experience, sentiment and tastes—as well as with predictive insight about vehicles in the planning cycle—provides very granular insight into purchasing decisions of households over a period of years. The auto industry is in the early stages of leveraging the power of Big Data. IHS is focused on accelerating the process by providing a key to unlock its potential.
Edouard tavernier Senior vice president IHS Automotive
www.linkedin.com/in/edouardtavernier

Continue the conversation... Join us at an upcoming IHS Forum Business doesn’t stay neatly within industry boundaries—and today’s executives don’t work in a vacuum. They need a deep understanding of the risks and opportunities in adjacent industries as well as insight on economic and market forces around the globe that will impact their business.
IHS Forums bring together executives from related industries to gain insight, share expertise, and learn from IHS experts and other industry thought leaders. Participants explore relevant issues with depth and breadth, making crucial connections across a number of sectors.
As a global information company with world-class expertise in energy, economics, geopolitical risk, sustainability, and supply chain management, IHS is uniquely positioned to help you navigate the web of increasingly interconnected industries and economies.
April 27- 29, 2014 Dubai
May 13-15, 2014 Berlin
June 10-12, 2014 Singapore
October 28-30, 2014 Tokyo
November 11-13, 2014 Washington, DC
ihs.com/Q11Forum
Since 2006, the IHS SPECTRUM Excellence Award program has honored hundreds of companies and public agencies for their use of innovative information and insight solutions to achieve strategic business goals.
This year, the program is aligned with the IHS
Forum to showcase IHS SPECTRUM Excellence
Award winners who are achieving success
across a variety of industries including
aerospace, defense and security; automotive;
chemical; technology; metals and mining; oil
and gas; and power and utilities.
To learn about IHS SPECTRUM Excellence
Awards and the IHS Customer Recognition
Program, email [email protected]
s

Industry information and expertise…
from microchips to cargo ships
Every decision matters.
That’s why leaders rely on IHS to help them make the best choices.
As the premier provider of global market, industry and technical expertise, we understand the rigor that goes into decisions of great importance, guiding them with thinking that matches the scope of their needs.
IHS… when decisions matter